predicting parking lot occupancy using prediction...
TRANSCRIPT

PREDICTING PARKING LOT OCCUPANCY USING PREDICTION INSTRUMENT DEVELOPMENT FOR COMPLEX DOMAINS
MASTER THESIS
Predicting parking lot occupancyusing Prediction Instrument
Development for Complex Domains
hier een wit regelPublic version
hier een wit regelhier een wit regel
AuthorJoanne LijbersStudy programme Business Information TechnologyEmailJLijbersdeloittenlhier een wit regelhier een wit regelGraduation committeeSJ van der Spoel MScIndustrial Engineering and Business Information Systems University of Twente
Dr C AmritIndustrial Engineering and Business Information Systems University of Twente
DrIr M van KeulenEEMCS - Database Group University of Twente
C ten Hoope MScAnalytics and Information Management Deloitte Nederland
hier een wit regelhier een wit regel
Faculty of Electrical Engineering Mathematics and Computer ScienceUniversity of Twente
July 2016
ii
ldquoNot everything that can be counted counts and not everything that counts canbe countedrdquo
William Bruce Cameron
iii
Abstract
In predictive analytics complex domains are domains in which behaviouralcultural political and other soft factors affect prediction outcome A soft-inclusive domain analysis can be performed to capture the effects of these(domain specific) soft factors
This research assesses the use of a soft-inclusive domain analysis to de-velop a prediction instrument in a complex domain versus the use of ananalysis in which no soft factors are taken into account a soft-exclusive anal-ysis
A case study of predicting parking lot occupancy is used to test the meth-ods A regression approach is taken trying to predict the exact number ofcars in the parking lot one day ahead
Results show no significant difference in predictive performance whencomparing the developed prediction instruments Possible explanations forthis result are high predictive performance of the soft-exclusive developedpredictive model and the fact that not all soft factors identified using soft-inclusive analysis could be used in training the predictive model
v
AcknowledgementsIn your hands or on your screen you find the result of performing my finalproject at the University of Twente to graduate from the study Business In-formation Technology As my specialization track was lsquoBusiness AnalyticsrsquoI wanted to focus on this topic in my final project as well With the topicof this thesis being predictive analytics I have gained sufficient knowledgeinto the field of my studies and am eager to continue to work in and learnfrom this field after graduating
I want to thank my university supervisors Sjoerd Chintan and Mauricefor guidance during the research process the feedback and answering myquestions (from in-depth to design questions) Special thanks to Claudiamy supervisor at Deloitte for the weekly meetings Thanks for helping meout with the technical aspects of this research and for your guidance dur-ing the process Last I want to thank friends and family for the supportthroughout the past months and the good times during all the years ofstudy
Joanne LijbersAmsterdam July 2016
vii
Contents
Abstract iii
Acknowledgements v
List of Figures ix
List of Tables xi
List of Abbreviations xiii
1 Introduction 111 Introduction 112 Research Background 2
121 Case Description 213 Research Objectives 4
131 Validation Goal 4132 Prediction Goal 5
2 Methodology 721 Research Design 7
211 Research Methodology 7212 Research Questions 9
22 Thesis structure 9
3 Theoretical Background 1131 Predictive analytics 1132 Domain-driven development methods 1233 Prediction Instrument Development for Complex Domains 13
331 Preparation Stage 14332 Stage I Qualitative assumptions 14333 Stage II Predictive modelling 15334 Stage III Model convergence 15335 PID-SEDA 15
4 Soft-exclusive development 1741 Stage I Assumptions 17
411 Goal definition 17412 Literature review 18413 Data constraint 23
42 Stage II Predictive modelling 23421 Data cleaning 23422 Data selection strategies 24423 Exploratory data analysis 25424 Technique selection 27
viii
425 Evaluation validation amp model selection 2743 Stage III Model convergence 2844 Conclusion 28
5 Soft-inclusive development 2951 Preparation 29
511 Problem identification 29512 Expert selection 29
52 Stage I Assumptions 30521 Hypothesis divergence 30522 Hypothesis convergence 32523 Constraint definition 34
53 Stage II Predictive modelling 35531 Data selection amp cleaning strategies 35532 Reduction by data amp domain constraints 37533 Exploratory data analysis 37534 Technique amp parameter selection 38535 Model training 39536 Reduction by interestingness deployment amp domain
constraints 3954 Stage III Model Convergence 4055 Conclusion 40
6 Discussion 4161 Comparing models 4162 Validity 42
621 Conclusion Validity 43622 Internal Validity 43623 External Validity 45
7 Conclusion 4771 Answering Research Questions 4772 Recommendations 48
A Correlation soft-exclusive factors 51
B Performance measures - Soft-exclusive 55
C Performance measures - Soft-inclusive 57
References 59
ix
List of Figures
11 Influence of soft-factors on domain 212 PID-CD 3
21 Research Methodology 8
31 Developing amp evaluating a prediction model 13
41 Refinement literature search 2042 Exploratory data analysis 26
51 Hypotheses constructs 3352 Hypotheses after specialization 3453 Relation between traffic amp occupancy 38
xi
List of Tables
41 Performance Measures 1842 Search Terms 1943 Soft-exclusive prediction factors 2244 Significant correlations 2645 Soft-exclusive regression results 28
51 Domain experts 3052 Collected hypotheses 3253 Variable correlation 3854 Random Forest - Performance Measures 3955 Comparison of results 40
61 Performance measures selected strategies 41
71 Correlation occupancy amp appointments 49
A1 Correlation (a) 52A2 Correlation (b) 53
B1 Performance measures - Strategy 1 55B2 Performance measures - Strategy 2 55B3 Performance measures - Strategy 3 55B4 Performance measures - Strategy 4 55B5 Performance measures - Strategy 5 56B6 Performance measures - Strategy 6 56B7 Performance measures - Strategy 7 56
C1 Performance measures - Strategy 2 57C2 Performance measures - Strategy 3 57C3 Performance measures - Strategy 4 57C4 Performance measures - Strategy 5 57C5 Performance measures - Strategy 8 58C6 Performance measures - Strategy 9 58
xiii
List of Abbreviations
BI Business IntelligenceCART Classification And Regression TreesDT Decision TreeIMS Intelligence Meta-SynthesisMAE Mean Absolute ErrorMAPE Mean Absolute Percentage ErrorMLR Multiple Linear RegressionMSE Mean Square ErrorPID-CD Prediction Instrument Development
for Complex DomainsPID-SEDA Prediction Instrument Development
with Soft-Exclusive Domain AnalysisRF Random ForestRMSE Root Mean Square ErrorSVR Support Vector Regression
1
Chapter 1
Introduction
11 Introduction
Sensors and the data they collect are used in a wide variety of domainslike disaster management and intelligence analysis but also in the lsquomanu-facturing energy and resourcesrsquo-industry and the ecology sector [1] Some-times collected (sensor) data in these domains is very straightforward toanalyse for example when a sensor is used inside a machine to monitortool conditions The number of factors influencing the tool condition is lim-ited because for example only the number of usages influences tool qual-ity Prediction of failure is easy once the process is repeating itself Analy-sis of such a simple domain can be done without taking soft-factors into ac-count Soft-factors are factors like behaviour politics and strategies whichcan influence a domain and the data retrieved from a domain [2] Since nosoft-factors need to be taken into account such an analysis is referred toas soft-exclusive Van der Spoel Amrit and van Hilligersberg [2] describe asoft-exclusive analysis to be lsquodomain analysis that only takes easily quan-tifiable factors into accountrsquo
Other domains are more complex they are only partially observable prob-abilistic evolve over time and are subject to behavioural influences [3]Many factors might interact with these complex domains and not all of themmight be known When human behaviour is involved domains can almostalways be referred to as complex domains [3]
Complex domains need a different approach compared to the simplerones When analysing such a domain the influence of soft-factors likementioned above does need to be taken into account This is because fac-tors like behaviour and politics influence how a domain is represented bydata (see Figure 11) Including soft-factors into an analysis is referred to asa soft-inclusive approach Van der Spoel et al [2] developed a method to usethis soft-inclusive approach in developing predictive models This researchwill add to this topic amongst others by validating the method of Van derSpoel et al [2] Previous and related research will now be discussed as wellas current gaps in knowledge to motivate the choice of research Thereafter
2 Chapter 1 Introduction
FIGURE 11 The influence of soft-factors on a domain re-trieved from [2 p 11] A domain gets represented by datagoing through a filter which can be affected by soft-factors
from the domain
the objectives of the research are given The objectives are used as a basis indesigning the research
12 Research Background
As mentioned in the introduction this research focuses on the use of datagathered from complex domains If valuable insights need to be derivedfrom these data it is important to understand the domain to gather intel-ligence about it Domain analysis is a way to do so to learn to understandthe context in which insights are created [2] [4]
Van der Spoel et al [2] developed a method to develop prediction instru-ments which uses domain analysis see Figure 12 The method providessteps in which prediction models are created by using hypotheses obtainedfrom analysing the domain to which the prediction models apply Usinglsquointelligencersquo from people involved in this domain (the experts) the do-main can be analysed in a more thorough way than using knowledge ofthe researcher(s) alone By performing field studies or brainstorming withthese experts hypotheses on what influences the to-be-predicted systemare gathered and together with constraints are used to create predictionmodels The steps as displayed in Figure 12 are explained in more detailin Section 33
Prediction Instrument Development for Complex Domains (PID-CD)has recently been developed (see [2]) The method needs to be tested tosee how it performs in a new environment to be able to increase its valid-ity
121 Case Description
To validate PID-CD a case study of predicting parking lot occupancy isused The research uses sensor data from the parking lot of lsquoThe Edgersquo oneof the offices of Deloitte Nederland BV The building is said to be the most
12 Research Background 3
FIGURE 12 Prediction Instrument Development for Com-plex Domains as designed by Van der Spoel et al [2] The
steps are explained in more detail in Section 33
sustainable office in the world [5] Rainwater gets re-used to flush toiletsand solar panels collect all the power the building uses Besides this oneof the special features of the building is the many sensors it contains Be-cause of these special features lsquoThe Edgersquo is referred to as a smart buildingSmart buildings pursue goals that relate to energy consumption securityand the needs of users [6] At The Edge this is among other things real-ized by movement sensors which control the lights based on occupancyand by temperature sensors which control the climate at the different de-partments The data collected for these uses also get saved for the purposeof analysis and optimization Data analysis could reveal patterns that en-able more efficient use
One of the things which can be used more efficiently is the parking lot ofthe building Approximately 2500 employees are based at The Edge butonly 240 permanent parking spots are reserved for Deloitte employees Tosolve the issue of these few parking spots employees are able to park at agarage near the office Only employees to which the following rules applyget rights to park in the parking lot of The Edge
1 The Edge as main office
2 Joining the lease-program
4 Chapter 1 Introduction
3 Function-level senior manager of higher
4 Ambulant function in Audit or Consulting
Unfortunately this still leaves more people with parking rights than thereare spots available This results in both inefficient use of time when em-ployees have to search for a parking spot elsewhere as well as dissatisfiedemployees because of that
Since it affects efficiency and satisfaction of employees it is important tomaximize the use of available parking space and so to increase its effi-ciency Some employees get dissatisfied because they arrive at a full park-ing lot but other employees get dissatisfied because on quiet days whenparking spots are available they are still not allowed to park Predictingthe occupancy of the parking lot might help in resolving these problems
13 Research Objectives
The goal of the research is twofold Firstly the research is aimed at vali-dating PID-CD developed by Van der Spoel et al [2] Secondly the goalof the research is to predict the parking lot occupancy of the office lsquoTheEdgersquo in Amsterdam used by Deloitte Netherlands These goals will nowbe discussed separately
131 Validation Goal
According to Wieringa and Moralı [7] validation research needs to be doneto answer questions on the effectiveness and utility of a designed artefactWieringa and Moralı define an artefact in Information System Research tobe anything from software to hardware or more conceptual entities likemethods techniques or business processes [7] Validation can be used fortrade-off analysis lsquoDo answers change when the artefact changesrsquo as wellas for sensitivity analysis lsquoDo answers change when the context (in whichthe artefact is implemented) changesrsquo [7]
In this research the artefact is the method developed by Van der Spoel et al[2] The research is aimed at answering both validation questions The goalis to see how this method performs in a different context compared to thecontext Van der Spoel et al describe in their research which is to predictturnaround time for trucks at a container terminal [2] (sensitivity analysis)
The second validation goal is to see the change in answers when theartefact changes (trade-off analysis) This trade-off question will be an-swered by developing two prediction instruments Besides developing a
13 Research Objectives 5
prediction instrument using PID-CD a prediction instrument will be de-veloped using a soft-exclusive approach prediction instrument developmentwith soft-exclusive domain analysis (PID-SEDA) [2] This method differs fromPID-CD in the phase of collecting hypotheses and constraints as will be ex-plained in Section 33 By comparing the results of this change a trade-offcan be made between for example quality of results on one hand and effortto develop the artefact on the other hand
132 Prediction Goal
The second goal of this research is to accurately predict the occupancy ofthe parking lot of lsquoThe Edgersquo on a given day If the occupancy could bepredicted arrangements can be made in advance if it is predicted to bevery busy employees can be warned or if it is predicted to be quiet otheremployees might get access for that day
The development of applications that enable these uses is beyond the scopeof this research This research is about developing an actionable predictionmodel for the occupancy of the parking lot being a model that rsquosatisfiesboth technical concerns and business expectationsrsquo [8]
7
Chapter 2
Methodology
21 Research Design
This chapter explains how the research is conducted The methodology aswell as the research questions will be explained At the end of this chapterthe structure of the remainder of this thesis is presented
211 Research Methodology
This research is classified as Technical Action Research (TAR) TAR is lsquotheattempt to scale up a treatment to conditions of practice by actually usingit in a particular problemrsquo as defined by Wieringa and Moralı [7] WithTechnical Action Research a developed artefact is implemented in practiceto validate its design and by doing so increasing its relevance By imple-menting in practice an artefact moves from being in idealized conditionsto being an actionable artefact in the real world [9] TAR is intended tosolve improvement problems (designing and evaluating artefacts) as wellas to answer knowledge questions (resolve a lack of knowledge about someaspects in the real world) This research is classified as TAR because it an-swers knowledge questions like lsquoWhat would be the effect of applying In-telligence Meta-Synthesis (IMS) in developing a predictive instrument in acomplex systemrsquo and addresses the improvement problem of predictingthe occupancy of the parking lot of The Edge
The structure of TAR is shown in the top half of Figure 21 [7 p231] Theleft improvement problem which shows the steps in developing an arte-fact has already been conducted by Van der Spoel et al [2] This researchwill contain the steps in the dotted frame In the bottom half of Figure 21these steps are applied to this research showing the chapters in which thedifferent steps will be discussed The different stages of developing a do-main driven prediction instrument as defined in [2] are also mapped ontothe structure of TAR
8 Chapter 2 Methodology
FIGURE 21 The structure of Technical Action Researchtaken from [7] The dotted frame in the bottom shows thesteps of TAR applied to this research and the steps of PIC-
CD
22 Thesis structure 9
The Research Execution phase is performed twice first a prediction in-strument following a soft-exclusive development approach using only lit-erature is developed Second a prediction instrument is developed follow-ing the PID-CD method of Van der Spoel et al [2]
212 Research Questions
The goals of validating the domain driven prediction instrument develop-ment method and predicting parking lot occupancy translate to the follow-ing research questions and subquestions
rsquoHow does a prediction instrument developed using a soft-inclusive methodcompare to a prediction instrument developed using a soft-exclusive methodrsquo
1 What instrument for predicting parking lot occupancy results from usingrsquoprediction instrument development with soft-exclusive domain analysisrsquo
2 What instrument for predicting parking lot occupancy results from usingrsquoprediction instrument development for complex domainsrsquo
22 Thesis structure
The remainder of this thesis will be structured as follows (as can be seen inFigure 21)
Chapter 3 provides a theoretical background into the topics of rsquopredictiveanalyticsrsquo and rsquointelligence meta-synthesisrsquo Common terms and practiceswill be introduced to ease the understanding of the other chapters Thestages and steps of PID-SEDA and PID-CD are explained as well
Chapter 4 addresses the improvement problem using a soft-exclusivedevelopment method answering the first sub-question As can be seenin Figure 21 this includes problem investigation treatment design designvalidation implementation and evaluation of the design
Chapter 5 shows the results of performing the same steps but in thischapter the PID-CD method is used answering sub-question two
In chapter 6 the results of the two development methods are comparedInternal and external validity will be checked and contributions and limi-tations are described
Concluding this thesis the research questions are answered and recom-mendations for future work are given in chapter 7
11
Chapter 3
Theoretical Background
This chapter provides a theoretical background into the topics of rsquopredic-tive analyticsrsquo and rsquodomain-driven development methodsrsquo Next the stagesof Prediction Instrument Development for Complex Domains (PID-CD) [2]are explained
31 Predictive analytics
According to Waller and Fawcett [10] data science is lsquothe application ofquantitative and qualitative methods to solve relevant problems and pre-dict outcomesrsquo Besides for example database management and visualiza-tion predictive analytics form a subset of data science
Predictive analytics is the process of developing prediction models aswell as evaluating the predictive power of such models [11] A predictionmodel can be viewed as a function
y = f(X)
The output of the model is represented by y the variable to be predictedX represents the (set of) input variable(s) [12] By calculating this functionthe relationship between X and y can be modelled and used for predictingnew values of y
Training this function can be done by using a train-set of data (eg 70percent of a dataset) for which all values of X and y are known Becausethe values are known the relationship between the input- and output vari-able(s) can be determined After this a test-set (using the remaining 30 per-cent of data) only using values of X is used to test if the trained functionaccurately predicts y
The process of predictive analytics is displayed in Figure 31 When us-ing a function to predict a numerical outcome the predictive model can bereferred to as a regression model When the outcome is categorical this is re-ferred to as classification Another prediction goal is ranking which is usedto rank observations to their probability of belonging to a certain class [11
12 Chapter 3 Theoretical Background
p 23]
Linear- and Multiple Regression are the most important and single most widelyused prediction techniques [13] Besides these techniques other techniquescan be used like Support Vector Regression which can recognize subtle pat-terns in complex data sets [14] but also techniques like Decision Tree or Ran-dom Forest which can be used for both classification and regression Deci-sion Trees (DT) exist of multiple nodes at which an attribute gets comparedto a certain constant (often being a greater- or smaller than comparison)[15] Each branch represents an outcome of the comparison and tree leavesrepresent prediction values (or classes in case of classification) [12] Thelearning of a DT is simple and fast and the representation of results is in-tuitive and easy to understand [12] Random Forest (RF) is a technique thatuses multiple Decision Trees to create a prediction model According toBreiman [16] using RF results in high prediction accuracy The techniqueoften achieves the same or better prediction performance compared to asingle DT [17] The process described before and displayed in Figure 31remains the same for these techniques with the function being a decisiontree or a forest
As mentioned evaluating the predictive power of a model is the sec-ond part of predictive analytics Evaluating the accuracy of a (numerical)prediction model is done by calculating the difference (the error) betweenknown values of y and the predicted values yrsquo [12]
A prediction instrument as developed in this research is a combination ofa predictive model (the trained function) the technique used to create itits parameters a data selection amp refinement strategy and (business) con-straints (to determine whether or not the model is useful in practice) [2]
32 Domain-driven development methods
As mentioned in Section 11 developing prediction instruments gets moredifficult when dealing with complex domains Predictive models often can-not be copied from existing ones since every complex domain has its ownunique characteristics One way to develop actionable prediction modelsin such domains is to use domain-driven development methods
According to Cao and Zhang [18] domain-driven data mining aims to de-velop specific methodologies and techniques to deal with complex (busi-ness) domains When using a domain-driven approach both objective andsubjective factors can be included in a (predictive) model Waller and Fawcettstate analysis and domain knowledge cannot be separated [10] According
33 Prediction Instrument Development for Complex Domains 13
FIGURE 31 The process of developing and evaluating aprediction model A function of y gets trained using a sub-set of data This function is used to predict the goal variableof the test set The last step is evaluating the results by cal-
culating prediction error
to the authors data scientists need both a broad set of analytical skills aswell as deep domain knowledge
This domain knowledge however does not necessarily has to come fromdata scientists themselves One way of developing instruments with a domain-driven view is to use an Intelligence Meta-Synthesis (IMS) approach IMS isa method for capturing soft factors in the form of different kinds of intel-ligence like human intelligence data intelligence and domain intelligence[19] According to Gu and Tang [20] lsquometa-synthesis emphasizes the syn-thesis of collected information and knowledge of various kinds of expertsrsquoIt is a methodology in which quantitative methods are combined with qual-itative (domain) knowledge obtained by consulting domain experts
Van der Spoel et al use IMS as a basis to their soft-inclusive domainanalysis [2] The domain analysis is soft-inclusive because it besides in-cluding hard factors also takes soft domain specific factors like behaviourand culture into account Soft-exclusive domain analysis on the other handonly takes factors into account that are directly quantifiable (hard factors)
33 Prediction Instrument Development for ComplexDomains
The development method designed by Van der Spoel et al [2] is describedbelow as it is used in Chapter 5 of this thesis The steps of the methodare displayed in Figure 12 In the preparation stage the prediction goalis defined and experts are selected In stage I hypotheses and constraintsregarding the domain are collected In stage II the collected hypotheses
14 Chapter 3 Theoretical Background
are translated into datasets and the constraints are used to select the finaldatasets These datasets are used to train predictive models which need tocomply with constraints given In third stage final predictive models arechosen These steps are discussed more elaborately below
331 Preparation Stage
As displayed in Figure 12 before hypotheses are collected preparationsneed to be taken lsquoWhat needs to be predictedrsquo (the prediction goal) andlsquowhat are characteristics of the problem domainrsquo are questions that are an-swered during this preparation stage [2] Another part of the preparationstage is to determine the experts who will be consulted later in the process
332 Stage I Qualitative assumptions
In the first core stage of the development method hypotheses are collectedand constraints are defined Hypotheses are collected through brainstorm-ing individual interviews field studies andor literature review [2] Brain-storming might have to be done anonymously to ensure conflicting inter-ests do not affect the results of the brainstorm
After hypotheses are collected the number of hypotheses is reduced toavoid having to test similar hypotheses Selections are made by looking atthe level of agreement Only those hypotheses that are sufficiently differentand interesting are taken into account in the development stage Mergingthe hypotheses into one set T for testing is done by following the next steps
1 Translate the hypotheses collected into diagrams showing the factors(constructs) and their relations
2 Standardize and specialize the constructs (synonymous factors are re-placed by one synonym constructs are possibly replaced by their sub-construct)
3 Determine causal influence of constructs and group the hypotheses tothe same causal influence One hypothesis per group gets added tothe set of hypotheses to be tested lsquoTrsquo
The last part of the first stage is to define constraints Through consult-ing experts domain constraints are collected which regard to data deploy-ment and interestingness Domain constraints origin from the domain theprediction instrument is being developed for for example having to com-ply with privacy standards Data constraints are constraints on structurequantity and quality of data Whether or not a prediction instrument can
33 Prediction Instrument Development for Complex Domains 15
actually be used in existing technological infrastructures relates to deploy-ment constraints Finally the interestingness constraint relates to the perfor-mance of the instrument
333 Stage II Predictive modelling
Once the hypotheses set is completed prediction models are created Thehypotheses are translated into available variables for learning the modelsAfter this selection of data the data might need to be cleaned before usage(for example delete outlier rows) Through exploratory data analysis andconsulting the experts it can be checked which selection- amp cleaning strate-gies need to be applied Next the different selection amp cleaning strategiesare reduced by checking compliance with the data and domain constraintscollected in stage I After that prediction methods and parameters (like sizeof the trainingtest set) are selected For every strategy and every predic-tion method selected predictive models are trained and evaluated usingcalculated performance measures Based on the interestingness deploy-ment amp domain constraints models that do not meet the constraints arediscarded
334 Stage III Model convergence
The final stage of the method is to select (a) predictive model(s) Domainexperts are consulted to make this selection Selection is done based on pre-dictive performance but also factors like training time or personal pref-erences can be taken into consideration If a model gets selected it willtogether with the data selection amp cleaning strategy prediction method pa-rameters and constraints form the developed prediction instrument
335 PID-SEDA
As explained besides using PID-CD Prediction Instrument Developmentwith Soft-Exclusive Domain Analysis (PID-SEDA) will be used to serve asa benchmark method Using this method represents using a soft-exclusiveapproach in analysing a complex domain Almost no knowledge of the do-main is used for selecting factors or algorithms By comparing its results tothe results of using PID-CD the effect of including soft-factors in analysinga complex domain is researched
PID-SEDA is the soft-exclusive development method which is used inChapter 4 The method differs from PID-CD by collecting hypotheses onlythrough conducting a literature review The predictive modelling stage issimilar to the one in PID-CD except no domain deployment and interest-ingness constraints need to be met At the end of th (iterative) process thebest predictive model is chosen based on predictive power [2]
17
Chapter 4
Soft-exclusive development
This chapter displays the results of using the soft-exclusive developmentmethod (PID-SEDA) to develop a prediction instrument for predicting park-ing lot occupancy in The Edge The different stages of the method as wellas the final prediction instrument developed are presented below
41 Stage I Assumptions
The first stage of the soft-exclusive development model focuses on gather-ing assumptions on how to predict parking lot occupancy The predictiongoal is determined and a structured literature review is performed to seewhich factors are mentioned in existing literature Concluding this stage adescription of available data is given
411 Goal definition
The prediction goal is to predict the occupancy of the parking lot of TheEdge Occupancy is the number of (Deloitte) cars that are currently in theparking lot Different time windows are tested predicting occupancy halfan hour in advance predicting two hours in advance and predicting theevening before the predicted moments Output (occupancy) will be part ofa wide range of possible continues values (appr 0-250 cars) Therefore aregression approach is taken trying to predict the exact number of cars inthe parking lot (referred to as a prediction goal [11 p 23])
The performance of the model(s) is determined by calculating the meansquare error (MSE) the root mean square error (RMSE) and the mean abso-lute error (MAE) See Table 41 for a description of these methods The MSERMSE and MAE are scale-dependent measures useful when comparingdifferent methods applied to the same dataset [21] These measures will beused to select the best soft-exclusive developed prediction model the lowerthe error the better the model MAE will be treated as the most relevantmeasure since it is the most natural and unambiguous measure of averageerror [22] Another often used performance measure is the mean absolute
18 Chapter 4 Soft-exclusive development
TABLE 41 Performance Measures
Measures Formulas
Mean squared error MSE =1
n
nsumt=1
e2t
Root mean squared error RMSE =
radicradicradicradic 1
n
nsumt=1
e2t
Mean absolute error MAE =1
n
nsumt=1
|et|
Mean absolute percentage error MAPE =100
n
nsumt=1
∣∣∣∣etyt∣∣∣∣
n = the number of prediction values et = prediction error the difference betweenthe tth prediction and the tth actual value yt = the tth actual value
percentage error (MAPE) (see Table 41) which can be used to compare pre-diction performance across different data sets [21] This measure cannot beused in this case since the actual data frequently contains zeros (for exampleoccupancy at night) resulting in an infinite MAPE
412 Literature review
To select factors from existing literature a structured review described byWebster and Watson [23] is conducted Criteria for inclusion andor exclu-sion are defined fields of research are determined appropriate sources areselected and specific search terms are defined After the search the resultsare refined by language title abstract and full text Forward and backwardcitations are used to search for new relevant articles until no new articlescome up [23] These steps are described in detail below
Inclusionexclusion criteria
To ensure the relevance of the selected articles inclusion and exclusion cri-teria are determined Articles should mention the topic of parking or any-thing synonymous Real time near real time and non-real time predictionsare all included trying to collect as much hypotheses as possible Articlesthat do not use empirical data are excluded since we try to find articleswhich test factors influencing parking lot occupancy
Fields of research
No limits on fields of research will be set since non-related articles will befiltered out in the refine-steps
41 Stage I Assumptions 19
TABLE 42 Search Terms
Prediction terms Synonyms Prediction goals
Predicting Parking lot OccupancyPrediction Parking space Availability
Parking areaParking spotLay-byGarageParking
Sources
The sources used for the search are Google Scholar and Scopus Accord-ing to Moed Bar-Ilan and Halevi [24] both of these databases cover a setof core sources in the field of study Although Scopus is a good source forfinding published articles Google Scholar can add to a search by also show-ing lsquointermediary stages of the publication processrsquo [24] Using these bothdatabases can therefore provide a surround search
Search
Table 42 displays the specific search terms that are used for the literaturesearch Besides lsquooccupancyrsquo as a prediction goal also lsquoavailabilityrsquo is usedsince predicting occupancy can also be done by predicting the availablespots left In the middle synonyms for lsquoparking lotrsquo are given Using dif-ferent synonyms in the literature search will limit the impact of use of lan-guage
All possible combinations of these terms synonyms and goals are usedin the search resulting in a total of 461 articles (354 from Google Scholar107 from Scopus)
Refine sample
The results are refined using the following steps
1 Filter out doubles
2 Filter by language
3 Refine by title
4 Refine by abstract
5 Refine by full text
20 Chapter 4 Soft-exclusive development
FIGURE 41 Filter amp refinement steps of the structured lit-erature review n is the number of articles remaining after
the refinement step before
41 Stage I Assumptions 21
Figure 41 displays the refinement of the search results The search resultscontained 79 doubles because two different sources were used Seven arti-cles were removed because they were not written in English Articles witha title that did not mention rsquoparkingrsquo (or related terms) were removed Theabstracts of the remaining 85 articles were read Articles that do not seem tocontribute to the purpose of predicting parking lot occupancy are removedThe remaining 35 articles were read leaving nine relevant articles
Forward amp backwards citations
The nine selected articles were cited by and referred to 147 articles in totalThe same refining steps as above were applied resulting two new articlesThese two new articles contained two new citations which were removedfrom the list after reading the abstractThis structured review resulted in eleven articles useful for selecting vari-ables in the soft-exclusive development method
Analysis
The final factors which will be used in the prediction model derived fromthe eleven articles can be found in a concept matrix as recommended byWebster and Watson [23] see Table 43
The factor time of day is mentioned in most articles The occupancy of aparking garage might for example be higher during business hours andlow during the night or vice versa if it is a residential garage
The second factor derived from literature is day of week Whether it is aworking day or a non-working day (like in the weekend) might influenceoccupancy
Weather is the third factor displayed in Table 44 mentioned in threedifferent articles Weather conditions might influence peoplersquos choice to goby car or not
Holidays also is a straightforward factor derived from literature Whetheror not it is a holiday eg like Christmas likely influences the occupancy ofa parking garage
A factor mentioned only by David Overkamp and Scheuerer [28] is theeffect of a day being a day between holiday and weekend A lot of people takeor have to take a day off on such days possibly resulting in an effect on theparking lot occupancy
Where Chen et al [29] and Reinstadler et al [30] only mention normalholidays as an influential factor David et al also mention the influence ofschool-holidays [28]
22 Chapter 4 Soft-exclusive development
TABLE 43 Soft-exclusive prediction factors
Articles Concepts
Time of day Day of week Events Weather Holidays
Chen (2014) X X XChen et al (2013) X XDavid et al (2000) X X X XFabusuyi et al (2014) X X X XKunjithapatham et al (nd) X XMcGuiness and McNeil (1991)Richter et al (2014) XReinstadler et al (2013) X X X XSoler (2015) X XVlahogianni et al (2014) X X XZheng et al (2015) X X
Articles Concepts
Historic occupancyDay betweenholiday andweekend
School holidaysParking lotaccessibility
Parking price
Chen (2014) XChen et al (2013)David et al (2000) X XFabusuyi et al (2014)Kunjithapatham et al (nd)McGuiness and McNeil (1991) XRichter et al (2014)Reinstadler et al (2013)Soler (2015)Vlahogianni et al (2014) XZheng et al (2015) X
The seventh factor derived from literature is historic occupancy This fac-tor mentioned by Zheng Rajasegarar and Leckie [31] and Vlahogianni etal [32] means using the occupancy of some points in time before the timeof prediction as input to the model The researchers use the occupancy of nsteps before time of prediction to predict occupancy k steps ahead Zhenget al for example use the previous observation when working with a re-gression tree and the previous 5 observations when working with neuralnetworks to predict 1 to 20 steps ahead [31] Vlahogianni et al use a lookback window of 5 steps to predict 1 to 60 steps ahead [32] The goal ofincluding this factor is to represent the temporal characteristics of trans-portation time series (eg parking occupancy) in a manner resembling thecommon statistical prediction techniques [32]
The influence of events is described in four different articles For exam-ple when located near a theatre as described by Fabusuyi et al [33] dataon theatre performances can be a great predictor of parking lot occupancy
Parking lot accessibility shows whether or not a parking lot is easily acces-sible Road constructions or detours nearby might influence the occupancyof the garage
Only mentioned by Chen [35] is the final factor rsquoparking pricersquo Increasingor decreasing parking price might influence parking occupancy
42 Stage II Predictive modelling 23
413 Data constraint
After collecting these hypotheses data is checked on availability is cleanedand is transformed into a dataset ready for training a prediction model(stage II) A data constraint as described below states the quality and quan-tity of data [2]
The original dataset used for this research is collected from the parking lotof The Edge between November 17 2014 and April 15 2016 A row of datais given per car entering the parking lot showing row-ID entry time exittime subscription type license plate and country code
Data on occupancy is not available and has to be calculated based on thenumber of cars going in and out Only 49897 from the 176997 rows of theoriginal dataset contain the date and time a car left the parking lot Reasonsfor these empty rows are for example the gate of the parking lot not closingafter each car resulting in not scanning all cars leaving the parking lot
42 Stage II Predictive modelling
As mentioned above stage II of the development method takes the factorsderived from literature (see Table 43) to create predictive models In thisstage the data cleaning step is described data selection strategies are de-scribed an exploratory analysis will be performed and the predictive mod-els will be evaluated
421 Data cleaning
It is chosen to impute the 127100 missing values mentioned in Section413 instead of using only the plusmn 50000 complete rows because these com-plete rows are obtained only in the first half year after opening the parkinglot The first few weeks after opening employees still were in the processof moving to the building and getting used to parking at The Edge Us-ing these weeks in data of only half a year might negatively influence theprediction model Besides this using only half a year of data excludes thepossible influence of holidays school-holidays etcetera Using the wholedataset with imputing missing values should result in learning a more ro-bust prediction model
Imputation is done by using one of the most frequently used imputa-tion methods mean imputation [36] Using the available data averages arecalculated to replace the missing values Using the complete rows an av-erage parking stay is calculated for every hour of every different day Themissing values are replaced based on the entry times of the car adding theaverage parking-stay time for that time of arrival leaving a new calculated
24 Chapter 4 Soft-exclusive development
exit time With these entry and exit times completed the occupancy of theparking lot is calculated for every half hour of the day (from November 172014 to April 15 2016 this makes 24765 rows of data)
Because the average stay is used in calculating the occupancy the cal-culated number of cars inside the parking lot sometimes (24 of values)exceeds the maximum number of parking spots In the parking lot 240spots are reserved for Deloitte the dataset created contains 594 rows withan occupancy exceeding this number To reduce noise these rows are re-moved from the dataset
The factors time of day day of week and historic occupancy also are retrievedfrom this transformed dataset
Weather data is retrieved from the Royal Netherlands Meteorological In-stitute [37] Data on (school)holidays and days between holiday and weekend areretrieved from Schoolvakanties-Nederland [38]
No (open) datasets are available on the factors events and parking lot ac-cessibility no historic information on road constructions or detours can befound and possible events in The Edge are not centrally registered There-fore these two factors can not be used in the final dataset (and predictivemodel)
The factor parking price technically could be integrated to the final datasetbut since parking price is zero at all times (resulting in no predictive power)the factor is ignored
The original dataset contained one row for every car entering andor leav-ing the parking lot After the above mentioned cleaning- and transforma-tion steps the final dataset contains one row per half an hour (Novem-ber 17 2014 - April 15 2016) with the associated variables (occupancyweather holidays etc)
422 Data selection strategies
Different data selection strategies are defined based on the use of the factorhistoric occupancy
Vlahogianni et al and Zheng et al include previous observations in theirprediction models [31] [32] Although these researches predict occupancyin a more real-time manner (1 to 60 minutes ahead) the effects of includingthis factor are researched here The referred articles use 1 and 5 observa-tions depending on the modelling technique Both uses including 1 or 5observations are tested to see which time window works best with whichtechnique For the prediction goal of predicting the evening before pre-dictions are made as being one day ahead (48-steps ahead prediction) By
42 Stage II Predictive modelling 25
doing so predictions still can be checked the evening before but data onmore similar time frames will be taken into account For this predictiongoal both strategies of using the previous 1 and 5 observations are testedas well as including data on observations of the previous 5 days This isbecause the goal is to add memory structures that retain the effect of pastinformation to the system and use it during learning [32] While the short-term predictions incorporate the memory structures of that particular dayincluding information on the past 5 days might be a better memory struc-ture for the non-near real time predictions
The different strategies therefore are
1 1-steps ahead occupancy - including 1 time frame
2 1-steps ahead occupancy - including 5 time frames
3 4-steps ahead occupancy - including 1 time frame
4 4-steps ahead occupancy - including 5 time frames
5 48-steps ahead occupancy - including 1 time frame
6 48-steps ahead occupancy - including 5 time frames
7 48-steps ahead occupancy - including occupancy at prediction timeup to 5 days before
All strategies also include the other factors which resulted from the litera-ture review
423 Exploratory data analysis
Figure 42 displays the average number of cars in the parking lot for everyhour per day of the week Looking at the graph time of day and day of weekseem to be important independent variables For example office hoursresult in high occupancy weekends result in few cars parked in the parkinglot
Besides this visual exploration correlation between all of the variablesis checked Table A1 and A2 in Appendix A display all correlations Boldvalues indicate a significant correlation at α lt 005 Table 44 shows thecorrelations between the goal variable and the independent variables of allstrategies All independent variables significantly correlate with the depen-dent variable occupancy
26 Chapter 4 Soft-exclusive development
TABLE 44 Significant correlations between independentvariables amp occupancy
Ind factor Corr Ind factor Corr Ind factor Corr
WeekDay -028 1-stepobs 2 093 48-stepsobs 2 067Holiday -038 1-stepobs 3 086 48-stepsobs 3 063Wind 013 1-stepobs 4 079 48-stepsobs 4 058Sunshine 032 1-stepobs 5 071 48-stepsobs 5 052Rain 002 4-stepobs 3 062 48-stepsday2 045Temperature 002 4-stepobs 4 053 48-stepsday3 048Hour 016 4-stepobs 5 044 48-stepsday4 0471-stepobs 1 098 48-stepsobs 1 068 48-stepsday5 043
FIGURE 42 The average number of cars in the parking lotdisplayed per day of the week and hour of the day
42 Stage II Predictive modelling 27
424 Technique selection
With the factors retrieved from the structured research the prediction mod-els can be tested BI software rsquoQlikviewrsquo [39] is used to combine all the vari-ables from different sources into one dataset This set is used to create andanalyse the prediction model(s) using the rsquoR suite for statistical analysisrsquo[40]
Four learning methods are tested Multiple Linear Regression (MLR)Random Forest (RF) Classification and Regression Trees (CART) and Sup-port Vector Regression (SVR) MLR is used because it is a very straightfor-ward method often used in the field of predictive analytics (as mentionedin Section 31) RF is an ensemble method which combines the results ofother prediction methods to make (better) predictions [11] RF often resultsin high accuracy and is robust to outliers and noise [16] CART and SVRare used to represent other categories of regression techniques Doing thisreduces the risk of poor performing models because of technique-specificissues [2]
When testing these different machine learning methods the best per-forming method is chosen based on the performance measures explainedin Section 411
425 Evaluation validation amp model selection
To evaluate the results 10-fold cross-validation is used With cross-validationa model is trained and tested using the hold-out method explained in Sec-tion 31 The training and testing procedure however is repeated multipletimes (in this case ten times) each time testing on a different set of obser-vations [11] The performance measures are calculated using the total pre-diction errors (squared and absolute) from the 10 iterations divided by thetotal number of rows in the original dataset [12] Although Random Forestis robust against overfitting [16] cross-validation is used to make sure theperformance measures are not due to chance The performance measuresfor the different techniques and data selection strategies are displayed inTables B1 up to and including B7 of Appendix B Using Random Forestresults in the lowest prediction errors for all different strategies The per-formance measures resulting from using RF are displayed in Table 45
The table also displays the measures for a naive model This naivemodel predicts the occupancy based on averages for day of week and timeof day variables which can be used using the original dataset only
The bottom row of Table 45 shows the accuracy of the different predic-tion models This is the percentage of occupancy predictions made that arewithin a range of 5 cars from the actual occupancy
28 Chapter 4 Soft-exclusive development
TABLE 45 RF performance measures all strategies
Naive 1 2 3 4 5 6 7
MSE 9562 432 206 1827 1539 1502 1843 1048RMSE 309 66 45 135 124 123 136 102MAE 180 29 23 64 60 59 65 49 le 5 241 840 866 704 706 697 679 723
43 Stage III Model convergence
Using the performance and accuracy measures displayed in the tables abovefinal predictive models are selected All tested strategies result in less pre-diction error and higher accuracy compared to using averages of day andtime to predict occupancy (naive model) It can be seen that including alarger time window improves the performance of a model except for in-cluding the 5 last observations in the 48-steps ahead prediction Includingthe observations of the last 5 days however does result in less predictionerror
Strategies 2 4 and 7 therefore are selected to be the prediction modelsfor the goals of predicting respectively half an hour two hours and oneday ahead When predicting half an hour in advance predictions are onaverage 23 cars off Using strategies 4 and 7 result in average (absolute)error of respectively 60 and 49 cars
44 Conclusion
Based on the results a prediction instrument using the weather variablestemperature sunshine wind and rainfall using (school)holiday data day of weektime of day and (historic) occupancy numbers of 5 steps in advance applyingthe data cleaning strategy described in Section 413 and using a RandomForest technique is selected as the final prediction instrument developedusing PID-SEDA Using this instrument results in an average error of 23cars when predicting half an hour in advance an average error of 60 carspredicting 2 hours in advance and an average error of 49 cars predictingone day ahead
29
Chapter 5
Soft-inclusive development
This chapter describes the process of developing a prediction instrumentfollowing the soft-inclusive approach of Van der Spoel et al [2] For compa-rability the prediction problem is the same as the prediction problem in thesoft-exclusive development method This chapter starts with the process ofselecting experts collecting hypotheses on what influences the occupancyof the garage and collecting possible constraints In the second stage thesehypotheses and constraints are used to develop prediction models afterwhich a final model is selected in stage III
51 Preparation
Before conducting the first stage of the development method developinghypotheses the prediction problem is identified As mentioned this predic-tion problem is similar to the one in Section 411 By doing so the resultsof the different development methods can be compared using a trade-offanalysis
511 Problem identification
The problem is predicting occupancy of the parking garage of The Edgein a way employees can decide whether or not to park in the garage on agiven day and time The goal variable in this prediction is occupancy thenumber of Deloitte-cars in the garage
512 Expert selection
A stakeholder analysis is conducted to identify the involved actors in thedomain of the prediction problem Results from this analysis are summa-rized in Table 51
Three different groups of domain experts are identified The first is thegroup of employees who is always allowed to park their cars in the garageThese employees are mainly partners directors and senior managers sincethese functions require to be at the office a great deal of the time
30 Chapter 5 Soft-inclusive development
TABLE 51 Domain experts
Group Stakeholder
1 Employee - Parking rights PartnerDirectorSenior Manager
2 Employee - Parking rights Manager(only after 0400 PM) Senior Consultant
ConsultantBusiness Analyst
3 Support CBRE Global Workplace SolutionsIP ParkingReception
The second group is the group of employees with only lsquoovertimersquo park-ing rights These rights allow the employees to park in the garage af-ter 0400 PM every working day as well as the whole day during week-ends On working days before 0400 PM no access is granted to the parkinggarage
The third group is a collection of support stakeholders instead of beingusers like the first two groups lsquoCBRE GWSrsquo manages the housing of TheEdge and is also in charge of the parking garage lsquoIP Parkingrsquo is the com-pany which installed and manages the parking management system andthe corresponding sensors The receptionists also connect to the predic-tion problem as domain experts because they see the people who parkedtheir car entering the building as well as have experience reserving parkingspots for visitors
52 Stage I Assumptions
In the first stage of the soft-inclusive development method hypotheses arecollected on what influences the occupancy of the parking garage Thesehypotheses are collected by consulting the experts from Table 51
521 Hypothesis divergence
Hypotheses are collected through conducting brainstorm sessions with groupsof experts As mentioned in Section 31 brainstorming sometimes has tobe done anonymously to ensure no information is withheld In this re-search anonymous brainstorming is not necessary since the behaviour ofexperts does not affect the (business) processes of the company Howeverto increase internal validity individual expert-interviews were conductedas well Figure 51 shows the hypotheses that are mentioned by experts di-agrammatically by showing the constructs and hypothetical relationshipsTable 52 summarizes the hypotheses and their constructs
52 Stage I Assumptions 31
Hypothesis 1Mentioned by a manager of Risk Advisory as well as during a brainstormsession with experts in group 2 is the influence of day of the week This isbecause of one of the main activities of Deloitte it advisory work On Fri-days a lot of employees come to the office to meet up with internal teamsOn the other days these employees are working at a clientsrsquo office
Hypothesis 2Mentioned by one of the experts in group 1 when arriving lsquoon timersquo occu-pancy of the garage is low This suggests influence of the variable time ofday like used in the soft-exclusive method
Hypothesis 3 amp 4One of the experts mentioned to work at home if the weather is really badso not parking a car in the garage on those days Other employees men-tioned they usually go by bike to The Edge but might go by car if it is arainy day
Hypothesis 5A hypothesis also mentioned by employees who usually go by bike is thefact that they go by car if they have to be somewhere else later that dayThis happens quite often because of the advisory work in the morning em-ployees might have team meetings at The Edge after which they go to theoffice of clients to discuss progress present results et cetera
Hypothesis 6Flexible working is encouraged by Deloitte Employees can work fromhome or other locations connected through the Deloitte Network Some-times physical presence however is still needed to have meetings andordiscussions on important topics Experts mentioned they park their car inthe garage if they have appointments at The Edge that require their physi-cal presence
Hypothesis 7For The Edge being in Amsterdam (capital of The Netherlands) highwayssurrounding the office often are congested during office hours During abrainstorm-session with experts in group 2 it was mentioned some employ-ees choose to go by train if a lot of traffic is predicted
Hypothesis 8Employees who usually go to office by public transportation might go bycar if trains do not ride or if detours have to be taken as mentioned during
32 Chapter 5 Soft-inclusive development
TABLE 52 Collected hypotheses and their constructs
Hypothesis Constructs1 Fridays are more busy than other days Friday (F) is-a day-of-week (DoW)
other day (OD) is-a DoW2 Occupancy depends on what time you arrive Time-of-day (ToD)3 Extremely bad weather I will not go (by car) Weather (W)4 Bad weather I will go by car instead of by bike Weather (W)5 I go by car if I have to be somewhere else later External appointments (Ex)
is-an appointment (A)6 I go to the office if I have appointments Internal appointments (In) is-an A7 When there is a lot of traffic I go by train Traffic (T)8 When trains do not ride I go by car Rail problems (RP)9 Because of road constructions I might go by train Road constructions (RC)10 The number of external assignments Ex is-a A11 Results from literature review DoW ToD W
Holiday (H) Historic Occupancy (HO)
an expert brainstorm
Hypothesis 9One of the experts (stakeholder group 2) mentioned road constructions canhinder accessing the garage Employees can travel by public transportationinstead resulting in lower parking occupancy
Hypothesis 10Another hypothesis resulting from the expert brainstorm is the influence ofexternal assignments The percentage of posted employees might influencethe number of cars in the garage since it influences the number of employ-ees working at a clientsrsquo office
Hypothesis 11The last hypothesis is not derived using expert opinions but by conductinga structured literature review This review has already been conducted dur-ing development of the soft-exclusive prediction model in Section 412 Us-able variables resulting from this review are time of day day of week weatherholiday and occupancy k-steps ahead (historic occupancy)
522 Hypothesis convergence
To make sure no hypothesis will be tested more than once the set of hy-potheses gets converged The first step in this process is specialization inwhich constructs are replaced by their subconstructs (if any exist) Thisrule applies to hypothesis 1 5 6 and 10 resulting in the diagrams shownin Figure 52
After specialization the set of hypotheses gets standardized which meanssynonymous constructs are replaced by one synonym [2] [41] In this caseno synonymous relations are described
52 Stage I Assumptions 33
(A) Hypothesis 1 (B) Hypothesis 2
(C) Hypothesis 3 (D) Hypothesis 4
(E) Hypothesis 5 (F) Hypothesis 6
(G) Hypothesis 7 (H) Hypothesis 8
(I) Hypothesis 9 (J) Hypothesis 10
(K) Hypothesis 11
FIGURE 51 Hypotheses diagrams show the possible rela-tionships between constructs as mentioned by experts Forexample weather (W) decreases occupancy (O) as suggested
in hypothesis 3
34 Chapter 5 Soft-inclusive development
(A) Hypothesis 1
(B) Hypothesis 5
(C) Hypothesis 6 (D) Hypothesis 10
FIGURE 52 Hypotheses 1 5 6 and 10 after specializationreplacing a construct by its subconstruct
All hypotheses that contain a construct not mentioned by other hy-potheses become part of the final set of hypotheses T This applies to hy-pothesis 1 6 7 8 10 and 11 Hypotheses 2 and 11 share the construct timeof day and suggest the same total causal influence on occupancy In that casethe hypothesis that has the most constructs gets added to T being hypoth-esis 11 which is already part of the set Hypothesis 3 4 and 11 also shareconstructs being weather Causal influence however is different for all threehypotheses resulting in adding hypotheses 3 and 4 to T The same goes forhypotheses 5 and 10 resulting in the final set of hypotheses T containing all(specialized) hypotheses but number 2
523 Constraint definition
Once the set of hypotheses is defined constraints are collected To makesure the final prediction instrument is actionable (can be used in practice)experts have determined some constraints (as explained in Section 33)
Data constraintThe prediction instrument should use data collected by the sensors of theparking lot of The Edge A dataset is available with collected data betweenNovember 17 2014 and April 15 2016 showing among others date andtime of cars entering and leaving the parking lot Apart from this external(free) data sources must be used and be integrated with the model
As can be seen in Table 52 the variables day of week time of day and weatherare variables mentioned by experts which also resulted from the literature
53 Stage II Predictive modelling 35
review in Section 42 Because of ex ante availability1 the same data con-straint applies here only variables that are available one day ahead (do-main constraint) can be taken into account Therefore the same weathervariables will be used temperature rainfall sunshine and wind
Deployment constraintNo (IT-)systems are in place in which the prediction instrument shouldbe implemented Developing a prediction instrument is (one of) the firstphase(s) of looking at the possibilities of using data collected by the (smart)building Therefore no deployment constraints are in place
Domain constraintThe use of the prediction instrument is for employees to be able to see ifthey can go by car to The Edge or not based on occupancy predictionsSince most employees decide a dayrsquos type of transport the evening before-hand predictions on every half hour of the day should be available theevening before
Another domain constraint is that data used in the prediction modelshould not be traceable to individuals When privacy sensitive data canbe used to enhance the model a privacy officer should be consulted to dis-cuss whether the data can be used or not for example in an aggregated way
Interestingness constraintAs Van der Spoel et al [2] mention studies with a similar problem canbe used as a benchmark for comparing predictive performance As oneof the goals of this research is to compare a soft-exclusive developmentmethod with this soft-inclusive development method the soft-exclusive de-veloped prediction instrument with the prediction goal of predicting oneday ahead will be used as the benchmark (see Section 44) No constraintson prediction accuracy andor prediction error are given by the experts
53 Stage II Predictive modelling
531 Data selection amp cleaning strategies
To translate the hypotheses into datasets that are used to train the predictivemodels data cleaning- and selection steps will be performed Predictivepower of a developed model can hereby be improved since possible noisein the data will be reduced [2]
1Only include predictors (input variables) that are available at time of prediction [11]
36 Chapter 5 Soft-inclusive development
Data cleaning strategies
Section 421 describes the data cleaning strategy which is used in this sec-tion as well Using the dataset of The Edge occupancy is calculated basedon the number of cars entering and leaving the parking lot (using mean im-putation for missing values) The factors time of day day of week and historicoccupancy are retrieved from this transformed dataset of the parking lot ofThe Edge as well
Data selection amp cleaning strategies
The constructs (factors) derived from the domain analysis are now testedin different strategies of using the factors By doing so the strategy with thebest (predictive) performance can be selected
The selection strategies are as follows
1 Naive model Only using day and time being a naive benchmark
2 Soft-exclusive Only using the factors derived from the literature re-view being hypothesis 11 to be able to compare the different devel-opment methods This strategy reflects hypotheses 1 3 and 4 as well
3 Traffic amp Rail Problems Using factors from literature expanding thedataset by using (near) real-time traffic- and rail data as suggested inhypotheses 7 amp 8
4 Traffic data day before Including traffic data (of one day before becauseof ex ante availability) to the dataset of factors from literature likesuggested in hypothesis 7
5 Rail data day before Including rail data (of one day before because of exante availability) to the dataset of variables from literature like sug-gested in hypothesis 8
6 Appointments Including data on appointments of employees to the datasetof variables from literature like suggested in hypotheses 5 6 and 10
7 Constructions Including data on road constructions to the dataset ofvariables from literature like suggested in hypothesis 9
8 Combining strategy 4 5 6 amp 7 Combining all mentioned factors bothmentioned in literature as well as by the experts
9 Combining strategy 4 5 6 amp 7 using categorical weather factors Becausepredictions are made one evening in advance predictions of weathervariables have to be used as input factors To reduce the error in these
53 Stage II Predictive modelling 37
predictions weather variables will be converted to categorical factorsFor example temperature now is assigned to categories like lsquoBelowzerorsquo lsquo0-5rsquo lsquo5-10rsquo lsquoAbove 25rsquo
532 Reduction by data amp domain constraints
Having defined the different strategies the data- and domain constraintsare checked to see which strategies can be used
All strategies apart from the naive benchmark use the dataset of The Edgeand external data sources to make predictions meeting the first domainconstraint
Strategy 3 6 amp 7 are filtered out because of the data constraint of ex anteavailability Data on rail problems is retrieved from lsquoRijden de Treinenrsquo [42]traffic data is retrieved from the National Database on Traffic data [43]These two variables however are not available at time of prediction be-cause of the constraint to predict the evening before If predictions wouldbe made eg half an hour before then this strategy could have been used2
No (open) dataset is available on the factor road constructions no historicinformation on road constructions or detours can be found The same goesfor data on internal + external appointments Therefore strategy 6 amp 7 cannot be used in training a predictive model as well Strategy 8 and 9 willnow change to only combining strategies 4 amp 5
Weather data is retrieved from the Royal Netherlands Meteorological In-stitute [37] and is available at time of prediction (see Section 523) Thesame goes for data on (school)holidays and days between holiday and weekendwhich are retrieved from Schoolvakanties-Nederland [38]
Strategies 1 and 2 are already used in the soft-exclusive developmentmethod so the results from Section 42 will be used here
Resulting the strategies that will be used in selecting the final predictivemodel(s) are 4 5 8 and 9
533 Exploratory data analysis
To see how the collected hypotheses relate to the data an exploratory dataanalysis is performed Figure 53 displays the average course of occupancytraffic intensity and traffic speed during working days The figure providesinsight into the relationship between the occupancy of the parking lot andthe variable traffic which will be used in strategies 4 8 and 9 As can be seen
2To see if this strategy would improve predictive performance this strategy will betested although it will not be used in selecting the final predictive model
38 Chapter 5 Soft-inclusive development
FIGURE 53 The (cor)relation between traffic and occu-pancy flows Averages for working days are used
TABLE 53 Variable correlation significant at α lt 005
OccupancyRail problems day before 007Traffic intensity day before 015Traffic speed day before 006
there seems to be a (cor)relation between the independent variable (traffic)and the goal variable (occupancy) The variable traffic intensity follows anopposite-like course compared to occupancy during daytime Looking attraffic speed the moments of traffic jam can be identified which relate to themoments occupancy shows a steep increase or decrease
Besides this visual exploration correlation between variables is checkedCorrelation between most of the variables is already checked in Section421 Correlation between the new variables traffic and rail problems (of oneday ahead) and the goal variable is displayed in Table 53 As can be seenin the table all three variables significantly correlate (α lt 005) with occu-pancy although correlation is low
534 Technique amp parameter selection
To test the different strategies the same techniques are used as with PID-SEDA being Multiple Linear Regression (MLR) Random Forest (RF) Clas-sification and Regression Trees (CART) and Support Vector Regression (SVR)for the regression approach (see Section 423)
BI software lsquoQlikviewrsquo [39] is used to combine all the factors from differ-ent sources into a data-set per strategy Statistical computing program lsquoRrsquo[40] is used to train test and evaluate the different prediction models
53 Stage II Predictive modelling 39
TABLE 54 Random Forest - Performance Measures
Naive PID- 3 4 5 8 9SEDA
MSE 9562 1048 1138 1093 1060 1111 1365RMSE 309 102 107 105 103 105 117MAE 180 49 52 51 50 52 59 le 5 241 723 715 717 722 714 678
535 Model training
To test the performance of the models 10-folds cross-validation is used assuggested by Han and Kamber [12 p 365] The average results of the per-formance measures for all strategies are displayed in Appendix C Becauseusing RF gives the best results for all strategies the performance measuresof this technique are displayed here in Table 54 Besides the prediction er-ror measures the percentage of predictions that have an error of less-than-or-equal to 5 cars is displayed in bottom row of Table 54 As can be seenall strategies perform better than the naive benchmark
536 Reduction by interestingness deployment amp domain con-straints
The tested strategies are now checked based on the constraints defined inSection 523
No privacy sensitive data is used in either of the strategies conformingto one of the domain constraints Another domain constraint was usingexternal databases which eliminates the naive strategy This strategy willonly be used as a benchmark but cannot be chosen to be in the final pre-diction instrument As mentioned before strategy 3 does not comply to thedomain constraints as well which means it will not be chosen to be used inthe prediction instrument
Since no deployment constraints are defined the final reduction-step is tolook at the interestingness constraint No constraints are given on predic-tion error and accuracy the interestingness constraint however is to use thesoft-exclusive developed model as a benchmark The to be chosen strategytherefore has to perform the same or better than the model developed usingPID-SEDA
A t-test is performed to test if the measures of the strategies differ sig-nificantly [44] see Table 55 Strategy 5 performs significantly better (t-testp lt 001 level) compared to strategies 4 8 amp 9 and is the only strategy for
40 Chapter 5 Soft-inclusive development
TABLE 55 Comparison of results (based on absolute error)An x indicates the strategy in the row performs significantly
better compared to the one in the column (p lt 001)
PID-SEDA Strategy 4 Strategy 5 Strategy 8 Strategy 9
PID-SEDA - x x xStrategy 4 - xStrategy 5 x - x xStrategy 8 - xStrategy 9 -
which the interestingness constraint holds There is no significant differ-ence in the performance of the model of PID-SEDA and strategy 5
This leaves strategy 5 as the only remaining strategy after reduction by do-main and interestingness constraints
54 Stage III Model Convergence
Only one model results from the steps described above Using this modelthe occupancy of the parking lot of The Edge one day ahead is predictedwith an average error of 5 cars 722 of predictions have an error of lessthan or equal to 5 cars compared to the actual occupancy
55 Conclusion
Based on the results a prediction instrument using the weather variablestemperature sunshine wind and rainfall using (school)holiday data day of weektime of day (historic) occupancy numbers of up to 5 days ahead includingdata on rail problems of one day ahead and using a Random Forest tech-nique is selected as the final prediction instrument developed using PID-CD Using this instrument average prediction error is 50 cars and 722of predictions is within an error of 5 cars
In the next chapter this prediction instrument is compared to the pre-diction instrument developed using PID-SEDA (Section 44) to be able toanswer the research question
41
Chapter 6
Discussion
This chapter describes the last part of Technical Action Research analysis ofresults [7] Analysis of results consists of presenting observations provid-ing possible explanations (Section 61) and answering research questions(Chapter 7) Generalizations limitations and recommendations for futurework are discussed by assessing research validity (Section 62)
61 Comparing models
To answer the research question the prediction instruments resulting fromboth using PID-SEDA and PID-CD are compared Table 61 displays themean squared- and absolute errors as well as the accuracy for the pre-dictive models Three predictive models resulted from using PID-SEDAone for predicting half an hour ahead the second for predicting two hoursahead and the last predicting one day ahead One predictive model re-sulted from using PID-CD which is aimed at predicting occupancy oneday ahead as well As can be seen in the table the first model of PID-SEDApredicts with the smallest errors and highest accuracy Prediction of occu-pancy half an hour ahead differs on average 23 cars from the actual occu-pancy value However based on the domain constraints defined in Section523 only those models with a prediction goal of predicting one day aheadcan be used in practice The first two prediction instruments of PID-SEDAtherefore are not actionable
TABLE 61 Performance measures of different develop-ment methods amp strategies
PID-SEDA (S2) PID-SEDA (S4) PID-SEDA (S7) PID-CD (S5)
MSE 206 1539 1048 1060RMSE 45 124 102 103MAE 23 60 49 50 le 5 866 706 723 722
42 Chapter 6 Discussion
As tested in Section 536 there is no significant difference in the predic-tive performance of the remaining PID-SEDA model and the model devel-oped using PID-CD Including information on rail problems one day aheaddoes not improve performance of the predictive model As the selectedPID-CD model performs significantly better than the other models testedin Section 535 including information on traffic one day ahead (strategy 4)including both rail problems and traffic data of one day ahead (strategy 8amp 9) or including real-time information on rail problems and traffic (strat-egy 3) does not improve predictive performance as well The same datacleaning strategy is applied and the same modelling technique (RF) andvalidation method (10-fold cross-validation) is used Based on the predic-tive models alone the predictions instruments do not (significantly) differ
A possible reason why PID-CD did not result in a better predictive modelcompared to using PID-SEDA is that not all hypotheses mentioned by ex-perts could be used Specific intelligence about the domain was gatheredthat eventually could not be used in developing the prediction model sinceno data was available on internal and external appointments of employeesWe will elaborate more on this in Section 72
Besides this the predictive model resulting from using PID-SEDA al-ready has high predictive power This predictive power is unlikely to beenhanced by adding a factor that only slightly correlates with the goal vari-able (significant correlation is 007 see Table 53) Occupancy has provento follow a similar pattern during working days Using the variables timeof day and day of week and adding a memory structure by using historicoccupancy is already a solid basis for a predictive model Adding factorswith high or moderate correlation to the goal variable such as holiday andweather in this case refines predictive accuracy of the model Low corre-lation factors however (like rail problems) have to little predictive power toenhance the model
62 Validity
According to Wieringa [45] reasons that support the conclusion of a Techni-cal Action Research must be spelled out as well as reasons why the conclu-sion could be false Three well-known kinds of validity are used to do so(statistical) conclusion validity internal validity and external validity [45]originally proposed by Cook and Campbell [46]
Conclusion validity refers to the ability to draw conclusions on the ba-sis of statistical evidence [47 p1253] Internal validity is the support for aconclusion to be caused by the treatment only [45] and not be influencedby factors outside the treatment (in this case the treatment is a predictive
62 Validity 43
model) Internal validity assesses the quality of the predictive model(s) forexample by describing limitations The quality of a predictive model in-dicates the potential usefulness in practice [48] External validity refers togeneralizing across times settings [47] and in this case domains
621 Conclusion Validity
Conclusions in this research are drawn on the basis of statistical evidenceConclusions are based on a two-sample t test testing the difference in (av-erage) prediction error see Section 536
A two-sample t test is used because these tests are more robust thanone-sample methods [44] The samples were independent which is a con-dition to use the test and sample sizes were large (n = 74266) When dealingwith equal sized samples and distributions with similar shape probabilityvalues are very accurate [44] which was tested and true for the t test per-formed
622 Internal Validity
Internal validity is assessed by looking at the prediction models as well asby looking at the execution of the different development methods
Cross-validationInternal validity of the prediction models is enhanced by using 10-foldcross-validation Stability of the models is hereby improved compared tousing a holdout method because 100 of the data is used for validationThe effect of outliers is reduced and the chance of the good results beingcaused by chance is reduced Stability can be further improved however byperforming a repeated cross-validation [48]
Another validation method which can be used is bootstrapping whichcan be thought of as a smoothed version of cross-validation [49] Efronand Tibshirani [49] show that the bootstrap method outperforms cross-validation in multiple prediction experiments We suggest to research theeffect of using a bootstrap method in future work
Modeling techniqueDifferent modelling techniques are used to reduce the risk of poor perform-ing models because of technique-specific issues In future work it wouldbe interesting to see the effect of using another technique for example Neu-ral Networks which was proven to be an accurate prediction technique inother parking lot occupancy prediction researches [29] [32]
44 Chapter 6 Discussion
Data qualityMore than a year of data is collected and used for training the models Bydoing so it is made sure every possible value of the input variables is usedfor training For example all the possible values of the factor holiday are in-cluded school holidays in the summer but also winter holidays and othernational days
The amount of missing data and the use of data imputation to solvethis however might have influenced quality of the dataset Most of theoccupancy values used for training and testing are calculated using av-erage parking stay (see Section 421) Because of this occupancy valuesmost likely do not represent the actual occupancy values but represent anapproximation of occupancy Although this does not influence the perfor-mance measures (errors are calculated from the same dataset) the dataset islikely to (slightly) differ from the truth The trained models therefore mightnot be able to predict occupancy accurately in the real world which is alimitation of this study Making sure sensors work most of the time andclosing the gate after each car leaving the parking lot (to be able to scan allcars) are possible solutions to reduce the amount of missing data therebyincreasing data quality
Execution of methodsRegarding internal validity of using PID-CD collecting domain intelligencevia interviews or brainstorms is sensitive to validity threats Experts mightanswer questions in a socially desirable way [45] As discussed in Section521 this threat especially applies to brainstorming resulting in sometimeshaving to brainstorm anonymously [2] In this research brainstorming wasnot conducted anonymously because behaviour of experts in the domaindoes not affect the processes of the company However to increase internalvalidity individual expert-interviews are conducted as well With conduct-ing individual interviews possible need to answer questions in a sociallydesirable way is reduced
Another threat regarding expert consultation is the interpretation of ex-pertsrsquo input Researchers interpretation of what experts say affects the de-signed model [45] The hypotheses used in this research might have beeninterpreted wrongly for example originally intended to suggest anotherrelation between (other) variables To decrease influence of this threat ex-perts should be consulted throughout the whole process using an iterativeapproach to be able to adapt steps if necessary
A threat to the validity of using PID-SEDA is the (unintended) use of do-main specific intelligence PID-SEDA is used in this research to serve as a
62 Validity 45
benchmark method in which no domain specific knowledge is used How-ever not using any domain intelligence turned out to be difficult For exam-ple the domain specific prediction goal (predicting one day ahead) was al-ready known at the moment of performing the soft-exclusive method Thegoal was used in the soft-exclusive method to be able to easily comparethe results with the results from PID-CD It can be argued however if thisgoal would have been used when this specific domain knowledge was notknown If not no actionable prediction model would have resulted fromusing PID-SEDA since domain constraints were not met
623 External Validity
External validity is assessed to see if generalizations across times and do-mains can be made
Other people using the artefactAccording to Wieringa a major threat to validity of conclusions is that theresearcher who developed the artefact is able to use it in a way than noone else can [45] This would imply a lack of generalizability to any casewhere other people are using the artefact For the method of Van der Spoelet al [2] this threat is mitigated by performing this research letting some-one else use the artefact (PID-CD) in a new client cycle (see Figure 21)
The artefact (prediction instrument) developed in this research can eas-ily be used by other researchers with some experience in data mining sincewell-known techniques and validation methods are used and steps of de-veloping the instruments are described thoroughly
Generalizing across timesBecause this research focuses on one specific complex domain generaliz-ing across times and other domains is discouraged To give an examplewhy not to generalize over time one of the many possible characteristicsof a complex domain is the influence of human behaviour [3] Human be-haviour continuously changes Parking behaviour of the years 2014 to 2016might be different from parking behaviour in the future This means predic-tive models should be continuously adapted to the changes in the domainTaking new generated data as input for training new models therefore isrecommended
Generalizing across domainsThe prediction instruments developed in this research are specifically tar-geted at predicting parking lot occupancy of the parking lot of The EdgeHaving used both expertsrsquo input as input from existing literature improvesgeneralizability but generalizing across domains still is hard As Van der
46 Chapter 6 Discussion
Spoel et al [2] mention a soft factor is unique to one domain The same fac-tor could be at play in two domains but its effect will be different in eachdomain [2 p16] Factors used in the prediction instruments can be usedas input for other parking lot occupancy predictions but a soft-inclusivedomain analysis should be conducted to discover domain specific aspects
47
Chapter 7
Conclusion
Concluding this thesis the research questions will be answered and recom-mendations for future work are given
71 Answering Research Questions
The research question and its subquestions as formulated in Section 212are answered below First the subquestions are answered
1 What instrument for predicting parking lot occupancy results from usingrsquoprediction instrument development with soft-exclusive domain analysisrsquo
A prediction instrument resulting from using PID-SEDA includesthe weather variables temperature sunshine wind and rainfall uses(school)holiday data day of week time of day and (historic) occupancynumbers of 5 steps in advance The instrument uses a Random For-est technique with 10-fold cross-validation to validate performancemeasures Using this instrument results in an average error of 23cars when predicting half an hour in advance and an average er-ror of 60 cars predicting 2 hours in advance These two predictionmodels however can not be used in the domain researched becauseof the domain constraint to predict one day ahead Predicting oneday ahead this prediction instrument results in an average error of 49cars 723 of prediction are within an error of 5 cars
2 What instrument for predicting parking lot occupancy results from usingrsquoprediction instrument development for complex domainsrsquo
A prediction instrument resulting from using PID-CD includes theweather variables temperature sunshine wind and rainfall uses (school)holidaydata day of week time of day (historic) occupancy numbers of up to 5days ahead and includes data on rail problems of one day ahead Itpredicts one day ahead and uses a Random Forest technique with 10-fold cross-validation to validate performance measures No privacysensitive data is used and external data sources are integrated into the
48 Chapter 7 Conclusion
predictive model Using this instrument average prediction error is 5cars and 722 of predictions is within an error of 5 cars
Next the research question is answered
rsquoHow does a prediction instrument developed using a soft-inclusive methodcompare to a prediction instrument developed using a soft-exclusive methodrsquo
Answering the research question the prediction instrument developed us-ing PID-CD does not outperform the prediction instrument developed us-ing PID-SEDA as it did in the original research [2] The high predictiveperformance of the prediction instrument developed using PID-SEDA andnot being able to use all hypotheses suggested by experts when using PID-CD are possible explanations for this result
Continuing the validation of PID-CD the method should be tested inmore (complex) domains to be able to find the range of domains in whichusing the method adds significant value
72 Recommendations
One of the recommendations for future work mentioned in Section 62 willnow be discussed more elaborately
Because of the data constraint of ex ante availability data selection strat-egy 6 of the soft-inclusive method could not be used in training a predic-tive model Input of the experts to include data on internal and externalappointments (hypotheses 5 6 amp 10) therefore is not incorporated into thefinal prediction instrument It would be interesting to see how incorporat-ing this information would affect the performance of a (similar) predictivemodel Based on the hypotheses it is assumed that the number of internalappointments positively correlates with the number of cars in the parkinglot and the number of external appointments negatively influences the oc-cupancy
Sample data is collected and an exploratory data analysis is performed tosee if these assumptions are reflected in data A survey is completed by 250experts of group 1 (experts with parking rights all day) The survey ques-tioned whether the particular expert had parked hisher car in the parkinglot that day if heshe had appointments at The Edge which required theirphysical presence and if heshe had appointments elsewhere on the givenday Data on all five working days is collected
Table 71 shows the correlations between the number of employees whoparked their car in the parking lot and the number of people with internalor external appointments Bold values indicate a significant correlation at
72 Recommendations 49
TABLE 71 Correlation occupancy amp appointments
Occupancy Int Appointments Ext Appointments
Occupancy -Int Appointments 083 -Ext Appointments -010 -020 -
plt 001 Correlation between occupancy and internal appointments is 083This indicates the factor is likely to add predictive power to a predictionmodel Future work therefore could be to create an architecture in whichinformation on appointments from for example employeesrsquo agendas canbe incorporated into developing the prediction model
51
Appendix A
Correlation soft-exclusivefactors
52A
ppendixA
C
orrelationsoft-exclusive
factors
TABLE A1 Correlation variables - bold values indicate significant value at α lt 005 (a)
Occupancy WeekDay Holiday Wind Sunshine Rain Temp Hour 1-step1 1-step2 1-step3 1-step4
Occupancy 100WeekDay -028 100Holiday -038 068 100Wind 013 001 003 100Sunshine 032 000 001 003 100Rain 002 -001 -001 015 -011 100Temperature 002 -001 -004 008 -004 001 100Hour 016 000 000 005 002 000 001 1001-stepobs 1 098 -028 -038 013 030 002 002 020 1001-stepobs 2 093 -028 -038 012 027 003 002 024 098 1001-stepobs 3 086 -028 -038 011 024 003 002 028 093 098 1001-stepobs 4 - 4-stepobs 1 079 -028 -037 010 020 003 002 032 086 093 098 1001-stepobs 5 - 4-stepobs 2 071 -028 -037 008 017 004 002 036 079 086 093 0984-stepobs 3 062 -028 -037 006 012 004 002 040 071 079 086 0934-stepobs 4 053 -028 -037 005 007 004 002 043 062 071 079 0864-stepobs 5 044 -028 -037 003 003 004 002 046 053 062 071 07948-stepsobs 1 068 -010 -012 013 032 000 005 016 067 064 059 05348-stepsobs 2 067 -010 -012 013 030 000 005 020 068 067 064 05948-stepsobs 3 063 -010 -012 012 027 000 005 024 067 068 067 06448-stepsobs 4 058 -010 -012 011 024 001 005 028 063 067 068 06748-stepsobs 5 052 -010 -012 010 020 001 004 032 058 063 067 06848-stepsday2 045 024 010 012 033 001 004 016 044 041 037 03348-stepsday3 048 010 010 013 033 001 003 016 047 044 040 03548-stepsday4 047 004 010 016 031 000 003 016 046 043 039 03448-stepsday5 043 012 011 020 030 000 002 016 041 039 035 030
Appendix
A
Correlation
soft-exclusivefactors
53
TABLE A2 Correlation variables - bold values indicate significant value at α lt 005 (b)
1-step5 4-step3 4-step4 4-step5 48-steps1 48-steps2 48-steps3 48-steps4 48-steps5 48d2 48d3 48d4
1-stepobs 5 1004-stepobs 3 098 1004-stepobs 4 093 098 1004-stepobs 5 086 093 098 10048-stepsobs 1 047 041 034 027 10048-stepsobs 2 053 047 041 034 098 10048-stepsobs 3 059 053 047 041 093 098 10048-stepsobs 4 064 059 053 047 086 093 098 10048-stepsobs 5 067 064 059 053 079 086 093 098 10048-stepsday2 028 023 018 012 068 067 064 059 053 10048-stepsday3 030 024 019 013 045 044 041 037 033 068 10048-stepsday4 029 024 018 012 048 047 044 039 035 045 068 10048-stepsday5 025 020 015 010 047 046 043 039 034 048 045 068
55
Appendix B
Performance measures -Soft-exclusive
TABLE B1 Performance measures - Strategy 1
Measure MLR RF DT SVR
MSE 2010 432 3444 2090RMSE 142 66 186 144MAE 76 29 123 80 le 5 626 840 239 477
TABLE B2 Performance measures - Strategy 2
Measure MLR RF DT SVR
MSE 744 206 3694 819RMSE 86 45 192 91MAE 46 23 128 56 le 5 754 866 229 593
TABLE B3 Performance measures - Strategy 3
Measure MLR RF DT SVR
MSE 18030 1827 5054 21050RMSE 425 135 225 459MAE 281 64 134 240 le 5 169 704 462 352
TABLE B4 Performance measures - Strategy 4
Measure MLR RF DT SVR
MSE 1248 1539 497 1462RMSE 353 124 223 382MAE 228 60 134 192 le 5 214 706 442 390
56 Appendix B Performance measures - Soft-exclusive
TABLE B5 Performance measures - Strategy 5
Measure MLR RF DT SVR
MSE 2271 1502 757 2888RMSE 477 123 275 537MAE 337 59 170 258 le 5 87 697 270 276
TABLE B6 Performance measures - Strategy 6
Measure MLR RF DT SVR
MSE 2246 1843 714 2879RMSE 474 136 267 537MAE 334 65 165 256 le 5 96 679 225 291
TABLE B7 Performance measures - Strategy 7
Measure MLR RF DT SVR
MSE 1892 1048 682 2420RMSE 435 102 261 492MAE 318 49 158 248 le 5 81 723 241 241
57
Appendix C
Performance measures -Soft-inclusive
TABLE C1 Performance measures - Strategy 2
Measure MLR RF DT SVR
MSE 1892 129 682 2420RMSE 435 114 261 492MAE 318 52 158 248 le 5 81 709 241 242
TABLE C2 Performance measures - Strategy 3
Measure MLR RF DT SVR
MSE 18925 1164 6967 23821RMSE 435 108 264 438MAE 318 52 161 246 le 5 84 726 202 252
TABLE C3 Performance measures - Strategy 4
Measure MLR RF DT SVR
MSE 1882 114 689 24168RMSE 434 107 262 492MAE 316 52 160 247 le 5 83 716 203 243
TABLE C4 Performance measures - Strategy 5
Measure MLR RF DT SVR
MSE 1892 1163 667 24195RMSE 435 108 258 492MAE 318 51 159 247 le 5 84 718 211 241
58 Appendix C Performance measures - Soft-inclusive
TABLE C5 Performance measures - Strategy 8
Measure MLR RF DT SVR
MSE 1882 1027 682 24184RMSE 434 101 261 492MAE 316 50 160 247 le 5 83 718 209 245
TABLE C6 Performance measures - Strategy 9
Measure MLR RF DT SVR
MSE 1870 1142 683 24115RMSE 432 107 261 491MAE 316 52 160 247 le 5 84 719 205 242
59
References
[1] A R Ganguly O A Omitaomu and R M Walker ldquoKnowledge dis-covery from sensor data for security applicationsrdquo in Learning fromData Streams Springer 2007 pp 187ndash204
[2] S Van der Spoel C Amrit and J Van Hillegersberg ldquoDomain drivenprediction instrument development for complex systemsrdquo Researchof University of Twente 2016
[3] M Jackson and P Keys ldquoTowards a system of systems methodolo-giesrdquo Journal of the operational research society pp 473ndash486 1984
[4] P Chapman J Clinton R Kerber T Khabaza T Reinartz C Shearerand R Wirth ldquoCrisp-dm 10 step-by-step data mining guiderdquo 2000
[5] GSBouw The edge 2015 [Online] Available httpwwwgensbouwnlnlprojectendetailthe-edge (visited on 02022016)
[6] U Rutishauser J Joller and R Douglas ldquoControl and learning of am-bience by an intelligent buildingrdquo Systems Man and Cybernetics PartA Systems and Humans IEEE Transactions on vol 35 no 1 pp 121ndash132 2005
[7] R Wieringa and A Moralı ldquoTechnical action research as a validationmethod in information systems design sciencerdquo in Design science re-search in information systems advances in theory and practice Springer2012 pp 220ndash238
[8] L Cao S Y Philip C Zhang and Y Zhao Domain driven data miningSpringer 2010
[9] D Schoumln ldquoEducating the reflective practitionerrdquo 1987
[10] M A Waller and S E Fawcett ldquoData science predictive analyticsand big data A revolution that will transform supply chain designand managementrdquo Journal of Business Logistics vol 34 no 2 pp 77ndash84 2013
[11] G Shmueli ldquoTo explain or to predictrdquo Statistical science pp 289ndash3102010
[12] J Han J Pei and M Kamber Data mining Concepts and techniquesElsevier 2011
[13] D J Hand H Mannila and P Smyth Principles of data mining MITpress 2001
60 REFERENCES
[14] D Basak S Pal and D C Patranabis ldquoSupport vector regressionrdquoNeural Information Processing-Letters and Reviews vol 11 no 10 pp 203ndash224 2007
[15] I H Witten and E Frank Data Mining Practical machine learning toolsand techniques Morgan Kaufmann 2005
[16] L Breiman ldquoRandom forestsrdquo Machine learning vol 45 no 1 pp 5ndash32 2001
[17] M R Segal ldquoMachine learning benchmarks and random forest re-gressionrdquo Center for Bioinformatics amp Molecular Biostatistics 2004
[18] L Cao and C Zhang ldquoDomain-driven actionable knowledge discov-ery in the real worldrdquo in PacificndashAsia Conference on Knowledge Discov-ery and Data Mining Springer 2006 pp 821ndash830
[19] L Cao and N T Nguyen ldquoIntelligence metasynthesis and knowledgeprocessing in intelligent systemsrdquo J UCS vol 14 no 14 pp 2256ndash2262 2008
[20] J Gu and X Tang ldquoMeta-synthesis system approach to knowledgesciencerdquo International Journal of Information Technology amp Decision Mak-ing vol 6 no 03 pp 559ndash572 2007
[21] R J Hyndman and A B Koehler ldquoAnother look at measures of fore-cast accuracyrdquo International journal of forecasting vol 22 no 4 pp 679ndash688 2006
[22] C J Willmott and K Matsuura ldquoAdvantages of the mean absoluteerror (mae) over the root mean square error (rmse) in assessing av-erage model performancerdquo Climate research vol 30 no 1 pp 79ndash822005
[23] J Webster and R T Watson ldquoAnalyzing the past to prepare for thefuture Writing ardquo MIS quarterly vol 26 no 2 pp 13ndash23 2002
[24] H F Moed J Bar-Ilan and G Halevi ldquoA new methodology for com-paring google scholar and scopusrdquo Journal of Informetrics vol 10 no2 pp 533ndash551 2016
[25] A Kunjithapatham A Tripathy C-t Eng C Chiriyankandath andT Rao ldquoPredicting parking lot availability in san franciscordquo ND
[26] F Richter S Di Martino and D C Mattfeld ldquoTemporal and spa-tial clustering for a parking prediction servicerdquo in Tools with ArtificialIntelligence (ICTAI) 2014 IEEE 26th International Conference on IEEE2014 pp 278ndash282
[27] S Soler ldquoCreation of a web application for smart park system andparking prediction study for system integrationrdquo 2015
REFERENCES 61
[28] A David K Overkamp and W Scheuerer ldquoEvent-oriented forecastof the occupancy rate of parking spaces as part of a parking infor-mation servicerdquo in Proceedings of the 7th World Congress on IntelligentSystems Turin Italy 2000
[29] B Chen F Pinelli M Sinn A Botea and F Calabrese ldquoUncertaintyin urban mobility Predicting waiting times for shared bicycles andparking lotsrdquo in Intelligent Transportation Systems-(ITSC) 2013 16th In-ternational IEEE Conference on IEEE 2013 pp 53ndash58
[30] M Reinstadler M Braunhofer M Elahi and F Ricci ldquoPredictingparking lots occupancy in bolzanordquo 2013
[31] Y Zheng S Rajasegarar and C Leckie ldquoParking availability predic-tion for sensor-enabled car parks in smart citiesrdquo in Intelligent SensorsSensor Networks and Information Processing (ISSNIP) 2015 IEEE TenthInternational Conference on IEEE 2015 pp 1ndash6
[32] E I Vlahogianni K Kepaptsoglou V Tsetsos and M G KarlaftisldquoExploiting new sensor technologies for real-time parking predictionin urban areasrdquo in Transportation Research Board 93rd Annual MeetingCompendium of Papers 2014 pp 14ndash1673
[33] T Fabusuyi R C Hampshire V A Hill and K Sasanuma ldquoDecisionanalytics for parking availability in downtown pittsburghrdquo Interfacesvol 44 no 3 pp 286ndash299 2014
[34] E McGuiness and S McNeil ldquoStatistical models to predict commercial-and parking-space occupancyrdquo Journal of urban planning and develop-ment vol 117 no 4 pp 129ndash139 1991
[35] X Chen ldquoParking occupancy prediction and pattern analysisrdquo 2014
[36] G Batista and M C Monard ldquoAn analysis of four missing data treat-ment methods for supervised learningrdquo Applied Artificial Intelligencevol 17 no 5-6 pp 519ndash533 2003
[37] KNMI Hourly weather data 2016 [Online] Available httpwwwknmi20nlklimatologieuurgegevensselectiecgi
(visited on 04112016)
[38] Schoolvakanties Schoolvakanties nederland 2016 [Online] Availablewwwschoolvakanties-nederlandnl (visited on 04112016)
[39] Qlik Qlikview 2016 [Online] Available httpglobalqlikcomnl (visited on 02152016)
[40] R Statistical programming in r 2016 [Online] Available httpswwwr-projectorg (visited on 04292016)
62 REFERENCES
[41] R M Mueller ldquoA meta-model for inferring inter-theory relationshipsof causal theoriesrdquo in System Sciences (HICSS) 2015 48th Hawaii Inter-national Conference on IEEE 2015 pp 4908ndash4917
[42] R de Treinen Rijden de treinen 2016 [Online] Available wwwrijdendetreinennl (visited on 06152016)
[43] N D Wegverkeersgegevens Historische verkeersgegevens 2016 [On-line] Available httpwwwndwnupaginanl4databank65historische_gegevens (visited on 06172016)
[44] D S Moore and G P McCabe Introduction to the Practice of StatisticsWH FreemanTimes BooksHenry Holt amp Co 1989
[45] R Wieringa ldquoEmpirical research methods for technology validationScaling up to practicerdquo Journal of systems and software vol 95 pp 19ndash31 2014
[46] T D Cook and D T Campbell ldquoThe design and conduct of quasi-experiments and true experiments in field settingsrdquo Handbook of in-dustrial and organizational psychology vol 223 p 336 1976
[47] T A Scandura and E A Williams ldquoResearch methodology in man-agement Current practices trends and implications for future re-searchrdquo Academy of Management journal vol 43 no 6 pp 1248ndash12642000
[48] E W Steyerberg F E Harrell G J Borsboom M Eijkemans Y Ver-gouwe and J D F Habbema ldquoInternal validation of predictive mod-els Efficiency of some procedures for logistic regression analysisrdquoJournal of clinical epidemiology vol 54 no 8 pp 774ndash781 2001
[49] B Efron and R Tibshirani ldquoImprovements on cross-validation The632+ bootstrap methodrdquo Journal of the American Statistical Associationvol 92 no 438 pp 548ndash560 1997
- Abstract
- Acknowledgements
- List of Figures
- List of Tables
- List of Abbreviations
- Introduction
-
- Introduction
- Research Background
-
- Case Description
-
- Research Objectives
-
- Validation Goal
- Prediction Goal
-
- Methodology
-
- Research Design
-
- Research Methodology
- Research Questions
-
- Thesis structure
-
- Theoretical Background
-
- Predictive analytics
- Domain-driven development methods
- Prediction Instrument Development for Complex Domains
-
- Preparation Stage
- Stage I Qualitative assumptions
- Stage II Predictive modelling
- Stage III Model convergence
- PID-SEDA
-
- Soft-exclusive development
-
- Stage I Assumptions
-
- Goal definition
- Literature review
- Data constraint
-
- Stage II Predictive modelling
-
- Data cleaning
- Data selection strategies
- Exploratory data analysis
- Technique selection
- Evaluation validation amp model selection
-
- Stage III Model convergence
- Conclusion
-
- Soft-inclusive development
-
- Preparation
-
- Problem identification
- Expert selection
-
- Stage I Assumptions
-
- Hypothesis divergence
- Hypothesis convergence
- Constraint definition
-
- Stage II Predictive modelling
-
- Data selection amp cleaning strategies
- Reduction by data amp domain constraints
- Exploratory data analysis
- Technique amp parameter selection
- Model training
- Reduction by interestingness deployment amp domain constraints
-
- Stage III Model Convergence
- Conclusion
-
- Discussion
-
- Comparing models
- Validity
-
- Conclusion Validity
- Internal Validity
- External Validity
-
- Conclusion
-
- Answering Research Questions
- Recommendations
-
- Correlation soft-exclusive factors
- Performance measures - Soft-exclusive
- Performance measures - Soft-inclusive
- References
-
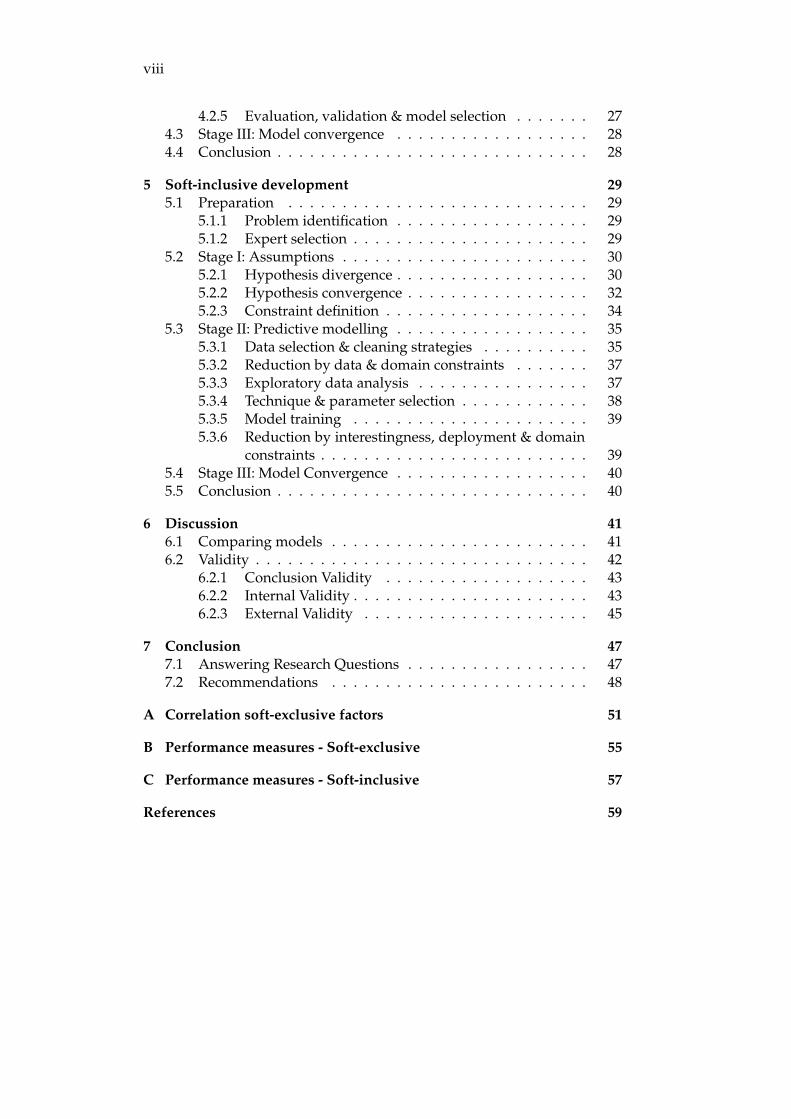
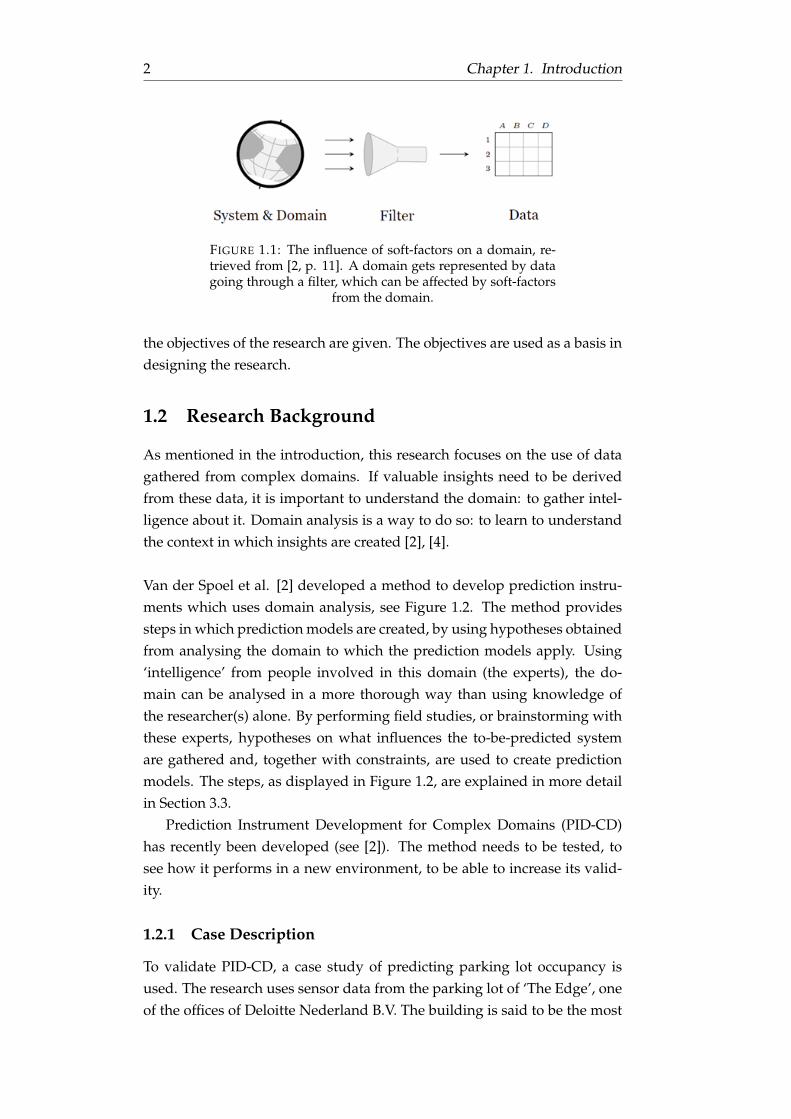
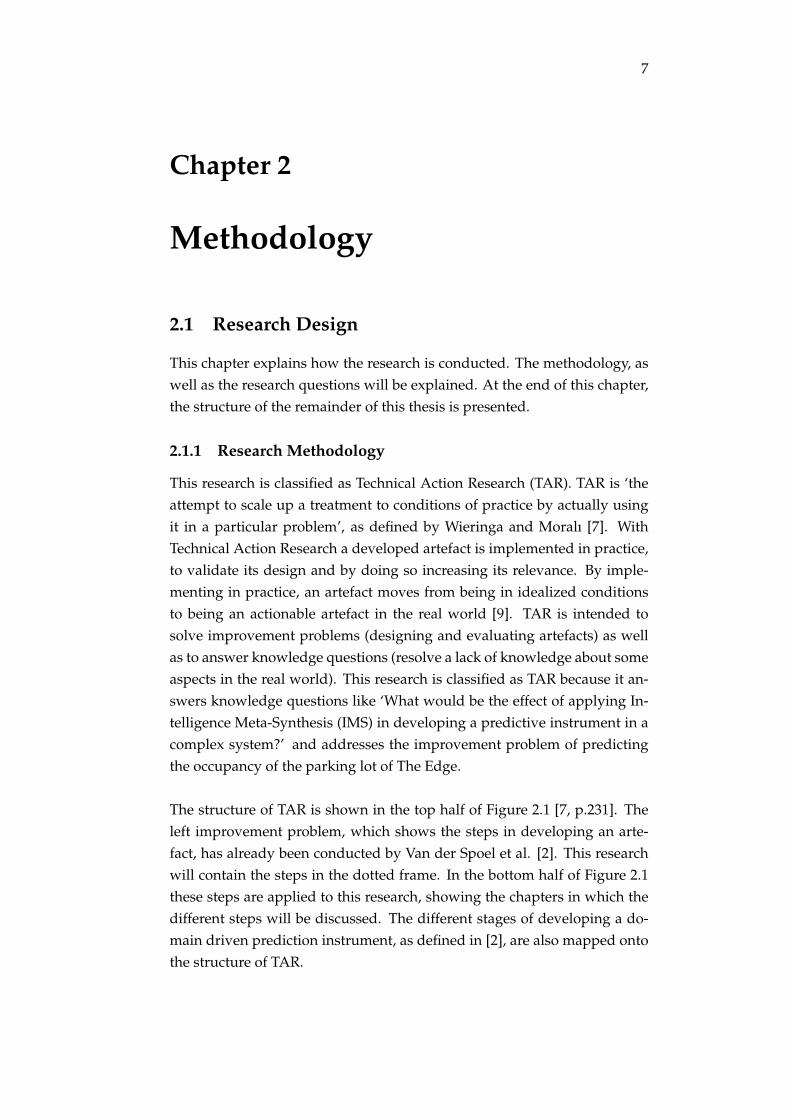
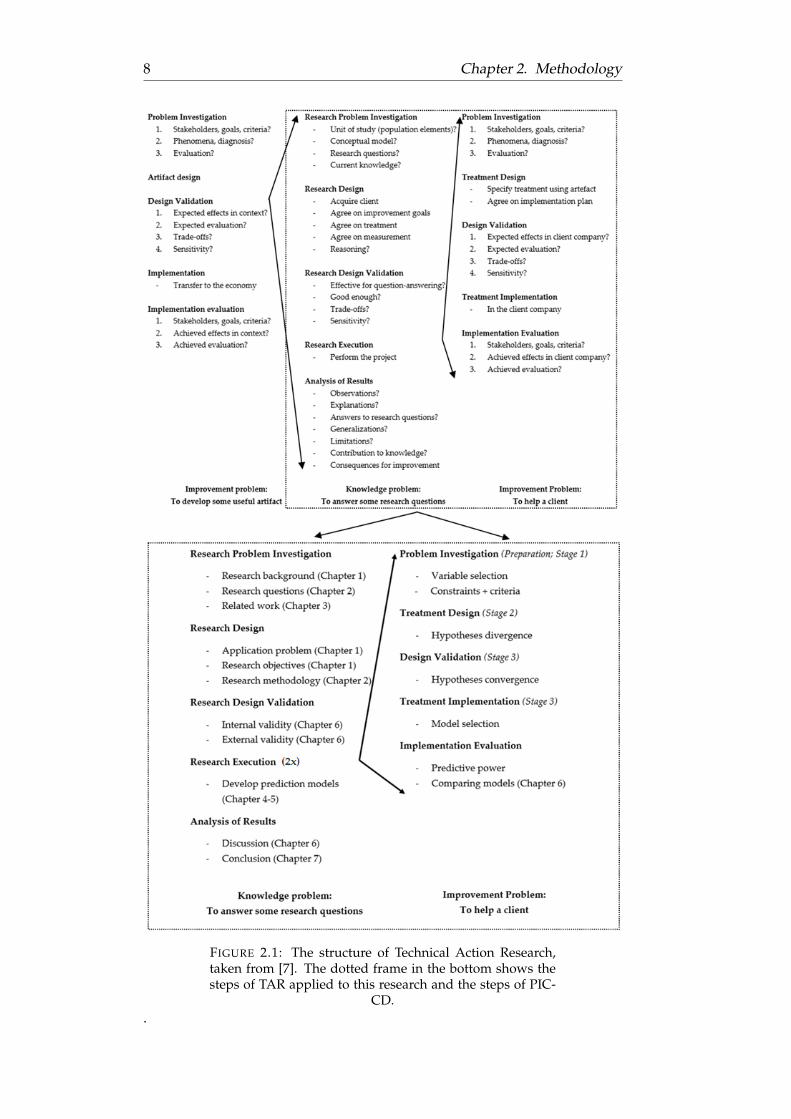
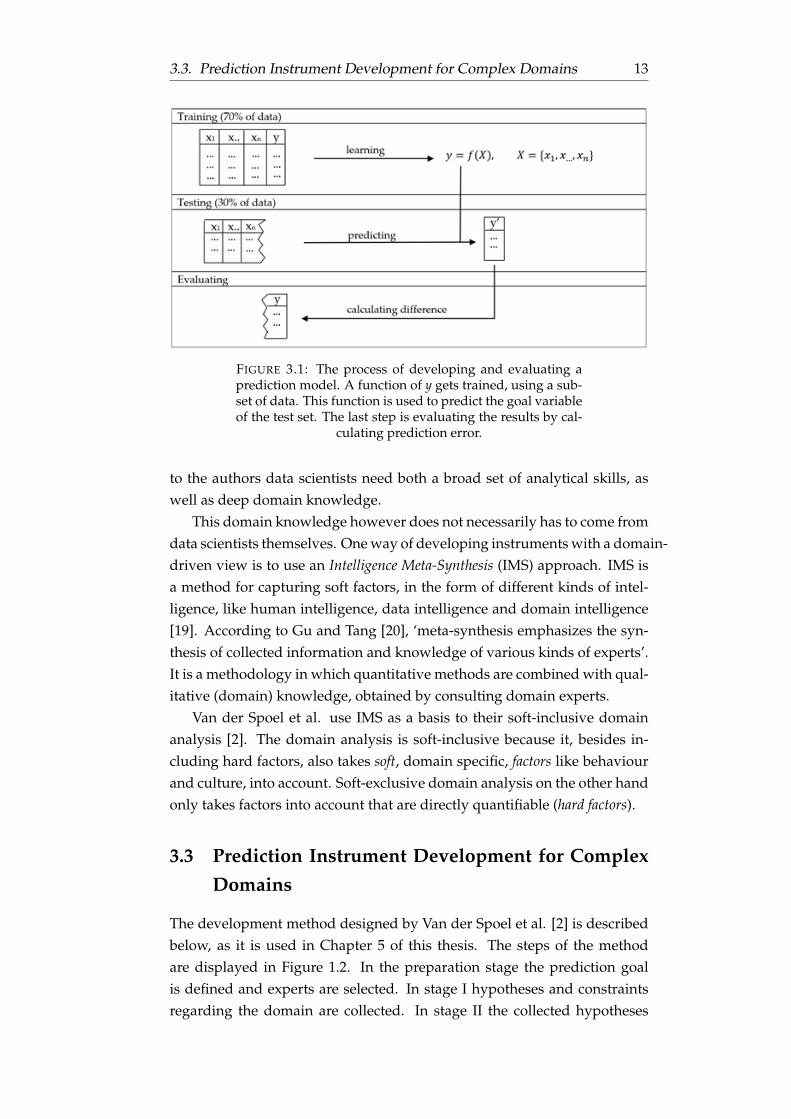
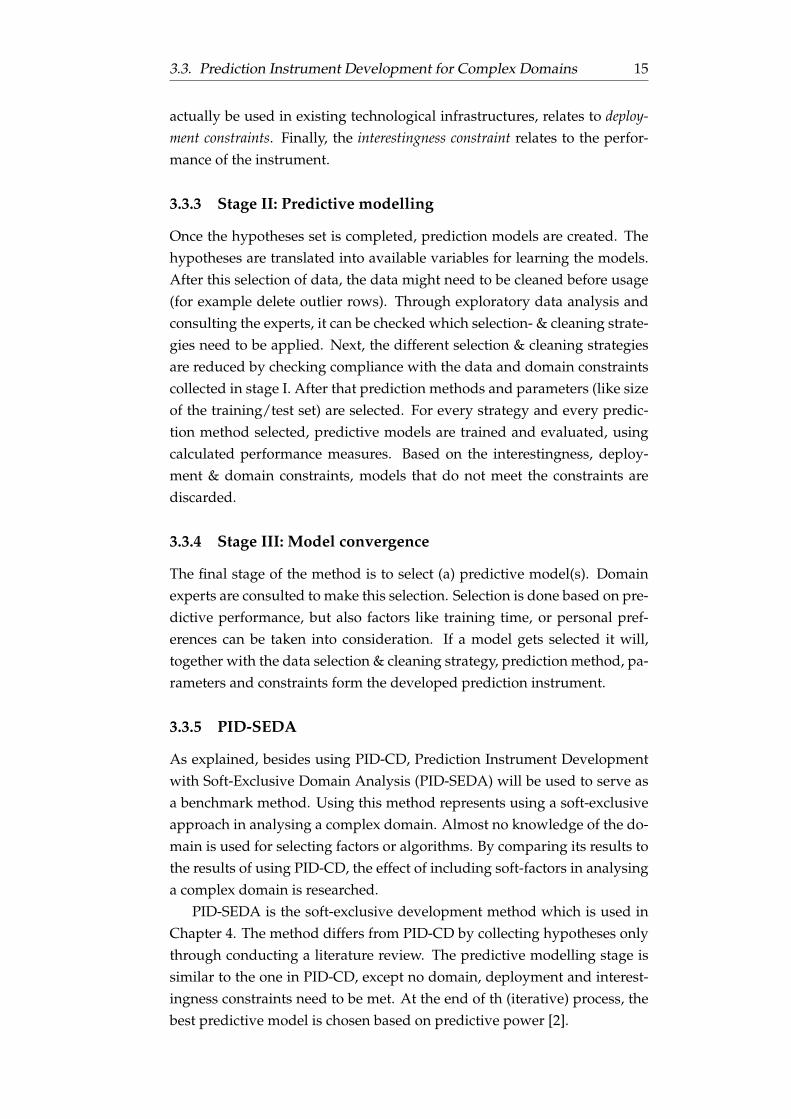
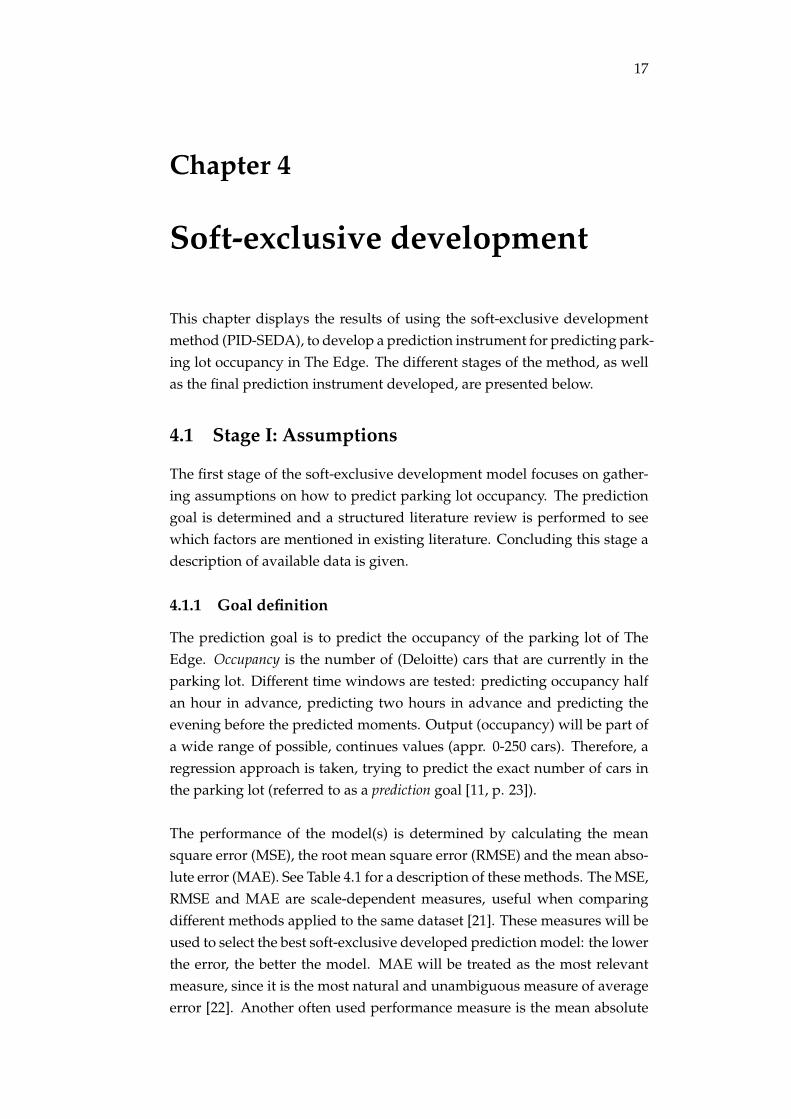
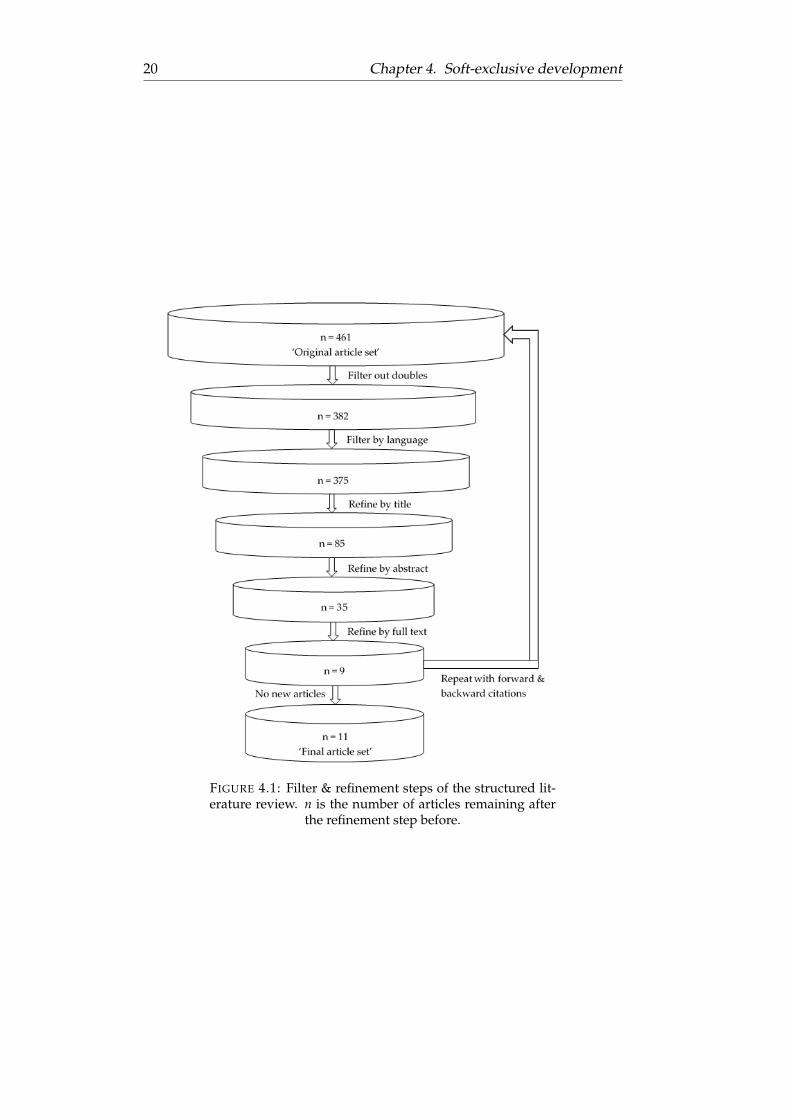
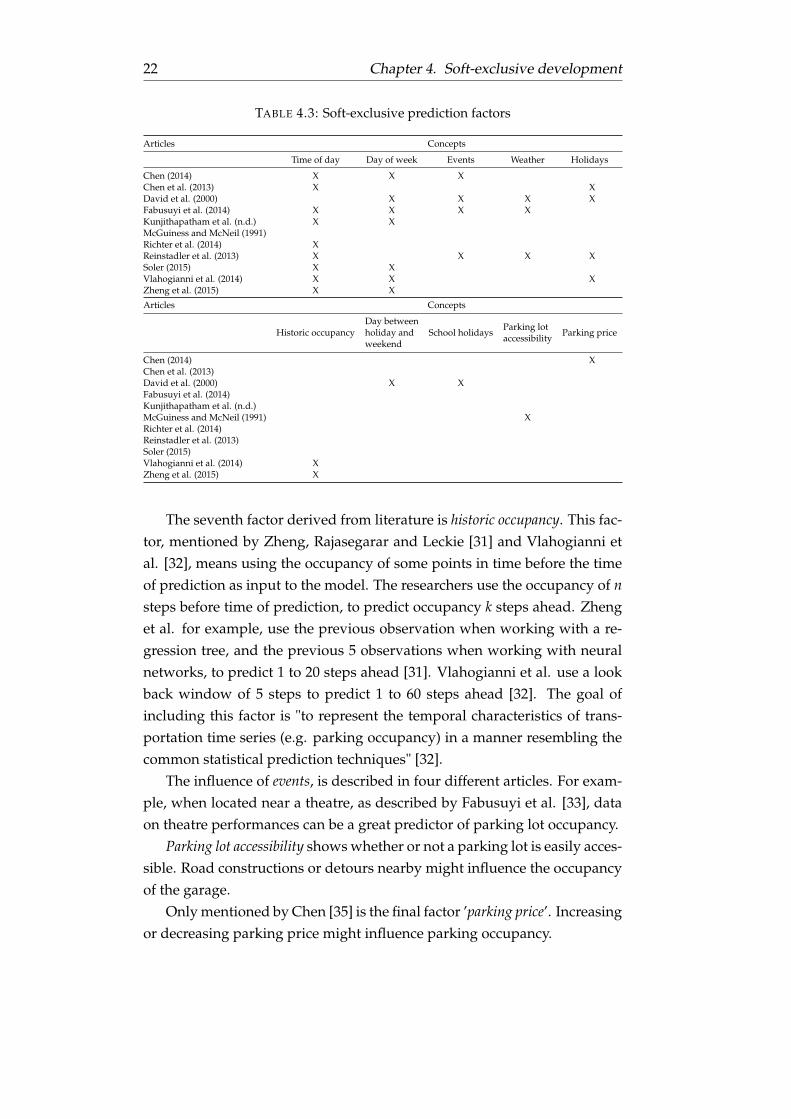
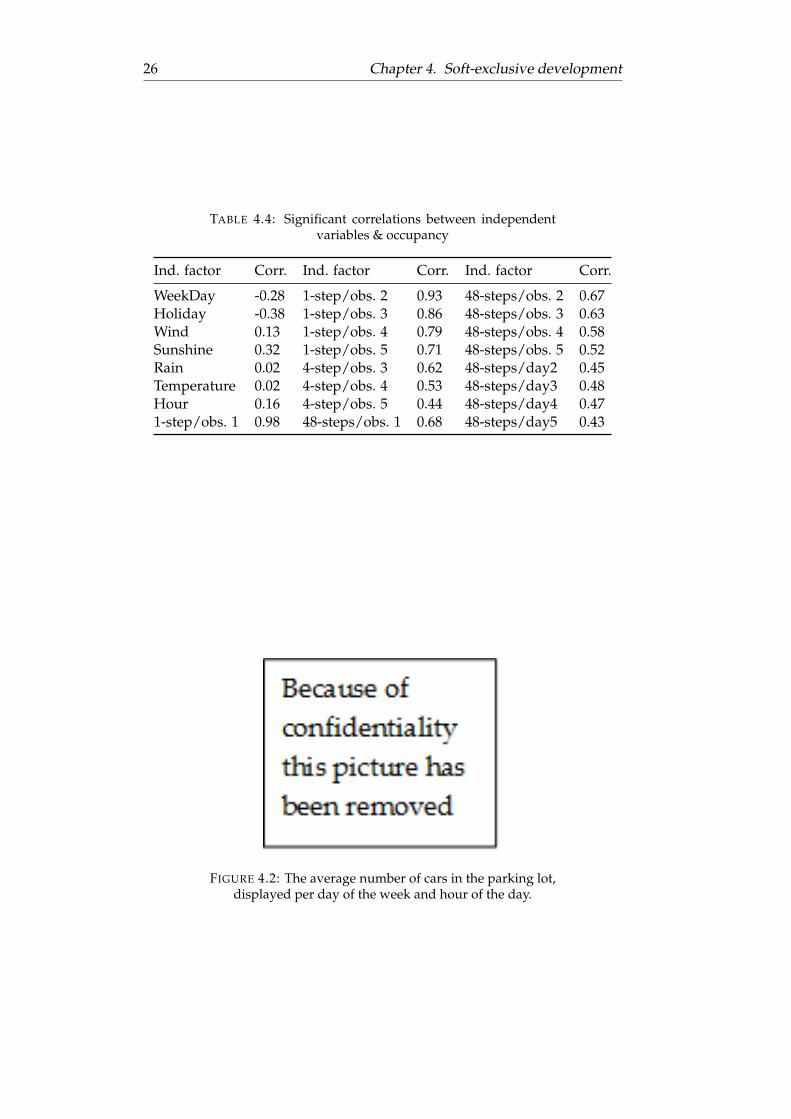
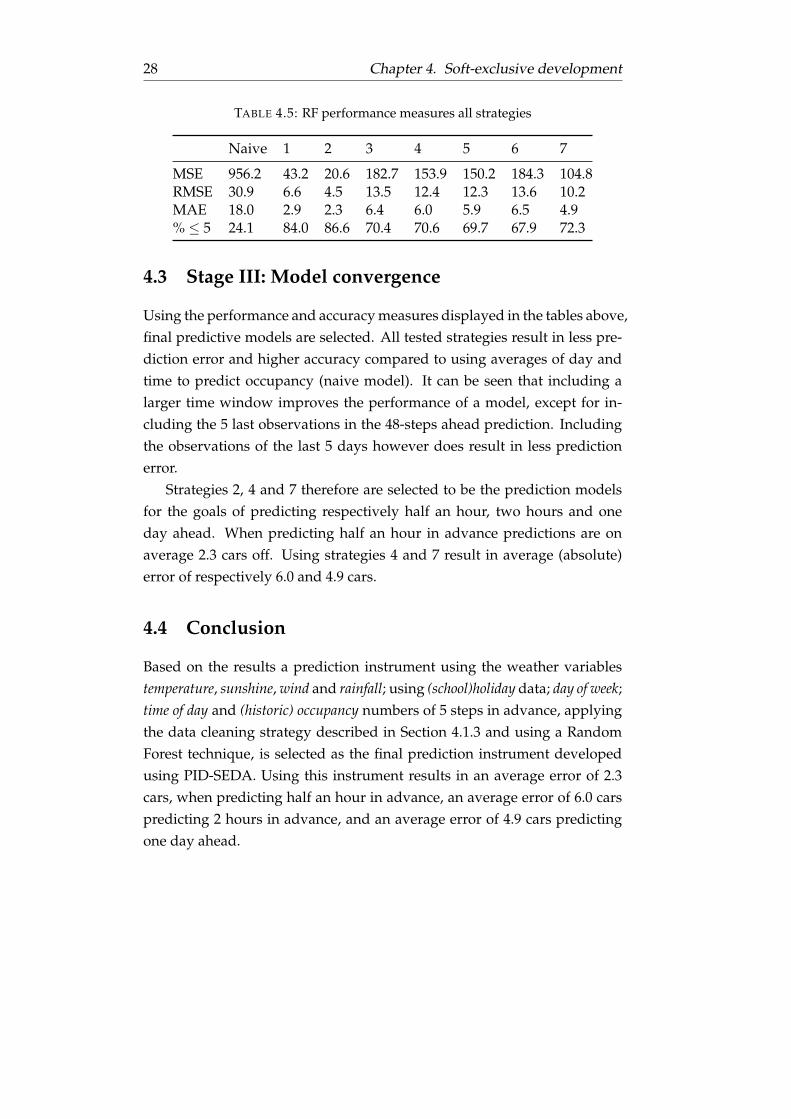
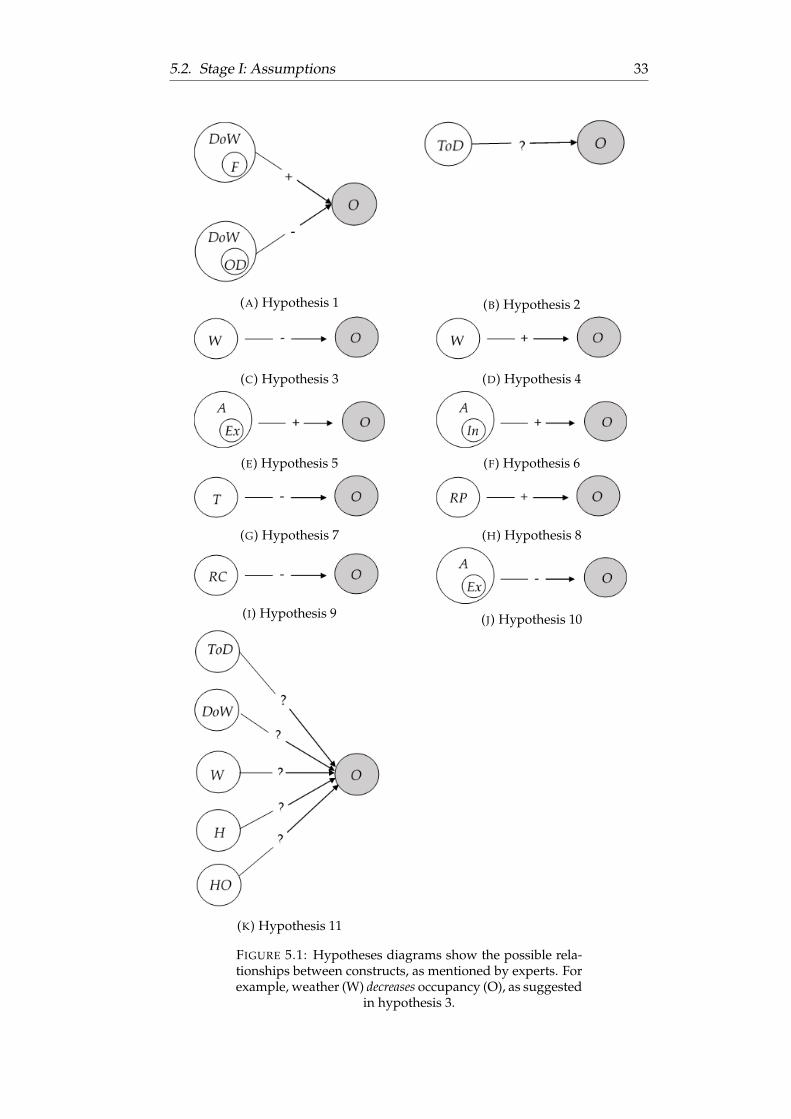
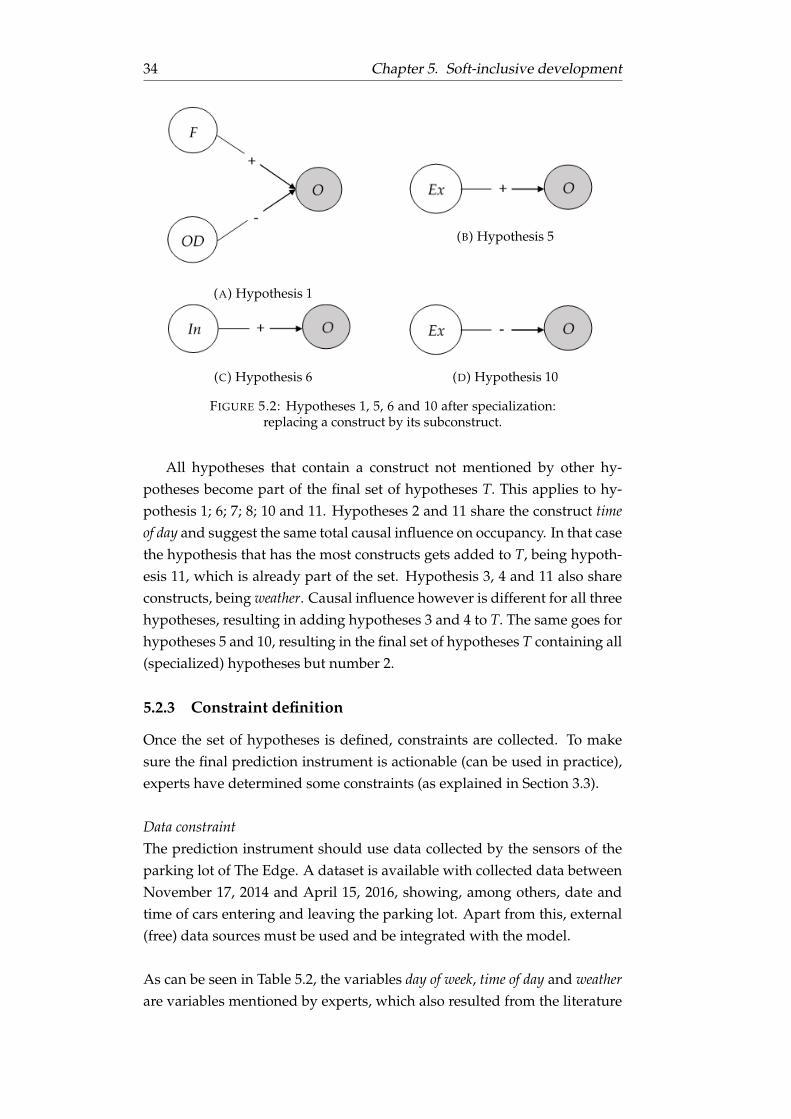
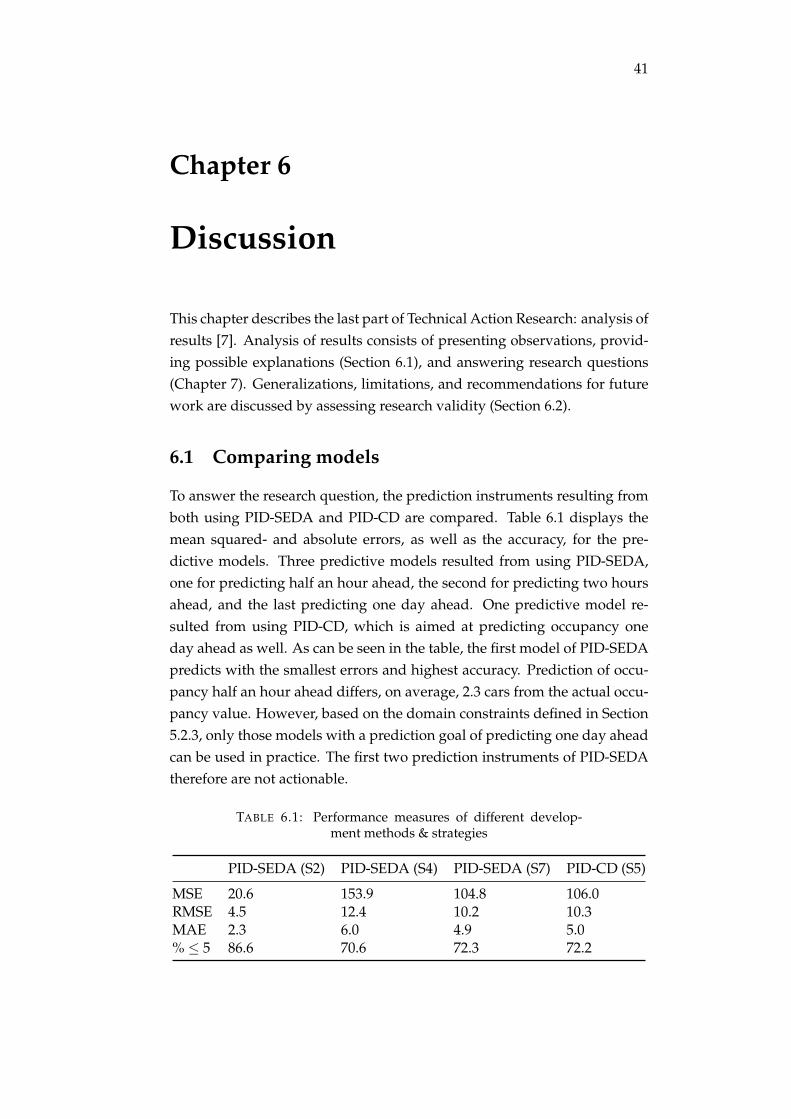
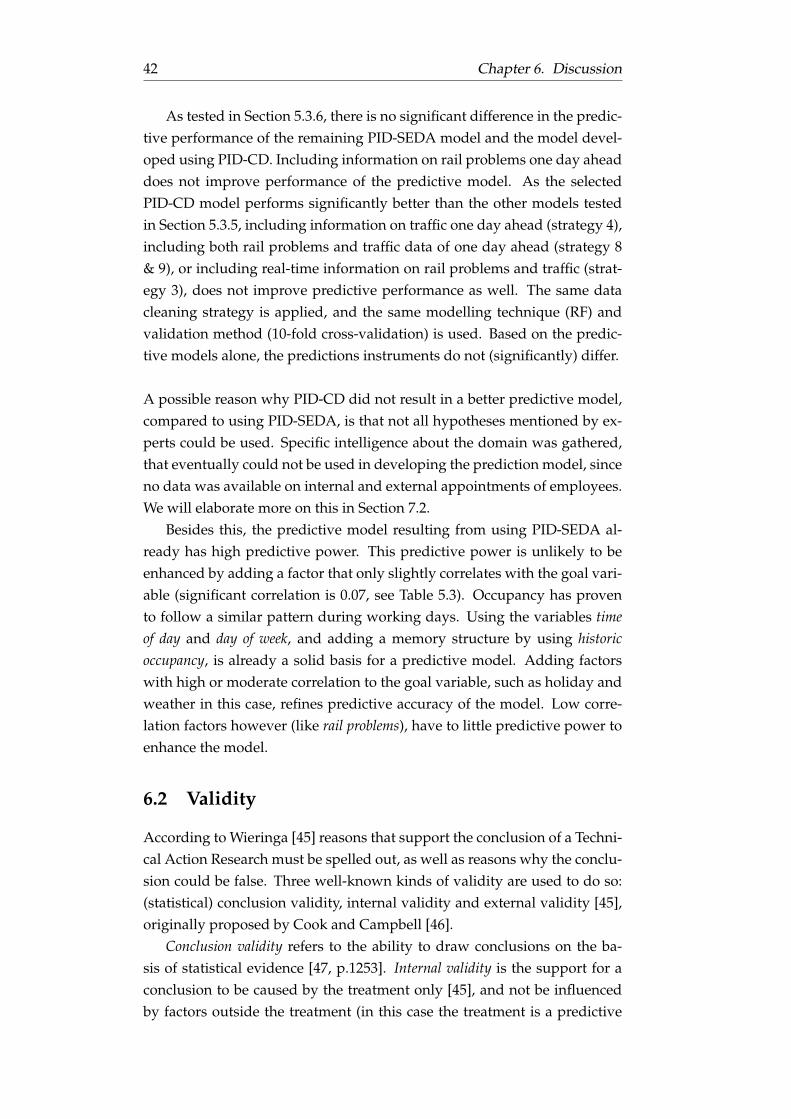
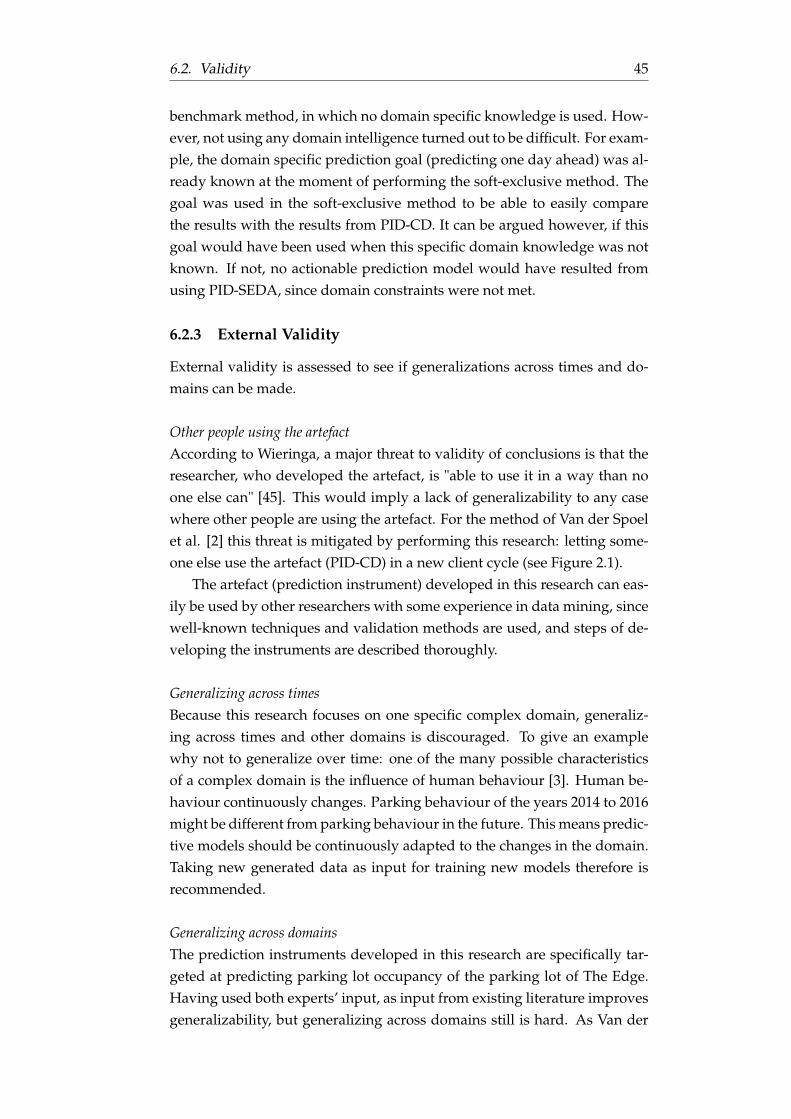