predicting suitability of upland rice for adoption as food...
TRANSCRIPT
Journal of Geography and Earth Sciences June 2017, Vol. 5, No. 1, pp. 26-40
ISSN 2334-2447 (Print) 2334-2455 (Online) Copyright © The Author(s). All Rights Reserved.
Published by American Research Institute for Policy Development DOI: 10.15640/jges.v5n1a2
URL: https://doi.org/10.15640/jges.v5n1a2
Predicting Suitability of Upland Rice for Adoption as Food Security and Poverty
Alleviation Crop in Uganda
Ojara Moses .A1,2 , Olivier Ann2, Aribo Lawrence1, Bob Alex Ogwang1,3 & Wasswa Peter4
Abstract
This study was carried out in Uganda with the aim of developing a suitability map for upland rice crop based on physio-chemical soil properties and climatic factors. The analysis used physio-chemical variables of soil pH, Cation Exchange Capacity of the soils (CEC), Soil organic carbon (SOC), Digital elevation (DEM) and 19 bioclimatic variables. The physio-chemical suitability maps were derived using Geographical information system approach based on weighted overlay analysis in ArcGIS10.3, while the climate suitability map was generated using MaxEnt species distribution model. The cross raster overlay operations were done in ILWIS 3.3 to combine the overall physio-chemical suitability and climate suitability maps into the final Upland rice suitability map and the area under each suitability class calculated. The overall results show that 18.1% (43598.71km2) of the arable land is suitable (S) for Upland rice production while another 20.8% (50135.63km2) is moderately suitable (MS) for Upland rice production. About the same proportions of the combined Moderately (MS) and Suitable (S), 37.8% (91278.96km2) is marginally suitable (mS) for Upland rice production, while just above 23.4 % (56376. 9km2) of the Arable land is currently not suitable (nS) for Upland rice production.
Keywords: MaxEnt Models, Weighted Overlay Analysis, GIS, Bioclimatic Variables
1.0 Introduction
Rice is one of the most important crop for many countries globally where it provide about thirds of the calory intake of more than 3 billion people in Asia (FAO,1995, Tran 1997). Consumption of Rice in Africa has greatly increased due rapid urbanization and population increase in most countries but this is still low compared to other Asian countries and European countries according to European commission Rice fact sheet (Chauvin et al., 2012; Oonyu, 2011; EU, 2016). In East Africa, it is stated that more than 1.5 million farming households directly use rice for food and income security with average, smallholder producers earning about US$ 550per household per year from rice production enterprises (Kilimotrust, 2015). In Uganda particularly, Rice production is a major intervention identified by the Government of Uganda in their Strategy for development and investment for 2009/10 -2013/14 for food security and poverty reduction (GOU, 2009). The strategies in this plans includes; strengthening the various institutional framework; improving rice research and level of technology dissemination and building capacity at most levels of production, continuous multiplication and dissemination of quality certified seed, support producers to improve irrigation and water management capacities, increase utilization of farm-inputs and conservation and soil management, improve post-harvest handling, processing and marketing, mechanization; provision of agricultural 1Uganda National Meteorological Authority, P. O. Box 7025, Kampala, Uganda. 2 University of Salzburg, SA study Center, PGP 1280 South Africa 3 College of Atmospheric Science, Nanjing University of Information Science and Technology, Nanjing, Jiangsu, 210044, P. R. China 4 4Department of Geography, Geo-Informatics and Climatic Sciences, Makerere University, P. O. Box 7062, Kampala, Uganda

Ojara et.al. 27
finance; and, finally policy development (GOU, 2009). The target was to increase rice production in Uganda from the estimated 165,000 tonnes to an approximated 334,250 tonnes in 2013 and later to about 499,200 tonnes in 2018 (GOU, 2009), this mainly was done on the sensitive wetlands in Uganda.
With Climate change already impacting negatively on Africa, Uganda inclusive, there is need to protect the Wetlands and lowlands which are the main components of Hydrological cycle which will impact further onto the highly uncertain rainfed agriculture of Uganda (Mubiru et al., 2012). Therefore, there is need to shift from wetland and lowland rice production to production on Upland rice. To achieve this, the Government of Uganda has embarked on mass campaign countrywide to promote upland rice production. This attempt to increase rice production is barely on assumption that the production areas continue to be available for expansion country wide. However, detailed suitability of possible areas for expansion is not well studied and available information is scanty. The few studies conducted in Uganda mainly focused on various market channels, profitability analysis and determination of changing behaviors of NERICA adoption respectively (Kikuchi et al., 2013; Kraybill et al., 2009; Kijima et al., 2009). This study seeks to generate a detailed suitability map for upland production from physio-chemical and climate suitability maps of Upland rice in Uganda before adapting to Upland rice production as a food security and poverty alleviation crop.
2.0 Data and Methodologies
2.1 The Study Area
Uganda is located in East Africa between latitudes of 2°S to 5°N, and longitude 29.57oE to 35.002oE on the East African Plateau. The study area is bordered by Southern Sudan in the North, Tanzania and Rwanda in the southern part and it shares the border with Democratic Republic of the Congo to the West and Kenya to the East
Fig1: Location of Study Area (Uganda)
2.2 Climate of the Study Area
Uganda's climate is tropical, generally rainy, particularly during the months of March to May, September to November, while December to February, June to August are usually dry. Rainfall averages 900-1,300 mm per annum and the favorable climate all over of the country. Seasonal rainfall in Uganda is driven mainly by the movement of the Inter‐Tropical Convergence Zone (ITCZ), which is narrow belt of very low pressure and with heavy precipitation that formed near the earth’s equator. Usually the average temperatures in the coolest parts of the south‐west regions remain below 24°C, and may reach 32°C in the northernmost parts or more on climate zones of Uganda.
28 Journal of Geography and Earth Sciences, Vol. 5(1), June 2017 3.0.0 Materials
3.1.1 Presence Points and Absence Points of Upland Rice
Presence data for modeling in MaxEnt were generated based on Rice production area in the districts of Uganda in addition to the GPS points taken by the Researchers from National Crops Resources Research Institute (NaCCRI). In order to minimize agglomeration of points, a random selection of approximately 357 points, derived from a stratified sample which was based on a cluster environment was selected in excel software. A total of 1000 background points which are sometimes called pseudo-absences were generated based on areas where there is no rice were generated based on the recommendation of (Massin et al., 2011). The random points for absence points were generated from areas where there were is no upland rice production, such areas include steep slope of mountain Rwenzori and Elgon, the dry areas in Moroto and Kotido, water logged or lowland areas of Eastern districts of Kumi, Pallisa, Soroti, Kaberamaido, Butaleja etc.
3.2.2 Climate data and Bioclimatic Variables
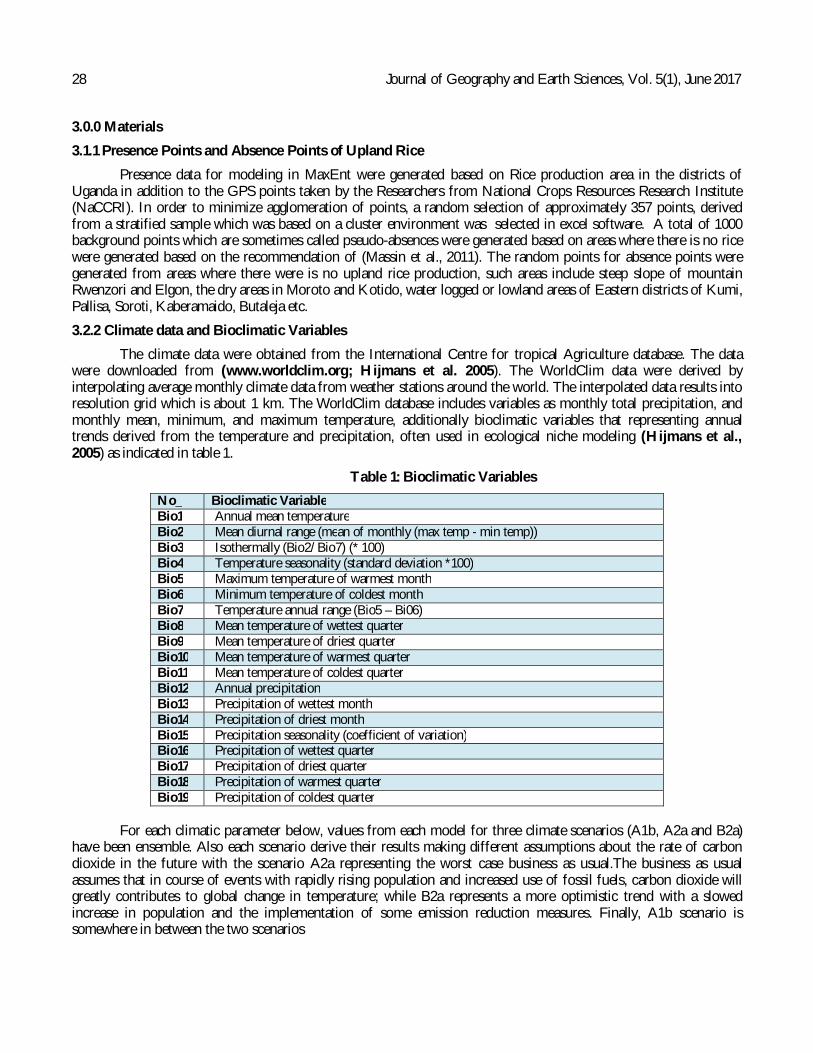
The climate data were obtained from the International Centre for tropical Agriculture database. The data were downloaded from (www.worldclim.org; Hijmans et al. 2005). The WorldClim data were derived by interpolating average monthly climate data from weather stations around the world. The interpolated data results into resolution grid which is about 1 km. The WorldClim database includes variables as monthly total precipitation, and monthly mean, minimum, and maximum temperature, additionally bioclimatic variables that representing annual trends derived from the temperature and precipitation, often used in ecological niche modeling (Hijmans et al., 2005) as indicated in table 1.
Table 1: Bioclimatic Variables
No_ Bioclimatic Variable Bio1 Annual mean temperature Bio2 Mean diurnal range (mean of monthly (max temp - min temp)) Bio3 Isothermally (Bio2/Bio7) (* 100) Bio4 Temperature seasonality (standard deviation *100) Bio5 Maximum temperature of warmest month Bio6 Minimum temperature of coldest month Bio7 Temperature annual range (Bio5 – Bi06) Bio8 Mean temperature of wettest quarter Bio9 Mean temperature of driest quarter Bio10 Mean temperature of warmest quarter Bio11 Mean temperature of coldest quarter Bio12 Annual precipitation Bio13 Precipitation of wettest month Bio14 Precipitation of driest month Bio15 Precipitation seasonality (coefficient of variation) Bio16 Precipitation of wettest quarter Bio17 Precipitation of driest quarter Bio18 Precipitation of warmest quarter Bio19 Precipitation of coldest quarter
For each climatic parameter below, values from each model for three climate scenarios (A1b, A2a and B2a)
have been ensemble. Also each scenario derive their results making different assumptions about the rate of carbon dioxide in the future with the scenario A2a representing the worst case business as usual.The business as usual assumes that in course of events with rapidly rising population and increased use of fossil fuels, carbon dioxide will greatly contributes to global change in temperature; while B2a represents a more optimistic trend with a slowed increase in population and the implementation of some emission reduction measures. Finally, A1b scenario is somewhere in between the two scenarios
Ojara et.al. 29
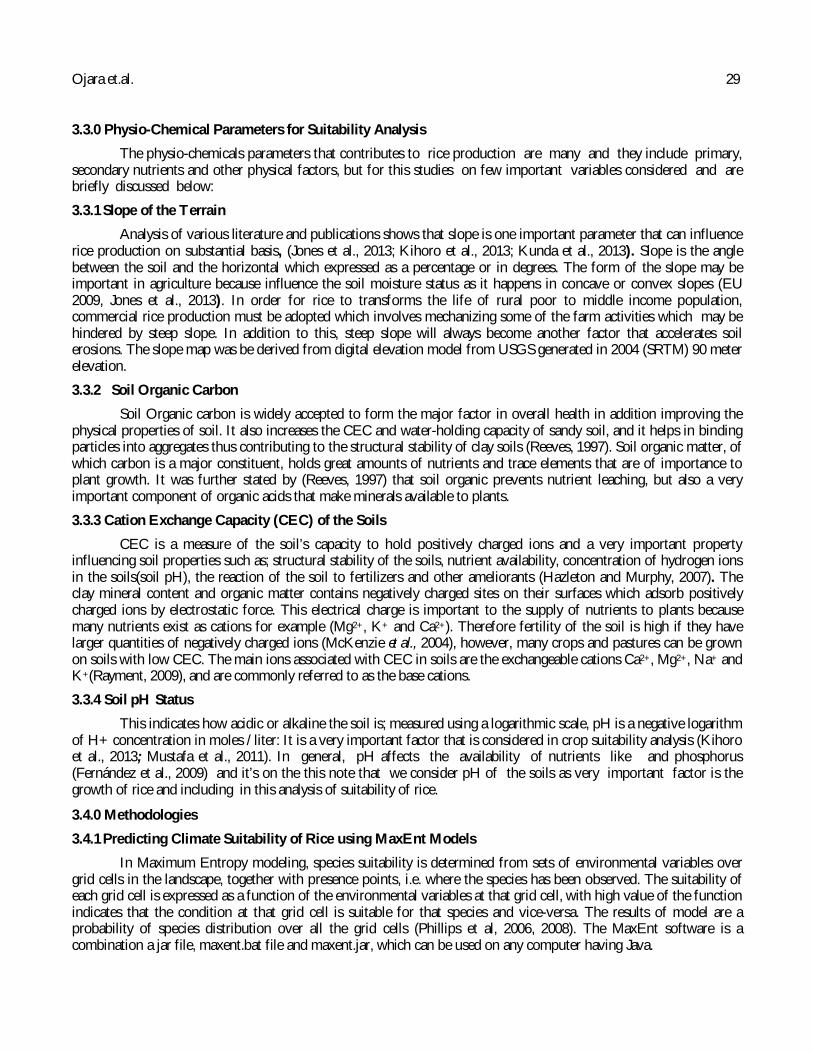
3.3.0 Physio-Chemical Parameters for Suitability Analysis
The physio-chemicals parameters that contributes to rice production are many and they include primary, secondary nutrients and other physical factors, but for this studies on few important variables considered and are briefly discussed below:
3.3.1 Slope of the Terrain
Analysis of various literature and publications shows that slope is one important parameter that can influence rice production on substantial basis, (Jones et al., 2013; Kihoro et al., 2013; Kunda et al., 2013). Slope is the angle between the soil and the horizontal which expressed as a percentage or in degrees. The form of the slope may be important in agriculture because influence the soil moisture status as it happens in concave or convex slopes (EU 2009, Jones et al., 2013). In order for rice to transforms the life of rural poor to middle income population, commercial rice production must be adopted which involves mechanizing some of the farm activities which may be hindered by steep slope. In addition to this, steep slope will always become another factor that accelerates soil erosions. The slope map was be derived from digital elevation model from USGS generated in 2004 (SRTM) 90 meter elevation.
3.3.2 Soil Organic Carbon
Soil Organic carbon is widely accepted to form the major factor in overall health in addition improving the physical properties of soil. It also increases the CEC and water-holding capacity of sandy soil, and it helps in binding particles into aggregates thus contributing to the structural stability of clay soils (Reeves, 1997). Soil organic matter, of which carbon is a major constituent, holds great amounts of nutrients and trace elements that are of importance to plant growth. It was further stated by (Reeves, 1997) that soil organic prevents nutrient leaching, but also a very important component of organic acids that make minerals available to plants.
3.3.3 Cation Exchange Capacity (CEC) of the Soils
CEC is a measure of the soil’s capacity to hold positively charged ions and a very important property influencing soil properties such as; structural stability of the soils, nutrient availability, concentration of hydrogen ions in the soils(soil pH), the reaction of the soil to fertilizers and other ameliorants (Hazleton and Murphy, 2007). The clay mineral content and organic matter contains negatively charged sites on their surfaces which adsorb positively charged ions by electrostatic force. This electrical charge is important to the supply of nutrients to plants because many nutrients exist as cations for example (Mg2+, K+ and Ca2+). Therefore fertility of the soil is high if they have larger quantities of negatively charged ions (McKenzie et al., 2004), however, many crops and pastures can be grown on soils with low CEC. The main ions associated with CEC in soils are the exchangeable cations Ca2+, Mg2+, Na+ and K+(Rayment, 2009), and are commonly referred to as the base cations.
3.3.4 Soil pH Status
This indicates how acidic or alkaline the soil is; measured using a logarithmic scale, pH is a negative logarithm of H+ concentration in moles /liter: It is a very important factor that is considered in crop suitability analysis (Kihoro et al., 2013; Mustafa et al., 2011). In general, pH affects the availability of nutrients like and phosphorus (Fernández et al., 2009) and it’s on the this note that we consider pH of the soils as very important factor is the growth of rice and including in this analysis of suitability of rice.
3.4.0 Methodologies
3.4.1 Predicting Climate Suitability of Rice using MaxEnt Models
In Maximum Entropy modeling, species suitability is determined from sets of environmental variables over grid cells in the landscape, together with presence points, i.e. where the species has been observed. The suitability of each grid cell is expressed as a function of the environmental variables at that grid cell, with high value of the function indicates that the condition at that grid cell is suitable for that species and vice-versa. The results of model are a probability of species distribution over all the grid cells (Phillips et al, 2006, 2008). The MaxEnt software is a combination a jar file, maxent.bat file and maxent.jar, which can be used on any computer having Java.
30 Journal of Geography and Earth Sciences, Vol. 5(1), June 2017
The presence points consist of the name of species in question, (Rice) in one column, Latitude and Longitude of the location where rice is observed in the other columns attached to 19 the Bioclimatic Variables in other columns. Similarly, the absence/or background points consisting of latitude and longitude where the species (Rice) is not observed attached to 19 the Bioclimatic Variables in other columns. The Climate variables must be in ESRI ASCII grid format or grid format and same spatial extent in another folder.
3.4.2 Methodology for Physio-Chemical Suitability Analysis
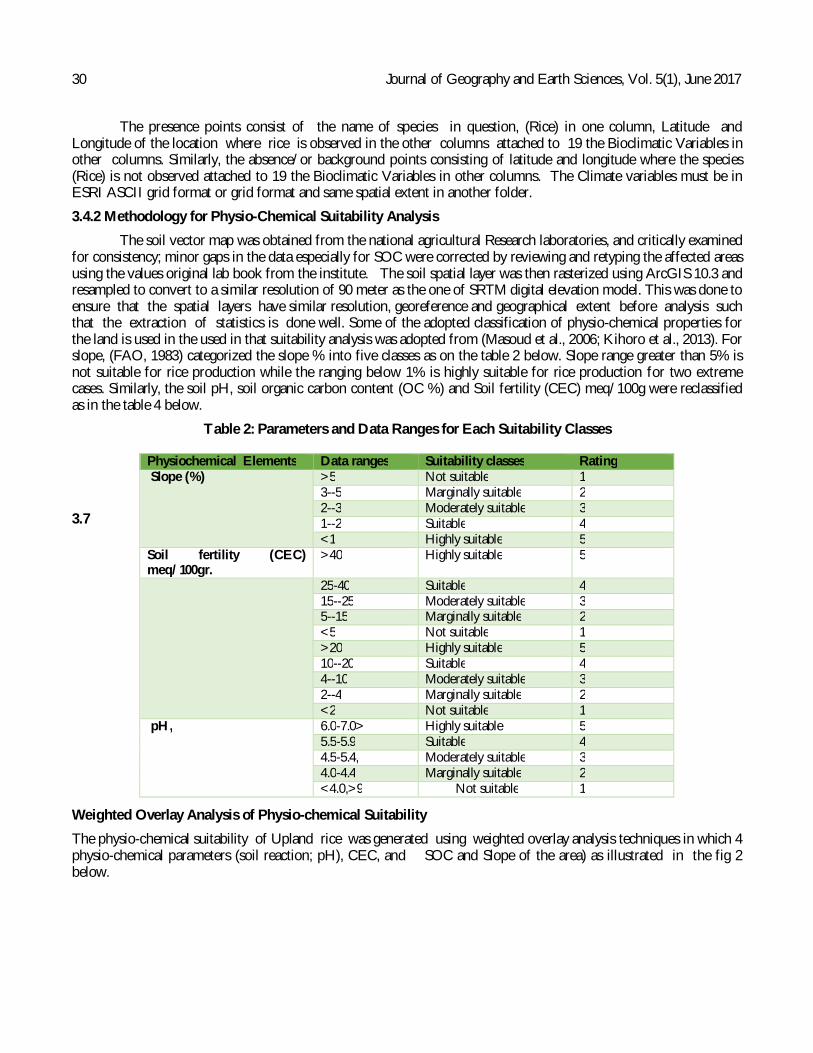
The soil vector map was obtained from the national agricultural Research laboratories, and critically examined for consistency; minor gaps in the data especially for SOC were corrected by reviewing and retyping the affected areas using the values original lab book from the institute. The soil spatial layer was then rasterized using ArcGIS 10.3 and resampled to convert to a similar resolution of 90 meter as the one of SRTM digital elevation model. This was done to ensure that the spatial layers have similar resolution, georeference and geographical extent before analysis such that the extraction of statistics is done well. Some of the adopted classification of physio-chemical properties for the land is used in the used in that suitability analysis was adopted from (Masoud et al., 2006; Kihoro et al., 2013). For slope, (FAO, 1983) categorized the slope % into five classes as on the table 2 below. Slope range greater than 5% is not suitable for rice production while the ranging below 1% is highly suitable for rice production for two extreme cases. Similarly, the soil pH, soil organic carbon content (OC %) and Soil fertility (CEC) meq/100g were reclassified as in the table 4 below.
Table 2: Parameters and Data Ranges for Each Suitability Classes
3.7
Weighted Overlay Analysis of Physio-chemical Suitability
The physio-chemical suitability of Upland rice was generated using weighted overlay analysis techniques in which 4 physio-chemical parameters (soil reaction; pH), CEC, and SOC and Slope of the area) as illustrated in the fig 2 below.
Physiochemical Elements Data ranges Suitability classes Rating Slope (%) >5 Not suitable 1
3--5 Marginally suitable 2 2--3 Moderately suitable 3 1--2 Suitable 4 <1 Highly suitable 5
Soil fertility (CEC) meq/100gr.
>40 Highly suitable 5
25-40 Suitable 4 15--25 Moderately suitable 3 5--15 Marginally suitable 2 <5 Not suitable 1 >20 Highly suitable 5 10--20 Suitable 4 4--10 Moderately suitable 3 2--4 Marginally suitable 2 <2 Not suitable 1
pH, 6.0-7.0> Highly suitable 5 5.5-5.9 Suitable 4 4.5-5.4, Moderately suitable 3 4.0-4.4 Marginally suitable 2 <4.0,>9 Not suitable 1
Ojara et.al. 31
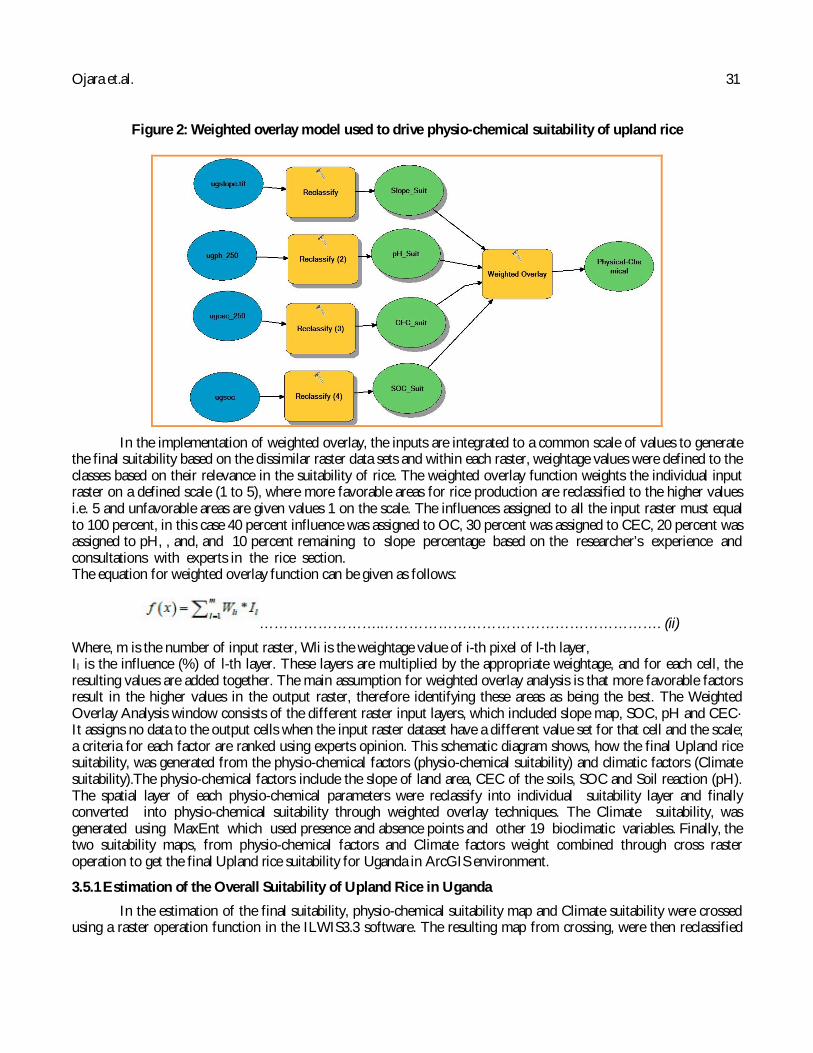
Figure 2: Weighted overlay model used to drive physio-chemical suitability of upland rice
In the implementation of weighted overlay, the inputs are integrated to a common scale of values to generate the final suitability based on the dissimilar raster data sets and within each raster, weightage values were defined to the classes based on their relevance in the suitability of rice. The weighted overlay function weights the individual input raster on a defined scale (1 to 5), where more favorable areas for rice production are reclassified to the higher values i.e. 5 and unfavorable areas are given values 1 on the scale. The influences assigned to all the input raster must equal to 100 percent, in this case 40 percent influence was assigned to OC, 30 percent was assigned to CEC, 20 percent was assigned to pH, , and, and 10 percent remaining to slope percentage based on the researcher’s experience and consultations with experts in the rice section. The equation for weighted overlay function can be given as follows:
…………………….…………………………………………………. (ii)
Where, m is the number of input raster, Wli is the weightage value of i-th pixel of l-th layer, Il is the influence (%) of l-th layer. These layers are multiplied by the appropriate weightage, and for each cell, the resulting values are added together. The main assumption for weighted overlay analysis is that more favorable factors result in the higher values in the output raster, therefore identifying these areas as being the best. The Weighted Overlay Analysis window consists of the different raster input layers, which included slope map, SOC, pH and CEC· It assigns no data to the output cells when the input raster dataset have a different value set for that cell and the scale; a criteria for each factor are ranked using experts opinion. This schematic diagram shows, how the final Upland rice suitability, was generated from the physio-chemical factors (physio-chemical suitability) and climatic factors (Climate suitability).The physio-chemical factors include the slope of land area, CEC of the soils, SOC and Soil reaction (pH). The spatial layer of each physio-chemical parameters were reclassify into individual suitability layer and finally converted into physio-chemical suitability through weighted overlay techniques. The Climate suitability, was generated using MaxEnt which used presence and absence points and other 19 bioclimatic variables. Finally, the two suitability maps, from physio-chemical factors and Climate factors weight combined through cross raster operation to get the final Upland rice suitability for Uganda in ArcGIS environment.
3.5.1 Estimation of the Overall Suitability of Upland Rice in Uganda
In the estimation of the final suitability, physio-chemical suitability map and Climate suitability were crossed using a raster operation function in the ILWIS3.3 software. The resulting map from crossing, were then reclassified
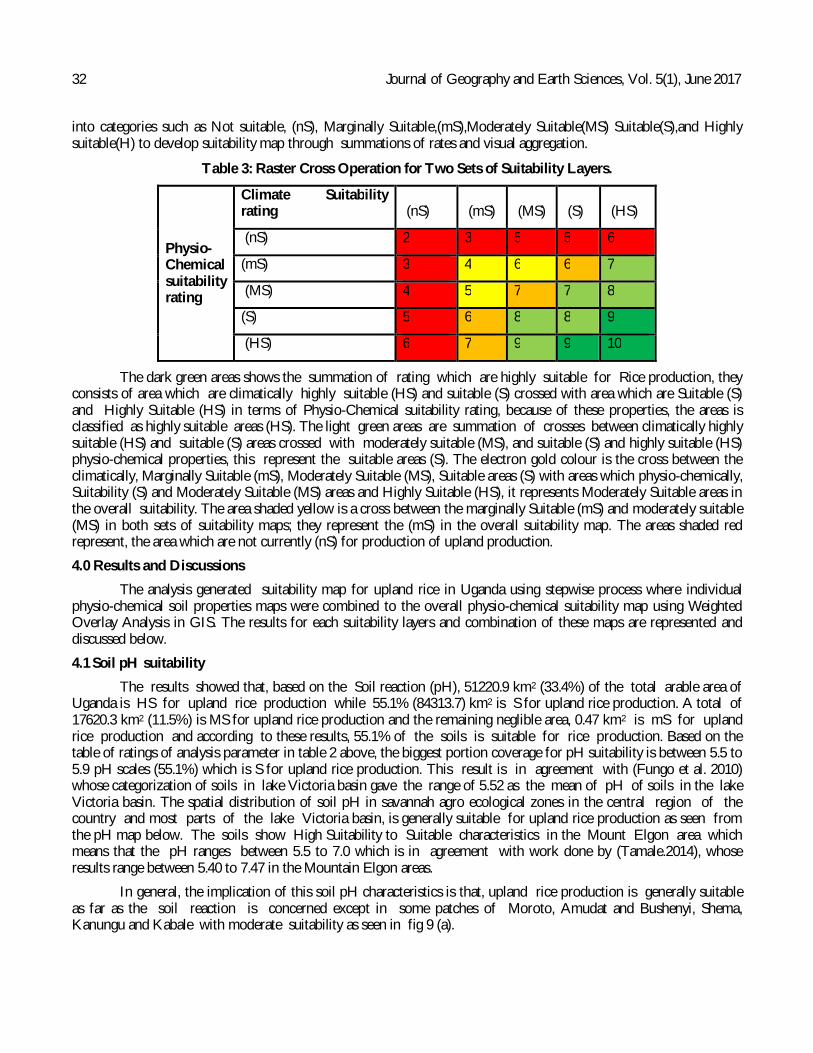
32 Journal of Geography and Earth Sciences, Vol. 5(1), June 2017 into categories such as Not suitable, (nS), Marginally Suitable,(mS),Moderately Suitable(MS) Suitable(S),and Highly suitable(H) to develop suitability map through summations of rates and visual aggregation.
Table 3: Raster Cross Operation for Two Sets of Suitability Layers.
Physio-Chemical suitability rating
Climate Suitability rating (nS) (mS) (MS) (S) (HS)
(nS) 2 3 5 5 6
(mS) 3 4 6 6 7
(MS) 4 5 7 7 8
(S) 5 6 8 8 9
(HS) 6 7 9 9 10
The dark green areas shows the summation of rating which are highly suitable for Rice production, they consists of area which are climatically highly suitable (HS) and suitable (S) crossed with area which are Suitable (S) and Highly Suitable (HS) in terms of Physio-Chemical suitability rating, because of these properties, the areas is classified as highly suitable areas (HS). The light green areas are summation of crosses between climatically highly suitable (HS) and suitable (S) areas crossed with moderately suitable (MS), and suitable (S) and highly suitable (HS) physio-chemical properties, this represent the suitable areas (S). The electron gold colour is the cross between the climatically, Marginally Suitable (mS), Moderately Suitable (MS), Suitable areas (S) with areas which physio-chemically, Suitability (S) and Moderately Suitable (MS) areas and Highly Suitable (HS), it represents Moderately Suitable areas in the overall suitability. The area shaded yellow is a cross between the marginally Suitable (mS) and moderately suitable (MS) in both sets of suitability maps; they represent the (mS) in the overall suitability map. The areas shaded red represent, the area which are not currently (nS) for production of upland production.
4.0 Results and Discussions
The analysis generated suitability map for upland rice in Uganda using stepwise process where individual physio-chemical soil properties maps were combined to the overall physio-chemical suitability map using Weighted Overlay Analysis in GIS. The results for each suitability layers and combination of these maps are represented and discussed below.
4.1 Soil pH suitability
The results showed that, based on the Soil reaction (pH), 51220.9 km2 (33.4%) of the total arable area of Uganda is HS for upland rice production while 55.1% (84313.7) km2 is S for upland rice production. A total of 17620.3 km2 (11.5%) is MS for upland rice production and the remaining neglible area, 0.47 km2 is mS for upland rice production and according to these results, 55.1% of the soils is suitable for rice production. Based on the table of ratings of analysis parameter in table 2 above, the biggest portion coverage for pH suitability is between 5.5 to 5.9 pH scales (55.1%) which is S for upland rice production. This result is in agreement with (Fungo et al. 2010) whose categorization of soils in lake Victoria basin gave the range of 5.52 as the mean of pH of soils in the lake Victoria basin. The spatial distribution of soil pH in savannah agro ecological zones in the central region of the country and most parts of the lake Victoria basin, is generally suitable for upland rice production as seen from the pH map below. The soils show High Suitability to Suitable characteristics in the Mount Elgon area which means that the pH ranges between 5.5 to 7.0 which is in agreement with work done by (Tamale.2014), whose results range between 5.40 to 7.47 in the Mountain Elgon areas.
In general, the implication of this soil pH characteristics is that, upland rice production is generally suitable as far as the soil reaction is concerned except in some patches of Moroto, Amudat and Bushenyi, Shema, Kanungu and Kabale with moderate suitability as seen in fig 9 (a).
Ojara et.al. 33
4.2 Topography /Slope Suitability
As far as slope of the land is concerned, 51.8 % (79388.5 km2) is HS for upland rice production and 25.1% (38500 km2) is S, 8.3% 12669.8 km2) is MS,6.0% (9254.3km2) is mS for rice production. Just about 9% (13342.4 km2) is N for rice production. The mountainous regions of Uganda show non suitability characteristics as expected because of steep slopes, while the flat land of savannah again show high rating for Upland rice suitability production. As expected, most mountainous region of the country such as Elgon area, Moroto, and region of western region in Kanungu, Kabale and Rukugiri are classified as not suitable (nS). For massive commercial production of upland rice, agricultural land used for production is constrained by both elevation and slope. It is true that high elevations have similar constraints as high latitudes, including decreased temperature, increased wind velocity, and poor soil. It is these secondary characteristics that constrain crop cultivation rather than high elevation itself (Singh et al., 2004). South western Uganda and Mount Elgon region have the terrain that is too rugged (steep slopes) which is not readily accessible for mechanized agriculture; they appear nS in the slope suitability map. In addition, terrain indirectly effects soil formation, modifies climates, and affects water drainage and availability. Steep slopes are subject to soil and nutrient loss (Baker, 2013).However (Okuonzia, 2014 unpublished) states that the oldest and most cultivated slopes are the gentle ones (0-44%) and recently a lot of farm activities are taking place on the steep slopes of up to 67%, in the south western region were plots are approximately less than 12 years and cultivation has been gradually ascending these slopes.In contrast, very flat terrain is prone to flooding and poorly drained soils, this case is common in the Lake Kyoga catchment which is generally flat and most areas such as Serere, Soroti, and Kaberamaido usually experiences floods. The spatial visualization of these classes are represented in the map below in fig 9 (b) below. The effects of slope on upland rice production is pronounce and established by scientist to decrease with increasing slope percentage (Tatsushi Tsuboi, 2002), this is attributed to increasing water table were the crops are not able to access enough water.
4.3 Suitability of CEC
The results also show that most soils of Uganda have low CEC which are reclassify here as currently not suitable (nS). 0.02% and 54.3% (83185.1km2) is marginally (mS) reported by (Labarge et al., 2012). Soil CEC greater 40 indicates the presence of smectite minerals in the soil. These soils will have a high shrink and swell potential thus structural resience. The spatial distribution of CEC show that most part of North Eastern Uganda, area of Karamoja, Kotido, Moroto, Amudat and Northern Districts of Kitgum, Amuru and Pader are observed to have Moderate and Highly suitable CEC. The vast majority Central region and most part of lower Elgon areas in the Districts of Tororo, Bududa, Butaleja and Pallisa show marginal suitability characteristics, similar to most parts of Mid-Western regions as represented in the fig 16 below.
4.4 Suitability of SOC
The major challenge sis from the SOC which has 49.3% (75485.0 km2) of the total area that is Not Suitable (N) for upland rice production and 25.9% (39610.55 km2) is marginally suitable (mS) while areas that are moderately suitable (MS) and Suitable (S) occupy about 11.8% (18133.45 km2) and 11.2 % (17148.47 km2) respectively. And only 1.8 % (2777.6km2) is highly suitable (HS) for Upland rice production. The low agronomic productivity of soils in developing countries like Uganda is partly attributed to human-induced soil degradation and the attendant decline in soil quality (Lal, 2004; Feller et al. 2012). Further, it is also noted that soil quality and agronomic productivity are strongly linked, on one hand, soil organic carbon (SOC) and soil quality on the other hand. There are some positive correlations that exist between SOC content and many soil properties involved in fertility for tropical and subtropical areas (Feller et al., 2012). It was further stated by Feller et al. (2012) that wide used soil organic carbon by resource-poor farmers in developing countries depletes the soil organic matter (SOM) pool; degrade soil quality, and adversely affecting agronomic productivity. Thus, agricultural sustainability is dependent upon land-use and management systems that enhance high levels of SOM pool.

34 Journal of Geography and Earth Sciences, Vol. 5(1), June 2017 Fig 3. Suitability of Individual Spatial Physio-Chemical Layers: (A) pH Suitability Classes, (B) Slope Suitability Classes, (C) CEC Suitability Classes and (D) SOC Suitability Classes.
4.5 The Overall Physio-Chemical Suitability of Upland Rice
The overall physio-chemical suitability show that 90% (137839.5 km2) of Uganda arable land is moderately suitable (MS) for upland rice production and the remaining 10% (15,316 km2) is marginally suitable for Upland rice production. The overall physio-chemical suitability of the soil still follows to a large extent the productivity ratings by (Chenery, 1960). Soils formed from parent from volcanic ash especially at slopes of Mt. Elgon, on the triangle from Lake George and north of Lake Edward in western Uganda, around Fort Portal in Kabarole district, and soils around Kisoro in south-west Uganda, show moderately suitability of Upland rice. Other soils in this class include: The Deep, red or brown soils, which are usually loam or clay loam in texture and pediment occurring in what was referred to as the fertile crescent around Lake Victoria from Jinja to south Masaka extending north-east from Fort Portal volcanic ash soils into north Mubende, mainly in patches of dark-red clay loams, between Hoima and Masindi, in south-east Kabale, and around Ibanda hill in Mbarara district. Deep sedimentary soils occurring Around Bundibugyo in Bwamba County, Bundibugyo district, and in the neighbourhood of Lira and around Dokolo in the south-east of Lira district also show moderate (MS) suitability to Upland Rice production. The second class of soils are the Soils with low or nil productivity; which are Shallow or very sandy or gravelly soils which occur over much of Moroto and Kotido district, a large part of Katakwi, Kumi and Soroti districts, along Lake Kyoga and its branches and the north of central Uganda remains marginally suitable (mS) for Upland rice production.
Ojara et.al. 35
Further, in this categories of Low to nil production; include areas along the margins of Lake Victoria in central Uganda, in some parts of north and west of Masaka and Lwengo district up to Lake Wamala, and covering Singo hills north of Lake Wamala in central Uganda and most of the huge block country indicated contradictory results of having moderate (MS) suitable to Upland rice production. Declining soil fertility and agricultural productivity pose an enormous development challenge in Uganda and Sub-Saharan Africa at large which will necessitate increased adoption of improved cropping technology, water, land and management practices will be needed to reverse land degradation (Agwe, 2007). Agriculture in Sub-Saharan African countries like Uganda faces a growing soil productivity crisis because unsustainable farming activities have led severe depletion soil nutrients throughout much of the Sub-Saharan African region (Nabatte; et al., 2006, Sanchez, 2002; and FAO, 2003). Soil nutrients removed when crops are harvested or lost through erosion and leaching must be replenished (Nabatte et al., 2006).
4.6 Climate Suitability of Upland Rice in Uganda
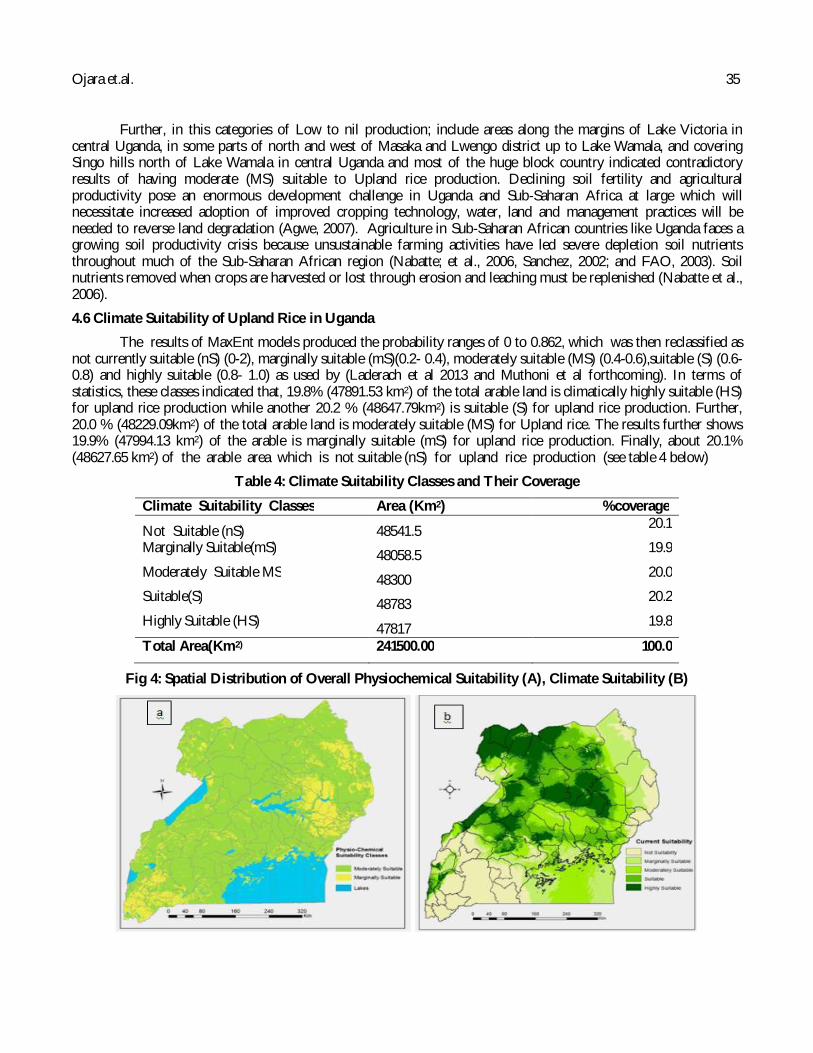
The results of MaxEnt models produced the probability ranges of 0 to 0.862, which was then reclassified as not currently suitable (nS) (0-2), marginally suitable (mS)(0.2- 0.4), moderately suitable (MS) (0.4-0.6),suitable (S) (0.6-0.8) and highly suitable (0.8- 1.0) as used by (Laderach et al 2013 and Muthoni et al forthcoming). In terms of statistics, these classes indicated that, 19.8% (47891.53 km2) of the total arable land is climatically highly suitable (HS) for upland rice production while another 20.2 % (48647.79km2) is suitable (S) for upland rice production. Further, 20.0 % (48229.09km2) of the total arable land is moderately suitable (MS) for Upland rice. The results further shows 19.9% (47994.13 km2) of the arable is marginally suitable (mS) for upland rice production. Finally, about 20.1% (48627.65 km2) of the arable area which is not suitable (nS) for upland rice production (see table 4 below)
Table 4: Climate Suitability Classes and Their Coverage
Climate Suitability Classes Area (Km2) %coverage
Not Suitable (nS) 48541.5 20.1
Marginally Suitable(mS) 48058.5 19.9
Moderately Suitable MS 48300 20.0
Suitable(S) 48783 20.2
Highly Suitable (HS) 47817 19.8
Total Area(Km2) 241500.00 100.0
Fig 4: Spatial Distribution of Overall Physiochemical Suitability (A), Climate Suitability (B)

36 Journal of Geography and Earth Sciences, Vol. 5(1), June 2017 4. 7 The Model Performance and Relative Importance of Bioclimatic Factors in the Suitability Analysis
The evaluation of the MaxEnt model shows that the modelling of the current distribution of rainfed Upland rice production areas in Uganda was robust. The modelling had high training AUC of 0.862 for generating the suitability of Upland rice. The relative contribution of bioclimatic variables and their permutation importance are given in table 6 below;
Table 6: Relative Contribution of Bioclimatic Variables
The most important variable explaining the modelled distribution of rainfed upland rice was Maximum temperature of warmest month (Bio5) which had a relative importance of 40.4 %. The jack-knife test showed that this variable had the highest training gain in modelling suitable areas for rainfed upland rice production. The second most important variable was annual mean temperature with a relative importance of 22.0% followed by temperature seasonality (standard deviation *100) (bio_4). In addition, jack-knife also showed that precipitation related variables such as (Bio15), (bio_14), and (bio_17) had less contribution to the model. Therefore, the results have indicated that temperature-related factors contributed more in the model; similarly they are determining factors in distribution of rainfed Upland rice. Temperature, radiation, relative humidity and rainfall are considered to have major effects on the growth and production of upland rice and in most areas of the world especially in the tropics, the critical determining factor for growing rice appears to be temperature,(Surajit,1981), which further supports the results from these model. Low temperature often causes low rice yields (Chung, 1979),where the temperature can go as low as 5°C, rice seedlings have to be protected from cold injury. The analysis indicated that very cold areas of Mount Elgon was not suitable for rice production similar to Mount Rwenzori and other high altitude areas of Kabale and Kanungu that usually experience low temperature in the country. It was suggested by Huke, (1976) that the upland rice production rice is influenced primarily by amount and distribution of rainfall and the influence of amount and variability of rainfall is more varied than for lowland rice. For example, upland rice is grown in areas of heavy rainfall but also grown in areas with low rainfall and possibly gives and explanation as to why the results of the model show less dependence on rainfall related factors of bioclimatic, however the rainfall ranges between 500mm to 2000 mm is said to be ideal ( De Datta et al., 1975).
4.8 Overall Suitability of Upland Rice in Uganda
The overall results show that 18.1% (43598.71km2) of the arable land is suitable (S) for Upland rice production while another 20.8% (50135.63km2) is moderately suitable (MS) for Upland rice production. About the same proportions of the combined Moderately (MS) and Suitable (S), 37.8% (91278.96km2) is marginally suitable (mS) for Upland rice production just above 23.4 % (56376. 9km2) of the arable land is not suitable (N) for Upland rice production.
Variable Percent contribution Permutation importance bio_5 40.4 0 bio_1 22 6.5 bio_4 9.1 1.6 bio_12 7.7 0.1 bio_11 4.4 5.2 bio_19 3.6 5 bio_16 2.6 16.8 bio_13 2.5 2.4 bio_6 1.8 11.2 bio_7 1.4 0.5 bio_8 1.3 15.7 bio_2 0.9 0.6 bio_18 0.7 2.5 bio_9 0.5 18.5 bio_14 0.5 0.2 bio_17 0.5 13 bio_15 0.2 0.1
Ojara et.al. 37
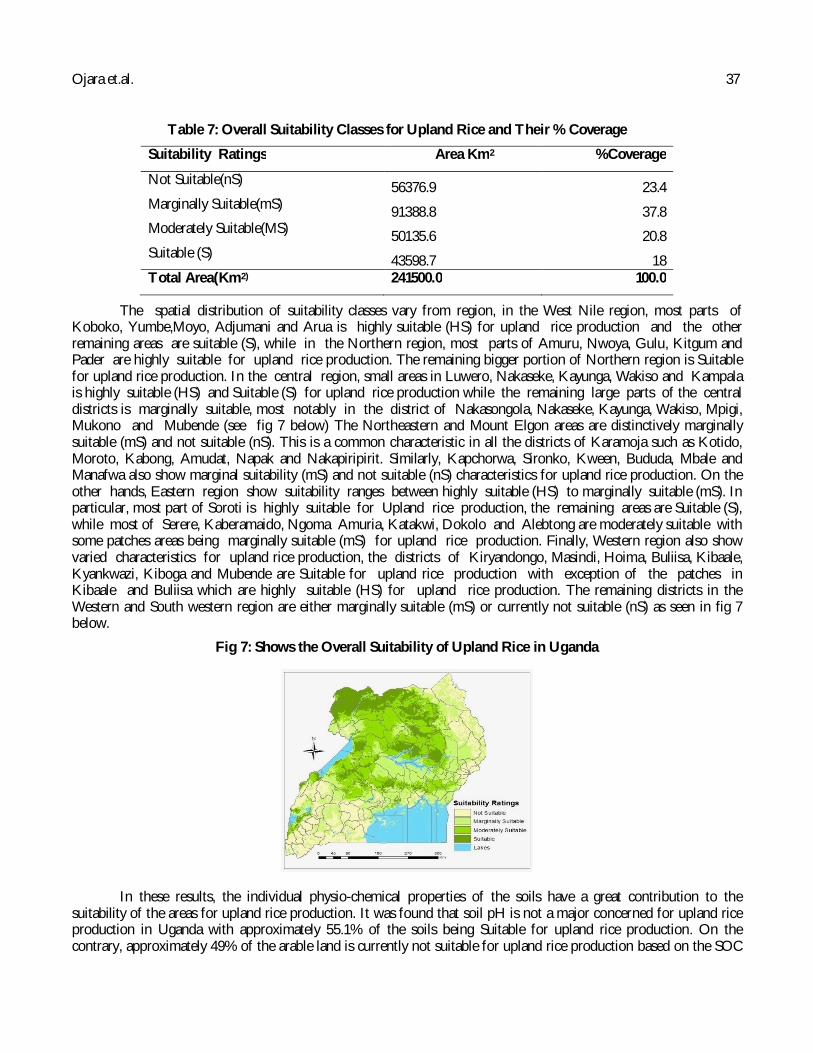
Table 7: Overall Suitability Classes for Upland Rice and Their % Coverage
Suitability Ratings Area Km2 %Coverage
Not Suitable(nS) 56376.9 23.4 Marginally Suitable(mS) 91388.8 37.8 Moderately Suitable(MS) 50135.6 20.8 Suitable (S) 43598.7 18 Total Area(Km2) 241500.0 100.0
The spatial distribution of suitability classes vary from region, in the West Nile region, most parts of Koboko, Yumbe,Moyo, Adjumani and Arua is highly suitable (HS) for upland rice production and the other remaining areas are suitable (S), while in the Northern region, most parts of Amuru, Nwoya, Gulu, Kitgum and Pader are highly suitable for upland rice production. The remaining bigger portion of Northern region is Suitable for upland rice production. In the central region, small areas in Luwero, Nakaseke, Kayunga, Wakiso and Kampala is highly suitable (HS) and Suitable (S) for upland rice production while the remaining large parts of the central districts is marginally suitable, most notably in the district of Nakasongola, Nakaseke, Kayunga, Wakiso, Mpigi, Mukono and Mubende (see fig 7 below) The Northeastern and Mount Elgon areas are distinctively marginally suitable (mS) and not suitable (nS). This is a common characteristic in all the districts of Karamoja such as Kotido, Moroto, Kabong, Amudat, Napak and Nakapiripirit. Similarly, Kapchorwa, Sironko, Kween, Bududa, Mbale and Manafwa also show marginal suitability (mS) and not suitable (nS) characteristics for upland rice production. On the other hands, Eastern region show suitability ranges between highly suitable (HS) to marginally suitable (mS). In particular, most part of Soroti is highly suitable for Upland rice production, the remaining areas are Suitable (S), while most of Serere, Kaberamaido, Ngoma Amuria, Katakwi, Dokolo and Alebtong are moderately suitable with some patches areas being marginally suitable (mS) for upland rice production. Finally, Western region also show varied characteristics for upland rice production, the districts of Kiryandongo, Masindi, Hoima, Buliisa, Kibaale, Kyankwazi, Kiboga and Mubende are Suitable for upland rice production with exception of the patches in Kibaale and Buliisa which are highly suitable (HS) for upland rice production. The remaining districts in the Western and South western region are either marginally suitable (mS) or currently not suitable (nS) as seen in fig 7 below.
Fig 7: Shows the Overall Suitability of Upland Rice in Uganda
In these results, the individual physio-chemical properties of the soils have a great contribution to the suitability of the areas for upland rice production. It was found that soil pH is not a major concerned for upland rice production in Uganda with approximately 55.1% of the soils being Suitable for upland rice production. On the contrary, approximately 49% of the arable land is currently not suitable for upland rice production based on the SOC
38 Journal of Geography and Earth Sciences, Vol. 5(1), June 2017 content. Similarly, a bigger proportion of soil CEC (54.3%) is currently not suitable (nS) for upland rice production while about 35.1% of remaining area is moderately suitable for Upland. Finally, the model established that for each classes of suitability above, (Not suitable to Highly suitable) the proportion of arable land under each class is almost equal, on average being 20%.
5. 0 Conclusion
The study found out that Uganda has a high potential of producing upland rice with about 76.4% of the land suitable for the crop, (Marginally Suitable (mS), Moderately Suitable (MS) and Suitable (S). The performance of MaxEnt model was generally good, with high training AUC of 0.862 for generating the climate suitability of upland rice. The main important point to note in the results of MaxEnt model is the fact that temperature related factors were important variable explaining the modelled distribution of rainfed upland rice with Maximum temperature of warmest month (Bio5) having a relative importance of 40.4 % and also supported by the jack-knife test which showed that this variable had the highest training gain in modeling suitable areas for rainfed upland rice production. The contribution of annual mean temperature was also high with a relative importance of 22.0%, followed by temperature seasonality (standard deviation *100) (bio_4.). The major surprise is that the precipitation related factors did not have much contribution to the model. Therefore, the results have indicated that temperature-related factors are the most important. There is total agreement with Surajit,(1981), that temperature, radiation, relative humidity and rainfall are major effects on the growth and production of upland rice and in most areas of the world especially in the tropics. Low temperature often causes low rice suitability as noted in (Chung, 1979), that if temperature can go as low as 5°C, rice seedlings have to be protected from cold injury. The analysis showed that very cold areas of Mount Elgon was not suitable for rice production similar to mount Rwenzori and other high altitude areas of Kabale and Kanungu that usually experience low temperature in the country also show non suitability characteristics.
Weighted overlay analysis showed that approximately 90% (137839.5 km2) of Uganda arable land was moderately suitable for upland rice production and the remaining 10% (15,316 km2) is marginally suitable for upland rice production. The production of upland rice, however is limited to declining soil fertility as indicated by the low levels of soil Organic carbon coupled with the low CEC of most soils. Declining soil fertility and falling agricultural productivity due to low level of nutrients such as SOC poses an enormous development challenge in Uganda and Sub-Saharan Africa at large (Agwe, 2007). This will necessitate increased adoption of improved crop, land, and water management practices will be needed to stop and eventually reverse such land degradation (Agwe, 2007). Agriculture in Uganda like in most of Sub-Saharan African faces a growing soil productivity crisis because unsustainable farming activities have severely depleted soil nutrients throughout much of the region (Nabatte et al., 2006; Sanchez, 2002; and FAO, 2003). These results showed that most parts of the Northeast region in the districts of Karamoja, is marginally suitable (mS) and not currently completely suitable (nS) for upland rice production coinciding with hunger prone area of the country. According to UBOS (2010), this Northern and North-eastern region leads in poverty rate at 46.2%, the highest in the country with the highest food insecurity (GOU, 2009). It is not surprising that these areas are rating low in suitability of upland rice because generally the climate of the area is semi-arid with hot temperature ranging between 25°C-35°C; and dry wind blowing across to the Turkana region in Kenya. The results does not show any major surprise in the suitability as it in agreement with work done by (Chenery ,1960) for most of central region of Uganda, who ranked these soils were very low .
This research provide an important entry into the production of upland rice for commercialization in Uganda by identifying the most productive areas and areas constrained for production of upland rice as well. It serves as an opening into the campaign of massive upland rice production for food security and poverty alleviation as it clearly points out measures to improve production of upland rice.
5. 1 Recommendations
We recommend that Government and policy makers, donors, Rice researchers, soils scientists, and farmers in the rice production should consider taking soil amendment practices such application of green organic fertilizers to improve on the productivity of the depleted soil nutrients in most areas of the country. The rice breeding team should consider the breeding of more heat/or drought resistant rice varieties and their distribution to farmers. Diversification to other alternative crops especially in those areas found to be marginal and not suitable for upland rice may also considered.

Ojara et.al. 39
References Agwe, J., Morris, M., Fernandes, E. (2007). Africa's growing soil fertility crisis: what role for fertilizer? Agricultural and
Rural Development Note. Issue 21. May 2007. Washington, DC, The World Bank: 1-3. B. Fungo, Grunwald, MM Tenywa, B. Vanlauwe and P.Nkedi-Kizza (2010) Lunnyo Soils in the Lake Victoria Basin of
Uganda Link to Toposequence and Soil Type Baker, N.T., and Capel, P.D., 2011, Environmental factors that influence the location of crop agriculture in the
conterminous United States: U.S. Geological Survey Scientific Investigations Report 2011–5108, 72 p. Barbet-Massin, M., Jiguet, F., Albert, C. H., &Thuiller, W. (2012). Selecting pseudo-absences for species distribution
models: how, where and how many?: How to use pseudo-absences in niche modelling? Methods in Ecology and Evolution, 3(2), 327–338.
Chauvin,. (2012). Food production and consumption trends in sub-Saharan Africa: Prospects for the transformation of the agricultural sector. UNDP Regional Bureau for Africa: New York, NY, USA. Retrieved -Saharan_Africa_Prospects_for_the_Transformation_of_the_Agricultural_Sector/links/55f1561008aef559dc470917.pdf.
Chenery, 1960. Introduction to the soils of the Uganda Protectorate, Memoirs of the Research Division, Series1- Soils, Number 1, Department of Agriculture, Kawanda Research Station, Uganda
De Datta S K , Vergara B S (1975) Climates of upland rice regions . Pages 14-26 in major research in Upland rice .International Rice Research Institute, Los Runos, .Philippines,
D.W. Reeves (1997).The role of soil organic matter in maintaining soil quality in continuous cropping systems. Elith J, Graham CH (2009) Do they? How do they differ? On finding reasons for differing performances of species
distribution models. Ecocraphy 32(1):66–77 EU (2009) Communication from the commission to the European parliament, the council, the European economic
and social committee and the committee of the regions, Towards a better targeting of the aid to farmers in areas with natural handicaps.
FAO (1983). World Food Security: a Reappraisal of the Concepts and Approaches. Director Generals Report, Rome FAO. 1996. Rome Declaration on World Food Security and World Food Summit Plan of Action. World Food
Summit 13-17 November 1996. Rome Fernández, F. G., &Hoeft, R. G. (2009). Managing soil pH and crop nutrients. Illinois Feller, C. Blanchart, E., Bernoux, M., Lal, R., &Manlay, R. (2012). Soil fertility concepts over the past two centuries:
the importance attributed to soil organic matter in developed and developing countries. Archives of Agronomy and Soil Science, 58(sup1), S3–S21. https://doi.org/10.1080/03650340.2012.693598
George E. Rayment and David J. Lyons A, (2009). New, Comprehensive Soil Chemical Methods Book for Australasia GOU, MAAIF, (2009). Uganda National Rice Développement Strategy. Entebbe, Uganda. Hijmans, R.J., Cameron, S.E., Parra, J.L., Jones, P.G., Jarvis, A., 2005. Very high resolution interpolated climate
surfaces for global land areas. International Journal of Climatology 25 (15), 1965–1978.Hulme, Mike et al. “African Climate Change: 1900-2100.” Climate research 17.2 (2001): 145–168. Print.
Huke, R. 1976. Geography and climate of rice. Pages 31-50 in International Rice Research Institute Kihoro, Joseph, Njoroge J. Bosco, and HunjaMurage. “Suitability Analysis for Rice Growing Sites Using a Multicriteria
Evaluation and GIS Approach in Great Mwea Region, Kenya.” SpringerPlus 2.1 (2013): 1–9. Print. Kijima Y, Otsuka, K and Sserunkuuma D, (2009). Determinants of Changing Behaviors of NERICA Adoption: An
Analysis of Panel Data from Uganda; Läderach, P. et al. “Predicting the Future Climatic Suitability for Cocoa Farming of the World’s Leading Producer
Countries, Ghana and Côte d’Ivoire.” Climatic Change 119.3–4 (2013): 841–854. CrossRef. Web. Lal, R. (2009). Soil degradation as a reason for inadequate human nutrition. Food Security, 1(1), 45–57.
https://doi.org/10.1007/s12571-009-0009-z MAAIF (2009), Uganda National rice development strategy (UNRDS), 2nd draft Masao Kikuchi, KunihiroTokida, Yusuke Haneishi,Natsuko Miyamoto, Tatsushi Tsuboi and Godfrey Asea (2013).
Rice in Uganda: Viewed from Various Market Channels Masoud, J. et al. “MODELING INLAND VALLEY SUITABILITY FOR RICE CULTIVATION.” Journal of
Engineering & Applied Sciences 8.1 (2013): n. pag. Print.
40 Journal of Geography and Earth Sciences, Vol. 5(1), June 2017 Mubiru, Drake N. et al. “Characterising Agro meteorological Climate Risks and Uncertainties: Crop Production in
Uganda.” South African Journal of Science 108.3/4 (2012): n. pag. CrossRef. Web. 13 May 2016. Mustafa, A. A., Man, S., Sahoo, R. N., Nayan, A., Manoj, K., Sarangi, A., & Mishra, A. K. (2011). Land suitability
analysis for different crops: a multi criteria decision making approach using remote sensing and GIS. Indian Agricultural Research Institute, New Delhi. http://www.sciencepub.net/researcher/research0312/014_7181research0312_61_84.pdf
Nabatte, P., & Nyombi, K. (2013). Effect of Pine Plantation Surface fires on Soil Chemical Properties in Uganda. Research Journal of Agriculture and Forestry Sciences ISSN, 2320, 6063.
Pedro A. Sanchez (2002) Soil Fertility and Hunger in Africa Steven J. Phillips, Robert P. Anderson and Robert E. Schapire, (2006) Maximum entropy modeling of species
geographic distributions. Ecological Modelling, Vol 190/3-4 pp 231-259 Phillips, Steven J., and Miroslav Dudík. “Modeling of Species Distributions with Maxent: New Extensions and a
Comprehensive Evaluation.” Ecography 31.2 (2008): 161–175. Print. Rachel Muthoni Andriatsitohaina, Andrew Farrow, Moses Ojara (2016) Atlas of common bean (Phaseolus vulgaris L.)
Production in Africa: Second edition (CIAT 2016 forthcoming) Tatsushi Tsuboi, 2002: Rice cultivation hand book Tatsushi Tsuboi, 2006; Guide for upland rice experiments, Rice Training Workshop, 23 –25th Feb, 2006 Tran D.V. World rice production: main issues and technical possibilities. In : Chataigner J.(ed.). Activités de recherche
sur le riz en climat méditerranéen .Montpellier: CIHEAM, 1997. p. 57-69 Uganda Bureau of Statistics (November 2010): Uganda National Household Survey 2009\2010: Socio- Economic
Module, Abridged Report.