predicting the risk of attrition for undergraduate
TRANSCRIPT
PREDICTING THE RISK OF ATTRITION FOR
UNDERGRADUATE STUDENTS WITH TIME BASED
MODELLING
Kevin EK Chai2 and David Gibson
1,2
1Curtin Teaching and Learning 2Curtin Institute for Computation
Curtin University, Perth, Australia
ABSTRACT
Improving student retention is an important and challenging problem for universities. This paper reports on the development of a student attrition model for predicting which first year students are most at-risk of leaving at various points in time during their first semester of study. The objective of developing such a model is to assist universities by proactively supporting and retaining these students as their situations and risk change over time. The study evaluated different models for predicting student attrition at four different time periods throughout a semester study period:
pre-enrolment, enrolment, in-semester and end-of-semester models. A dataset of 23,291 students who enrolled in their first semester between 2011-2013 was extracted from various data sources. Three supervised machine learning techniques were tested to develop the predictive models: logistic regression, decision trees and random forests. The performance of these models were evaluated using the precision and recall metrics. The model achieved the best performance and user utility using logistic regression (67% precision, 29% recall). A web application was developed for users to visualise and interact with the model results to assist in the targeting of student intervention responses and programs.
KEYWORDS
Attrition, retention, student, prediction, machine learning.
1. INTRODUCTION
The student retention rate is a measure of student success used by many universities. Measuring student
retention is important because it can reveal how well a university is able to retain students based on the
quality of education, research and services provided (Kim 1998). Improving student retention is a highly
desirable and challenging goal for universities as a declining student population can significantly affect
current and future students, instructors, researchers, professional staff and the university as an institution
(Ifenthaler and Widanapathirana 2014, Kovacic 2012, Murtaugh et al. 1999, Olani 2009). There has been a long history of research into studying and building models concerning student retention
and attrition (Braxton 2000, Reason 2009). The most significant benefit of developing such models is to
enable student support staff to proactively conduct interventions to assist and retain at-risk students. This can
result in other benefits such as improved student graduation rates, better support for students and increased
university revenue depending on the quality of the predictive model and student interventions.
There are two primary challenges involved in developing a first year student attrition predictive model.
First, predictive models need to be developed under rigorous experimental settings for training, validating
and testing the model’s prediction performance on historical student data. Second, if the model is used to
generate predictions at different points in time during a student’s time at university, the model can only be
trained with data available at these respective points in time. For example, a model predicting a student’s risk
of attrition at the beginning of their first semester cannot be trained on data that is only available after they have completed the semester. The risk of attrition is defined for this research study as the likelihood of a
student leaving the university in the following year.
12th International Conference on Cognition and Exploratory Learning in Digital Age (CELDA 2015)
109
This paper reports on several research contributions. First, a taxonomy of common student attrition and
retention features is synthesised from the literature. Second, the problem definition describes different ways
student attrition can be defined and formally defines the problem of predicting student attrition in this paper.
Third, a student attrition model is described that contains features from four different time periods through a university student’s first semester of study. Fourth, the settings of the experiment in terms of workflow,
machine learning methods and performance metrics used to develop and validate the predictive model are
outlined. Last, the results from our experiments are presented and the insights gained from the research are
discussed.
2. TAXONOMY
Student attrition and retention research literature was reviewed and a taxonomy of common student attrition
features was developed (Table 1). Many of these research papers evaluate features from multiple categories.
Demographic (Bogard et al. 2011, Moller‐Wong and Eide 1997, Yu et al. 2010) and academic history
(Kovacic 2012, Luna 2000, Olani 2009) were the most common studied features, in particular age, gender,
ethnicity and high school grades were evaluated by the majority of the papers. Social (Dey and Astin 1993,
Kim 1998), psychological (McKenzie and Schweitzer 2001, Olani 2009) and financial (Dey and Astin 1993,
Reason 2009) features were less common.
The university category represents features evaluated after the student has enrolled and commenced
studying. This category comprises of six subgroups containing enrolment (Bogard et al. 2011, Fike and Fike
2008), course (Lin et al. 2012, Murtaugh et al. 1999), units (Dekker et al. 2009, Kim 1998), resource use (Balakrishnan and Coetzee 2013, Dietz-Uhler and Hurn 2013), engagement (Glogowska et al. 2007,
Murtaugh et al. 1999, Xuereb 2014) and during study features (Bogard et al. 2011, Dekker et al. 2009,
Kovacic 2012). Measuring the usage of university resources such as the LMS, library and video lectures is
less common in the literature but will likely receive more attention due to the popularity of delivering digital
education and Massive Open Online Courses (MOOCs) in recent years.
Table 1. Taxonomy of Student Attrition Features
Category Examples # Sources
Demographic Age, gender, ethnicity, living on campus, has children, parents’ education, has disability, experience working in study area
11
Social Hours spent socialising with friends, exercising, engaged in sporting teams, volunteer work, hobbies
2
Psychological Personality traits, self-esteem, commitment to chosen profession, informal / formal support, GRIT (12 question survey)
4
Financial Household income, requires financial aid, currently working 6
Academic history High school grades, high school rank, public vs. private high
school, other qualifications (previous diplomas, degrees) 12
University
- Enrolment Enrolled in first preference course, enrolled before course start date, language tests taken, reason for attending university
5
- Course Difficulty (pass rate), student has chosen a major / specialization, attendance mode, load type, field of study
7
- Units Number of units enrolled, number of contact hours, average pass rate, unit type, quality of lecturer, quality of lecturer feedback
4
- Resource use Library, learning management system, lectures e-mail 2
- Engagement Student survey participation, student clubs / groups membership, enrolled in educational support programs
3
- During study Current course average, number of units the student is currently failing, attended hours, units passed, units failed
5
ISBN: 978-989-8533-43-2 © 2015
110

3. PROBLEM DEFINITION
There are many variations in defining the risk of student attrition at universities determined by stakeholder
perspectives and needs and the time period for the desired prediction (Table 2). For example, a predictive
model could be developed for a unit coordinator to identify students who are at-risk of withdrawing from
their units this year. Alternatively, another model could be developed at the faculty level to identify students
at-risk of changing courses outside the faculty in the next semester.
Table 2. Student Attrition Definition Factors
Stakeholder Enrolment Desired prediction time period
Unit coordinator Unit This semester School Course Next semester
Faculty University Next year, 2 years, 3 years etc. Institution Student life-time
The problem of predicting student attrition is formally defined as a binary classification problem. The
dataset can be described as a set of students and an attrition label where represents the -th student in . Students are represented as a set of
student attrition features (factors) in the model as defined for .
is a Boolean function that is used to determine whether belongs to where .
This definition can be applied to predict student for different factor mappings (Table 2). The focus of this
research is to develop a model for predicting student attrition for the institution stakeholder, at the university
enrolment level and the desired prediction time of next year.
4. STUDENT ATTRITION MODEL
A conceptual model for predicting student attrition was developed after reviewing student retention / attrition
research papers in the literature, discussions with domain experts and academics, identifying available
student data from university data sources in addition to proposing new features based on our knowledge
gained through this process. The feature types used in the conceptual model in relation to the proposed
taxonomy (Table 1) are demographic, academic history, enrolment, course, resource use, engagement and
during study features.
An initial set of 28 features are evaluated in a set of experiments based on the feasibility of extraction and
data handling during the time available for the research. The data system of the university is being built for future automated extractions that will utilise these research findings and will allow more features to be
included in the model. Due to these considerations, the research scope is restricted to only evaluating student
data in their first semester of study. However, a student’s risk of attrition is likely to change over time as more data becomes available on how
the student is progressing throughout the semester. Therefore, the study evaluates four models using features that are available at four different time periods in the semester. These models are the pre-enrolment model, enrolment model, in-semester model and end of semester model (Table 3).
The pre-enrolment model includes features that can be used to predict a student’s risk of attrition before they commence studying at university. This model contains 17 features based on a student’s demographics, academic performance at high school as well as whether a student has participated in the university enabling program or has taken bridging units at the university college as an alternative pathway of entry.
The enrolment model contains an additional 5 features based on data collected from the student enrolment process such as their age at enrolment, the workload of the course (course credit value), whether they are studying on campus or externally (attendance mode), their field of study and whether they are studying full-time or part-time (study load type). This model can be used to predict a student’s risk of attrition after a student has completed their enrolment at university.
12th International Conference on Cognition and Exploratory Learning in Digital Age (CELDA 2015)
111

Table 3. Student Attrition Model Features
# Pre-enrolment # Enrolment
1 Gender 18 Age at enrolment
2 Birth country = Australia 19 Course credit value 3 Birth country region 20 Attendance mode 4 Home language = English 21 Field of study 5 Aboriginal or Torres Strait Islander 22 Study load type
6 Citizenship
7 Has disability
8 Western Australia metropolitan status # In-Semester
9 Socio economic status 23 LMS logins 10 High school / tertiary entrance score 24 Portal logins
11 Course preference number 12 High school type
13 Highest education qualification # End-of-Semester
14 Elite athlete 25 Course average 15 University enabling program participant 26 Surveys completed 16 Completed university college program 27 Units completed 17 First in family 28 Units withdrawn
The in-semester model contains an additional 2 features that measure a student’s usage (i.e. logins) of the
university’s Learning Management System (LMS) for accessing course materials and submitting assessments
as well as the university’s student portal for accessing official communications and other university student
Web applications. This model can be used to predict a student’s risk of attrition at different points in time
during the semester.
The end-of-semester model contains an additional 4 features that measure the student’s academic
performance at university in terms of their end of semester grade (course average), whether the student
participated in teacher and unit feedback surveys in addition to the number of units completed and withdrawn
for the semester. This model can be used to predict a student’s risk of attrition after they have completed their
first semester.
5. EXPERIMENTAL SETTING
The experiment comprises of nine main tasks (Figure 1): feature extraction, feature normalisation, feature
encoding, cross validation, feature selection, model training and tuning, prediction, performance evaluation
and error analysis. These tasks will now be described in detail. The dataset is comprised of 23,291 students who commenced their first semester at Curtin University,
Australia between 1 Jan 2011 and 31 Dec 2013. This data was extracted from various university systems and
data sources such as student administration, business intelligence, LMS, student portal, unit and teacher
feedback surveys, university enabling programs and college student records in addition to external sources
containing student tertiary entrance scores and preferences as well as Australian census data. After data
cleansing and preparation, the dataset consists of 19,222 (83%) retained and 4,068 (17%) attrition students.
Feature extraction acquires the data required for the model features in addition to calculating the student
attrition labels (based on definition in Section 3) used for training, validating and testing by the predictive
models. Feature normalisation refers to mapping feature values into a new numerical range such that the
relative magnitude is preserved. Normalisation is important because it avoids modelling features in larger
numeric ranges that can dominate features in smaller ranges. It is also more computationally and memory
efficient to perform computations on smaller scaled values than larger data values (Tax and Duin 2002). The features are normalised to a scale of [0, 1] in the experiments.
Data discretisation involves portioning feature values into ranked intervals or bins. Each interval is then
treated as a categorical value. Discretisation has been shown to improve classification performance
(Dougherty et al. 1995, Fayyad and Irani 1993, Kotsiantis and Kanellopoulos 2006, Liu 2007). The resulting
full model comprises of 146 encoded features selected after experimenting with various feature discretisation
and encodings to optimise prediction performance.
ISBN: 978-989-8533-43-2 © 2015
112

Figure 1. Experimental workflow
A stratified 10-fold repeated random sub-sampling validation cross-validation technique (Liu 2007) is applied for this project. Students are randomly assigned into a training (60%), validation (20%) or test (20%)
dataset. This assignment is performed 10 times in a stratified manner to generate 10 different training,
validation and test datasets. Stratified means that the class distribution of retained (83%) and attrition (17%)
students are preserved in each dataset. Therefore, 10 different predictive models are built for each dataset and
their results are averaged to measure overall performance.
Feature selection is the process of selecting a subset of the most important features for use in model
construction. Recursive Feature Elimination with Cross-Validated (RFECV) selection is employed to identify
the best feature subset in addition to applying L1 regularisation (Lee et al. 2006) for logistic regression.
Decision tree and random forest employ embedded feature selection by design as only the most important
features are used to construct the tree(s).
With respect to predictions (Kotsiantis and Kanellopoulos 2006) reviewed a number of candidate
supervised machine learning techniques and their suitability based on different factors. The aim of the student attrition model is to achieve strong prediction performance, where insights can be understood and assist
student support staff in prioritizing the various risks of attrition within their workload of tailoring student
interventions. Based on this aim, the model employed three supervised learning techniques: L1 regularised
logistic regression (Cox 1958, Lee et al. 2006, Walker and Duncan 1967), decision trees using the CART
algorithm (Breiman et al. 1984) with the Gini impurity criterion and random forests (Breiman 2001).
Precision and recall metrics are used to evaluate the performance of the predictive models. Precision
measures the percentage of students the model correctly predicted as attrition. Recall calculates the
percentage of at-risk of attrition students correctly identified from the test dataset. These metrics are more
effective at assessing performance on imbalanced datasets than alternative metrics such as classification
accuracy and receiver operating characteristic (Davis and Goadrich 2006).
Error analysis is an iterative process of evaluating the model errors to gain insights in further improving the model. Learning and validation curves are constructed to evaluate the model on the training and
validation datasets. These curves allow for the identification of model bias and variance in addition to
evaluating the effectiveness of model tuning tasks. A web application was developed to visualise and interact
with the model results.
6. RESULTS
The end-of-semester model comprises of 28 features transformed into 148 encoded features. Furthermore, the
in-semester model is split into four additional time periods from weeks 1-4, 1-8, 1-12 and 1-17. The purpose
12th International Conference on Cognition and Exploratory Learning in Digital Age (CELDA 2015)
113
for experimenting with these time periods is to determine how model performance changes as more student
data is collected throughout the semester study period.
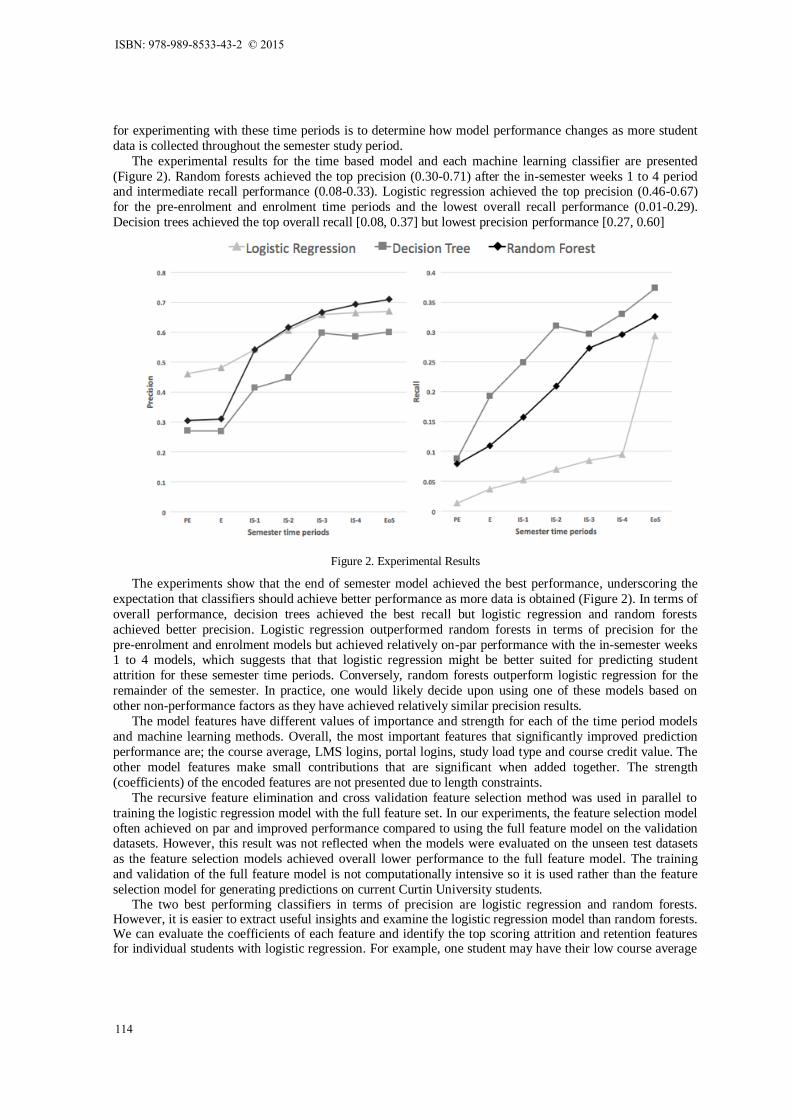
The experimental results for the time based model and each machine learning classifier are presented
(Figure 2). Random forests achieved the top precision (0.30-0.71) after the in-semester weeks 1 to 4 period and intermediate recall performance (0.08-0.33). Logistic regression achieved the top precision (0.46-0.67)
for the pre-enrolment and enrolment time periods and the lowest overall recall performance (0.01-0.29).
Decision trees achieved the top overall recall [0.08, 0.37] but lowest precision performance [0.27, 0.60]
Figure 2. Experimental Results
The experiments show that the end of semester model achieved the best performance, underscoring the
expectation that classifiers should achieve better performance as more data is obtained (Figure 2). In terms of
overall performance, decision trees achieved the best recall but logistic regression and random forests
achieved better precision. Logistic regression outperformed random forests in terms of precision for the
pre-enrolment and enrolment models but achieved relatively on-par performance with the in-semester weeks 1 to 4 models, which suggests that that logistic regression might be better suited for predicting student
attrition for these semester time periods. Conversely, random forests outperform logistic regression for the
remainder of the semester. In practice, one would likely decide upon using one of these models based on
other non-performance factors as they have achieved relatively similar precision results.
The model features have different values of importance and strength for each of the time period models
and machine learning methods. Overall, the most important features that significantly improved prediction
performance are; the course average, LMS logins, portal logins, study load type and course credit value. The
other model features make small contributions that are significant when added together. The strength
(coefficients) of the encoded features are not presented due to length constraints.
The recursive feature elimination and cross validation feature selection method was used in parallel to
training the logistic regression model with the full feature set. In our experiments, the feature selection model
often achieved on par and improved performance compared to using the full feature model on the validation datasets. However, this result was not reflected when the models were evaluated on the unseen test datasets
as the feature selection models achieved overall lower performance to the full feature model. The training
and validation of the full feature model is not computationally intensive so it is used rather than the feature
selection model for generating predictions on current Curtin University students. The two best performing classifiers in terms of precision are logistic regression and random forests.
However, it is easier to extract useful insights and examine the logistic regression model than random forests. We can evaluate the coefficients of each feature and identify the top scoring attrition and retention features for individual students with logistic regression. For example, one student may have their low course average
ISBN: 978-989-8533-43-2 © 2015
114

score as their highest contributing feature to attrition while another student with a higher course average may have their age at enrolment group (e.g. 40-49) as their highest risk of attrition feature.
Random forests involve building a number of decision trees (10 in our experiments) and averaging the predictions from these trees. Therefore, it is more difficult to explain and visualise how predictions are made from 10 different decision trees. Therefore, logistic regression is recommended over random forests as it achieved similar precision performance but is easier to understand, extract insights and plan student interventions. A web application was developed to visualise the logistic regression model has been made available to university student support staff (Figure 3).
Figure 3. Interactive Model Results Visualisation
7. CONCLUSION
This study developed a student attrition model that predicts a student’s risk of attrition at different time periods in their first semester: the pre-enrolment, enrolment, in-semester and end-of-semester periods. The model performance was validated on university students who enrolled in 2011-2013. Three supervised learning methods were evaluated; logistic regression, decision trees and random forests. Logistic regression and random forests achieved the best precision performance on this dataset and based on considerations of ease of use and fitness for purpose, a web-based interface was constructed using the logistic regression model, due to its relative ease in extracting insights to assist university staff in understanding and planning student retention interventions. Future work will involve experimenting with additional features such as student assessment data from the university’s LMS to further improve the model and to build a dedicated data exploration environment to make university data more readily available for building, refining and validating predictive models. Next steps also include reviewing and understanding the implications of the predictive methodology on retention policy, practices and technologies in a university span with a wide range of potential changes to business practices, policy concerns and practical implementation issues.
REFERENCES
Balakrishnan, G. and Coetzee, D. (2013) Predicting student retention in massive open online courses using hidden Markov models. Electrical Engineering and Computer Sciences University of California at Berkeley.
Bogard, M., Helbig, T., Huff, G. and James, C. (2011) A comparison of empirical models for predicting student retention. White paper. Office of Institutional Research, Western Kentucky University.
Braxton, J. M. (2000) Reworking the student departure puzzle, Vanderbilt University Press.
Breiman, L. (2001) Random forests. Journal of Machine learning, 45(1), pp. 5-32.
Breiman, L., Friedman, J., Stone, C. J. and Olshen, R. A. (1984) Classification and regression trees, CRC press.
12th International Conference on Cognition and Exploratory Learning in Digital Age (CELDA 2015)
115

Cox, D. R. (1958) The regression analysis of binary sequences. Journal of the Royal Statistical Society. Series B (Methodological), pp. 215-242.
Davis, J. and Goadrich, M. (2006) The relationship between Precision-Recall and ROC curves. in Proceedings of the 23rd International Conference on Machine Learning (ICML). pp. 233-240.
Dekker, G. W., Pechenizkiy, M. and Vleeshouwers, J. M. (2009) Predicting Students Drop Out: A Case Study. International Working Group on Educational Data Mining.
Dey, E. L. and Astin, A. W. (1993) Statistical alternatives for studying college student retention: A comparative analysis of logit, probit, and linear regression. Research in higher education, 34(5), pp. 569-581.
Dietz-Uhler, B. and Hurn, J. E. (2013) Using learning analytics to predict (and improve) student success: a faculty perspective. Journal of Interactive Online Learning, 12(1), pp. 17-26.
Dougherty, J., Kohavi, R. and Sahami, M. (1995) Supervised and unsupervised discretization of continuous features. in Proceedings of the 12th International Conference on Machine Learning pp. 194-202.
Fayyad, U. M. and Irani, K. B. (1993) Multi-interval discretization of continuous-valued attributes for classification learning.
Fike, D. S. and Fike, R. (2008) Predictors of first-year student retention in the community college. Community College Review, 36(2), pp. 68-88.
Glogowska, M., Young, P. and Lockyer, L. (2007) Should I go or should I stay? A study of factors influencing students'
decisions on early leaving. Active Learning in Higher Education, 8(1), pp. 63-77.
Ifenthaler, D. and Widanapathirana, C. (2014) Development and validation of a learning analytics framework: Two case studies using support vector machines. Technology, Knowledge and Learning, 19(1-2), pp. 221-240.
Kim, H.-J. (1998) Predicting an individual retention rate using a statistical analysis. in: Kirksville, MO: Truman University.
Kotsiantis, S. and Kanellopoulos, D. (2006) Discretization techniques: A recent survey. GESTS International Transactions on Computer Science and Engineering, 32(1), pp. 47-58.
Kovacic, Z. J. (2012) Predicting student success by mining enrolment data. Research in Higher Education Journal.
Lee, S.-I., Lee, H., Abbeel, P. and Ng, A. Y. (2006) Efficient L1 regularized logistic regression. in Proceedings of the National Conference on Artificial Intelligence. pp. 401.
Lin, T.-C., Yu, W. W.-C. and Chen, Y.-C. (2012) Determinants and probability prediction of college student retention: new evidence from the Probit model. International Journal of Education Economics and Development, 3(3), pp. 217-236.
Liu, B. (2007) Web data mining: exploring hyperlinks, contents, and usage data, Springer.
Luna, J. (2000) Predicting student retention and academic success at New Mexico Tech. Unpublished, New Mexico Institute of Mining and Technology.
McKenzie, K. and Schweitzer, R. (2001) Who succeeds at university? Factors predicting academic performance in first
year Australian university students. Higher education research and development, 20(1), pp. 21-33.
Moller‐Wong, C. and Eide, A. (1997) An engineering student retention study. Journal of Engineering Education, 86(1),
pp. 7-15.
Murtaugh, P. A., Burns, L. D. and Schuster, J. (1999) Predicting the retention of university students. Research in higher
education, 40(3), pp. 355-371.
Olani, A. (2009) Predicting first year university students’ academic success. electronic journal of research in educational psychology, 7(3), pp. 1053-1072.
Reason, R. D. (2009) Student variables that predict retention: Recent research and new developments. Journal of Student Affairs Research and Practice, 46(3), pp. 850-869.
Tax, D. M. and Duin, R. P. (2002) Feature scaling in support vector data descriptions. in Conference of the Advanced School for Computing and Imaging. pp. 95-110.
Walker, S. H. and Duncan, D. B. (1967) Estimation of the probability of an event as a function of several independent variables. Biometrika, 54(1-2), pp. 167-179.
Xuereb, S. (2014) Why students consider terminating their studies and what convinces them to stay. Active Learning in Higher Education, 15(2), pp. 145-156.
Yu, C. H., DiGangi, S., Jannasch-Pennell, A. and Kaprolet, C. (2010) A data mining approach for identifying predictors of student retention from sophomore to junior year. Journal of Data Science, 8(2), pp. 307-325.
ISBN: 978-989-8533-43-2 © 2015
116