predicting the size and characteristics of the drug ... · annex: predicting the size and...
TRANSCRIPT
Predicting the size and characteristics of the drug treatment population – technical methods Annex to evidence review of drug misuse treatment outcomes in England

Annex: Predicting the size and characteristics of the drug treatment population - technical methods
2
About Public Health England
Public Health England exists to protect and improve the nation’s health and wellbeing,
and reduce health inequalities. We do this through world-class science, knowledge
and intelligence, advocacy, partnerships and the delivery of specialist public health
services. We are an executive agency of the Department of Health, and are a distinct
delivery organisation with operational autonomy to advise and support government,
local authorities and the NHS in a professionally independent manner.
Public Health England
Wellington House
133-155 Waterloo Road
London SE1 8UG
Tel: 020 7654 8000
www.gov.uk/phe
Twitter: @PHE_uk
Facebook: www.facebook.com/PublicHealthEngland
© Crown copyright 2017
You may re-use this information (excluding logos) free of charge in any format or
medium, under the terms of the Open Government Licence v3.0. To view this licence,
visit OGL or email [email protected]. Where we have identified any third
party copyright information you will need to obtain permission from the copyright holders
concerned.
Published: January 2017
PHE publications gateway number: 2016489
For enquiries about this publication, contact: [email protected]

Annex: Predicting the size and characteristics of the drug treatment population – technical methods
3
Contents
About Public Health England 2
Aim and data specification 4
Methodology 5
Main models 5 Breakdowns by demographic and other factors 5 Underlying assumptions and caveats 7
Projections for the opiate treatment population 8
Main models 8 Testing of main models 13 Summary of main models 14 Age model 14 Opiate use career model 15 Model by previous attempts at treatment 16
Projections for non-opiate treatment 17
Main models 17 Testing of main models 22 Summary of main models 23 Age model 23 Reasons for truncation of the time period for main models 24
References 27
Annex: Predicting the size and characteristics of the drug treatment population – technical methods
4
Aim and data specification
This analysis was based on monthly data from the National Drug Treatment Monitoring
System (NDTMS) from December 2005 to November 2016. NDTMS is taken to be a
comprehensive description of drug treatment provision for this period.
Looking forward for four years based on patterns observed in the preceding decade, the
aim of this analysis is to estimate the size and characteristics of opiate and non-opiate
treatment populations (adults only for the non-opiate population) to the end of 2020,
with four specifications:
the projected number in treatment (main models, herein)
breakdown by age
breakdown by duration of use (using career, herein, and opiate population only)
breakdown by previous treatment (opiate population only)
With anticipated uncertainty in each projection (which could be increased with cross-
referencing), the statistical models were computed independently. There is logical
covariation between components (for example, between age and using career) but this has
not been applied directly in the projections.
For the main treatment population models, a decision was taken to truncate the retrospective
data to January 2011 (see ‘Reasons for truncation of the time period’ for rationale). Additional
modelling was required for the non-opiate models to take into account the additional criteria to
limit to adults only, as described below.
All analysis was done in SPSS (version 21) using latest available data.

Annex: Predicting the size and characteristics of the drug treatment population – technical methods
5
Methodology
Main models
Month-to-month change in the size of the opiate and non-opiate treatment populations
was estimated by predicting the number entering and exiting treatment in each month.
Projections were carried out up to December 2020, based on data up to August 2016,
with the assumption that the three most recent months were still incomplete. This was
achieved through the following steps:
use past trends to project the number of ‘treatment naïve’ presentations each
month. ‘Treatment naïve’ is defined as the individual presenting to treatment
having not previously been in treatment in the period of observation
use past trends to project the number of treatment exits each month (taking into
account trends in different exit reasons)
based on treatment exits occurring in previous months, project the number re-
presenting to treatment in each month (that is, individuals presenting to treatment
having previously been known to treatment in the period, and taking into account
that likelihood of re-presentation varies with different exit reasons)
using the number of people in treatment at the start of a given month and
projected presentations and exits in each month, estimate the number in
treatment at the start of the next month
for the non-opiate model only, project the number turning 18 years of age during
treatment in each month, since people could enter the cohort by turning 18 as
well as by presenting to treatment. Note: this was low and relatively stable across
the period (averaging around 125 a month) and is not shown in the results
These projections were fitted then tested by running identical models with a cut-off point
two years before the end of the period (i.e. August 2014) and then comparing the
projected figures produced by the models to the actual data in the intervening two
years.
Breakdowns by demographic and other factors
Projection estimates for age, using career and previous attempts at treatment were fitted to
the full time series. Projections were made based on the proportion of the total population
in each relevant category, eg each given age group, at the end of each month.
Projections by age were carried out by dividing the treatment population into five-year
bands according to year of birth (‘birth cohorts’, herein). As the treatment population over
this short period was clustered by year of birth, truncation is required when projections

Annex: Predicting the size and characteristics of the drug treatment population – technical methods
6
would begin to become very unstable. For example, the analysis for opiates was limited to
five-year bands starting at 1946 and ending at 1990, which included 99.7% of the
population at the end of 2015. Projections of the post-1990 birth cohort were fitted with a
deliberately liberal model in acknowledgement that there will be younger users who have
not presented for treatment.
The pre-1946 birth cohort was assumed to be the remainder based on other projections. The
estimates for each birth cohort were then translated to age groups at the end of 2005, 2010,
2015 and 2020, since it is only at these points that we can be certain that those in a given birth
cohort will all be in one age group (in other words, at the end of 2005 we know everyone in the
1981-1985 cohort will be aged 20-24).
Age groups were pooled to allow fair comparison over time (for example, for opiates, age
groups were set to under 30 years; five-years bands between 30 and 59 years, and 60 or
older). In the non-opiate model, the youngest birth cohorts were not considered in the
projections until at least some of the cohort could be aged 18.
Projections by opiate use career were done using the same method used for projections by
age, instead referring to the five-year period that the person reported starting to use (‘uptake
cohorts’, herein). Using the age of first use variable in NDTMS, it was assumed in the absence
of a more exact indication that this initiation was halfway through the reported year (that is, date
of birth, plus age of first use, plus six months). As with the projections by age, there was
truncation at each end when numbers became too low to stably predict, with five-year bands for
opiate users between 1981 and 2010.
Projections for the post-2010 uptake cohort were modelled from the beginning of 2011. Again,
a liberal model was used in acknowledgement that there will be newer users not yet known to
treatment. The pre-1981 uptake cohort was assumed to be the remainder based on the other
projections. Estimates were calculated for the end of 2005, 2010, 2015 and 2020 as it is only at
these points we can be certain those in a given uptake cohort will all be in one group by using
career. Groups by using career were derived from the uptake cohorts and pooled as necessary.
As it is only possible for patients to gain previous attempts at treatment by re-presenting to
treatment (that is, they could never descend through the categories), projections by previous
attempts at treatment were calculated according to the likelihood of the person being counted in
a given category or higher. Therefore, projections were fitted to the numbers with 4 or more
previous attempts, 3 or more previous attempts, and so on. These were then disaggregated to
give the final projections for each category distinctly.
Figures for the end of 2005, 2010 and 2015 for these models use actual totals from NDTMS.
Figures for the end of 2020 are described as projected based on activity from December 2005
onwards, and should be regarded as being subject to much greater uncertainty as a result.

Annex: Predicting the size and characteristics of the drug treatment population – technical methods
7
Underlying assumptions and caveats
The models are based on the following assumptions:
that there are no unforeseeable changes in external influences leading to
significant reduction of increase in treatment demand. An example of this would
change in purity and availability of heroin in the illicit market, which could lead to
variations in treatment uptake as well as having other effects that would impact
upon on the treatment population (eg, heightened overdose risk)
incidence and prevalence continue to follow existing (declining) trends.
Prevalence estimates of the number of opiate users have been declining in
recent years, at least up to the most recent estimates in 2011/12.1 A recent
analysis of incidence (new uptake) of opiate use tentatively suggested that
incidence may be increasing after several years of decline,2 although there was a
broad range of uncertainty. If new using cohorts were to emerge, this could in
turn lead to greater treatment uptake and could also impact on distributions of the
treatment population by age, using career and previous attempts at treatment
treatment system capacity is not a factor. In effect, the models assume numbers
can go up and down without restraint. This would be particularly significant if
increased numbers in treatment were projected, as it would also have to be
assumed that the system would be able to meet the demand
re-presentations to treatment are driven only by preceding treatment exits and
rates and speed of re-presentation are reasonably stable across the period. The
model for projecting re-presentations to treatment assumes that each person
exiting at any given point has the average likelihood of re-presenting to treatment
for the given exit reason, and will re-present at a speed in keeping with the
general distribution of time to re-present. This would start to prove problematic if
the re-presentation rate or speed of re-presentations were to change during the
period, either due to changes in practice or external influences
seasonal variation will even out. As the model uses monthly treatment numbers
these will inevitably be subject to seasonal differences. This variation is assumed
to even out over the course of a year but is not taken into account in the
projections. Therefore, the projections reflect the expected general direction of
travel rather than seeking to identify exactly what changes might be anticipated in
any given month. For example, it is known that there are reduced numbers of
people entering and exiting treatment in December but the projected figures for
each December do not take this into account

Annex: Predicting the size and characteristics of the drug treatment population – technical methods
8
Projections for the opiate treatment population
Main models
The models for opiates were constructed for the period January 2011 to August 2016, for
the reasons set out in the ‘Reasons for truncation of the time period for main models’
section below.
The final models were tested by re-running all the models for the period January to August
2014, projecting through September 2014 to August 2016 and comparing this to the actual
figures over this time.
The monthly distribution of entry and exits to the treatment system between September
2014 and August 2016 is shown in Figure 1. It can be seen that, throughout the period, the
majority of exits were due to unplanned exit (72% of all exits in the period) and the majority
of presentations were re-presentations preceded by an unplanned exit (60% of all
presentations). Completions fell across the period, while the number of re-presentations
that followed a completion remained broadly stable . As these can be re-presentations any
distance after a treatment completion, this does not necessarily imply a rising re-
presentation rate over time.
Figure 1. Opiate monthly treatment entry and exits (September 2014 to August 2016)
0
500
1,000
1,500
2,000
2,500
3,000
3,500
4,000
Sep
tem
ber
20
14
Oct
ob
er 2
01
4
No
vem
ber
20
14
Dec
em
ber
20
14
Jan
uar
y 20
15
Feb
ruar
y 20
15
Mar
ch 2
01
5
Ap
ril 2
01
5
May
20
15
Jun
e 2
01
5
July
201
5
Au
gust
20
15
Sep
tem
ber
20
15
Oct
ob
er 2
01
5
No
vem
ber
20
15
Dec
em
ber
20
15
Jan
uar
y 20
16
Feb
ruar
y 20
16
Mar
ch 2
01
6
Ap
ril 2
01
6
May
20
16
Jun
e 2
01
6
July
201
6
Au
gust
20
16
Naïve presentation Re-presentation following completion
Re-presentation following unplanned exit Completion
Death Unplanned exit

Annex: Predicting the size and characteristics of the drug treatment population – technical methods
9
Viewed more closely, naïve presentations are falling slightly (Figure 2 below). The
model fitted suggests that if this decline continues as it has between 2011 and 2016,
there would be around 684 naïve opiate presentations a month by December 2020
(95% confidence interval [CI]: 554 to 844), down from an average of 862 a month in the
12 months up to August 2016.
Figure 2. Actual and projected treatment naïve opiate presentations (January
2011 to December 2020)
The number of completions, unplanned exits and deaths shown in Figure 1 were converted
to rates in each month, to take into account changes in the size of the overall population and
provide a steadier estimate. It should be noted that these monthly rates will be much lower
than equivalent annual rates as a person is much more likely to be retained in treatment
from month to month than from year to year.
Figure 3 (overleaf) shows the completion rate at each month, as a proportion of the total
number in treatment in that month. This suggests a projected fall to 0.6% completing in a
month by December 2020 (95% CI: 0.5% to 0.7%), from an average of 0.9% in the 12
months up to August 2016.
0
200
400
600
800
1000
1200
1400
Jan
uar
y 20
11
May
20
11
Sep
tem
ber
20
11
Jan
uar
y 20
12
May
20
12
Sep
tem
ber
20
12
Jan
uar
y 20
13
May
20
13
Sep
tem
ber
20
13
Jan
uar
y 20
14
May
20
14
Sep
tem
ber
20
14
Jan
uar
y 20
15
May
20
15
Sep
tem
ber
20
15
Jan
uar
y 20
16
May
20
16
Sep
tem
ber
20
16
Jan
uar
y 20
17
May
20
17
Sep
tem
ber
20
17
Jan
uar
y 20
18
May
20
18
Sep
tem
ber
20
18
Jan
uar
y 20
19
May
20
19
Sep
tem
ber
20
19
Jan
uar
y 20
20
May
20
20
Sep
tem
ber
20
20
First time treatment entry (actual) First time treatment entry (predicted)
Lower confidence interval Upper confidence interval

Annex: Predicting the size and characteristics of the drug treatment population – technical methods
10
0.0%
0.2%
0.4%
0.6%
0.8%
1.0%
1.2%
1.4%
1.6%
Jan
uar
y 20
11
May
20
11
Sep
tem
ber
20
11
Jan
uar
y 20
12
May
20
12
Sep
tem
ber
20
12
Jan
uar
y 20
13
May
20
13
Sep
tem
ber
20
13
Jan
uar
y 20
14
May
20
14
Sep
tem
ber
20
14
Jan
uar
y 20
15
May
20
15
Sep
tem
ber
20
15
Jan
uar
y 20
16
May
20
16
Sep
tem
ber
20
16
Jan
uar
y 20
17
May
20
17
Sep
tem
ber
20
17
Jan
uar
y 20
18
May
20
18
Sep
tem
ber
20
18
Jan
uar
y 20
19
May
20
19
Sep
tem
ber
20
19
Jan
uar
y 20
20
May
20
20
Sep
tem
ber
20
20
Completion rate (actual) Completion rate (predicted)
Lower confidence interval Upper confidence interval
Figure 3. Actual and projected opiate completion rates (January 2011 to December 2020)
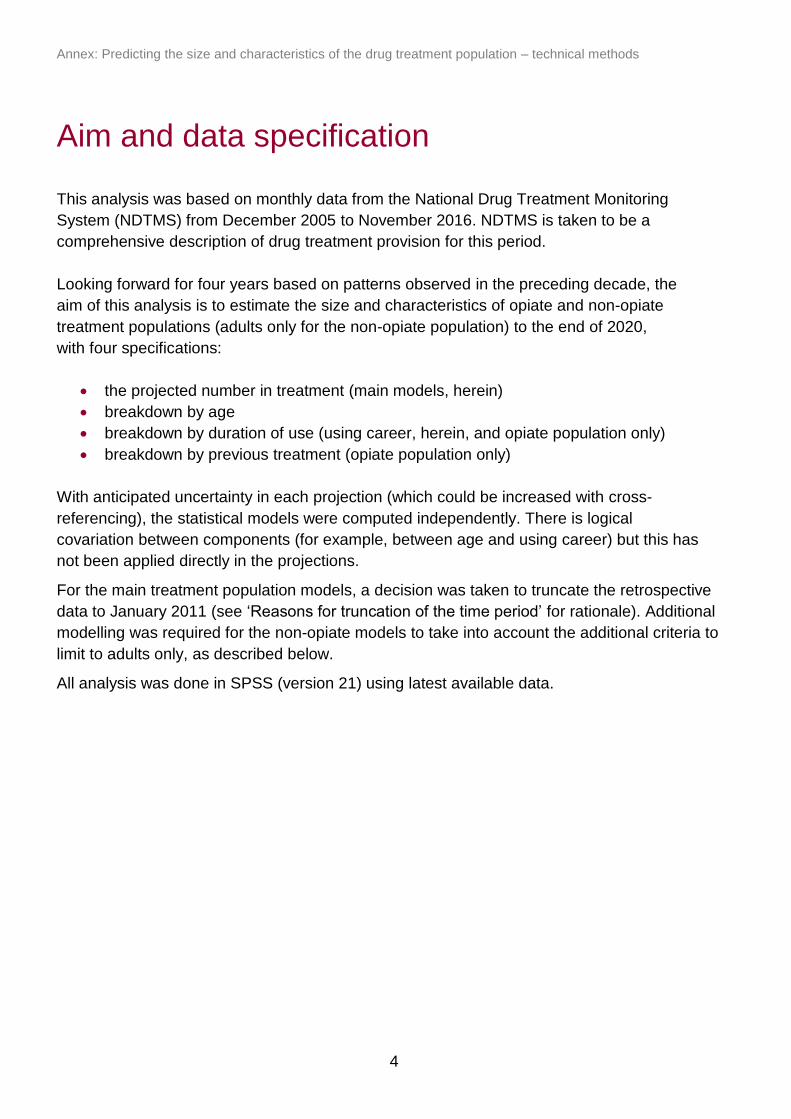
Figure 4 (overleaf) shows the rate of unplanned exits at each month, as a proportion of the
total number in treatment in that month. This suggests a projected rise to around 3.1%
exiting in an unplanned way each month by December 2020 (95% CI: 2.6% to 3.7%), from
an average of 2.6% in the 12 months up to August 2016. The unplanned exit rate has only
increased slightly from an average of 2.2% in 2011, so the prediction suggests a broadly
consistent increasing trend through to 2020, but this is subject to considerable uncertainty
as shown in the confidence intervals.
Annex: Predicting the size and characteristics of the drug treatment population – technical methods
11
Figure 4. Actual and projected opiate rates of unplanned exits from opiate treatment
(January 2011 to December 2020)
Figure 5 (overleaf) shows the mortality rate in treatment at each month, as a proportion of the
total number in treatment in that month. This suggests a projected rise to 0.3% of those in
treatment dying each month by December 2020 (95% CI: 0.2% to 0.3%) from an average of
0.1% in the 12 months to August 2016. It should be noted that this represents a relatively
pessimistic projection of deaths in treatment from the available models. However, other
available models underestimated the number of deaths and there is a notable upturn towards
the end of this period. Furthermore, a rising trend would be consistent with other indicators of
an aging population.
0.0%
0.5%
1.0%
1.5%
2.0%
2.5%
3.0%
3.5%
4.0%
Jan
uar
y 20
11
May
20
11
Sep
tem
ber
20
11
Jan
uar
y 20
12
May
20
12
Sep
tem
ber
20
12
Jan
uar
y 20
13
May
20
13
Sep
tem
ber
20
13
Jan
uar
y 20
14
May
20
14
Sep
tem
ber
20
14
Jan
uar
y 20
15
May
20
15
Sep
tem
ber
20
15
Jan
uar
y 20
16
May
20
16
Sep
tem
ber
20
16
Jan
uar
y 20
17
May
20
17
Sep
tem
ber
20
17
Jan
uar
y 20
18
May
20
18
Sep
tem
ber
20
18
Jan
uar
y 20
19
May
20
19
Sep
tem
ber
20
19
Jan
uar
y 20
20
May
20
20
Sep
tem
ber
20
20
Unplanned exit rate (actual) Unplanned exit rate (predicted)
Lower confidence interval Upper confidence interval

Annex: Predicting the size and characteristics of the drug treatment population – technical methods
12
0.00%
0.05%
0.10%
0.15%
0.20%
0.25%
0.30%
0.35%
0.40%
Jan
uar
y 20
11
May
20
11
Sep
tem
ber
20
11
Jan
uar
y 20
12
May
20
12
Sep
tem
ber
20
12
Jan
uar
y 20
13
May
20
13
Sep
tem
ber
20
13
Jan
uar
y 20
14
May
20
14
Sep
tem
ber
20
14
Jan
uar
y 20
15
May
20
15
Sep
tem
ber
20
15
Jan
uar
y 20
16
May
20
16
Sep
tem
ber
20
16
Jan
uar
y 20
17
May
20
17
Sep
tem
ber
20
17
Jan
uar
y 20
18
May
20
18
Sep
tem
ber
20
18
Jan
uar
y 20
19
May
20
19
Sep
tem
ber
20
19
Jan
uar
y 20
20
May
20
20
Sep
tem
ber
20
20
Mortality rate in treatment (actual) Mortality rate in treatment (predicted)
Lower confidence interval Upper confidence interval
Figure 5. Actual and projected mortality rates in opiate treatment (January 2011 to
December 2020)
Figure 6 (overleaf) shows the actual and projected numbers of re-presentations following
completion or an unplanned exit from January 2011 to December 2020. Projected figures are
based on the re-presentation rates observed across the period and assume that individuals
re-present within a typical distribution of time to re-presentation. It can be seen that these
broadly correspond to actual numbers in recent years and project increased re-presentations
following unplanned exits and reduced re-presentations following completions. It should be
noted that in the latter part of the period these projections are increasingly based on the
projected completion and unplanned exit rates, and hence it can be seen that projected re-
presentations following treatment completions logically result from the projected fall in
completion rates. The total number of re-presentations each month is projected to fall slightly
by 2020, to just under 2,900 from an average of just over 3,000 a month on average in the 12
months up to August 2016.

Annex: Predicting the size and characteristics of the drug treatment population – technical methods
13
Figure 6. Actual and projected number of re-presentations following completion or
unplanned exit from opiate treatment (January 2011 to September 2020)
Testing of main models
The main opiate models were tested for the period September 2014 to August 2016. For this,
we ran identical models on the period January 2011 to August 2014 and projected through to
August 2016. On September 2014 there were 115,937 opiate users in treatment and on 1
September 2016 this had fallen to 109,558. Using the central estimates from each of the
main opiate models led to a projected number in treatment on 1 September 2016 of 110,245,
meaning that the models projected an overall fall slightly smaller than that which actually
occurred.
It should be noted that opiate treatment journeys tend to be relatively long, with a large number
of individuals retained in treatment from month to month, which limits the impact of any
volatility in these models. The decline of 6,379 in the opiate treatment population over this time
is accounted for by 95,307 new presentations to treatment and 101,686 treatment exits (ie,
6.7% more exits than presentations). The models predicted a fall of 5,692, based on 94,476
new presentations to treatment and 100,168 exits (6.0% more exits than presentations). This
slight shortfall was largely due to the model under-predicting unplanned exit rates in the test
period, as there was an acceleration in the increasing trend in unplanned exit rates in this
period.
0
500
1,000
1,500
2,000
2,500
3,000
3,500
Jan
uar
y 20
11
May
20
11
Sep
tem
ber
20
11
Jan
uar
y 20
12
May
20
12
Sep
tem
ber
20
12
Jan
uar
y 20
13
May
20
13
Sep
tem
ber
20
13
Jan
uar
y 20
14
May
20
14
Sep
tem
ber
20
14
Jan
uar
y 20
15
May
20
15
Sep
tem
ber
20
15
Jan
uar
y 20
16
May
20
16
Sep
tem
ber
20
16
Jan
uar
y 20
17
May
20
17
Sep
tem
ber
20
17
Jan
uar
y 20
18
May
20
18
Sep
tem
ber
20
18
Jan
uar
y 20
19
May
20
19
Sep
tem
ber
20
19
Jan
uar
y 20
20
May
20
20
Sep
tem
ber
20
20
Re-presentation following completion (PREDICTED) Re-presentation following unplanned exit (PREDICTED)
Re-presentation following completion (ACTUAL) Re-presentation following unplanned exit (ACTUAL)
Annex: Predicting the size and characteristics of the drug treatment population – technical methods
14
35%
20%
8%3%
43%
45%
39%
24%
17%
27%
37%
43%
4% 7%13%
24%
2% 6%
0%
10%
20%
30%
40%
50%
60%
70%
80%
90%
100%
End of 2005 End of 2010 End of 2015 End of 2020 (projected)
Under 30 30-39 40-49 50-59 60 and over
Summary of main models
In summary, the main models suggest that the factors which influence overall numbers in
treatment – naïve presentations, treatment exits for different reasons and re-presentations
following those exits – will each continue to increase or decrease in keeping with generally
clear recent trends. Overall, these projections suggest a continuation of the trend in recent
years that exits from treatment exceed new presentations to treatment, which would suggest a
continuing marked decline in treatment numbers. Model components are subject to uncertainty
and must be interpreted in the light of the stated assumptions and caveats.
Age model
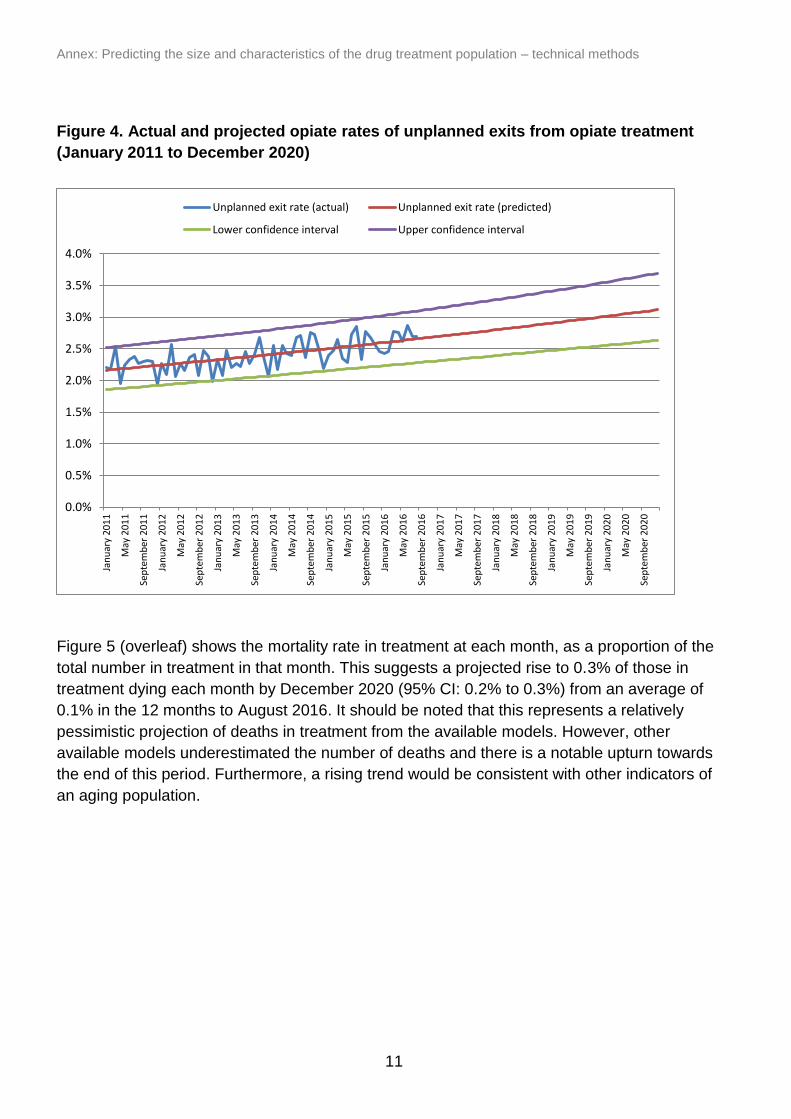
Figure 7 shows the actual and projected proportions of the opiate treatment population by age
group at five-yearly intervals. This shows that at the end of 2005 the largest proportion of opiate
users in treatment were in the 30-39 age group (43%), followed by those under 30 (35%). By
the end of 2015, the 30-39 age group remains the largest group (39%), but the 40-49 age
group has increased from 17% to 37%, with the proportion under 30 falling to 8%. The
projection for the end of 2020 suggests a continuation this pattern of an ageing population, with
the 40-49 age group becoming the largest (43%), the 30-39 and 50-59 age groups being similar
to one another in size (around 24%) and the under 30 age group falling further (3%).
Figure 7. Actual and projected proportions of the opiate treatment population by age group (2005 to 2020)
Annex: Predicting the size and characteristics of the drug treatment population – technical methods
15
45%
30%20%
13%
24%
27%
16%
12%
14%
20%
24%
14%
10%11%
19%
23%
8%12%
20%
38%
0%
10%
20%
30%
40%
50%
60%
70%
80%
90%
100%
End of 2005 End of 2010 End of 2015 End of 2020 (projected)
Fewer than 10 years 10-15 years 15-20 years 20-25 years 25 or more years
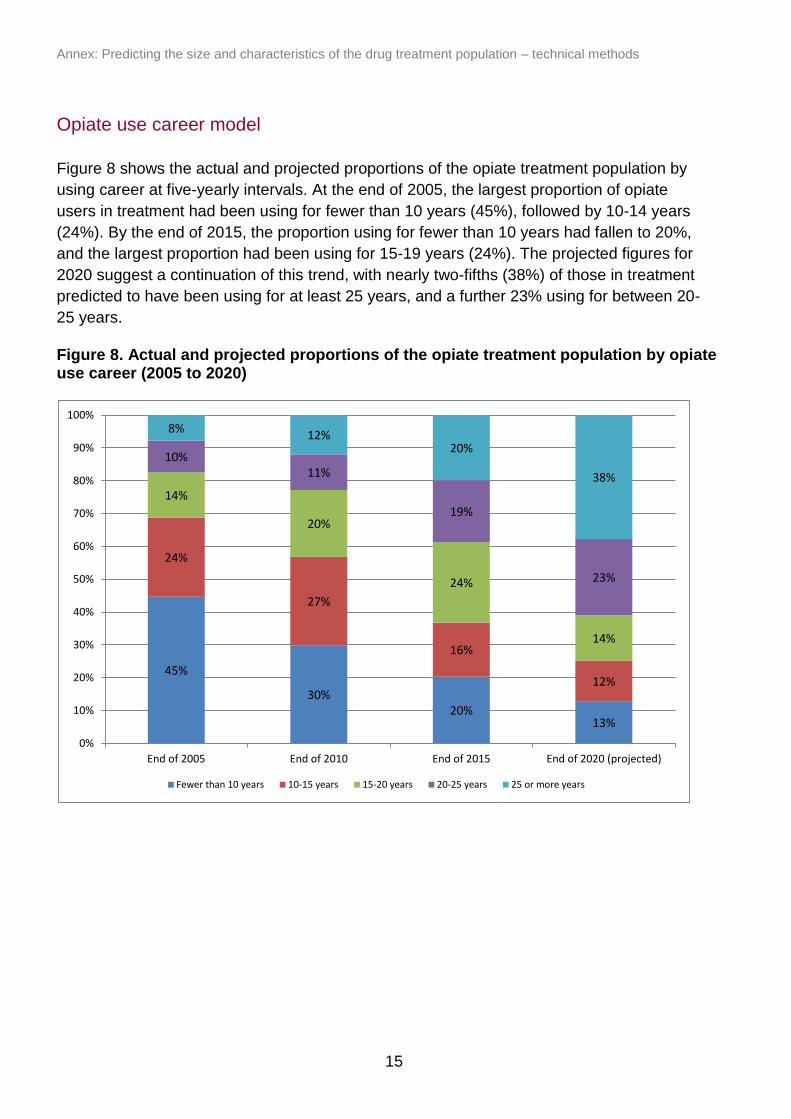
Opiate use career model
Figure 8 shows the actual and projected proportions of the opiate treatment population by
using career at five-yearly intervals. At the end of 2005, the largest proportion of opiate
users in treatment had been using for fewer than 10 years (45%), followed by 10-14 years
(24%). By the end of 2015, the proportion using for fewer than 10 years had fallen to 20%,
and the largest proportion had been using for 15-19 years (24%). The projected figures for
2020 suggest a continuation of this trend, with nearly two-fifths (38%) of those in treatment
predicted to have been using for at least 25 years, and a further 23% using for between 20-
25 years.
Figure 8. Actual and projected proportions of the opiate treatment population by opiate use career (2005 to 2020)
Annex: Predicting the size and characteristics of the drug treatment population – technical methods
16
80%
45%
32% 29%
16%
25%
23%21%
14%
16%
12%
8%
11%
12%
8%18%
27%
0%
10%
20%
30%
40%
50%
60%
70%
80%
90%
100%
End of 2005 End of 2010 End of 2015 End of 2020
No previous attempts One previous attempt Two previous attempt
Three previous attempts Four or more previous attempts
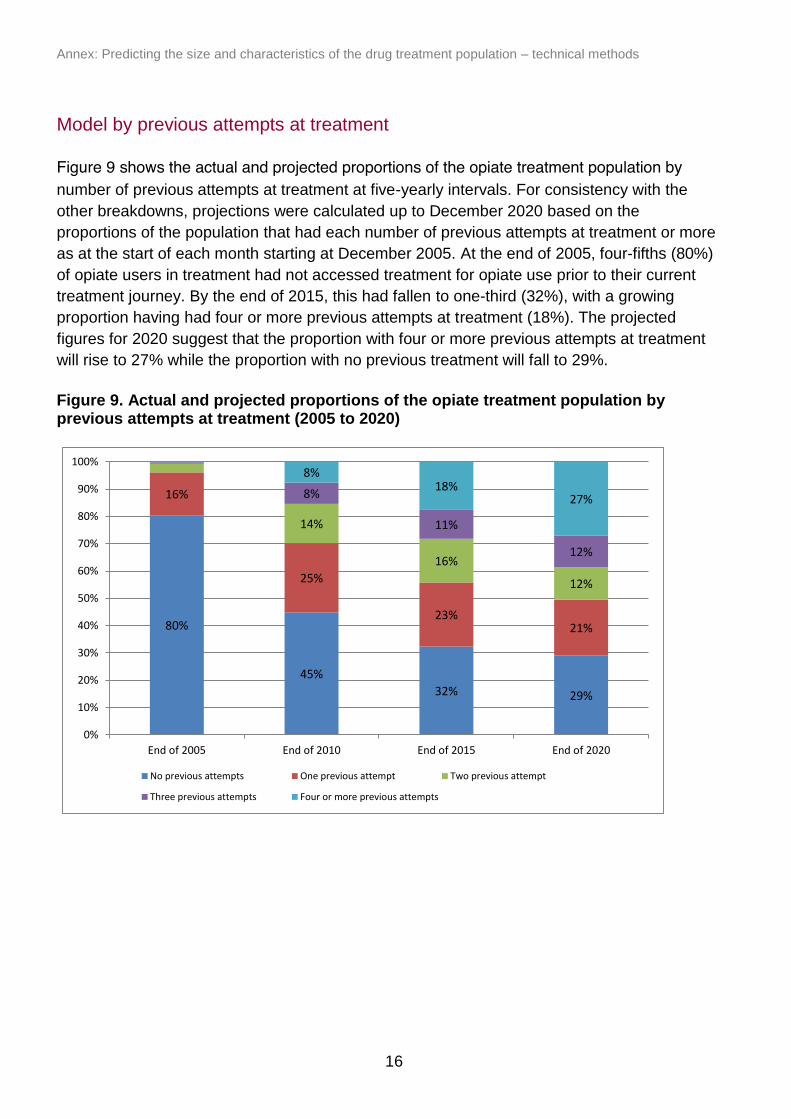
Model by previous attempts at treatment
number of previous attempts at treatment at five-yearly intervals. For consistency with the
other breakdowns, projections were calculated up to December 2020 based on the
proportions of the population that had each number of previous attempts at treatment or more
as at the start of each month starting at December 2005. At the end of 2005, four-fifths (80%)
of opiate users in treatment had not accessed treatment for opiate use prior to their current
treatment journey. By the end of 2015, this had fallen to one-third (32%), with a growing
proportion having had four or more previous attempts at treatment (18%). The projected
figures for 2020 suggest that the proportion with four or more previous attempts at treatment
will rise to 27% while the proportion with no previous treatment will fall to 29%.
Figure 9. Actual and projected proportions of the opiate treatment population by previous attempts at treatment (2005 to 2020)
Figure 9 shows the actual and projected proportions of the opiate treatment population by

Annex: Predicting the size and characteristics of the drug treatment population – technical methods
17
0
500
1000
1500
2000
2500
Sep
tem
ber
20
14
Oct
ob
er 2
01
4
No
vem
ber
20
14
Dec
em
ber
20
14
Jan
uar
y 20
15
Feb
ruar
y 20
15
Mar
ch 2
01
5
Ap
ril 2
01
5
May
20
15
Jun
e 2
01
5
July
201
5
Au
gust
20
15
Sep
tem
ber
20
15
Oct
ob
er 2
01
5
No
vem
ber
20
15
Dec
em
ber
20
15
Jan
uar
y 20
16
Feb
ruar
y 20
16
Mar
ch 2
01
6
Ap
ril 2
01
6
May
20
16
Jun
e 2
01
6
July
201
6
Au
gust
20
16
Naïve presentation Re-presentation following completion
Re-presentation following unplanned exit Completion
Death Unplanned exit
Projections for non-opiate treatment
Main models
The models for non-opiates were constructed for the period January 2011 to August 2016.
The final model was tested by repeating the full model for the period January 2011 to
August 2014, projecting through September 2014 to August 2016 and comparing this to the
actual figures over this time.
The breakdown of non-opiate presentations to and exits from treatment is shown in Figure
10. Unlike the equivalent figures for opiates, the majority of exits from treatment for non-
opiates are completions (57% of all exits in the period), while even towards the end of the
period the majority of presentations to treatment are treatment naïve (63% of all
presentations in the period), with far fewer re-presentations.
Figure 10. Non-opiate monthly treatment entry and exits (September 2014 to August 2016)
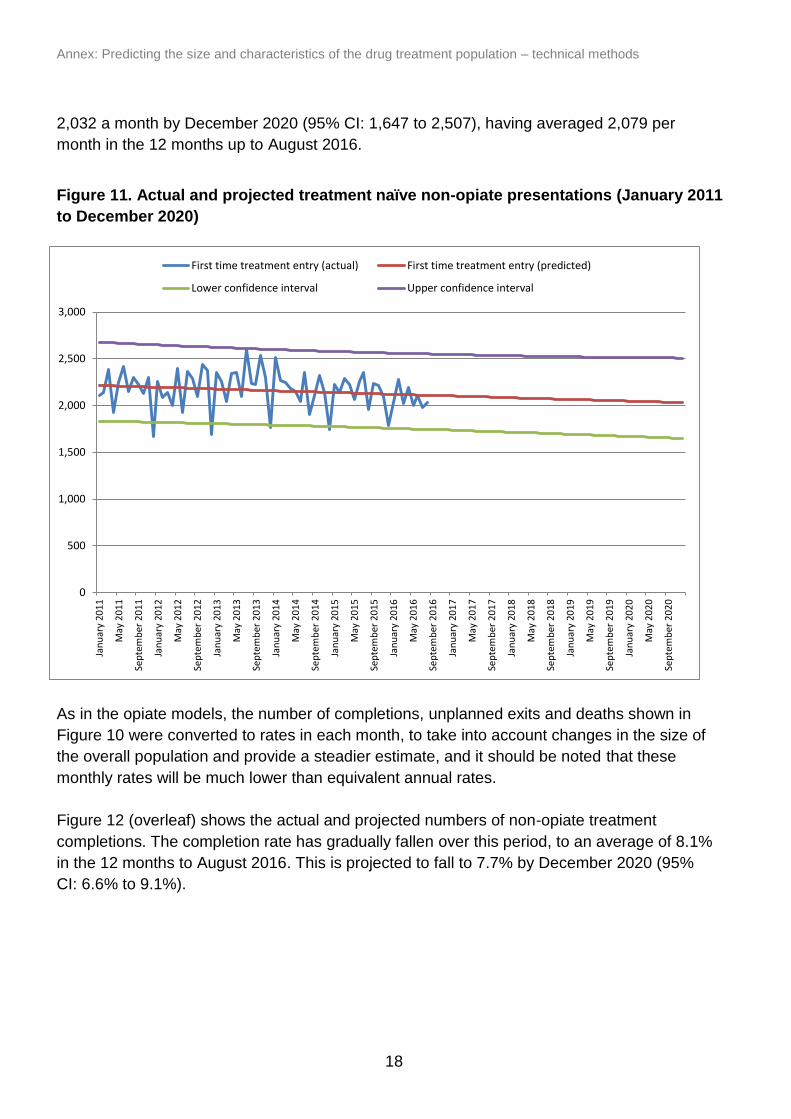
Figure 11 (overleaf) shows the actual and projected numbers of treatment naïve
presentations for non-opiates. It can be seen that these fluctuate and peaked with 2,596
in July 2013 but have generally fallen in recent years. They are projected to fall to around
Annex: Predicting the size and characteristics of the drug treatment population – technical methods
18
0
500
1,000
1,500
2,000
2,500
3,000
Jan
uar
y 20
11
May
20
11
Sep
tem
ber
20
11
Jan
uar
y 20
12
May
20
12
Sep
tem
ber
20
12
Jan
uar
y 20
13
May
20
13
Sep
tem
ber
20
13
Jan
uar
y 20
14
May
20
14
Sep
tem
ber
20
14
Jan
uar
y 20
15
May
20
15
Sep
tem
ber
20
15
Jan
uar
y 20
16
May
20
16
Sep
tem
ber
20
16
Jan
uar
y 20
17
May
20
17
Sep
tem
ber
20
17
Jan
uar
y 20
18
May
20
18
Sep
tem
ber
20
18
Jan
uar
y 20
19
May
20
19
Sep
tem
ber
20
19
Jan
uar
y 20
20
May
20
20
Sep
tem
ber
20
20
First time treatment entry (actual) First time treatment entry (predicted)
Lower confidence interval Upper confidence interval
2,032 a month by December 2020 (95% CI: 1,647 to 2,507), having averaged 2,079 per
month in the 12 months up to August 2016.
Figure 11. Actual and projected treatment naïve non-opiate presentations (January 2011
to December 2020)
As in the opiate models, the number of completions, unplanned exits and deaths shown in
Figure 10 were converted to rates in each month, to take into account changes in the size of
the overall population and provide a steadier estimate, and it should be noted that these
monthly rates will be much lower than equivalent annual rates.
Figure 12 (overleaf) shows the actual and projected numbers of non-opiate treatment
completions. The completion rate has gradually fallen over this period, to an average of 8.1%
in the 12 months to August 2016. This is projected to fall to 7.7% by December 2020 (95%
CI: 6.6% to 9.1%).

Annex: Predicting the size and characteristics of the drug treatment population – technical methods
19
0%
2%
4%
6%
8%
10%
12%
Jan
uar
y 20
11
May
20
11
Sep
tem
ber
20
11
Jan
uar
y 20
12
May
20
12
Sep
tem
ber
20
12
Jan
uar
y 20
13
May
20
13
Sep
tem
ber
20
13
Jan
uar
y 20
14
May
20
14
Sep
tem
ber
20
14
Jan
uar
y 20
15
May
20
15
Sep
tem
ber
20
15
Jan
uar
y 20
16
May
20
16
Sep
tem
ber
20
16
Jan
uar
y 20
17
May
20
17
Sep
tem
ber
20
17
Jan
uar
y 20
18
May
20
18
Sep
tem
ber
20
18
Jan
uar
y 20
19
May
20
19
Sep
tem
ber
20
19
Jan
uar
y 20
20
May
20
20
Sep
tem
ber
20
20
Completion rate (actual) Completion rate (predicted)
Lower confidence interval Upper confidence interval
Figure 12. Actual and projected non-opiate completion rates (January 2011 to December
2020)
Actual and predicted unplanned exit rates from treatment for non-opiate use are shown in
Figure 13 (overleaf). Unplanned exit rates for non-opiates have steadily risen across the
period, to an average of 6.3% in the 12 months up to August 2016. These are projected to
rise further 6.7% in December 2020 (95% CI: 5.6% to 8.1%).

Annex: Predicting the size and characteristics of the drug treatment population – technical methods
20
Figure 13. Actual and projected rates of unplanned exits from non-opiate treatment
(January 2011 to December 2020)
Figure 14 (overleaf) shows actual and predicted mortality rates for non-opiate users in
treatment. These are much lower than the equivalent rates for opiate users. The average
monthly mortality rate in non-opiate treatment was 0.07% in the 12 months up to August
2016, but shows signs of increasing and is projected to increase to 0.09% (95% CI: <0.01%
to 0.17%) by December 2020.
0%
1%
2%
3%
4%
5%
6%
7%
8%
9%
Jan
uar
y 20
11
May
20
11
Sep
tem
ber
20
11
Jan
uar
y 20
12
May
20
12
Sep
tem
ber
20
12
Jan
uar
y 20
13
May
20
13
Sep
tem
ber
20
13
Jan
uar
y 20
14
May
20
14
Sep
tem
ber
20
14
Jan
uar
y 20
15
May
20
15
Sep
tem
ber
20
15
Jan
uar
y 20
16
May
20
16
Sep
tem
ber
20
16
Jan
uar
y 20
17
May
20
17
Sep
tem
ber
20
17
Jan
uar
y 20
18
May
20
18
Sep
tem
ber
20
18
Jan
uar
y 20
19
May
20
19
Sep
tem
ber
20
19
Jan
uar
y 20
20
May
20
20
Sep
tem
ber
20
20
Unplanned exit rate (actual) Unplanned exit rate (predicted)
Lower confidence interval Upper confidence interval

Annex: Predicting the size and characteristics of the drug treatment population – technical methods
21
Figure 14. Actual and projected mortality rate in treatment for non-opiates (January 2011
to December 2020)
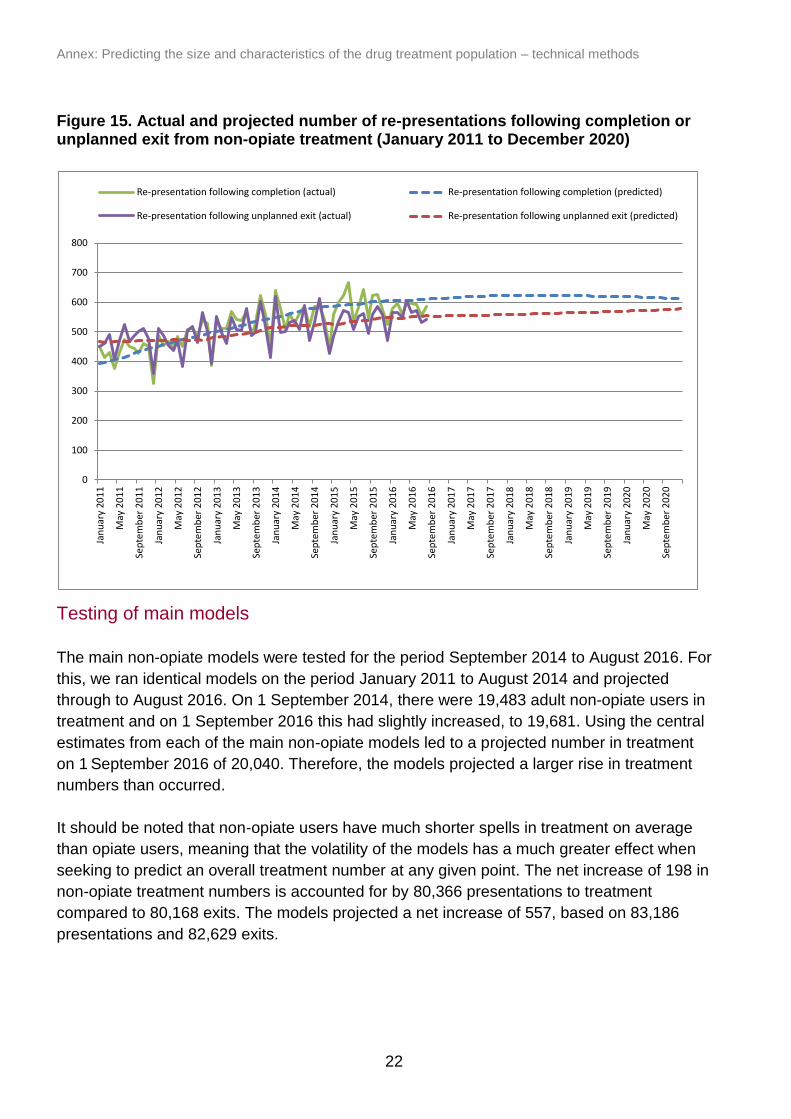
Figure 15 (overleaf) shows the actual and projected re-presentation rates following unplanned
exits and completions over this period. Similarly to the opiate models, the projected re-
presentations for non-opiate use show broad parity with the actual numbers of re-presentations.
The number of re-presentations is projected to remain broadly similar both for re-presntations
following unplanned exits and following treamtent completions. Again, similarly to the opiate
models, it should be borne in mind that the later projected re-presentations will be based on
projected completion and unplanned exit rates, and hence reflect the directions of travel shown
in those models.
0.0%
0.1%
0.2%
0.3%
0.4%
0.5%
Jan
uar
y 20
11
May
20
11
Sep
tem
ber
20
11
Jan
uar
y 20
12
May
20
12
Sep
tem
ber
20
12
Jan
uar
y 20
13
May
20
13
Sep
tem
ber
20
13
Jan
uar
y 20
14
May
20
14
Sep
tem
ber
20
14
Jan
uar
y 20
15
May
20
15
Sep
tem
ber
20
15
Jan
uar
y 20
16
May
20
16
Sep
tem
ber
20
16
Jan
uar
y 20
17
May
20
17
Sep
tem
ber
20
17
Jan
uar
y 20
18
May
20
18
Sep
tem
ber
20
18
Jan
uar
y 20
19
May
20
19
Sep
tem
ber
20
19
Jan
uar
y 20
20
May
20
20
Sep
tem
ber
20
20
Mortality rate in treatment (actual) Mortality rate in treatment (predicted)
Lower confidence interval Upper confidence interval
Annex: Predicting the size and characteristics of the drug treatment population – technical methods
22
0
100
200
300
400
500
600
700
800
Jan
uar
y 20
11
May
20
11
Sep
tem
ber
20
11
Jan
uar
y 20
12
May
20
12
Sep
tem
ber
20
12
Jan
uar
y 20
13
May
20
13
Sep
tem
ber
20
13
Jan
uar
y 20
14
May
20
14
Sep
tem
ber
20
14
Jan
uar
y 20
15
May
20
15
Sep
tem
ber
20
15
Jan
uar
y 20
16
May
20
16
Sep
tem
ber
20
16
Jan
uar
y 20
17
May
20
17
Sep
tem
ber
20
17
Jan
uar
y 20
18
May
20
18
Sep
tem
ber
20
18
Jan
uar
y 20
19
May
20
19
Sep
tem
ber
20
19
Jan
uar
y 20
20
May
20
20
Sep
tem
ber
20
20
Re-presentation following completion (actual) Re-presentation following completion (predicted)
Re-presentation following unplanned exit (actual) Re-presentation following unplanned exit (predicted)
Figure 15. Actual and projected number of re-presentations following completion or unplanned exit from non-opiate treatment (January 2011 to December 2020)
Testing of main models
The main non-opiate models were tested for the period September 2014 to August 2016. For
this, we ran identical models on the period January 2011 to August 2014 and projected
through to August 2016. On 1 September 2014, there were 19,483 adult non-opiate users in
treatment and on 1 September 2016 this had slightly increased, to 19,681. Using the central
estimates from each of the main non-opiate models led to a projected number in treatment
on 1 September 2016 of 20,040. Therefore, the models projected a larger rise in treatment
numbers than occurred.
It should be noted that non-opiate users have much shorter spells in treatment on average
than opiate users, meaning that the volatility of the models has a much greater effect when
seeking to predict an overall treatment number at any given point. The net increase of 198 in
non-opiate treatment numbers is accounted for by 80,366 presentations to treatment
compared to 80,168 exits. The models projected a net increase of 557, based on 83,186
presentations and 82,629 exits.

Annex: Predicting the size and characteristics of the drug treatment population – technical methods
23
25% 24%19%
13%
35%31%
33%
33%
28%28%
26%29%
12%17% 21% 25%
0%
10%
20%
30%
40%
50%
60%
70%
80%
90%
100%
End of 2005 End of 2010 End of 2015 End of 2020 (projected)
Under 25 25-34 35-44 45 and over
Summary of main models
In summary, the different models suggest that the factors which influence overall numbers in
non-opiate treatment – naïve presentations, treatment exits for different reasons and re-
presentations following those exits – will each continue to increase or decrease generally in
keeping with current trends. Overall, these projections suggest that treatment numbers will
continue to remain at a similar level to now, and this is consistent with what we have seen in
recent years.
Age model
Figure 16 shows the actual and projected proportions of the adult non-opiate treatment
population by age group at five-yearly intervals. As with the equivalent model for opiates, this
was estimated by projecting the proportions at each age group or higher as at each month. This
shows that the largest group of non-opiate users are aged 25-34 (33% at the end of 2015) and,
although this proportion is projected to fall slightly, they are still projected to remain the largest
group by December 2020 (33%). The proportion of the non-opiate population aged 18-24 has
fallen from 25% in 2005 to 19% in 2015 and is projected to fall further to 13% by the end of
2020, while the population aged 45 or over has increased from 12% in 2005 to 21% in 2015
and is projected to rise further to 25% by the end of 2020. Therefore, the non-opiate population
is experiencing an ageing trend, but not as acute as that seen in the opiate population.
Figure 16. Actual and projected proportions of the non-opiate treatment population by age group (2005 to 2020)
Annex: Predicting the size and characteristics of the drug treatment population – technical methods
24
0
1,000
2,000
3,000
4,000
5,000
6,000
Dec
em
ber
20
05
Ap
ril 2
00
6
Au
gust
20
06
Dec
em
ber
20
06
Ap
ril 2
00
7
Au
gust
20
07
Dec
em
ber
20
07
Ap
ril 2
00
8
Au
gust
20
08
Dec
em
ber
20
08
Ap
ril 2
00
9
Au
gust
20
09
Dec
em
ber
20
09
Ap
ril 2
01
0
Au
gust
20
10
Dec
em
ber
20
10
Ap
ril 2
01
1
Au
gust
20
11
Dec
em
ber
20
11
Ap
ril 2
01
2
Au
gust
20
12
Dec
em
ber
20
12
Ap
ril 2
01
3
Au
gust
20
13
Dec
em
ber
20
13
Ap
ril 2
01
4
Au
gust
20
14
Dec
em
ber
20
14
Ap
ril 2
01
5
Au
gust
20
15
Dec
em
ber
20
15
Ap
ril 2
01
6
Au
gust
20
16
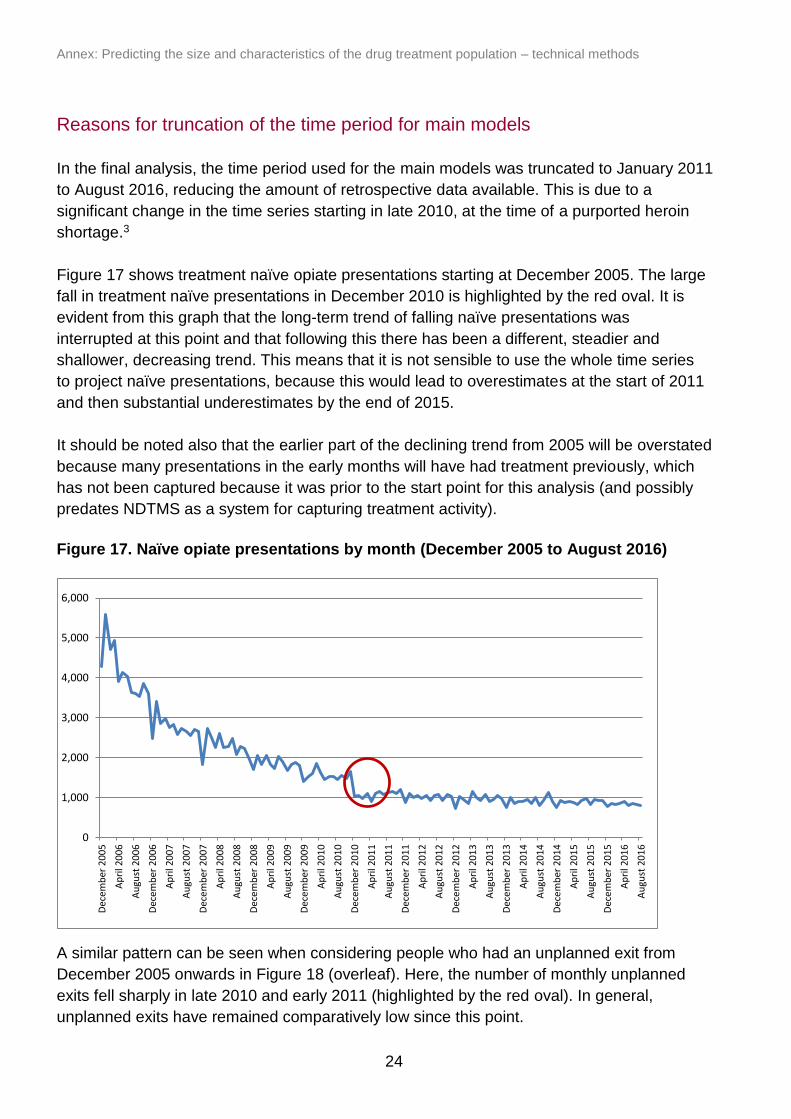
Reasons for truncation of the time period for main models
In the final analysis, the time period used for the main models was truncated to January 2011
to August 2016, reducing the amount of retrospective data available. This is due to a
significant change in the time series starting in late 2010, at the time of a purported heroin
shortage.3
Figure 17 shows treatment naïve opiate presentations starting at December 2005. The large
fall in treatment naïve presentations in December 2010 is highlighted by the red oval. It is
evident from this graph that the long-term trend of falling naïve presentations was
interrupted at this point and that following this there has been a different, steadier and
shallower, decreasing trend. This means that it is not sensible to use the whole time series
to project naïve presentations, because this would lead to overestimates at the start of 2011
and then substantial underestimates by the end of 2015.
It should be noted also that the earlier part of the declining trend from 2005 will be overstated
because many presentations in the early months will have had treatment previously, which
has not been captured because it was prior to the start point for this analysis (and possibly
predates NDTMS as a system for capturing treatment activity).
Figure 17. Naïve opiate presentations by month (December 2005 to August 2016)
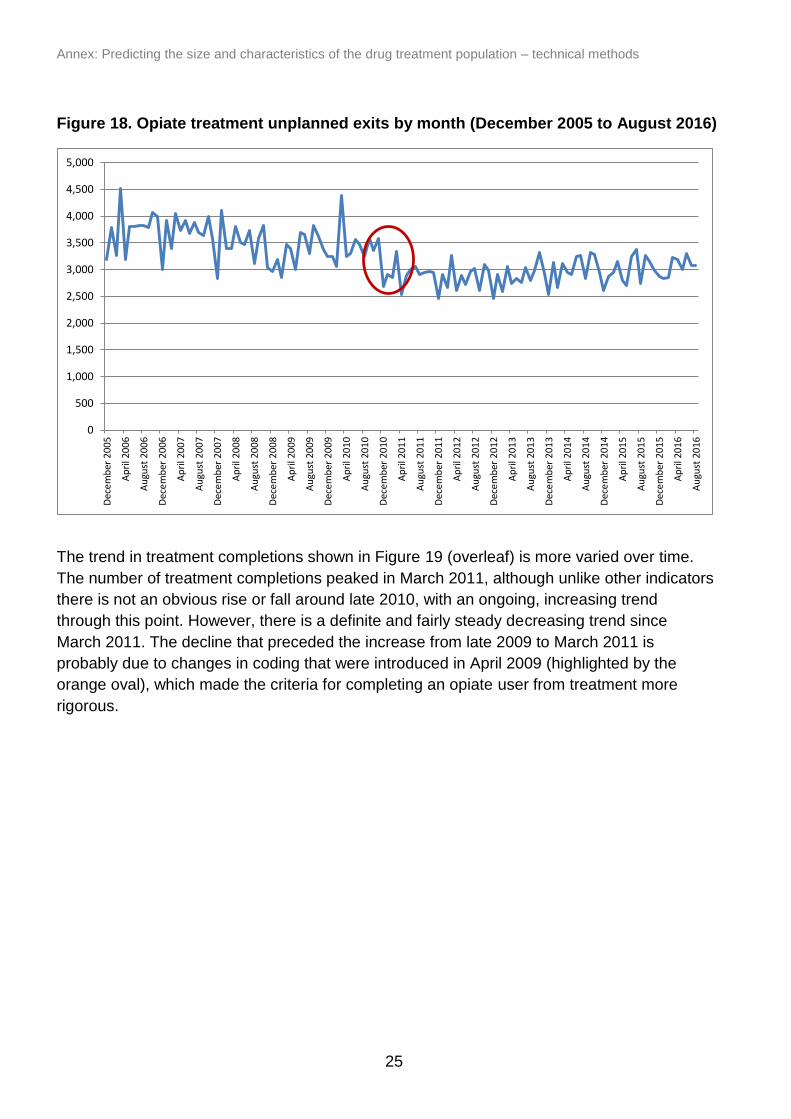
A similar pattern can be seen when considering people who had an unplanned exit from
December 2005 onwards in Figure 18 (overleaf). Here, the number of monthly unplanned
exits fell sharply in late 2010 and early 2011 (highlighted by the red oval). In general,
unplanned exits have remained comparatively low since this point.
Annex: Predicting the size and characteristics of the drug treatment population – technical methods
25
0
500
1,000
1,500
2,000
2,500
3,000
3,500
4,000
4,500
5,000
Dec
em
ber
20
05
Ap
ril 2
00
6
Au
gust
20
06
Dec
em
ber
20
06
Ap
ril 2
00
7
Au
gust
20
07
Dec
em
ber
20
07
Ap
ril 2
00
8
Au
gust
20
08
Dec
em
ber
20
08
Ap
ril 2
00
9
Au
gust
20
09
Dec
em
ber
20
09
Ap
ril 2
01
0
Au
gust
20
10
Dec
em
ber
20
10
Ap
ril 2
01
1
Au
gust
20
11
Dec
em
ber
20
11
Ap
ril 2
01
2
Au
gust
20
12
Dec
em
ber
20
12
Ap
ril 2
01
3
Au
gust
20
13
Dec
em
ber
20
13
Ap
ril 2
01
4
Au
gust
20
14
Dec
em
ber
20
14
Ap
ril 2
01
5
Au
gust
20
15
Dec
em
ber
20
15
Ap
ril 2
01
6
Au
gust
20
16
Figure 18. Opiate treatment unplanned exits by month (December 2005 to August 2016)
The trend in treatment completions shown in Figure 19 (overleaf) is more varied over time.
The number of treatment completions peaked in March 2011, although unlike other indicators
there is not an obvious rise or fall around late 2010, with an ongoing, increasing trend
through this point. However, there is a definite and fairly steady decreasing trend since
March 2011. The decline that preceded the increase from late 2009 to March 2011 is
probably due to changes in coding that were introduced in April 2009 (highlighted by the
orange oval), which made the criteria for completing an opiate user from treatment more
rigorous.

Annex: Predicting the size and characteristics of the drug treatment population – technical methods
26
0
200
400
600
800
1000
1200
1400
1600
1800
2000
De
cem
ber
20
05
May
20
06
Oct
ob
er
20
06
Mar
ch 2
00
7
Au
gust
20
07
Jan
uar
y 2
00
8
Jun
e 2
00
8
No
vem
be
r 2
00
8
Ap
ril 2
00
9
Sep
tem
be
r 2
00
9
Feb
ruar
y 2
01
0
July
20
10
De
cem
ber
20
10
May
20
11
Oct
ob
er
20
11
Mar
ch 2
01
2
Au
gust
20
12
Jan
uar
y 2
01
3
Jun
e 2
01
3
No
vem
be
r 2
01
3
Ap
ril 2
01
4
Sep
tem
be
r 2
01
4
Feb
ruar
y 2
01
5
July
20
15
De
cem
ber
20
15
May
20
16
Figure 19. Opiate treatment completions by month (December 2005 to August 2016)
Taken together, these patterns suggest that the trends in opiate treatment activity in the six
years from January 2011 are not consistent with the trends prior to this point. This is why we
have chosen to truncate the retrospective data used to January 2011. However, it should be
noted that truncating the follow-up period to this extent should mean that subsequent
projections are regarded with greater uncertainty, because they are based on a much smaller
amount of retrospective data. In effect, these models assume that the situation between
2011-2016 will be maintained for the following four years.
There were also falls in re-presentations to treatment following both completions and
unplanned exits at the time of the purported heroin shortage, which the modelled re-
presentation figures do not predict. However, these estimates seem to predict more recent
figures with a high degree of accuracy.
For consistency, the same truncation of the time period was applied to the non-opiate
models, although there is not the same direct effect.
Annex: Predicting the size and characteristics of the drug treatment population – technical methods
27
References
1. Hay G, Rael dos Santos A, Worsley J. Estimates of the Prevalence of Opiate Use and/or Crack Cocaine Use, 2011/12: Sweep 8 report [Internet]. 2012 [cited 2016 Jun 5]. Available from: http://www.nta.nhs.uk/uploads/estimates-of-the-prevalence-of-opiate-use-and-or-crack-cocaine-use-2011-12.pdf
2. Morgan N, Heap D, Elliott A, Millar T. New opiate and crack-cocaine users: characteristics and trends Nick Morgan, Daniel Heap, Amy Elliott, Tim Millar. Home Office; 2016 Jan. Report No.: Research Report 90.
3. Ahmad M, Richardson A. Impact of the reduction in heroin supply between 2010 and 2011. Home Office; 2016 Jan. Report No.: Research Report 91.