predicting truck crash involvement: 2018...
TRANSCRIPT

July 2018
Predicting Truck Crash Involvement: 2018 Update
Predicting Truck Crash Involvement: 2018 Update
July 2018
Caroline Boris Research Analyst
American Transportation Research Institute St. Paul, MN
Dan Murray
Vice President, Research American Transportation Research Institute
St. Paul, MN
950 N. Glebe Road, Suite 210 Arlington, Virginia 22203
ATRI BOARD OF DIRECTORS
Judy McReynolds Chairman of the ATRI Board Chairman, President and CEO ArcBest Corporation Fort Smith, AR
Andrew Boyle Co-President Boyle Transportation Billerica, MA
Michael L. Ducker President and CEO FedEx Freight Memphis, TN
Rich Freeland President and COO Cummins Inc. Columbus, IN
Darren D. Hawkins CEO YRC Worldwide YRC Worldwide Overland Park, KS
Dave Huneryager President and CEO Tennessee Trucking Association Nashville, TN
Derek Leathers President and CEO Werner Enterprises Omaha, NE
Robert E. Low President and CEO Prime Inc. Springfield, MO
Rich McArdle President UPS Freight Richmond, VA
Benjamin J. McLean CEO Ruan Transportation Management Des Moines, IA
Dennis Nash Executive Chairman of the Board Kenan Advantage Group North Canton, OH
Gregory L. Owen Head Coach and CEO Ability/ Tri-Modal Transportation Services Carson, CA
James D. Reed President and CEO USA Truck Van Buren, AR
Annette Sandberg President and CEO Transsafe Consulting, LLC Davenport, WA
Rebecca M. Brewster President and COO American Transportation Research Institute Atlanta, GA
Chris Spear President and CEO American Trucking Associations Arlington, VA
ATRI RESEARCH ADVISORY COMMITTEE
Karen Rasmussen, RAC Chairman Chief Executive Officer HELP Inc. Jon Blackham Policy and Government Affairs Canadian Trucking Alliance Amy Boerger Vice President, Sales Cummins, Inc. Bill Brown Manager of Fleet Telematics Southeastern Freight Lines Bob Costello Senior Vice President and Chief Economist American Trucking Associations Tom Cuthbertson Vice President, Regulatory Compliance Omnitracs, LLC Dennis Dellinger President Cargo Transporters Chip Duden Vice President, Strategic Business Analytics Werner Enterprises Paul J. Enos Chief Executive Officer Nevada Trucking Association Thomas Fansler President Trimble Transport Mobility Scott George Chief Executive Officer TCW, Inc.
Mike Golias Director for Research, Intermodal Freight Transportation Institute University of Memphis Victor Hart Director of Safety DOT Transportation, Inc. Sanford Hodes Ryder System, Inc. Senior Vice President and Deputy General Counsel Ken Howden Director, 21st Century Truck Partnership U.S. Department of Energy Kelly Killingsworth Vice President of Inbound Transportation Wal-mart Stores, Inc. Victoria King Vice President Public Affairs UPS Dustin Koehl Vice President, Sales and Marketing Total Transportation of Mississippi Caroline Mays Director, Freight and International Trade Section Texas DOT Lisa Mullings President and CEO National Association of Truck Stop Operators Tom Murtha Senior Planner Chicago Metropolitan Agency for Planning
Brenda Neville President Iowa Motor Truck Association Dean Newell Vice President, Safety Maverick, Inc. Steve Raetz Director of Research and Market Intelligence C.H. Robinson Worldwide, Inc. Wellington F. Roemer, III President and CEO Wellington F. Roemer Insurance, Inc. Lee Sarratt Director of Safety J.B. Hunt Mark Savage Deputy Chief Colorado State Patrol Andrea Sequin Director, Regulatory Services Schneider National, Inc. Carl Stebbins Corporate Director of Admissions and Marketing New England Tractor Trailer Training School Harold Sumerford, Jr. Chief Executive Officer J&M Tank Lines James E. Ward President and CEO D.M. Bowman Tom Weakley Director of Operations Owner-Operator Independent Drivers Association Foundation

1 Predicting Truck Crash Involvement - 2018
ACKNOWLEDGEMENTS
The American Transportation Research Institute (ATRI) would like to thank Dr. Brenda Lantz for her important contribution to the driver data analysis. Dr. Lantz is a specialist in commercial vehicle safety research and she currently serves as the Associate Director of the Upper Great Plains Transportation Institute at North Dakota State University. ATRI would also like to express appreciation to the numerous commercial motor vehicle law enforcement and state Department of Transportation personnel who were interviewed for this study.
Predicting Truck Crash Involvement - 2018 2
LIST OF ACRONYMS ATRI American Transportation Research Institute CDL Commercial Drivers License CDLIS Commercial Drivers License Information System CMV Commercial Motor Vehicle CMVSA Commercial Motor Vehicle Safety Act CVSA Commercial Vehicle Safety Alliance FMCSA Federal Motor Carrier Safety Administration FMCSR Federal Motor Carrier Safety Regulations HOS Hours-of-Service MCMIS Motor Carrier Management Information System OOS Out-of-Service PDO Property Damage Only RAC Research Advisory Committee SEA Safety Evaluation Area UGPTI Upper Great Plains Transportation Institute U.S. DOT United States Department of Transportation VMT Vehicle Miles Traveled
3 Predicting Truck Crash Involvement - 2018
TABLE OF CONTENTS
EXECUTIVE SUMMARY ................................................................................................................. 6 BACKGROUND .............................................................................................................................. 7 CRASH PREDICTOR UPDATE ...................................................................................................... 8 METHODOLOGY ............................................................................................................................ 8
Dependent Variables ........................................................................................................... 8 Independent Variables ......................................................................................................... 9 Data Collection and Analysis ............................................................................................... 9 CDLIS Conviction Data ...................................................................................................... 10 MCMIS Inspection Data ..................................................................................................... 10 MCMIS Crash Data ............................................................................................................ 12 Driver Age Data ................................................................................................................. 12 Driver Gender Data ............................................................................................................ 13
FINDINGS ..................................................................................................................................... 13 Crash Predictor Summary .................................................................................................. 14 Driver Age Summary ......................................................................................................... 16
An Improper Lane / Location Conviction ................................................................... 17 Reckless / Careless / Inattentive / Negligent Driving Convictions .............................. 17 An Improper or Erratic Lane Changes Conviction ..................................................... 18 An Improper Lane Change Violation ......................................................................... 18 An Hours-of-Service Violation ................................................................................... 19 An Improper Turn Conviction .................................................................................... 19 A Following Too Closely Conviction .......................................................................... 20 A False or No Log Book Violation ............................................................................. 20 A Speeding Violation ................................................................................................ 21 A Disqualified Driver Violation................................................................................... 21 Any Conviction ......................................................................................................... 22 A Speeding More Than 15 Miles Over Speed Limit Conviction ................................. 23 A Speeding 1 to 15 Miles Over the Speed Limit Conviction ...................................... 23 Any Moving Violation ................................................................................................ 24 A Failure to Obey Traffic Control Device Violation .................................................... 24 Any OOS Violation .................................................................................................... 25 A Driving Too Fast For Conditions Conviction .......................................................... 25 A Failure to Obey Traffic Sign Conviction ................................................................. 26 A Seat Belt Violation ................................................................................................. 26 A Failure to Obey Traffic Signal / Light Conviction .................................................... 27 A Size and Weight Violation ..................................................................................... 27
Driver Gender Summary .................................................................................................... 28

Predicting Truck Crash Involvement - 2018 4
Comparison to 2005 and 2011 Reports ............................................................................. 30 Law Enforcement Interviews ..................................................................................... 32
Enforcement Analysis ........................................................................................................ 32 Truck-Involved Crash Costs ............................................................................................... 33 Costs Associated with Specific Crash Types ..................................................................... 34
Methodology ............................................................................................................. 34 Demographics .......................................................................................................... 35 Crash Costs .............................................................................................................. 35
CONCLUSION .............................................................................................................................. 40 APPENDIX A: 2018 CHI SQUARE ANALYSIS ............................................................................ 41 APPENDIX B: DRIVER GENDER ANALYSIS .............................................................................. 48 APPENDIX C: 2005, 2011 AND 2018 COMPARISONS ............................................................... 55 APPENDIX D: ENFORCEMENT ANALYSIS ................................................................................ 56
LIST OF TABLES Figure 1: Driver Age .................................................................................................................... 12 Figure 2: Truck-Involved Crash Trends ..................................................................................... 14 Figure 3: Past Crash Involvement by Age ................................................................................. 16 Figure 4: Improper Lane / Location Convictions by Age .......................................................... 17 Figure 5: Reckless / Careless / Inattentive / Negligent Driving Convictions by Age .............. 17 Figure 6: Improper or Erratic Lane Changes Convictions by Age ........................................... 18 Figure 7: Improper Lane Change Violations by Age ................................................................. 18 Figure 8: HOS Violations by Age ................................................................................................ 19 Figure 9: Improper Turn Convictions by Age ............................................................................ 19 Figure 10: Following Too Closely Convictions by Age ............................................................. 20 Figure 11: False or No Log Book Violations by Age ................................................................. 20 Figure 12: Speeding Violations by Age ..................................................................................... 21 Figure 13: Disqualified Driver Violations by Age ...................................................................... 22 Figure 14: Drivers with Any Conviction by Age ........................................................................ 22 Figure 15: Speeding More than 15 Miles Over Speed Limit Convictions by Age .................... 23 Figure 16: Speeding 1 to 15 Miles Over the Speed Limit Convictions by Age ........................ 23 Figure 17: Drivers with Any Moving Violation by Age .............................................................. 24 Figure 18: Failure to Obey Traffic Control Device Violation by Age ........................................ 24 Figure 19: Drivers with Any OOS Violation by Age ................................................................... 25 Figure 20: Driving Too Fast for Conditions Convictions by Age ............................................. 25 Figure 21: Failure to Obey Traffic Sign Convictions by Age .................................................... 26 Figure 22: Seat Belt Violations by Age ...................................................................................... 26 Figure 23: Failure to Obey Traffic Signal / Light Convictions by Age ..................................... 27 Figure 24: Size and Weight Violations by Age .......................................................................... 27
5 Predicting Truck Crash Involvement - 2018
Figure 25: Average Crash Costs by Crash Type ....................................................................... 38 Figure 26: Average Driver Replacement Costs ......................................................................... 39 Appendix C: 2005, 2011 and 2018 Comparisons ....................................................................... 55 Appendix D: Enforcement Analysis ........................................................................................... 56
LIST OF FIGURES
Table 1: Number and Type of Inspection Violations ................................................................. 10 Table 2: Driver Crash Involvement ............................................................................................. 12 Table 3: Driver Gender ................................................................................................................ 13 Table 4: Summary of Crash Likelihood for All Data Analyzed ................................................. 15 Table 5: Summary of Crash, Conviction and Violation Likelihood by Gender ........................ 29 Table 6: Comparison of Top 10 Predictors of Future Crash Involvement ............................... 30 Table 7: Top 5 Stable Predictors of Crash Risk ........................................................................ 31 Table 8: Changes in Violation Frequencies for Roadside Inspections .................................... 31 Table 9: Top Tier Enforcement States ....................................................................................... 33 Table 10: Direct and Indirect Costs Associated with Truck-Involved Crashes ....................... 33 Table 11: Average Crash Costs by Crash Severity, .................................................................. 34 Table 12: 2015 Rollover Crash Costs ......................................................................................... 35 Table 13: 2015 Jackknife Crashes .............................................................................................. 36 Table 14: 2015 Run-Off-Road Crash Costs ................................................................................ 36 Table 15: 2015 Sideswipe Crash Costs ...................................................................................... 37 Table 16: 2015 Head-On Crash Costs ........................................................................................ 37 Table 17: 2015 Rear End Crash Costs ....................................................................................... 38 Table 18: Legal Costs.................................................................................................................. 39
Predicting Truck Crash Involvement - 2018 6
EXECUTIVE SUMMARY Recognizing that safety is a top priority for the trucking industry and identifying and targeting underlying crash-related factors is challenging at best, the American Transportation Research Institute (ATRI) is updating its renowned Crash Predictor report. The Crash Predictor report1 was first prioritized by ATRI’s Research Advisory Committee (RAC) in 2004 as a much needed analytical tool for predicting future crash involvement based on historical data.2 The first iteration of the report was completed in 2005 through partnerships with the North Dakota State University Upper Great Plains Transportation Institute (UGPTI) and the Commercial Vehicle Safety Alliance (CVSA). This first report investigated statistical methods that could accurately predict future crash involvement. More specifically, the ATRI research team analyzed the impact that driver violations, convictions and crashes have on future probabilities of crash involvement. For example, “reckless driving” violations were found to increase the probability of future crash involvement by 325 percent, and simply having a past crash on a driver’s record generated an 87 percent increased probability of a future crash. Additionally, the 2005 report reviewed effective enforcement and industry countermeasures to address the problem behaviors associated with future crash involvement. In 2011, ATRI updated the 2005 report to reassess the relationship between violations, convictions and crashes on the likelihood of future crash involvement. The 2011 update was necessitated by changes in the regulatory environment, industry practices, safety technology adoption, and changing enforcement strategies. The 2011 report documented that future crash probabilities were impacted by a variety of statistically significant driving behaviors; “failure to use/improper signal” convictions had the largest impact on the probability of future crash involvement, increasing crash likelihood by 96 percent. Based on the various changes in the industry’s safety landscape, the 2011 update showed a general decrease in the strength of the safety/crash relationship, although numerous driver behaviors were still associated with statistically significant probability of a future crash – but to a lesser degree than the 2005 analysis. This 2018 update, which again is motivated by major changes in the industry’s safety and operational landscape, continues to apply the same methodology to the relationship between violations, citations, crashes and future crash involvement. This report finds that driver behaviors again had a statistically significant impact on future crash probability. As in 2005, “reckless driving” violations again had the largest impact on future crash involvement, increasing the probability of a future crash by 114 percent. This update expands the research in several areas, adding age and gender analyses. The age and gender analyses investigate the relationship that driver age and gender have with the probability of crash involvement, violations and convictions.
1 Daniel Murray, Brenda Lantz, and Stephen Keppler, “Predicting Truck Crash Involvement: Developing a Commercial Driver Behavior-Based Model and Recommended Countermeasures” Alexandria, VA. American Transportation Research Institute, October 2005. 2 ATRI’s RAC is comprised of industry stakeholders representing motor carriers, trucking industry suppliers, labor and driver groups, law enforcement, federal government and academia. The RAC is charged with annually recommending a research agenda for the Institute.
7 Predicting Truck Crash Involvement - 2018
BACKGROUND Prior to the first Crash Predictor report in 2005,3 analyses tended to focus on the relationship between carrier characteristics and crash risk. Early research in 1997 found the relationship between driver violations differs significantly across carriers, and that carriers with higher driver citation rates have higher crash rates.4 Similarly, driver conviction data is significantly correlated to carrier out-of-service (OOS) rates, crashes and Safety Evaluation Area (SEA) scores.5 “Serious driving violations” were also predictive of carrier-level crash rates.6 Unfortunately, carrier-level analyses provide limited means for effectively identifying behaviors that cause crashes. The issue of high-risk drivers is illustrated by a Virginia Tech Transportation Institute analysis, which found that 10 to 15 percent of drivers account for a disproportionate percentage of total fleet crash risk: 30 to 50 percent.7 The issue of high-risk drivers is exacerbated by the high turnover rates in the trucking industry, which typically exceed 75 percent for large truckload fleets. In 2015, large truckload fleet driver turnover rates were 102 percent.8 While “marginal” carriers may pressure drivers into unsafe behaviors, driver behavior is ultimately what can mitigate or exacerbate crash risk. Utilizing driver-related historical data also allows safety stakeholders to assess drivers regardless of their tenure at any one fleet. Analyses of crash causation have largely focused on fatal car-truck crashes, as the data gathered for fatal crashes is often more robust than injury or PDO crashes. Analyses of crash data similarly support the role of driver behavior in truck-involved crashes. The Large Truck Crash Causation Study found that driver factors (car or truck) play a critical role in 88 percent of fatal and injury crashes.9 The significant role that driver behavior plays in crash causation makes focusing on problematic driver behaviors essential to reducing the incidence of truck-involved crashes. As noted, ATRI first analyzed the relationship between driver behavior and future crash risk in 2005. The research corroborated the relationship between specific driver behaviors and future crash probability. In 2011, ATRI updated the Crash Predictor model to account for significant changes to safety practices and enforcement over the years.10 Again, driver behaviors that significantly increase the likelihood of future crash involvement were identified.
3 Daniel Murray, Brenda Lantz, and Stephen Keppler, “Predicting Truck Crash Involvement: Developing a Commercial Driver Behavior-Based Model and Recommended Countermeasures.” Alexandria, VA. American Transportation Research Institute, October 2005. 4 AAMVAnet, Inc. and Keane Federal Systems. Driver/Carrier Data Relationship Project: Phase II Report. Federal Carrier Safety Administration. 1997. 5 Brenda Lantz and Michael Blevins. September 2001. An Analysis of Commercial Vehicle Driver Traffic Conviction Data to Identify High Safety Risk Motor Carriers. 6 Hughes, R. G. The Effectiveness of Commercial Motor Vehicle Enforcement in Reducing Truck- Involved Crashes. 7 Federal Motor Carrier Safety Administration. September 2004. Individual Differences and the “High Risk” Commercial Driver. 8 Sean McNally, “Turnover at Large Truckload Fleets Rose to 102% in Fourth Quarter,” American Trucking Associations, April 25, 2016. 9 Marc Starnes, “Large Truck Crash Causation Study,” Federal Motor Carrier Safety Administration, August 2006. 10 Micah D. Lueck and Daniel Murray, “Predicting Truck Crash Involvement: A 2011 Update.” Arlington, VA. American Transportation Research Institute, April 2011.
Predicting Truck Crash Involvement - 2018 8
CRASH PREDICTOR UPDATE This Crash Predictor update seeks to replicate the methodology of prior reports with more recent data obtained from the Motor Carrier Management Information System (MCMIS) and the Commercial Drivers License Information System (CDLIS). Additionally, this Crash Predictor update analyzes the impact of driver age and gender on the probability of crash involvement, violations and convictions.
MCMIS is a Federal Motor Carrier Safety Administration (FMCSA)-maintained database of carrier-based information regarding crashes and roadside inspections of commercial motor vehicles (CMVs) and drivers. Most crash and roadside inspection reports in MCMIS identify both the driver and the truck driver’s employer at the time of the crash or roadside inspection. There are approximately 3.5 million roadside inspections and 150,000 crashes reported each year. MCMIS also contains census information regarding each motor carrier (i.e., address, number of power units, number of drivers, cargo carried, etc.). CDLIS was created in response to the Commercial Motor Vehicle Safety Act (CMVSA) of 1986. It is the public sector’s only nationwide source of commercial drivers license (CDL) holders’ traffic conviction data. CDLIS is a distributed, relational database that provides a linkage between the various state driver records systems using a central index. The central index serves as a clearinghouse that each of the 51 jurisdictions (the 50 states and the District of Columbia) can check before issuing a CDL to ensure that no other state has issued a CDL to that driver anywhere in the nation, and that the records for that driver’s CDL will be transferred to the new state where the driver is applying. It also assists states in reporting out-of-state convictions to the licensing state where they become part of the driver's record.
METHODOLOGY Prior research clearly indicates that driver behaviors have a significant role in crash causation,11 and that effective mitigation begins with addressing specific high-risk driver behaviors. This research seeks to identify high-risk behaviors (violations, convictions and crashes) that have the greatest impact on truck safety outcomes. ATRI sought to determine the impact that a driver’s record in 2013 had on safety outcomes in 2014. Additionally, this update includes supplemental analyses looking at the impact of age and gender on crash involvement, violations and convictions. The variables used for this study are defined below. Dependent Variables The main dependent variable of interest was a measure of "safety" for drivers, which in this study was defined as crash involvement. Other variables such as roadside inspection OOS rates have been used as a measure of "safety" in previous research; however, roadside inspection results were used as independent variables for this study. Driver-specific crash data are readily available through MCMIS. For the driver age and gender analyses, dependent variables included convictions, violations and crashes.
11 Marc Starnes, “Large Truck Crash Causation Study.” Federal Motor Carrier Safety Administration, August 2006.
9 Predicting Truck Crash Involvement - 2018
Independent Variables The independent variables for this study were driver-specific performance indicators that could be mined from available data. This included specific violations discovered during roadside inspections (driver, vehicle or moving violations available through MCMIS), driver traffic conviction information (available through CDLIS), as well as any past crash involvement information (available through MCMIS). In order to assist the reader in interpreting the difference between parallel violation and conviction behaviors (e.g. a reckless driving violation vs. a reckless driving conviction), a brief clarification of what constitutes a violation or conviction is provided. Violations are issued to drivers during roadside inspections when inspectors discover that a driver and/or vehicle is not in compliance with one or more of the Federal Motor Carrier Safety Regulations (FMCSRs). In turn, these violations get stored in the MCMIS database and are used by FMCSA to regularly monitor driver and carrier safety performance. Drivers receive convictions when an issued citation is adjudicated in court, and the truck driver is found guilty of the specific charge. These convictions are then stored in the CDLIS database. There is no one-to-one relationship between violations and citations/convictions, as violations can be issued in the absence of citations and vice versa. Therefore, it should not be assumed that all drivers with a specific conviction will also show up in the driver pool for the corresponding violation, despite the fact that this may often be the case. Driver age and gender were obtained from CDLIS to assess the impact age and gender have on the likelihood of crash involvement, violations and convictions. Data Collection and Analysis Driver data was gathered and analyzed for a two-year time frame, which included 2013 and 2014 data. Violations, convictions and crashes from 2013 were used to predict crashes in 2014. Nationwide, there are approximately 200,000 unique drivers per month involved in a roadside inspection. Over a one-year period, there are approximately 2.0 to 2.5 million unique drivers identified in MCMIS through roadside inspections. As was done in the 2005 and 2011 reports, this analysis created an initial driver database comprised of drivers who had received a roadside inspection or been involved in a crash in three recent months (January, February and March 2015). A total of 439,260 unique, U.S.-based drivers were identified,12 on which the subsequent analysis is based. For each of the drivers in the sample selected, their past inspection and past crash data were obtained from MCMIS, and past conviction data from CDLIS. Descriptive statistics were run for this entire dataset to determine subsets of the population for analyses. Chi-square analyses were used to assess whether there is a significant difference in future crash rates for drivers based on their past inspection, conviction, and/or crash history. It should be noted that each chi-square analysis was run independently of all other chi-square analyses, and readers should be cognizant when interpreting the findings, noting that the statistical significance of a specific chi-square analysis does not take into account any other chi-square analysis. To summarize, the predictive value of any given violation should be interpreted on its own, and not additive in relation to the predictive value of another violation, conviction, or crash. The role of
12 CDLIS only includes U.S. driver conviction data.
Predicting Truck Crash Involvement - 2018 10
external factors that influence crashes, such as weather, road conditions, lighting, and passenger vehicle behaviors, are not considered in this study. All data that were used and the resulting chi-square analysis results can be found in Appendix A.13 The chi square analysis for gender can be found in Appendix B. CDLIS Conviction Data During January 1, 2013 to December 31, 2013, 41,205 drivers had one or more convictions on record. 398,055 drivers had no convictions during this period. MCMIS Inspection Data The 439,260 drivers had a total of 1,299,218 Level I, II, III, and VI roadside inspections between January 1, 2013 and December 31, 2014. Of these inspections:
• 389,271 (29.96%) were Level I; • 440,495 (33.90%) were Level II; • 469,337 (36.12%) were Level III (driver only); • 115 (0.01%) were Level VI; • 528,501 (63.68% of Level I, II, and VI) resulted in one or more vehicle violations; • 170,040 (20.49% of Level I, II, and VI) resulted in a vehicle placed OOS; • 324,352 (24.96%) resulted in one or more driver violations; • 61,960 (4.77%) resulted in a driver placed OOS.
There were 1,966,976 specific violations associated with these inspections (Table 1). The violations indicated in bold are driver behavior violations, which are the focus of the Crash Predictor analysis.
Table 1: Number and Type of Inspection Violations
Violation Description Frequency Percent
Lighting 352,928 17.94% All Other Vehicle Defects 270,951 13.78% Brakes - All Others 253,504 12.89% Tires 136,599 6.94% All Other Hours-Of-Service 129,364 6.58% All Other Driver Violations 113,381 5.76% Brakes - Out Of Adjustment 107,799 5.48% Size And Weight 77,104 3.92% No Log Book - Log Not Current 61,214 3.11% Emergency Equipment 52,613 2.67% Windshield 49,555 2.52% Speeding 47,832 2.43% 10/15 Hours 44,467 2.26%
13 Data used for the 2005 and 2011 Crash Predictor analyses can be found in Predicting Truck Crash Involvement: A 2011 Update, available online at www.TruckingResearch.org

11 Predicting Truck Crash Involvement - 2018
Violation Description Frequency Percent
Periodic Inspection 39,766 2.02% Load Securement 35,613 1.81% False Log Book 23,090 1.17% Wheels - Studs – Clamps 20,406 1.04% Steering Mechanism 17,877 0.91% Medical Certificate 17,511 0.89% Exhaust Discharge 14,540 0.74% Seat Belt 14,083 0.72% Failure To Obey Traffic Control Device 13,502 0.69% Frames 11,339 0.58% Suspension 9,483 0.48% State/Local Hours-of-Service 7,291 0.37% Disqualified Drivers 6,026 0.31% Unknown 5,019 0.26% Improper Lane Change 3,805 0.19% Following Too Close 3,564 0.18% 60/70/80 Hours 3,374 0.17% Shipping Paper 3,303 0.17% Coupling Devices 3,242 0.16% Fuel Systems 3,214 0.16% Improper Placarding 3,070 0.16% All Other HM Violations 3,033 0.15% Traffic Enforcement 1,107 0.06% Radar Detectors 904 0.05% Emergency Response 1,024 0.05% Alcohol 684 0.03% Improper Blocking And Bracing 535 0.03% Improper Passing 677 0.03% Improper Turns 545 0.03% Failure To Yield Right Of Way 612 0.03% Drugs 388 0.02% No Retest And Inspection (Cargo Tank) 337 0.02% Accepting Shipment Improperly Marked 214 0.01% Use Of Non-Specification Container 166 0.01% Reckless Driving 258 0.01% 15/20 Hours 1 0.00% No Remote Shutoff Control 62 0.00% Total 1,966,976 100.00%

Predicting Truck Crash Involvement - 2018 12
MCMIS Crash Data Between January 1, 2013 and December 31, 2014, the drivers in this analysis were involved in 31,098 crashes that were reported to FMCSA. Of these crashes:
• 729 (2.3%) of the crashes resulted in one or more fatalities; • 10,980 (35.3%) of the crashes resulted in one or more injuries; and • 29,779 (95.8%) of the crashes resulted in one or more vehicles towed from the scene.
Table 2 shows the number of crashes each driver in the analysis was involved in between January 1, 2013 and December 31, 2014. Over 90 percent of drivers in the analysis were not involved in any crashes. Fewer than seven percent of drivers were involved in one crash and 0.32 percent of drivers were involved in two crashes. Drivers involved in more than two crashes represent less than one-tenth of a percent (0.01%) of drivers in this analysis.
Table 2: Driver Crash Involvement
Number of Crashes
Number of Drivers Percent
0 409,088 93.13% 1 28,690 6.53% 2 1,426 0.32% 3 54 0.01% 4 2 0.00%
Driver Age Data Driver age was obtained by subtracting the driver birth year (obtained from CDLIS) from 2014. Next, driver age was grouped into 5-year categories. Figure 1 shows the distribution of driver age for this analysis. Drivers in the analysis were 45.7 years of age on average. A majority of drivers in the 20 to 24 year age group were 21 years of age or older (96.4%).
Figure 1: Driver Age
13 Predicting Truck Crash Involvement - 2018
Driver Gender Data Table 3 displays the distribution of driver gender in the sample, obtained from CDLIS. Women comprised only 2.45 percent of the sample, which is significantly less than the industry-at-large, where 6 to 8 percent of drivers are women.14
Table 3: Driver Gender
Gender Count Percent Men 428,484 97.55% Women 10,741 2.45%
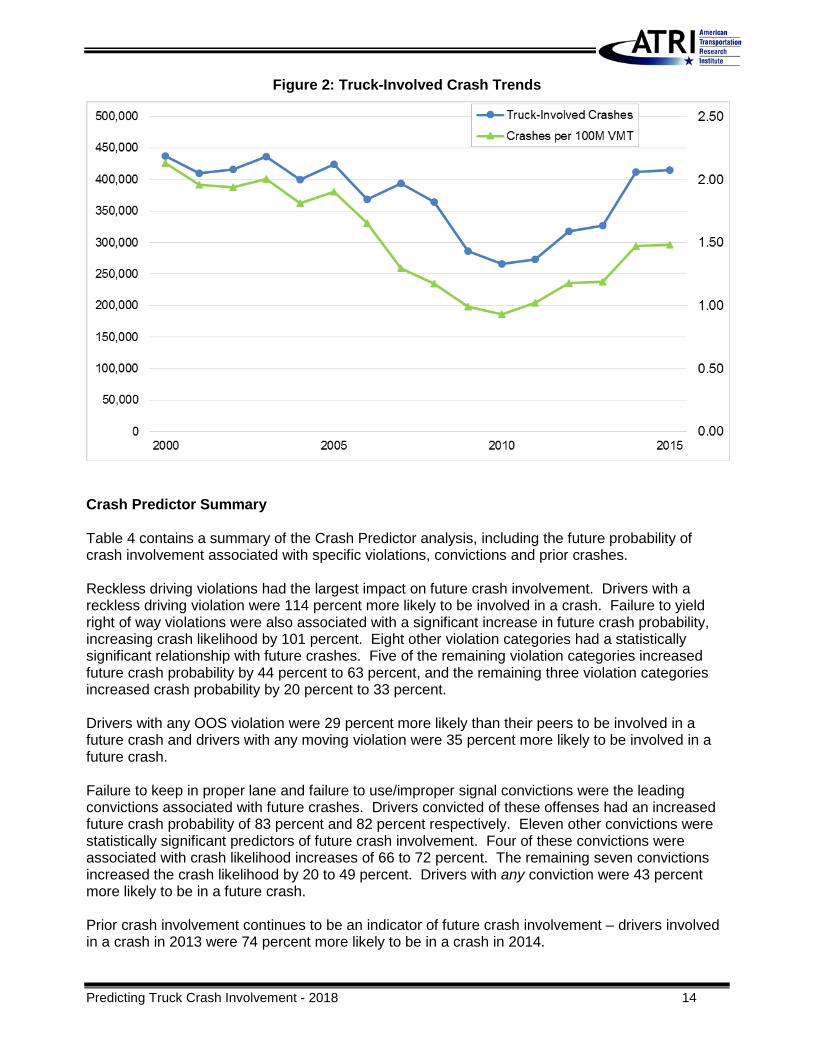
FINDINGS For decades, the trucking industry has worked diligently with government agencies to reduce the number of truck-involved crashes. These efforts have resulted in significant improvements to roadway safety: U.S. Department of Transportation (U.S. DOT) statistics indicate that crash rates for large trucks have decreased from 2.13 crashes per 100M vehicle miles traveled (VMT) in 2000 to 1.48 crashes per 100M VMT in 2015 – a 30 percent decrease (Figure 2).15 However, the lowest number of truck-involved crashes and truck-involved crashes per 100M VMT rates occurred in 2010, and have been trending upwards in recent years toward pre-recession levels. The recent increases in truck-involved crash rates likely have a complex set of causal factors, but certainly compel the industry to seek and institutionalize new and meaningful safety initiatives. While the Crash Predictor model cannot identify crash causal factors, crash externalities and underlying attributes, it does provide a critical framework for identifying and targeting truck driver behaviors that most closely relate to crashes. Given the large role that car drivers play in a plurality of car-truck crashes, the statistical relationships found in the Crash Predictor report also allow industry stakeholders to target those behaviors where a truck driver likely has a larger percentage of responsibility. With statistically significant behaviors identified, it is then possible to target both driver training and enforcement strategies as crash mitigation tools.
14 American Trucking Trends (2017). American Trucking Associations. Arlington, VA. 15 “Large Truck and Bus Crash Facts 2015.” Federal Motor Carrier Safety Administration, November 2016.
Predicting Truck Crash Involvement - 2018 14
Figure 2: Truck-Involved Crash Trends
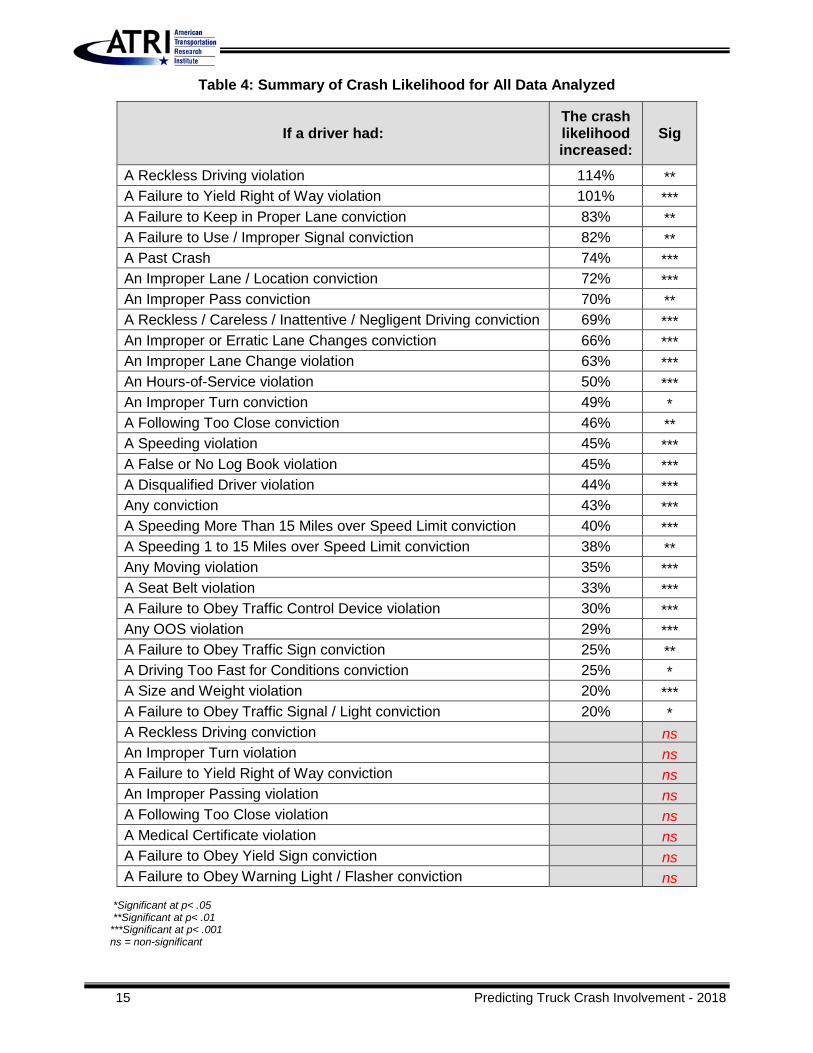
Crash Predictor Summary Table 4 contains a summary of the Crash Predictor analysis, including the future probability of crash involvement associated with specific violations, convictions and prior crashes. Reckless driving violations had the largest impact on future crash involvement. Drivers with a reckless driving violation were 114 percent more likely to be involved in a crash. Failure to yield right of way violations were also associated with a significant increase in future crash probability, increasing crash likelihood by 101 percent. Eight other violation categories had a statistically significant relationship with future crashes. Five of the remaining violation categories increased future crash probability by 44 percent to 63 percent, and the remaining three violation categories increased crash probability by 20 percent to 33 percent. Drivers with any OOS violation were 29 percent more likely than their peers to be involved in a future crash and drivers with any moving violation were 35 percent more likely to be involved in a future crash. Failure to keep in proper lane and failure to use/improper signal convictions were the leading convictions associated with future crashes. Drivers convicted of these offenses had an increased future crash probability of 83 percent and 82 percent respectively. Eleven other convictions were statistically significant predictors of future crash involvement. Four of these convictions were associated with crash likelihood increases of 66 to 72 percent. The remaining seven convictions increased the crash likelihood by 20 to 49 percent. Drivers with any conviction were 43 percent more likely to be in a future crash. Prior crash involvement continues to be an indicator of future crash involvement – drivers involved in a crash in 2013 were 74 percent more likely to be in a crash in 2014.
15 Predicting Truck Crash Involvement - 2018
Table 4: Summary of Crash Likelihood for All Data Analyzed
If a driver had: The crash likelihood increased:
Sig
A Reckless Driving violation 114% ** A Failure to Yield Right of Way violation 101% *** A Failure to Keep in Proper Lane conviction 83% ** A Failure to Use / Improper Signal conviction 82% ** A Past Crash 74% *** An Improper Lane / Location conviction 72% *** An Improper Pass conviction 70% ** A Reckless / Careless / Inattentive / Negligent Driving conviction 69% *** An Improper or Erratic Lane Changes conviction 66% *** An Improper Lane Change violation 63% *** An Hours-of-Service violation 50% *** An Improper Turn conviction 49% * A Following Too Close conviction 46% ** A Speeding violation 45% *** A False or No Log Book violation 45% *** A Disqualified Driver violation 44% *** Any conviction 43% *** A Speeding More Than 15 Miles over Speed Limit conviction 40% *** A Speeding 1 to 15 Miles over Speed Limit conviction 38% ** Any Moving violation 35% *** A Seat Belt violation 33% *** A Failure to Obey Traffic Control Device violation 30% *** Any OOS violation 29% *** A Failure to Obey Traffic Sign conviction 25% ** A Driving Too Fast for Conditions conviction 25% * A Size and Weight violation 20% *** A Failure to Obey Traffic Signal / Light conviction 20% * A Reckless Driving conviction ns An Improper Turn violation ns A Failure to Yield Right of Way conviction ns An Improper Passing violation ns A Following Too Close violation ns A Medical Certificate violation ns A Failure to Obey Yield Sign conviction ns A Failure to Obey Warning Light / Flasher conviction ns
*Significant at p< .05 **Significant at p< .01 ***Significant at p< .001 ns = non-significant
Predicting Truck Crash Involvement - 2018 16
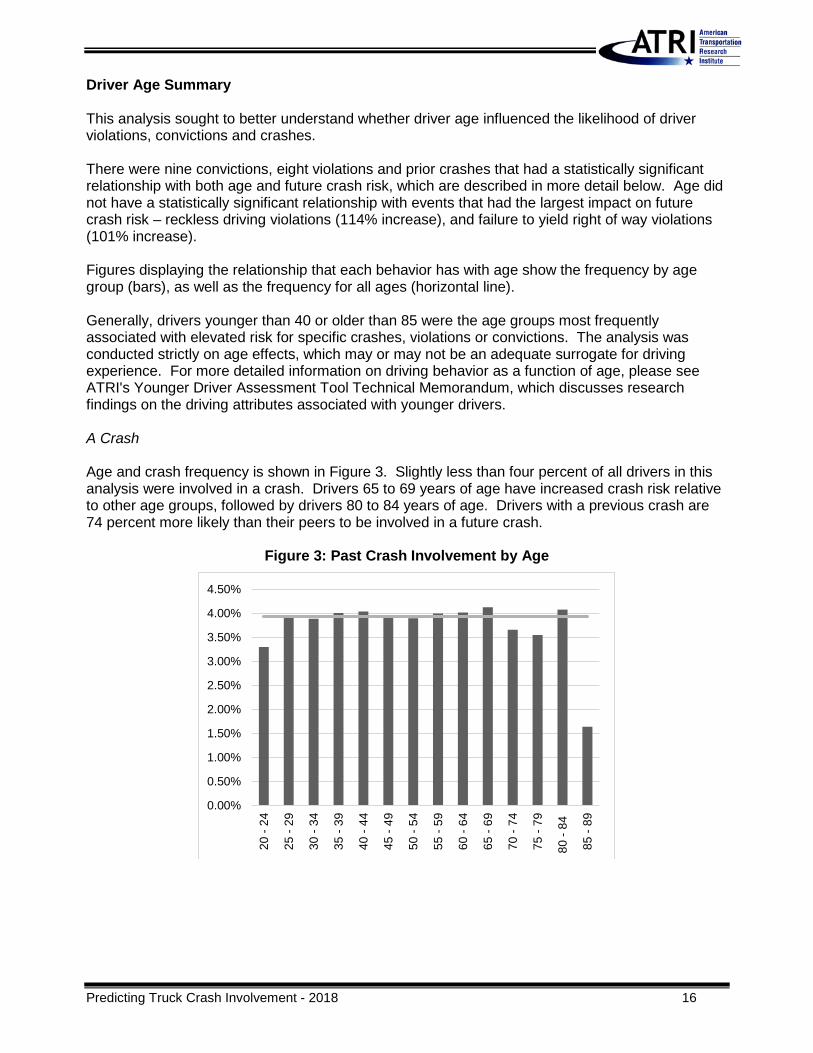
Driver Age Summary This analysis sought to better understand whether driver age influenced the likelihood of driver violations, convictions and crashes. There were nine convictions, eight violations and prior crashes that had a statistically significant relationship with both age and future crash risk, which are described in more detail below. Age did not have a statistically significant relationship with events that had the largest impact on future crash risk – reckless driving violations (114% increase), and failure to yield right of way violations (101% increase). Figures displaying the relationship that each behavior has with age show the frequency by age group (bars), as well as the frequency for all ages (horizontal line). Generally, drivers younger than 40 or older than 85 were the age groups most frequently associated with elevated risk for specific crashes, violations or convictions. The analysis was conducted strictly on age effects, which may or may not be an adequate surrogate for driving experience. For more detailed information on driving behavior as a function of age, please see ATRI's Younger Driver Assessment Tool Technical Memorandum, which discusses research findings on the driving attributes associated with younger drivers. A Crash Age and crash frequency is shown in Figure 3. Slightly less than four percent of all drivers in this analysis were involved in a crash. Drivers 65 to 69 years of age have increased crash risk relative to other age groups, followed by drivers 80 to 84 years of age. Drivers with a previous crash are 74 percent more likely than their peers to be involved in a future crash.
Figure 3: Past Crash Involvement by Age
0.00%
0.50%
1.00%
1.50%
2.00%
2.50%
3.00%
3.50%
4.00%
4.50%
20 -
24
25 -
29
30 -
34
35 -
39
40 -
44
45 -
49
50 -
54
55 -
59
60 -
64
65 -
69
70 -
74
75 -
79
80 -
84
85 -
89
17 Predicting Truck Crash Involvement - 2018
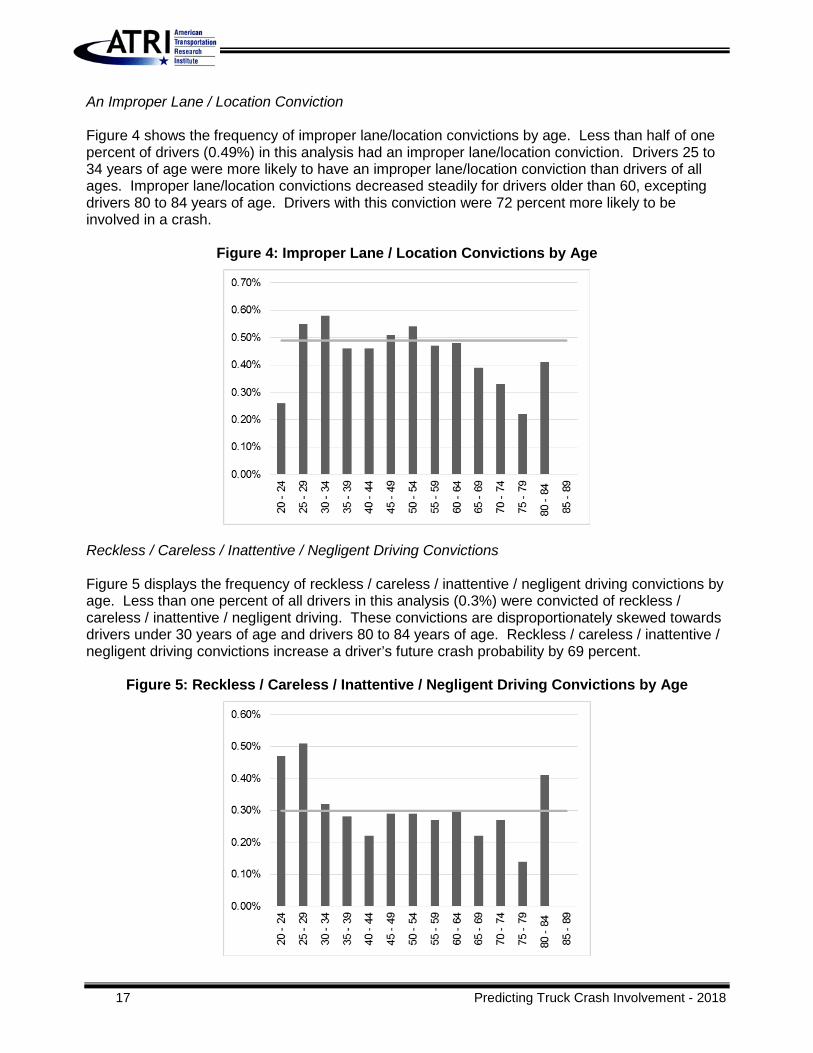
An Improper Lane / Location Conviction Figure 4 shows the frequency of improper lane/location convictions by age. Less than half of one percent of drivers (0.49%) in this analysis had an improper lane/location conviction. Drivers 25 to 34 years of age were more likely to have an improper lane/location conviction than drivers of all ages. Improper lane/location convictions decreased steadily for drivers older than 60, excepting drivers 80 to 84 years of age. Drivers with this conviction were 72 percent more likely to be involved in a crash.
Figure 4: Improper Lane / Location Convictions by Age
Reckless / Careless / Inattentive / Negligent Driving Convictions Figure 5 displays the frequency of reckless / careless / inattentive / negligent driving convictions by age. Less than one percent of all drivers in this analysis (0.3%) were convicted of reckless / careless / inattentive / negligent driving. These convictions are disproportionately skewed towards drivers under 30 years of age and drivers 80 to 84 years of age. Reckless / careless / inattentive / negligent driving convictions increase a driver’s future crash probability by 69 percent.
Figure 5: Reckless / Careless / Inattentive / Negligent Driving Convictions by Age

Predicting Truck Crash Involvement - 2018 18
An Improper or Erratic Lane Changes Conviction Improper or erratic lane change convictions by age is shown in Figure 6. Less than one percent (0.38%) of all drivers in this analysis had an improper or erratic lane changes conviction. Conviction frequency for drivers 75 to 79 years of age was nearly double the average frequency. Drivers 25 to 29 years of age and 70 to 74 years of age also had higher than average conviction rates, but to a lesser extent than drivers 75 to 79 years of age. Improper or erratic lane change convictions increase a driver’s future crash probability by 66 percent.
Figure 6: Improper or Erratic Lane Changes Convictions by Age
An Improper Lane Change Violation Figure 7 shows the frequency of improper lane change violations by age. Less than one percent (0.73%) of all drivers had an improper lane change violation. Drivers aged 75 to 79 were more than twice as likely to have an improper lane change violation (1.65%) than the violation rate for all drivers (0.73%). Violation risk was slightly elevated for drivers 25 to 34 years old. This violation increases future crash risk by 63 percent.
Figure 7: Improper Lane Change Violations by Age

19 Predicting Truck Crash Involvement - 2018
An Hours-of-Service Violation Hours-of-Service (HOS) violations by age are shown in Figure 8. Over 15 percent (15.94%) of all drivers in the analysis had an HOS violation. HOS violations peaked for drivers 25 to 29 years of age, and steadily decreased as age increased. Drivers with an HOS violation were 50 percent more likely than their peers to be involved in a future crash.
Figure 8: HOS Violations by Age
An Improper Turn Conviction Convictions for improper turns by age are shown in Figure 9. Less than one percent of all drivers (0.12%) in the analysis had an improper turn conviction. Drivers 25 to 34 years of age were the most likely to have improper turn convictions, and conviction likelihood decreases as age increases. Drivers with an improper turn conviction are 49 percent more likely than their peers to be involved in a future crash.
Figure 9: Improper Turn Convictions by Age
Predicting Truck Crash Involvement - 2018 20
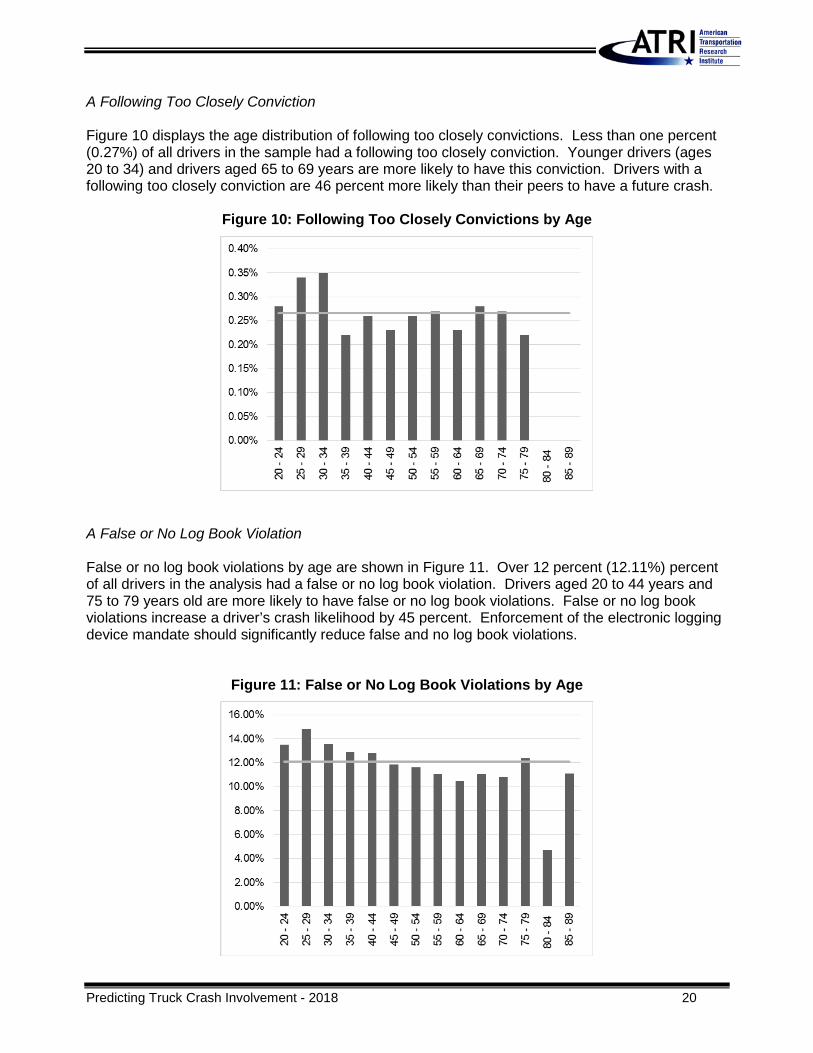
A Following Too Closely Conviction Figure 10 displays the age distribution of following too closely convictions. Less than one percent (0.27%) of all drivers in the sample had a following too closely conviction. Younger drivers (ages 20 to 34) and drivers aged 65 to 69 years are more likely to have this conviction. Drivers with a following too closely conviction are 46 percent more likely than their peers to have a future crash.
Figure 10: Following Too Closely Convictions by Age
A False or No Log Book Violation False or no log book violations by age are shown in Figure 11. Over 12 percent (12.11%) percent of all drivers in the analysis had a false or no log book violation. Drivers aged 20 to 44 years and 75 to 79 years old are more likely to have false or no log book violations. False or no log book violations increase a driver’s crash likelihood by 45 percent. Enforcement of the electronic logging device mandate should significantly reduce false and no log book violations.
Figure 11: False or No Log Book Violations by Age

21 Predicting Truck Crash Involvement - 2018
A Speeding Violation Figure 12 shows the frequency of speeding violations by age. Slightly less than nine percent (8.72%) of all drivers in this analysis had a speeding violation. Drivers more than 80 years old had the highest risk of being issued a speeding violation. Speeding violations increase the probability a driver is involved in a future crash by 45 percent.
Figure 12: Speeding Violations by Age
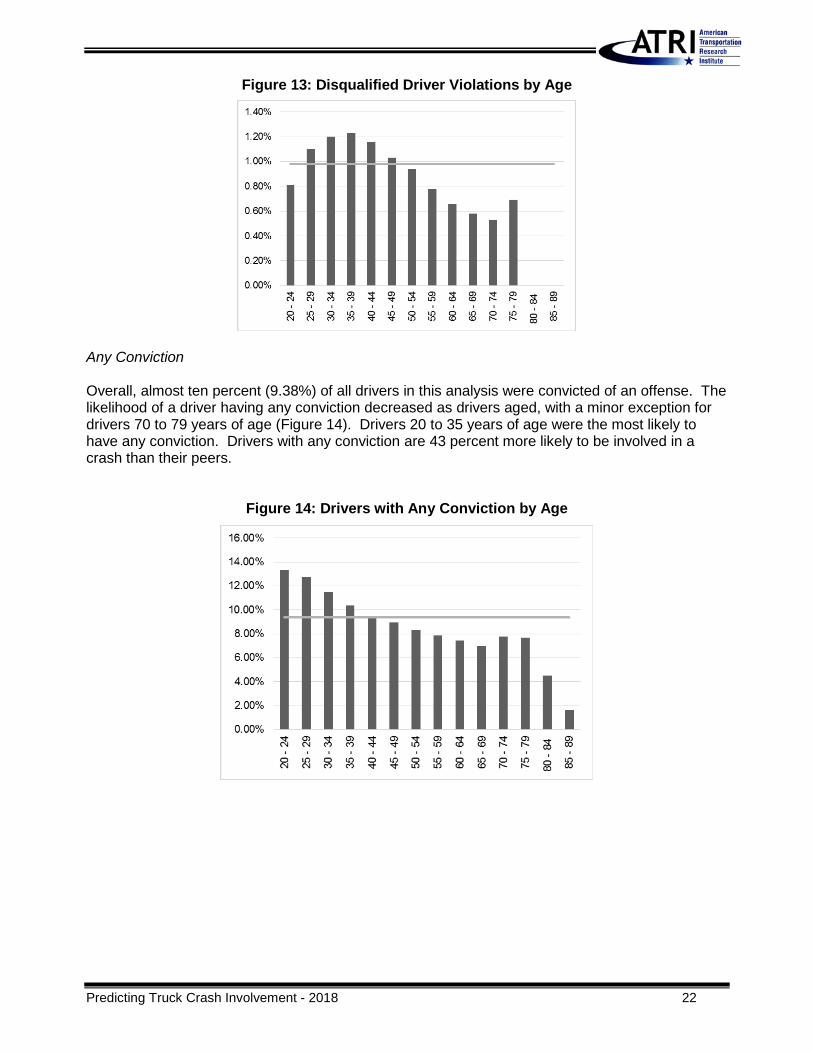
A Disqualified Driver Violation16 Figure 13 displays disqualified driver violations by age. Almost one percent (0.98%) of drivers in this analysis had a disqualified driver violation. Disqualified driver violations are most frequent for drivers 35 to 39 years of age, and decrease in likelihood as age increases. Drivers with a disqualified driver violation are 44 percent more likely to be involved in a future crash relative to their peers.
16 Drivers may be disqualified from operating a CMV for a number of reasons including serious traffic offenses or operating a motor vehicle while under the influence of drugs/alcohol. More information on disqualifying behaviors can be found in USC§383.51.
Predicting Truck Crash Involvement - 2018 22
Figure 13: Disqualified Driver Violations by Age
Any Conviction Overall, almost ten percent (9.38%) of all drivers in this analysis were convicted of an offense. The likelihood of a driver having any conviction decreased as drivers aged, with a minor exception for drivers 70 to 79 years of age (Figure 14). Drivers 20 to 35 years of age were the most likely to have any conviction. Drivers with any conviction are 43 percent more likely to be involved in a crash than their peers.
Figure 14: Drivers with Any Conviction by Age

23 Predicting Truck Crash Involvement - 2018
A Speeding More Than 15 Miles Over Speed Limit Conviction Figure 15 shows the frequency drivers are convicted of speeding more than 15 miles over the speed limit by driver age. Nearly six percent (5.98%) of all drivers in the analysis were convicted of speeding more than 15 miles over the speed limit. Drivers younger than 40 years of age are far more likely to be convicted of speeding more than 15 miles over the speed limit than drivers over 40 years of age. This conviction is associated with a 40 percent increase in crash likelihood compared to drivers without a speeding more than 15 miles over the speed limit conviction.
Figure 15: Speeding More than 15 Miles Over Speed Limit Convictions by Age
A Speeding 1 to 15 Miles Over the Speed Limit Conviction Less than one percent (0.34%) of all drivers in the analysis were convicted of exceeding the speed limit by 1 to 15 miles. Convictions of speeding 1 to 15 miles over the speed limit are much more likely for drivers under 35 years of age (Figure 16). Drivers convicted of driving 1 to 15 miles over the speed limit are 38 percent more likely to be involved in a crash than their peers.
Figure 16: Speeding 1 to 15 Miles Over the Speed Limit Convictions by Age

Predicting Truck Crash Involvement - 2018 24
Any Moving Violation Figure 17 displays the frequency that drivers have any moving violation, by age. Nearly 22 percent (21.98%) of all drivers in the analysis had a moving violation. Drivers 25 to 29 and 80 to 84 years of age are most likely to have a moving violation. Relative to their peers, drivers with any moving violation are 35 percent more likely to be involved in a future crash.
Figure 17: Drivers with Any Moving Violation by Age
A Failure to Obey Traffic Control Device Violation Figure 18 shows the relationship between age and failure to obey traffic control device violations. Less than three present (2.66%) of all drivers in the analysis had a failure to obey traffic control device violation. Drivers under 40 years had an elevated risk for failure to obey traffic control device violations than older drivers. Drivers 25 to 29 years of age had the highest frequency of this violation. Failure to obey traffic control device violations increase future crash probability by 30 percent.
Figure 18: Failure to Obey Traffic Control Device Violation by Age

25 Predicting Truck Crash Involvement - 2018
Any OOS Violation The frequency with which drivers had any OOS violation by age is shown in Figure 19. Nearly 32 percent (31.75%) of all drivers in this analysis had an OOS violation. Drivers younger than 45 years of age had slightly elevated risk for receiving any OOS violation relative to older drivers. The exception of lower than average OOS rates is for older drivers 85 to 89 years of age, which had the highest OOS rate of any age group. Drivers with any OOS violation were 29 percent more likely to be involved in a future crash relative to their peers.
Figure 19: Drivers with Any OOS Violation by Age
A Driving Too Fast For Conditions Conviction Figure 20 displays driving too fast for conditions convictions by age. Less than one percent (0.37%) of all drivers in this analysis had a driving too fast for conditions conviction. Drivers younger than 30 were significantly more likely than drivers over 30 years of age to have a driving too fast for conditions conviction. This conviction increases a driver’s future crash probability by 25 percent.
Figure 20: Driving Too Fast for Conditions Convictions by Age

Predicting Truck Crash Involvement - 2018 26
A Failure to Obey Traffic Sign Conviction Less than one percent (0.62%) of all drivers in the analysis had a failure to obey traffic sign conviction. Drivers 25 to 39 years of age are the most likely to be convicted of a failure to obey traffic sign offense (Figure 21). Failure to obey traffic sign convictions are associated with a 25 percent increase in crash probability.
Figure 21: Failure to Obey Traffic Sign Convictions by Age
A Seat Belt Violation The relationship between age and seat belt violations is shown in Figure 22. Less than three percent (2.78%) of all drivers had a seat belt violation. Drivers under the age of 44 and older than 65 had elevated risk of a seat belt violation. Seat belt violations are associated with a 33 percent increase in future crash risk.
Figure 22: Seat Belt Violations by Age
27 Predicting Truck Crash Involvement - 2018
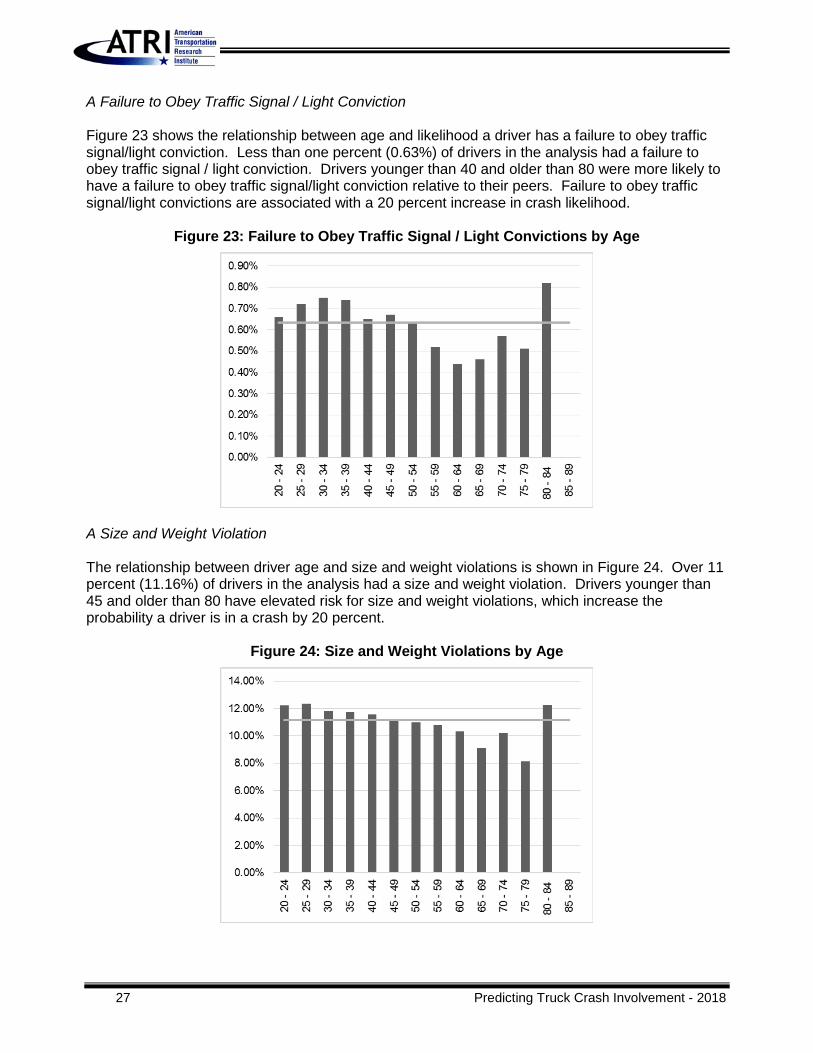
A Failure to Obey Traffic Signal / Light Conviction Figure 23 shows the relationship between age and likelihood a driver has a failure to obey traffic signal/light conviction. Less than one percent (0.63%) of drivers in the analysis had a failure to obey traffic signal / light conviction. Drivers younger than 40 and older than 80 were more likely to have a failure to obey traffic signal/light conviction relative to their peers. Failure to obey traffic signal/light convictions are associated with a 20 percent increase in crash likelihood.
Figure 23: Failure to Obey Traffic Signal / Light Convictions by Age
A Size and Weight Violation The relationship between driver age and size and weight violations is shown in Figure 24. Over 11 percent (11.16%) of drivers in the analysis had a size and weight violation. Drivers younger than 45 and older than 80 have elevated risk for size and weight violations, which increase the probability a driver is in a crash by 20 percent.
Figure 24: Size and Weight Violations by Age
Predicting Truck Crash Involvement - 2018 28
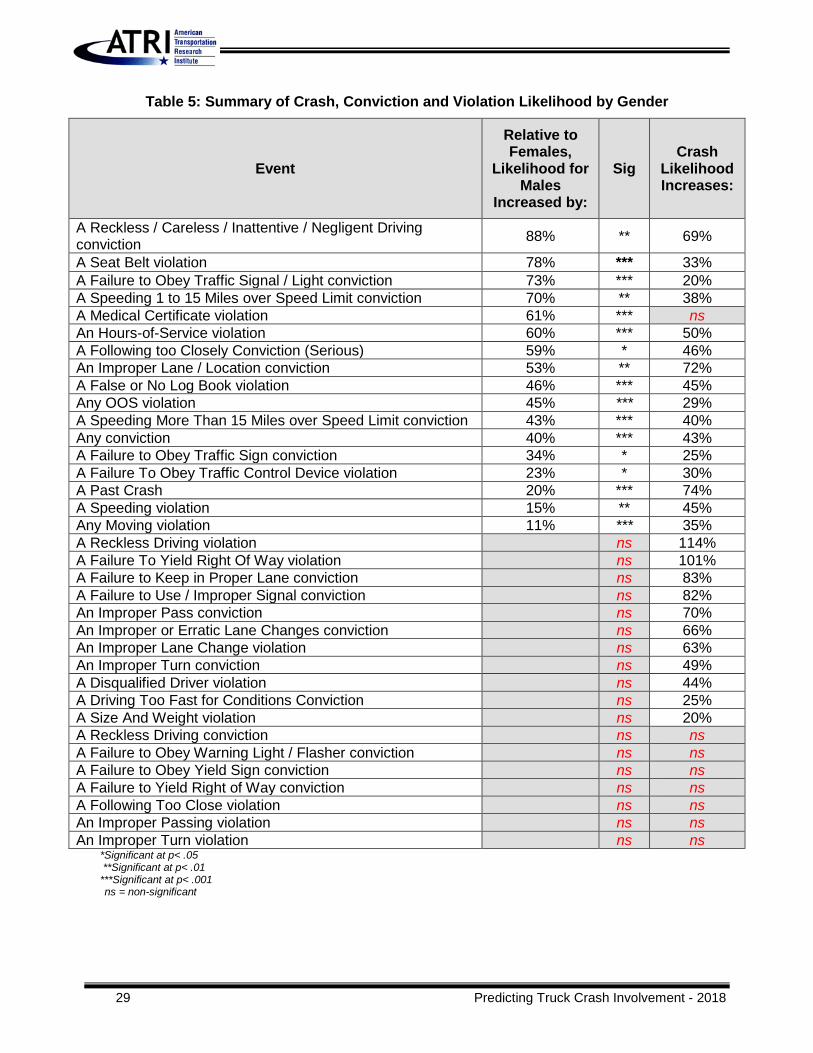
Driver Gender Summary The impact of driver gender on likelihood of violations, convictions and crash involvement was also analyzed. A summary of this analysis is shown in Table 5. For all statistically significant behaviors, male drivers were always more likely than female drivers to have that specific conviction, violation or crash. Statistically significant relationships were found between gender and likelihood of certain convictions. Driver gender had the most significant impact on reckless / careless / inattentive / negligent driving convictions; men were 88 percent more likely to have a reckless / careless / inattentive / negligent driving conviction than women. Failure to obey a traffic signal / light and speeding 1 – 15 miles over the speed limit convictions were also related to driver gender. Relative to women, men were 73 percent more likely to have a failure to obey a traffic signal / light conviction, and 70 percent more likely to have a 1 – 15 miles over the speed limit conviction. Additionally, men were 40 percent more likely than women to be convicted of any offense. Men were more likely than women to have seat belt violations, medical certificate violations and HOS violations. While the relationship between medical certificate violations and future crash involvement is not statistically significant, a seat belt violation is associated with a 33 percent increase in future crash probability and an HOS violation is associated with a 50 percent increase in future crash probability. Four other violations had a statistically significant relationship with gender. Men were 45 percent more likely than women to have any OOS violation and 11 percent more likely to have a moving violation. Gender also had a significant impact on the probability of crash involvement. Men were 20 percent more likely to be involved in a crash than women. The gender analysis findings can guide motor carriers in gender-specific training to better address problematic driver behaviors. Furthermore, the gender analysis findings demonstrate the value of industry efforts to recruit and retain more female truck drivers. Continuing to make the truck driving profession more accessible to women has the potential to improve industry safety as well as mitigate the impacts of the driver shortage. Industry experts recommend a number of strategies to recruit female drivers, including:
• Emphasizing wages and benefits, female trainers, safe equipment, and home time; • Advertising the benefits of team driving where relevant.17,18
17 “3 Tips to Recruit Female Professional Drivers to Your Fleet,” The Road By C.H. Robinson, February 3, 2016. https://blog.chrwtrucks.com/driver-shortage/3-tips-to-recruit-female-professional-drivers-to-your-fleet/. 18 “The Trucking Industry Needs More than Just a Few Good Women,” accessed July 10, 2018, https://www.ccjdigital.com/wanted-more-than-just-a-few-good-women/.
29 Predicting Truck Crash Involvement - 2018
Table 5: Summary of Crash, Conviction and Violation Likelihood by Gender
Event
Relative to Females,
Likelihood for Males
Increased by:
Sig Crash
Likelihood Increases:
A Reckless / Careless / Inattentive / Negligent Driving conviction 88% ** 69%
A Seat Belt violation 78% *** 33% A Failure to Obey Traffic Signal / Light conviction 73% *** 20% A Speeding 1 to 15 Miles over Speed Limit conviction 70% ** 38% A Medical Certificate violation 61% *** ns An Hours-of-Service violation 60% *** 50% A Following too Closely Conviction (Serious) 59% * 46% An Improper Lane / Location conviction 53% ** 72% A False or No Log Book violation 46% *** 45% Any OOS violation 45% *** 29% A Speeding More Than 15 Miles over Speed Limit conviction 43% *** 40% Any conviction 40% *** 43% A Failure to Obey Traffic Sign conviction 34% * 25% A Failure To Obey Traffic Control Device violation 23% * 30% A Past Crash 20% *** 74% A Speeding violation 15% ** 45% Any Moving violation 11% *** 35% A Reckless Driving violation ns 114% A Failure To Yield Right Of Way violation ns 101% A Failure to Keep in Proper Lane conviction ns 83% A Failure to Use / Improper Signal conviction ns 82% An Improper Pass conviction ns 70% An Improper or Erratic Lane Changes conviction ns 66% An Improper Lane Change violation ns 63% An Improper Turn conviction ns 49% A Disqualified Driver violation ns 44% A Driving Too Fast for Conditions Conviction ns 25% A Size And Weight violation ns 20% A Reckless Driving conviction ns ns A Failure to Obey Warning Light / Flasher conviction ns ns A Failure to Obey Yield Sign conviction ns ns A Failure to Yield Right of Way conviction ns ns A Following Too Close violation ns ns An Improper Passing violation ns ns An Improper Turn violation ns ns
*Significant at p< .05 **Significant at p< .01 ***Significant at p< .001 ns = non-significant
Predicting Truck Crash Involvement - 2018 30
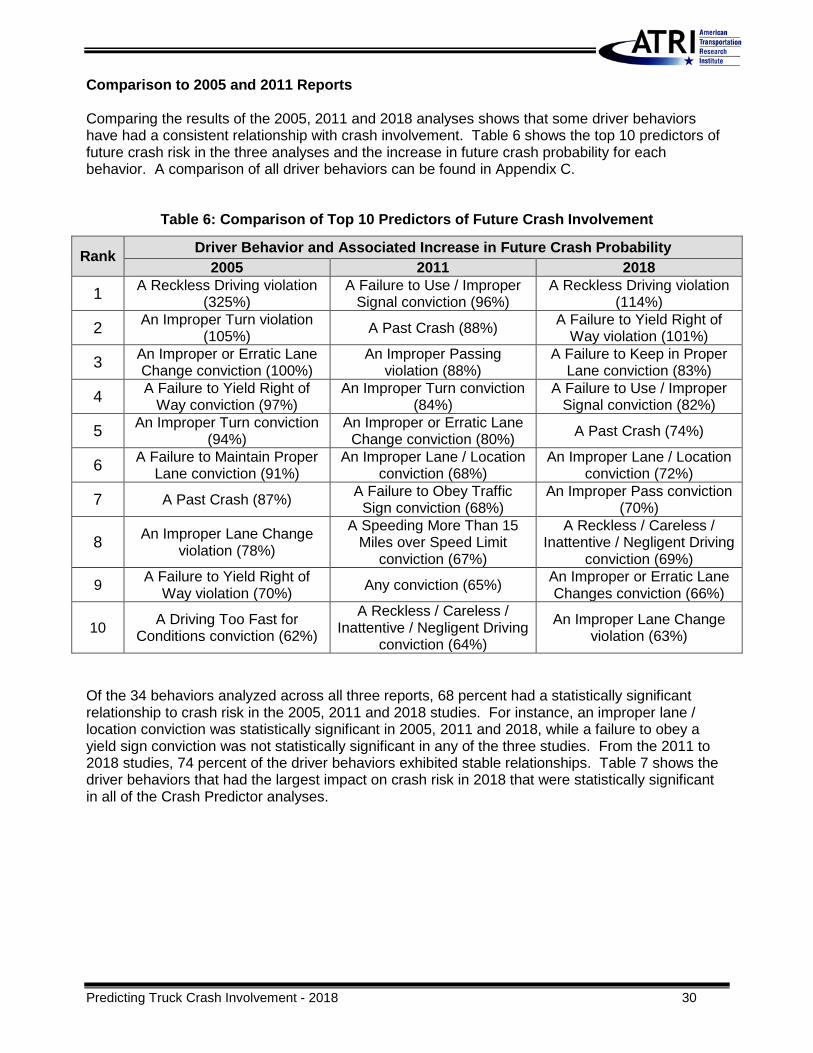
Comparison to 2005 and 2011 Reports Comparing the results of the 2005, 2011 and 2018 analyses shows that some driver behaviors have had a consistent relationship with crash involvement. Table 6 shows the top 10 predictors of future crash risk in the three analyses and the increase in future crash probability for each behavior. A comparison of all driver behaviors can be found in Appendix C.
Table 6: Comparison of Top 10 Predictors of Future Crash Involvement
Rank Driver Behavior and Associated Increase in Future Crash Probability 2005 2011 2018
1 A Reckless Driving violation (325%)
A Failure to Use / Improper Signal conviction (96%)
A Reckless Driving violation (114%)
2 An Improper Turn violation (105%) A Past Crash (88%) A Failure to Yield Right of
Way violation (101%)
3 An Improper or Erratic Lane Change conviction (100%)
An Improper Passing violation (88%)
A Failure to Keep in Proper Lane conviction (83%)
4 A Failure to Yield Right of Way conviction (97%)
An Improper Turn conviction (84%)
A Failure to Use / Improper Signal conviction (82%)
5 An Improper Turn conviction (94%)
An Improper or Erratic Lane Change conviction (80%) A Past Crash (74%)
6 A Failure to Maintain Proper Lane conviction (91%)
An Improper Lane / Location conviction (68%)
An Improper Lane / Location conviction (72%)
7 A Past Crash (87%) A Failure to Obey Traffic Sign conviction (68%)
An Improper Pass conviction (70%)
8 An Improper Lane Change violation (78%)
A Speeding More Than 15 Miles over Speed Limit
conviction (67%)
A Reckless / Careless / Inattentive / Negligent Driving
conviction (69%)
9 A Failure to Yield Right of Way violation (70%) Any conviction (65%) An Improper or Erratic Lane
Changes conviction (66%)
10 A Driving Too Fast for Conditions conviction (62%)
A Reckless / Careless / Inattentive / Negligent Driving
conviction (64%)
An Improper Lane Change violation (63%)
Of the 34 behaviors analyzed across all three reports, 68 percent had a statistically significant relationship to crash risk in the 2005, 2011 and 2018 studies. For instance, an improper lane / location conviction was statistically significant in 2005, 2011 and 2018, while a failure to obey a yield sign conviction was not statistically significant in any of the three studies. From the 2011 to 2018 studies, 74 percent of the driver behaviors exhibited stable relationships. Table 7 shows the driver behaviors that had the largest impact on crash risk in 2018 that were statistically significant in all of the Crash Predictor analyses.

31 Predicting Truck Crash Involvement - 2018
Table 7: Top 5 Stable Predictors of Crash Risk
A Past Crash
An Improper Lane / Location conviction A Reckless / Careless / Inattentive / Negligent Driving conviction An Improper or Erratic Lane Changes conviction An Improper Lane Change violation
Differences between the three studies were anticipated due to changes that have occurred in the trucking industry over the past 15 years. Relevant changes include rapid adoption of new safety technologies, use of speed limiters to improve safety and fuel efficiency, and voluntary adoption of electronic logging devices in 2013 by many fleets – in advance of an anticipated mandate. The trend of weakening association between driver behaviors and crash involvement between the 2005 and 2011 reports did not continue with the 2018 update. This stagnation may be the result of improving economic conditions following the Great Recession, which spurred freight movements on roadways with worsening congestion issues. Table 8 displays the changes in violation frequencies since the 2011 Crash Predictor analysis. Two violations without a statistically significant relationship to crash risk had the greatest increase in frequency since the 2011 Crash Predictor; improper turns violations and improper passing violations. Three violations with a statistically significant relationship to crash risk have increased in frequency since the 2011 report. Ten of the violations decreased in frequency since the 2011 Crash Predictor. Of these, eight violations had a statistically significant relationship to future crash risk, and two violations did not. Reductions in HOS-related violations are likely a consequence of electronic logging device adoption.
Table 8: Changes in Violation Frequencies for Roadside Inspections
Event
Percent of Drivers
With Violation
2011
Percent of Drivers
with Violation
2018
Percent Change 2011 - 2018
An Improper Turns violation 0.08% 0.11% 34.54% An Improper Passing violation 0.11% 0.15% 29.64% A Disqualified Driver violation 0.86% 0.98% 14.51% An Improper Lane Change violation 0.64% 0.73% 14.04% A Failure to Obey Traffic Control Device violation 2.52% 2.66% 5.63% A Failure to Yield Right of Way violation 0.14% 0.13% -7.17% An Hours-of-Service violation 17.32% 15.94% -7.96% A Following Too Close violation 0.80% 0.73% -8.05% Any OOS violation 34.74% 31.75% -8.62% A Reckless Driving violation 0.06% 0.05% -15.82% Any Moving violation 27.49% 21.98% -20.03%

Predicting Truck Crash Involvement - 2018 32
Event
Percent of Drivers
With Violation
2011
Percent of Drivers
with Violation
2018
Percent Change 2011 - 2018
A Size and Weight violation 14.52% 11.16% -23.13% A Speeding violation 11.96% 8.72% -27.09% A Medical Certificate violation 6.19% 3.83% -38.11% A False or No Log Book violation 20.10% 12.11% -39.76% Italicized text indicates behaviors that do not have a statistically significant relationship to crash risk.
Law Enforcement Interviews ATRI interviewed members of the CMV law enforcement community to gain additional insight on the changes in violation rates. Many interviewees indicated that over the past 15 years, enforcement focus has shifted toward driver behaviors that cause crashes. Interviewees attributed changes in violation rates to a variety of causes, including:
• Compliance, Safety, Accountability (CSA) Program and Improved Documentation. Implemented in 2010, CSA had more detailed data requirements than the prior system, SafeStat, which only used three violation groups comprising less than 20 percent of all violations to assess carrier safety.19 Additionally, CSA requires documentation of CMV inspections with no violations. Improvements to inspection documentation and reporting, as well as CSA-related changes, may have contributed to the reduced violations rates seen over the last 15 years. Specifically, the requirement to report clean inspections may have driven down violation rates since the implementation of CSA. Interviewees also noted that citations are more often contested due to CSA.
• Reductions to Law Enforcement Resources. The multitude of duties that law enforcement officers must complete in combination with a reduction in staffing may have contributed to the change in violation rates over the last 15 years.
• Increases to Speed Limits. Interviewees indicated that increased speed limits in their region may account for the reduction in speeding violations over the past 15 years.
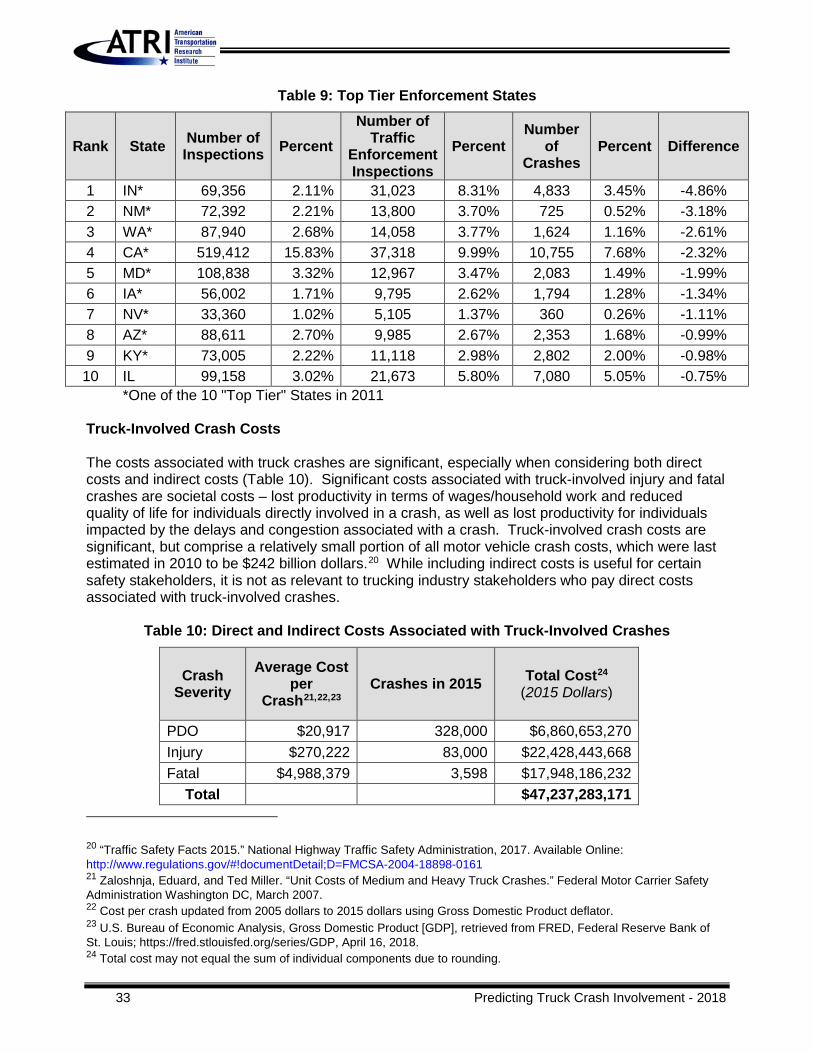
Enforcement Analysis ATRI again examined the effect of individual state enforcement strategies using an objective performance measure based on the percent of CMV traffic enforcement within each state relative to the percent of crashes within that state. State rankings were determined using the following formula:
State Ranking = (Percent of Traffic Enforcement Inspections) – (Percent of Crashes)
This performance metric assumes that there is a relationship between CMV enforcement and crash occurrence. Using this methodology, top tier states were identified (Table 9). The enforcement analysis findings for all states can be found in Appendix D.
19 John A. Volpe National Transportation Systems Center. (2009). Comprehensive Safety Analysis 2010: Carrier Safety Measurement System Violation Severity Weights. Washington, DC: Federal Motor Carrier Safety Administration. Available Online: http://www.regulations.gov/#!documentDetail;D=FMCSA-2004-18898-0161
33 Predicting Truck Crash Involvement - 2018
Table 9: Top Tier Enforcement States
Rank State Number of Inspections Percent
Number of Traffic
Enforcement Inspections
Percent Number
of Crashes
Percent Difference
1 IN* 69,356 2.11% 31,023 8.31% 4,833 3.45% -4.86% 2 NM* 72,392 2.21% 13,800 3.70% 725 0.52% -3.18% 3 WA* 87,940 2.68% 14,058 3.77% 1,624 1.16% -2.61% 4 CA* 519,412 15.83% 37,318 9.99% 10,755 7.68% -2.32% 5 MD* 108,838 3.32% 12,967 3.47% 2,083 1.49% -1.99% 6 IA* 56,002 1.71% 9,795 2.62% 1,794 1.28% -1.34% 7 NV* 33,360 1.02% 5,105 1.37% 360 0.26% -1.11% 8 AZ* 88,611 2.70% 9,985 2.67% 2,353 1.68% -0.99% 9 KY* 73,005 2.22% 11,118 2.98% 2,802 2.00% -0.98% 10 IL 99,158 3.02% 21,673 5.80% 7,080 5.05% -0.75% *One of the 10 "Top Tier" States in 2011
Truck-Involved Crash Costs The costs associated with truck crashes are significant, especially when considering both direct costs and indirect costs (Table 10). Significant costs associated with truck-involved injury and fatal crashes are societal costs – lost productivity in terms of wages/household work and reduced quality of life for individuals directly involved in a crash, as well as lost productivity for individuals impacted by the delays and congestion associated with a crash. Truck-involved crash costs are significant, but comprise a relatively small portion of all motor vehicle crash costs, which were last estimated in 2010 to be $242 billion dollars.20 While including indirect costs is useful for certain safety stakeholders, it is not as relevant to trucking industry stakeholders who pay direct costs associated with truck-involved crashes.
Table 10: Direct and Indirect Costs Associated with Truck-Involved Crashes
Crash Severity
Average Cost per
Crash21,22,23 Crashes in 2015 Total Cost24
(2015 Dollars)
PDO $20,917 328,000 $6,860,653,270 Injury $270,222 83,000 $22,428,443,668 Fatal $4,988,379 3,598 $17,948,186,232
Total $47,237,283,171 20 “Traffic Safety Facts 2015.” National Highway Traffic Safety Administration, 2017. Available Online: http://www.regulations.gov/#!documentDetail;D=FMCSA-2004-18898-0161 21 Zaloshnja, Eduard, and Ted Miller. “Unit Costs of Medium and Heavy Truck Crashes.” Federal Motor Carrier Safety Administration Washington DC, March 2007. 22 Cost per crash updated from 2005 dollars to 2015 dollars using Gross Domestic Product deflator. 23 U.S. Bureau of Economic Analysis, Gross Domestic Product [GDP], retrieved from FRED, Federal Reserve Bank of St. Louis; https://fred.stlouisfed.org/series/GDP, April 16, 2018. 24 Total cost may not equal the sum of individual components due to rounding.
Predicting Truck Crash Involvement - 2018 34
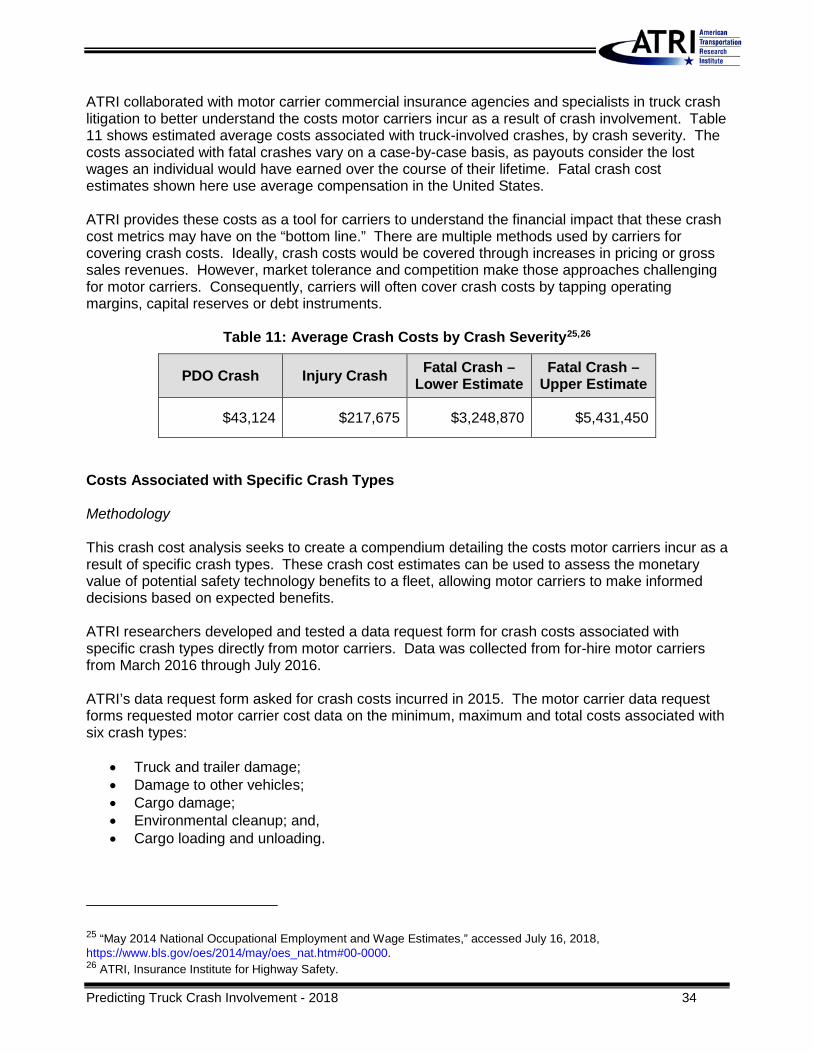
ATRI collaborated with motor carrier commercial insurance agencies and specialists in truck crash litigation to better understand the costs motor carriers incur as a result of crash involvement. Table 11 shows estimated average costs associated with truck-involved crashes, by crash severity. The costs associated with fatal crashes vary on a case-by-case basis, as payouts consider the lost wages an individual would have earned over the course of their lifetime. Fatal crash cost estimates shown here use average compensation in the United States. ATRI provides these costs as a tool for carriers to understand the financial impact that these crash cost metrics may have on the “bottom line.” There are multiple methods used by carriers for covering crash costs. Ideally, crash costs would be covered through increases in pricing or gross sales revenues. However, market tolerance and competition make those approaches challenging for motor carriers. Consequently, carriers will often cover crash costs by tapping operating margins, capital reserves or debt instruments.
Table 11: Average Crash Costs by Crash Severity25,26
PDO Crash Injury Crash Fatal Crash – Lower Estimate
Fatal Crash – Upper Estimate
$43,124 $217,675 $3,248,870 $5,431,450
Costs Associated with Specific Crash Types Methodology This crash cost analysis seeks to create a compendium detailing the costs motor carriers incur as a result of specific crash types. These crash cost estimates can be used to assess the monetary value of potential safety technology benefits to a fleet, allowing motor carriers to make informed decisions based on expected benefits. ATRI researchers developed and tested a data request form for crash costs associated with specific crash types directly from motor carriers. Data was collected from for-hire motor carriers from March 2016 through July 2016. ATRI’s data request form asked for crash costs incurred in 2015. The motor carrier data request forms requested motor carrier cost data on the minimum, maximum and total costs associated with six crash types:
• Truck and trailer damage; • Damage to other vehicles; • Cargo damage; • Environmental cleanup; and, • Cargo loading and unloading.
25 “May 2014 National Occupational Employment and Wage Estimates,” accessed July 16, 2018, https://www.bls.gov/oes/2014/may/oes_nat.htm#00-0000. 26 ATRI, Insurance Institute for Highway Safety.
35 Predicting Truck Crash Involvement - 2018
Additionally, the form solicited carrier costs associated with driver replacement, out-of-pocket settlement costs and attorney/court fees. Demographics A total of 18 for-hire carriers responded to the data request for crash costs. A summary of participating motor carrier demographics is included below.
• Respondents operate primarily in the truckload (47.1%) and specialized (35.3%) sectors. The remainder (17.6%) operate in the less-than truckload sector.
• Fleets primarily operated more than 1,000 trucks (41.2%), followed by 250 to 500 trucks (23.5%).
• Regional hauls of 100 to 499 miles were the most common reported trip length (58.8%). • Common primary vehicle configurations of respondents included: 5-axle dry van (41.2%), 5-
axle tanker (11.8%), and 5-axle bulk/food (11.8%). The remaining vehicle configurations included refrigerated trailers, intermodal containers, auto transporters, 5-axle flatbeds and longer combination vehicles.
Crash Costs The findings of the crash cost analyses are shown in Tables 12 through 18 and Figures 25 and 26. Average total crash costs are weighted to account for the frequency that specific crash cost centers occur for different crash types, therefore total costs reported are not simply the summation of the average costs shown in Tables 12 through 17. Crash cost centers with insufficient data are excluded from the following analysis and indicated with an asterisk (*). Carriers reported 333 rollover crashes in 2015 (Table 12), costing motor carriers an average of $50,611. While relatively infrequent, environmental cleanup fees were significant when they did occur at an average of $328,308. Damages to other vehicles occurred in over half of rollover crashes, and ranged widely in average costs. Truck and trailer damages and cargo damages were relatively infrequent, occurring in 20 to 30 percent of rollover crashes.
Table 12: 2015 Rollover Crash Costs
Cost Center Truck & Trailer
Damage
Damage to Other
Vehicles Cargo
Damage Environmental
Cleanup Total
Rollover Crashes with Cost Center 30.0% 66.7% 20.4% 8.1%
Average Lowest Cost $36,396 $1,486 $7,676 $324,618 $39,808
Average Highest Cost $70,398 $47,560 $51,183 $331,998 $90,218 Average Cost per Crash $44,833 $10,646 $17,137 $327,458 $50,611
A total of 178 jackknife crashes in 2015 were reported (Table 13). Jackknife crashes incurred costs of $12,073 on average. Truck and trailer damage and damage to other vehicles occurred in over half of all jackknife crashes. Data for cargo damage costs associated with jackknife crashes is not included in Table 13 due to insufficient data, as less than five reported jackknife crashes resulted in cargo damage. Although infrequent, when cargo damage occurs, it appears to typically exceed $10,000.
Predicting Truck Crash Involvement - 2018 36
Table 13: 2015 Jackknife Crashes
Cost Center Truck & Trailer
Damage
Damage to Other
Vehicles Cargo
Damage Environmental
Cleanup Total
Jackknife Crashes with Cost Center 59.6% 52.8% * 10.1%
Average Lowest Cost $778 $769 * $1,361 $1,007 Average Highest Cost $31,099 $41,800 * $46,241 $45,269 Average Cost per Crash $12,614 $6,919 * $8,977 $12,073
Table 14 shows the run-off-road crash costs reported by respondents, representing 368 run-off-road crashes. Run-off-road crashes were associated with average costs of $16,037. These costs are primarily the result of truck and trailer damages, and damage to other vehicles. Environmental cleanup costs associated with run-off-road crashes are significantly less than typical environmental costs, with average maximum costs of $10,808. Cargo damage occurs infrequently as a result of run-off-road crashes.
Table 14: 2015 Run-Off-Road Crash Costs
Cost Center Truck & Trailer
Damage
Damage to Other
Vehicles Cargo
Damage Environmental
Cleanup Total
Run-Off-Road Crashes with Cost Center
49.2% 48.1% 6.8% 6.0%
Average Lowest Cost $14,608 $294 $15,391 $3,894 $8,605
Average Highest Cost $48,979 $26,880 $34,687 $10,808 $40,022
Average Cost per Crash $25,780 $3,393 $19,023 $7,245 $16,037
Sideswipe crash costs (Table 15) included 3,438 crashes and cost motor carriers an average of $4,184. Sideswipe crashes had the lowest cost of all the crash types investigated in the present analysis. Damage to other vehicles occurred in over 75 percent of crashes reported. Truck and trailer damage was less common, with less than one third of sideswipe crashes resulting in truck and trailer damage. Cargo damage and environmental cleanup were rare costs associated with sideswipe crashes.
37 Predicting Truck Crash Involvement - 2018
Table 15: 2015 Sideswipe Crash Costs
Cost Center Truck & Trailer
Damage
Damage to Other
Vehicles Cargo
Damage Environmental
Cleanup Total
Sideswipe Crashes with Cost Center 22.5% 78.8% 0.6% 0.4%
Average Lowest Cost $236 $1,159 $3,149 $12,319 $1,035
Average Highest Cost $31,666 $34,075 $7,437 $14,640 $34,081
Average Cost per Crash $2,669 $4,429 $7,309 $12,672 $4,184
Table 16 shows the costs associated with the 77 head-on crashes reported by respondents. Cargo damage costs are excluded from head-on crash costs reported in Table 16 due to insufficient data. The average cost of a head-on collision, excluding legal, medical and cargo damage costs was $17,170.
Table 16: 2015 Head-On Crash Costs
Cost Center Truck & Trailer
Damage
Damage to Other
Vehicles Cargo
Damage Environmental
Cleanup Total
Head On Crashes with Cost Center 13.0% 89.6% * 5.2%
Average Lowest Cost $52,553 $8,897 * $7,327 $14,798
Average Highest Cost $78,681 $15,110 * $16,630 $23,758
Average Cost per Crash $61,157 $10,298 * $10,428 $17,170
Table 17 displays the costs associated with the 1,248 crashes in 2015 where a truck rear-ended another vehicle. Fleet adoption of adaptive cruise control could help prevent this crash type. As one would expect, damaging the other vehicle is exceedingly common (91%) and represents the highest costs resulting from rear end crash costs. Truck and trailer damages occur in 14.7 percent of rear end crashes, while cargo damages and environmental cleanup occur in less than two percent of rear end crashes. The costs associated with trucks rear-ending other vehicles were $8,593 on average.
Predicting Truck Crash Involvement - 2018 38
Table 17: 2015 Rear End Crash Costs
Cost Center Truck & Trailer
Damage
Damage to Other
Vehicles Cargo
Damage Environmental
Cleanup Total
Rear End Crashes with Cost Center 14.7% 91.0% 1.4% 1.8%
Average Lowest Cost $1,697 $1,968 $10,724 * $2,186
Average Highest Cost $25,297 $37,712 $19,058 $16,440 $38,600
Average Cost per Crash $5,990 $8,120 $10,946 $9,449 $8,593
Figure 25 displays the average cost associated with each crash type. Rollover crashes had the highest average cost, nearly three times the cost of an average head on collision. The most common crash type in this dataset, sideswipe crashes, were associated with the lowest average costs. Average crash costs may appear to be low compared to the average costs depicted in Table 11. This difference may be due to the exclusion of medical and legal costs. In events where motor carriers are self-insured, or crash costs fall below insurance deductibles, the motor carrier is ultimately responsible for “dollar one” of crash costs.
Figure 25: Average Crash Costs by Crash Type
The cost of replacing drivers is relevant to calculating costs resulting from truck crashes. Replacing a driver may be necessary if a driver’s negligence played a role in crash causation or if the driver is injured or killed in a crash. Driver replacement cost centers are shown in Figure 26. Respondents reported spending $7,000 on average to replace a driver. Training comprises the majority of replacement costs (50.9%, $3,835). Recruitment costs, such as bonuses, account for 21.2 percent of costs, followed by orientation costs, which account for 17.6 percent of replacement costs.
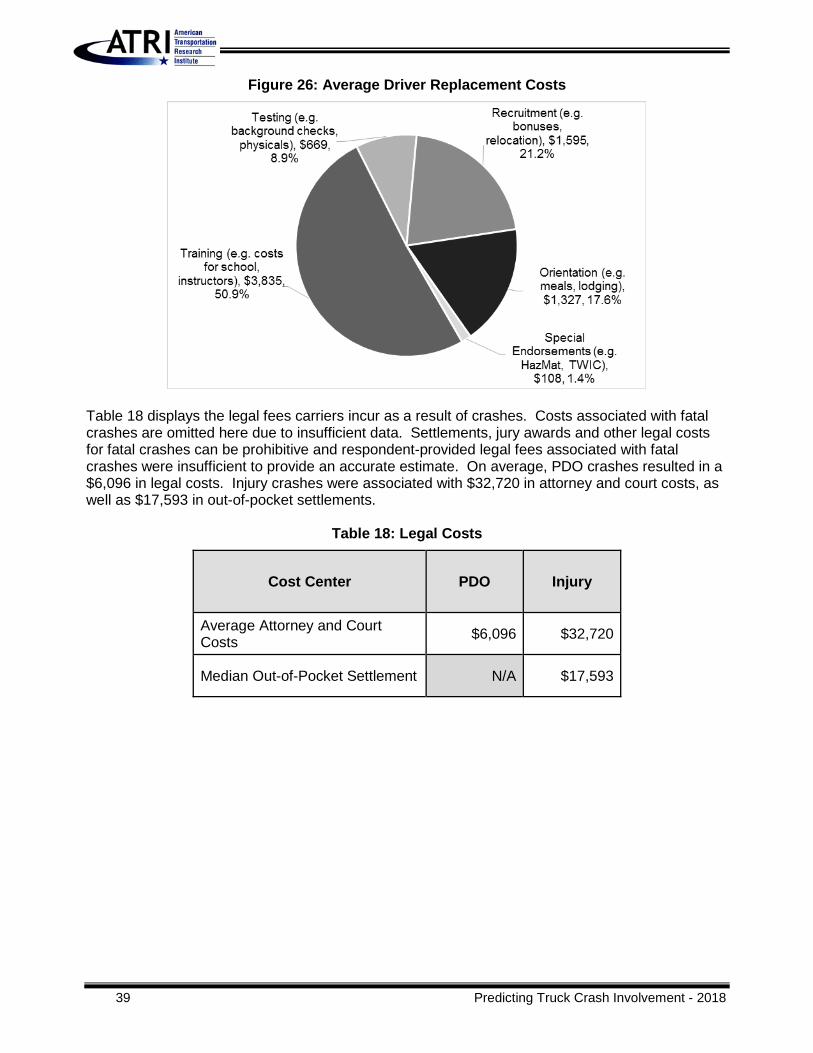
39 Predicting Truck Crash Involvement - 2018
Figure 26: Average Driver Replacement Costs
Table 18 displays the legal fees carriers incur as a result of crashes. Costs associated with fatal crashes are omitted here due to insufficient data. Settlements, jury awards and other legal costs for fatal crashes can be prohibitive and respondent-provided legal fees associated with fatal crashes were insufficient to provide an accurate estimate. On average, PDO crashes resulted in a $6,096 in legal costs. Injury crashes were associated with $32,720 in attorney and court costs, as well as $17,593 in out-of-pocket settlements.
Table 18: Legal Costs
Cost Center PDO Injury
Average Attorney and Court Costs $6,096 $32,720
Median Out-of-Pocket Settlement N/A $17,593
Predicting Truck Crash Involvement - 2018 40
CONCLUSION
The findings of the 2005 and 2011 Crash Predictor reports are compared and contrasted against this 2018 update, using 2013-2014 data. This updated analysis found that driver behavior continues to be a statistically significant predictor of future crash risk. However, the behaviors associated with crash risk are not static, as only 74 percent of the driver behaviors exhibited stable relationships to crash risk between the 2011 and 2018 reports. As in 2005, reckless driving violations in this 2018 report have the largest impact on future crash risk. This analysis also investigated the influence that driver age and gender has on the likelihood of violations, convictions and crashes. Driver age had a statistically significant relationship with all but eight driver behaviors, while driver gender had a statistically significant relationship with all but 18 driver behaviors. Female drivers were less likely to engage in risky driving behaviors than male drivers for all statistically significant behaviors. This analysis provides an opportunity for driver trainers and motor carriers to provide targeted training that addresses the impacts that age and gender have on crash risk and the probability a driver will engage in high-risk behaviors. Additionally, the gender analysis affirms that attracting more female drivers can generate powerful safety benefits beyond addressing the truck driver shortage. Overall, the Crash Predictor analysis provides a vital tool for motor carriers and enforcement agencies. Members of the CMV enforcement community interviewed for this analysis stated that their agency has shifted focus toward those driver behaviors with a stronger relationship to crash risk. The Crash Predictor supports these efforts by providing statistically sound information on what violations and convictions increase the likelihood that a driver is in a future crash. Similarly, the Crash Predictor serves as a resource for motor carriers, providing critical guidance on targeted risk-reduction training for incoming drivers, as well as targeted remedial training opportunities for veteran drivers. This report also estimated the costs motor carriers face as a result of truck-involved crashes, by crash severity and crash type. Crash cost estimates by severity were estimated using motor carriers’ commercial insurance agencies and specialists in truck crash litigation. Crash costs for specific crash types were estimated using motor carrier-provided data. This crash cost information is necessary to better understand the potential benefits associated with adopting new crash prevention technologies and the burden crash costs place on motor carriers.

41 Predicting Truck Crash Involvement - 2018
APPENDIX A: 2018 CHI SQUARE ANALYSIS
Past Crash Analysis Results There were a total of 439,260 U.S. drivers in our sample. Out of this total, there were 13,812 drivers who had a crash between 1/1/2013 and 12/31/2013, and 17,286 drivers who had a crash between 1/1/2014 and 12/31/2014. 425,448 drivers did not have a crash between 1/1/2013 and 12/31/2013 Of these, 16,360 (3.85%) had a crash between 1/1/2014 and 12/31/2014 13,812 drivers had a crash between 1/1/2013 and 12/31/2013 Of these, 926 (6.70%) had a crash between 1/1/2014 and 12/31/2014 ** 74.03% increase in the likelihood of a crash [Chi square value 289.2409, p-value < 0.0001] Inspection and Moving Violation Analysis Results There were 228,917 drivers in the sample that had a roadside inspection between 1/1/2013 and 12/31/2013. Of these, 11,070 drivers had a crash between 1/1/2014 and 12/31/2014. Any OOS Violation 156,246 drivers had zero (0) OOS violations Of these, 6,913 (4.42%) had a crash 72,671 drivers had one or more OOS violations Of these, 4,157 (5.72%) had a crash ** 29.41% increase in the likelihood of a crash [Chi square value 180.9965, p-value < 0.0001] Medical Certificate Violation 220,140 drivers did not have this violation Of these, 10,629 (4.83%) had a crash 8,777 drivers had this violation Of these, 441 (5.02%) had a crash ** 3.93% increase in the likelihood of a crash [Chi square value 0.7061, p-value 0.4008] False or No Log Book Violation 201,199 drivers did not have this violation Of these, 9,230 (4.59%) had a crash 27,718 drivers had this violation Of these, 1,840 (6.64%) had a crash ** 44.66% increase in the likelihood of a crash [Chi square value 222.6424, p-value 0.0001] Hours-of-Service Violation 192,419 drivers did not have this violation Of these, 8,612 (4.48%) had a crash 36,498 drivers had this violation Of these, 2,458 (6.73%) had a crash ** 50.22% increase in the likelihood of a crash

Predicting Truck Crash Involvement - 2018 42
[Chi square value 340.1851, p-value 0.0001] Disqualified Driver Violation 226,666 drivers did not have this violation Of these, 10,914 (4.82%) had a crash 2,251 drivers had this violation Of these, 156 (6.93%) had a crash ** 43.78% increase in the likelihood of a crash [Chi square value 21.6700, p-value 0.0001] Seat Belt Violation 222,557 drivers did not have this violation Of these, 10,683 (4.80%) had a crash 6,630 drivers had this violation Of these, 387 (6.08%) had a crash ** 32.89% increase in the likelihood of a crash [Chi square value 22.1789, p-value 0.0001] Any Moving Violation 178,595 drivers had zero (0) moving violations Of these, 8,019 (4.49%) had a crash 50,322 drivers had one or more moving violations Of these, 3,051 (6.06%) had a crash ** 34.97% increase in the likelihood of a crash [Chi square value 211.0631, p-value 0.0001] Failure to Obey Traffic Control Device Violation 222,834 drivers did not have this violation Of these, 10,690 (4.80%) had a crash 6,083 drivers had this violation Of these, 380 (6.25%) had a crash ** 30.21% increase in the likelihood of a crash [Chi square value 27.0389, p-value 0.0001] Following Too Close Violation 227,240 drivers did not have this violation Of these, 10,974 (4.83%) had a crash 1,677 drivers had this violation Of these, 96 (5.72%) had a crash ** 18.43% increase in the likelihood of a crash [Chi square value 2.8993, p-value 0.0886] Improper Lane Change Violation 227,247 drivers did not have this violation Of these, 10,939 (4.81%) had a crash 1,670 drivers had this violation Of these, 131 (7.84%) had a crash
43 Predicting Truck Crash Involvement - 2018
** 62.99% increase in the likelihood of a crash [Chi square value 33.0866, p-value 0.0001] Improper Passing Violation 228,578 drivers did not have this violation Of these, 11,050 (4.83%) had a crash 339 drivers had this violation Of these, 20 (5.90%) had a crash ** 22.15% increase in the likelihood of a crash [Chi square value 0.8350, p-value 0.3608] Reckless Driving Violation 228,801 drivers did not have this violation Of these, 11,058 (4.83%) had a crash 116 drivers had this violation Of these, 12 (10.34%) had a crash ** 114.08% increase in the likelihood of a crash [Chi square value 7.6539, p-value 0.0057] Speeding Violation 208,962 drivers did not have this violation Of these, 9,723 (4.65%) had a crash 19,955 drivers had this violation Of these, 1,347 (6.75%) had a crash ** 45.16% increase in the likelihood of a crash [Chi square value 174.0897, p-value 0.0001] Improper Turns Violation 228,659 drivers did not have this violation Of these, 11,054 (4.83%) had a crash 258 drivers had this violation Of these, 16 (6.20%) had a crash ** 28.36% increase in the likelihood of a crash [Chi square value 1.0469, p-value 0.3062] Size and Weight Violation 203,360 drivers did not have this violation Of these, 9,620 (4.73%) had a crash 25,557 drivers had this violation Of these, 1,450 (5.67%) had a crash ** 19.87% increase in the likelihood of a crash [Chi square value 43.8771, p-value 0.0001] Failure to Yield Right of Way Violation 228,628 drivers did not have this violation Of these, 11,042 (4.83%) had a crash

Predicting Truck Crash Involvement - 2018 44
289 drivers had this violation Of these, 28 (9.69%) had a crash ** 100.62% increase in the likelihood of a crash [Chi square value 14.8075, p-value 0.0001] Conviction Analysis Results There were 439,260 U.S. drivers in the sample. The following analysis represents drivers with and without the particular conviction between 1/1/2013 and 12/31/2013, and then whether these drivers had a crash between 1/1/2014 and 12/31/2014. Any conviction 398,055 drivers had zero (0) convictions Of these, 15,062 (3.78%) had a crash 41,205 drivers had one or more convictions Of these, 2,224 (5.40%) had a crash ** 42.86% increase in the likelihood of a crash [Chi square value 257.1429, p-value 0.0001] Speeding More Than 15 Miles over Speed Limit Conviction (Serious) 413,010 drivers had zero (0) of this type of conviction Of these, 15,876 (3.84%) had a crash 26,250 drivers had one or more of this type of conviction Of these, 1,410 (5.37%) had a crash ** 39.84% increase in the likelihood of a crash [Chi square value 152.3237, p-value 0.0001] Following too Closely Conviction (Serious) 438,093 drivers had zero (0) of this type of conviction Of these, 17,219 (3.93%) had a crash 1,167 drivers had one or more of this type of conviction Of these, 67 (5.74%) had a crash ** 46.06% increase in the likelihood of a crash [Chi square value 10.0950, p-value 0.0015] Improper or Erratic Lane Changes Conviction (Serious) 437,572 drivers had zero (0) of this type of conviction Of these, 17,176 (3.93%) had a crash 1,688 drivers had one or more of this type of conviction Of these, 110 (6.52%) had a crash ** 65.90% increase in the likelihood of a crash [Chi square value 29.8673, p-value 0.0001] Reckless Driving Conviction (Serious) 438,933 drivers had zero (0) of this type of conviction Of these, 17,267 (3.93%) had a crash 327 drivers had one or more of this type of conviction Of these, 19 (5.81%) had a crash
45 Predicting Truck Crash Involvement - 2018
** 47.84% increase in the likelihood of a crash [Chi square value 3.0437, p-value 0.0811] Failure to Obey Traffic Signal / Light Conviction 436,479 drivers had zero (0) of this type of conviction Of these, 17,155 (3.93%) had a crash 2,781 drivers had one or more of this type of conviction Of these, 131 (4.71%) had a crash ** 19.85% increase in the likelihood of a crash [Chi square value 4.4498, p-value 0.0349] Failure to Obey Traffic Sign Conviction 436,516 drivers had zero (0) of this type of conviction Of these, 17,151 (3.93%) had a crash 2,744 drivers had one or more of this type of conviction Of these, 135 (4.92%) had a crash ** 25.19% increase in the likelihood of a crash [Chi square value 7.0805, p-value 0.0078] Failure to Obey Warning Light / Flasher Conviction 439,231 drivers had zero (0) of this type of conviction Of these, 17,286 (3.94%) had a crash 29 drivers had one or more of this type of conviction Of these, 0 (0.0%) had a crash ** No increase in the likelihood of a crash [Chi square value 1.1881, p-value 0.2757] Failure to Obey Yield Sign Conviction 439,216 drivers had zero (0) of this type of conviction Of these, 17,285 (3.94%) had a crash 44 drivers had one or more of this type of conviction Of these, 1 (2.27%) had a crash ** No increase in the likelihood of a crash [Chi square value 0.3217, p-value 0.5706] Improper Lane / Location Conviction 437,114 drivers had zero (0) of this type of conviction Of these, 17,141 (3.92%) had a crash 2,146 drivers had one or more of this type of conviction Of these, 145 (6.76%) had a crash ** 72.45% increase in the likelihood of a crash [Chi square value 45.4130, p-value 0.0001] Failure to Keep in Proper Lane Conviction 438,885 drivers had zero (0) of this type of conviction Of these, 17,259 (3.93%) had a crash
Predicting Truck Crash Involvement - 2018 46
375 drivers had one or more of this type of conviction Of these, 27 (7.20%) had a crash ** 83.21% increase in the likelihood of a crash [Chi square value 10.5819, p-value 0.0011] Improper Pass Conviction 438,931 drivers had zero (0) of this type of conviction Of these, 17,264 (3.93%) had a crash 329 drivers had one or more of this type of conviction Of these, 22 (6.69%) had a crash ** 70.23% increase in the likelihood of a crash [Chi square value 6.5945, p-value 0.0102] Reckless / Careless / Inattentive / Negligent Driving Conviction 437,950 drivers had zero (0) of this type of conviction Of these, 17,199 (3.93%) had a crash 1,310 drivers had one or more of this type of conviction Of these, 87 (6.64%) had a crash ** 68.96% increase in the likelihood of a crash [Chi square value 25.4493, p-value 0.0001] Failure to Yield Right of Way Conviction 438,763 drivers had zero (0) of this type of conviction Of these, 17,261 (3.93%) had a crash 497 drivers had one or more of this type of conviction Of these, 25 (5.03%) had a crash ** 27.99% increase in the likelihood of a crash [Chi square value 1.5779, p-value 0.2091] Failure to Use / Improper Signal Conviction 438,911 drivers had zero (0) of this type of conviction Of these, 17,261 (3.93%) had a crash 349 drivers had one or more of this type of conviction Of these, 25 (7.16%) had a crash ** 82.19% increase in the likelihood of a crash [Chi square value 9.6276, p-value 0.0019] Improper Turn Conviction 438,712 drivers had zero (0) of this type of conviction Of these, 17,254 (3.93%) had a crash 548 drivers had one or more of this type of conviction Of these, 32 (5.84%) had a crash ** 48.60% increase in the likelihood of a crash [Chi square value 5.2625, p-value 0.0218] Speeding 1 to 15 Miles over Speed Limit Conviction 437,762 drivers had zero (0) of this type of conviction
47 Predicting Truck Crash Involvement - 2018
Of these, 17,205 (3.93%) had a crash 1,498 drivers had one or more of this type of conviction Of these, 81 (5.41%) had a crash ** 37.66% increase in the likelihood of a crash [Chi square value 8.6148, p-value 0.0033] Driving Too Fast for Conditions Conviction 437,655 drivers had zero (0) of this type of conviction Of these, 17,207 (3.93%) had a crash 1,605 drivers had one or more of this type of conviction Of these, 79 (4.92%) had a crash ** 25.19% increase in the likelihood of a crash [Chi square value 4.1499, p-value 0.0416]
Predicting Truck Crash Involvement - 2018 48
APPENDIX B: DRIVER GENDER ANALYSIS
Crash Analysis Results 2014 crash data was analyzed for consistency with the age analysis. There were a total of 439,225 drivers in our sample. Out of this total, there were 17,286 drivers who had a crash between 1/1/2014 and 12/31/2014. 428,484 of the drivers in the sample were men Of these, 16,933 (3.95%) had a crash between 1/1/2014 and 12/31/2014 10,741 of the drivers in the sample were women Of these, 353 (3.29%) had a crash between 1/1/2014 and 12/31/2014 ** Men were 20.06 percent more likely to be involved in a crash compared to women [Chi square value 12.2700, p-value 0.0005] Inspection and Moving Violation Analysis Results There were 228,905 drivers in the sample that had a roadside inspection between 1/1/2013 and 12/31/2013 that had their gender identified in CDLIS. 12 of the drivers did not have their gender identified in CDLIS. Any OOS Violation 224,567 of the drivers in the sample were men Of these, 71,710 (31.93%) had any OOS violation between 1/1/2013 and 12/31/2013 4,338 of the drivers in the sample were women. Of these, 953 (21.97%) had any OOS violation between 1/1/2013 and 12/31/2013 ** Men were 45.33 percent more likely to have a violation compared to women [Chi square value 195.0023, p-value <.0001] Medical Certificate Violation 224,567 of the drivers in the sample were men Of these, 8,673 (3.86%) had a medical certificate violation between 1/1/2013 and 12/31/2013 4,338 of the drivers in the sample were women Of these, 104 (2.40%) had a medical certificate violation between 1/1/2013 and 12/31/2013 ** Men were 60.83 percent more likely to have a medical certificate violation compared to women [Chi square value 24.7603, p-value <.0001] False or No Log Book Violation 224,567 of the drivers in the sample were men Of these, 27,352 (12.18%) had a false or no log book violation between 1/1/2013 and 12/31/2013 4,338 of the drivers in the sample were women Of these, 363 (8.37%) had a false or no log book violation between 1/1/2013 and 12/31/2013 ** Men were 45.52 percent more likely to have a false or no log book violation compared to women [Chi square value 58.1124, p-value <.0001] Hours-of-Service Violation 224,567 of the drivers in the sample were men Of these, 36,061 (16.06%) had an HOS violation between 1/1/2013 and 12/31/2013 4,338 of the drivers in the sample were women Of these, 435 (10.03%) had an HOS violation between 1/1/2013 and 12/31/2013 ** Men were 60.12 percent more likely to have an HOS violation compared to women.

49 Predicting Truck Crash Involvement - 2018
[Chi square value 115.4796, p-value <.0001] Disqualified Driver Violation 224,567 of the drivers in the sample were men Of these, 2,218 (9.99%) had a disqualified driver violation between 1/1/2013 and 12/31/2013 4,338 of the drivers in the sample were women Of these, 32 (0.74%) had a disqualified driver violation between 1/1/2013 and 12/31/2013 ** Driver gender had no impact on the likelihood of a disqualified driver violation [Chi square value 2.7331, p-value 0.0983] Any Moving Violation 224,567 of the drivers in the sample were men Of these, 49,456 (22.02%) had any moving violation between 1/1/2013 and 12/31/2013 4,338 of the drivers in the sample were women Of these, 864 (19.92%) had any moving violation between 1/1/2013 and 12/31/2013 ** Men were 10.54 percent more likely to have any moving violation compared to women [Chi square value 11.0039, p-value 0.0009] Failure to Obey Traffic Control Device Violation 224,567 of the drivers in the sample were men Of these, 5,988 (2.67%) had a failure to obey traffic control device violation between 1/1/2013 and 12/31/2013 4,338 of the drivers in the sample were women Of these, 94 (2.17%) had a failure to obey traffic control device violation between 1/1/2013 and 12/31/2013 ** Men were 23.04 percent more likely to have a failure to obey traffic control device violation compared to women [Chi square value 4.1065, p-value 0.0427] Following Too Close Violation 224,567 of the drivers in the sample were men Of these, 1,652 (0.74%) had a following too close violation between 1/1/2013 and 12/31/2013 4,338 of the drivers in the sample were women Of these, 25 (0.58%) had a following too close violation between 1/1/2013 and 12/31/2013 ** Driver gender had no impact on the likelihood of a following too close violation [Chi square value 1.4857, p-value 0.2229] Improper Lane Change Violation 224,567 of the drivers in the sample were men Of these, 1,638 (0.73%) had an improper lane change violation between 1/1/2013 and 12/31/2013 4,338 of the drivers in the sample were women Of these, 32 (0.74%) had an improper lane change violation between 1/1/2013 and 12/31/2013 ** Driver gender had no impact on the likelihood of an improper lane change violation [Chi square value 0.0040, p-value 0.9495] Improper Passing Violation 224,567 of the drivers in the sample were men Of these, 333 (0.15%) had an improper passing violation between 1/1/2013 and 12/31/2013
Predicting Truck Crash Involvement - 2018 50
4,338 of the drivers in the sample were women Of these, 6 (0.14%) had an improper violation between 1/1/2013 and 12/31/2013 ** Driver gender had no impact on the likelihood of an improper passing violation [Chi square value 0.0286, p-value 0.8657] Reckless Driving Violation 224,567 of the drivers in the sample were men Of these, 115 (0.05%) had a reckless driving violation between 1/1/2013 and 12/31/2013 4,338 of the drivers in the sample were women Of these, 1 (0.02%) had a reckless driving violation between 1/1/2013 and 12/31/2013 ** Driver gender had no impact on the likelihood of a reckless driving violation [Chi square value 0.6662, p-value 0.4144] Speeding Violation 224,567 of the drivers in the sample were men Of these, 19,625 (8.74%) had a speeding violation between 1/1/2013 and 12/31/2013 4,338 of the drivers in the sample were women Of these, 330 (7.61%) had a speeding violation between 1/1/2013 and 12/31/2013 ** Men were 14.85 percent more likely to have a speeding violation compared to women [Chi square value 6.8513, p-value 0.0089] Improper Turns Violation 224,567 of the drivers in the sample were men Of these, 256 (0.11%) had an improper turns violation between 1/1/2013 and 12/31/2013 4,338 of the drivers in the sample were women Of these, 2 (0.05%) had an improper turns violation between 1/1/2013 and 12/31/2013 ** Driver gender had no impact on the likelihood of an improper turns violation [Chi square value 1.7424, p-value 0.1868] Size and Weight Violation 224,567 of the drivers in the sample were men Of these, 25,105 (11.18%) had a size and weight violation between 1/1/2013 and 12/31/2013 4,338 of the drivers in the sample were women Of these, 450 (10.37%) had a size and weight violation between 1/1/2013 and 12/31/2013 ** Driver gender had no impact on the likelihood of a size and weight violation [Chi square value 2.7866, p-value 0.0951] Failure to Yield Right of Way Violation 224,567 of the drivers in the sample were men. Of these, 284 (0.13%) had a failure to yield right of way violation between 1/1/2013 and 12/31/2013. 4,338 of the drivers in the sample were women. Of these, 5 (0.12%) had a failure to yield right of way violation between 1/1/2013 and 12/31/2013. ** Driver gender had no impact on the likelihood of a failure to yield right of way violation [Chi square value 0.0424, p-value 0.8369] Conviction Analysis Results

51 Predicting Truck Crash Involvement - 2018
There were 439,225 U.S. drivers in the sample. The following analysis explores the relationship between gender and convictions between 1/1/2013 and 12/31/2013. 35 of the drivers were excluded from this analysis since no gender was indicated in CDLIS. Any conviction 402,686 of the drivers in the sample were men Of these, 40,478 (9.45%) had any conviction between 1/1/2013 and 12/31/2013 10,741 of the drivers in the sample were women Of these, 727 (6.77%) had any conviction between 1/1/2013 and 12/31/2013 ** Men were 39.59% percent more likely to have any conviction compared to women [Chi square value 88.4182, p-value <.0001] Speeding More Than 15 Miles over Speed Limit Conviction (Serious) 402,686 of the drivers in the sample were men Of these, 25,798 (6.02%) had a speeding more than 15 miles over the speed limit conviction between 1/1/2013 and 12/31/2013 10,741 of the drivers in the sample were women Of these, 452 (4.21%) had a speeding more than 15 miles over the speed limit conviction between 1/1/2013 and 12/31/2013 ** Men were 42.99 percent more likely to have a speeding more than 15 miles over the speed limit conviction compared to women [Chi square value 61.2648, p-value <.0001] Following Too Closely Conviction (Serious) 402,686 of the drivers in the sample were men Of these, 1,149 (0.27%) had a following too closely conviction between 1/1/2013 and 12/31/2013 10,741 of the drivers in the sample were women Of these, 18 (0.17%) had a following too closely conviction between 1/1/2013 and 12/31/2013 ** Men were 58.82 percent more likely to have a following too closely conviction compared to women [Chi square value 3.9997, p-value 0.0455] Improper or Erratic Lane Changes Conviction (Serious) 402,686 of the drivers in the sample were men Of these, 1,648 (0.38%) had an improper/erratic lane change conviction between 1/1/2013 and 12/31/2013 10,741 of the drivers in the sample were women Of these, 40 (0.37%) had an improper/erratic lane change conviction between 1/1/2013 and 12/31/2013 ** Driver gender had no impact on the likelihood of an improper/erratic lane change conviction [Chi square value 0.0408, p-value 0.8400] Reckless Driving Conviction (Serious) 402,686 of the drivers in the sample were men Of these, 322 (0.08%) had a reckless driving conviction between 1/1/2013 and 12/31/2013 10,741 of the drivers in the sample were women Of these, 5 (0.05%) had a reckless driving conviction between 1/1/2013 and 12/31/2013 ** Driver gender had no impact on the likelihood of a reckless driving conviction [Chi square value 1.1519, p-value 0.2831] Failure to Obey Traffic Signal / Light Conviction

Predicting Truck Crash Involvement - 2018 52
402,686 of the drivers in the sample were men Of these, 2,741 (0.64%) had a failure to obey traffic signal/light conviction between 1/1/2013 and 12/31/2013 10,741 of the drivers in the sample were women Of these, 40 (0.37%) had a failure to obey traffic signal/light conviction between 1/1/2013 and 12/31/2013 ** Men were 72.97 percent more likely to have a failure to obey traffic signal/light conviction compared to women [Chi square value 11.8990, p-value 0.0006] Failure to Obey Traffic Sign Conviction 402,686 of the drivers in the sample were men Of these, 2,694 (0.63%) had a failure to obey traffic sign conviction between 1/1/2013 and 12/31/2013 10,741 of the drivers in the sample were women Of these, 50 (0.47%) had a failure to obey traffic sign conviction between 1/1/2013 and 12/31/2013 ** Men were 34.04 percent more likely to have a failure to obey traffic sign conviction compared to women [Chi square value 4.4965, p-value 0.0340] Failure to Obey Warning Light / Flasher Conviction 402,686 of the drivers in the sample were men Of these, 28 (0.01%) had a failure to obey warning light/flasher conviction between 1/1/2013 and 12/31/2013 10,741 of the drivers in the sample were women Of these, 1 (0.01%) had a failure to obey warning light/flasher conviction between 1/1/2013 and 12/31/2013 ** Driver gender had no impact on the likelihood of a failure to obey warning light/flasher conviction [Chi square value 0.1223, p-value 0.7266] Failure to Obey Yield Sign Conviction 402,686 of the drivers in the sample were men Of these, 43 (0.01%) had a conviction between 1/1/2013 and 12/31/2013 10,741 of the drivers in the sample were women Of these, 1 (0.01%) had a conviction between 1/1/2013 and 12/31/2013 ** Driver gender had no impact on the likelihood of a failure to obey yield sign conviction [Chi square value 0.0055, p-value 0.9409] Improper Lane / Location Conviction 402,686 of the drivers in the sample were men Of these, 2,112 (0.49%) had an improper lane/location conviction between 1/1/2013 and 12/31/2013 10,741 of the drivers in the sample were women Of these, 34 (0.32%) had an improper lane/location conviction between 1/1/2013 and 12/31/2013 ** Men were 53.13 percent more likely to have an improper lane/location conviction compared to women [Chi square value 6.7029, p-value 0.0096] Failure to Keep in Proper Lane Conviction 402,686 of the drivers in the sample were men Of these, 364 (0.08%) had a failure to keep in proper lane conviction between 1/1/2013 and 12/31/2013 10,741 of the drivers in the sample were women Of these, 11 (0.10%) had a failure to keep in proper lane conviction between 1/1/2013 and 12/31/2013 ** Driver gender had no impact on the likelihood of a failure to keep in proper lane conviction

53 Predicting Truck Crash Involvement - 2018
[Chi square value 0.3745, p-value 0.5406] Improper Pass Conviction 402,686 of the drivers in the sample were men Of these, 320 (0.07%) had an improper pass conviction between 1/1/2013 and 12/31/2013 10,741 of the drivers in the sample were women Of these, 9 (0.08%) had an improper pass conviction between 1/1/2013 and 12/31/2013 ** Driver gender had no impact on the likelihood of an improper pass conviction [Chi square value 0.1162, p-value 0.7332] Reckless / Careless / Inattentive / Negligent Driving Conviction 402,686 of the drivers in the sample were men Of these, 17 (0.16%) had a reckless/careless/inattentive/negligent driving conviction between 1/1/2013 and 12/31/2013 10,741 of the drivers in the sample were women Of these, 1,293 (0.30%) had a reckless/careless/inattentive/negligent driving conviction between 1/1/2013 and 12/31/2013 ** Men were 87.50 percent more likely to have a reckless/careless/inattentive/negligent driving conviction compared to women. [Chi square value 7.2551, p-value 0.0071] Failure to Yield Right of Way Conviction 402,686 of the drivers in the sample were men Of these, 488 (0.11%) had a failure to yield right of way conviction between 1/1/2013 and 12/31/2013 10,741 of the drivers in the sample were women Of these, 9 (0.08%) had a failure to yield right of way conviction between 1/1/2013 and 12/31/2013 ** Driver gender had no impact on the likelihood of a failure to yield right of way conviction [Chi square value 0.8399, p-value 0.3594] Failure to Use / Improper Signal Conviction 402,686 of the drivers in the sample were men Of these, 345 (0.08%) had a failure to use/improper signal conviction between 1/1/2013 and 12/31/2013 10,741 of the drivers in the sample were women Of these, 4 (0.04%) had a failure to use/improper signal conviction between 1/1/2013 and 12/31/2013 ** Driver gender had no impact on the likelihood of a failure to use/improper signal conviction [Chi square value 2.4717, p-value 0.1159] Improper Turn Conviction 402,686 of the drivers in the sample were men Of these, 535 (0.12%) had an improper turn conviction between 1/1/2013 and 12/31/2013 10,741 of the drivers in the sample were women Of these, 13 (0.12%) had an improper turn conviction between 1/1/2013 and 12/31/2013 ** Driver gender had no impact on the likelihood of an improper turn conviction [Chi square value 0.0123, p-value 0.9116] Speeding 1 to 15 Miles over Speed Limit Conviction 402,686 of the drivers in the sample were men Of these, 1,477 (0.34%) had a conviction between 1/1/2013 and 12/31/2013

Predicting Truck Crash Involvement - 2018 54
10,741 of the drivers in the sample were women Of these, 21 (0.20%) had a conviction between 1/1/2013 and 12/31/2013 ** Men were 70.00 percent more likely to have a conviction compared to women [Chi square value 6.8618, p-value 0.0088] Driving Too Fast for Conditions Conviction 402,686 of the drivers in the sample were men Of these, 1,572 (0.37%) had a driving too fast for conditions conviction between 1/1/2013 and 12/31/2013 10,741 of the drivers in the sample were women Of these, 33 (0.31%) had a driving too fast for conditions conviction between 1/1/2013 and 12/31/2013 ** Driver gender had no impact on the likelihood of a driving too fast for conditions conviction [Chi square value 1.0237, p-value 0.3116]

55 Predicting Truck Crash Involvement - 2018
APPENDIX C: 2005, 2011 AND 2018 COMPARISONS
Event
2018 Report 2011 Report 2005 Report Increase in
Crash Likelihood
Sig Increase in Crash
Likelihood Sig
Increase in Crash
Likelihood Sig
A Failure to Yield Right of Way violation 101% *** ns 70% *** A Past Crash 74% *** 88% *** 87% *** An Improper Lane / Location conviction 72% *** 68% *** 47% *** A Reckless / Careless / Inattentive / Negligent Driving conviction 69% *** 64% *** 53% ***
An Improper or Erratic Lane Changes conviction 66% *** 80% *** 100% *** An Improper Lane Change violation 63% *** 41% *** 78% *** An Hours-of-Service violation 50% *** 45% *** 41% *** A Speeding violation 45% *** 38% *** 35% *** A False or No Log Book violation 45% *** 42% *** 56% *** A Disqualified Driver violation 44% *** ns 51% *** Any conviction 43% *** 65% *** 56% *** A Speeding More Than 15 Miles over Speed Limit conviction 40% *** 67% *** 56% ***
Any Moving violation 35% *** 29% *** 41% *** A Failure to Obey Traffic Control Device violation 30% *** 21% *** 30% *** Any OOS violation 29% *** 26% *** 16% *** A Size and Weight violation 20% *** 18% *** 21% *** A Failure to Keep in Proper Lane conviction 83% ** ns 91% *** A Following too Closely conviction 46% ** 36% * 50% *** A Failure to Use / Improper Signal conviction 82% ** 96% ** ns A Speeding 1 to 15 Miles over Speed Limit conviction 38% ** 40% ** 26% **
A Reckless Driving violation 114% ** ns 325% *** A Failure to Obey Traffic Sign conviction 25% ** 68% *** 24% * An Improper Pass conviction 70% * ns ns An Improper Turn conviction 49% * 84% ** 94% *** A Failure to Obey Traffic Signal / Light conviction 20% * 56% *** 29% * A Driving Too Fast for Conditions conviction 25% * 56% *** 62% *** A Reckless Driving conviction - Serious ns ns ns A Following Too Close violation ns 41% *** 40% *** A Failure to Yield Right of Way conviction ns ns 97% *** A Failure to Obey Warning Light / Flasher conviction
ns ns ns
An Improper Turns violation ns ns 105% *** An Improper Passing violation ns 88% ** ns A Medical Certificate violation ns ns 18% *** A Failure to Obey Yield Sign conviction ns ns ns
*Significant at p< .05 **Significant at p< .01 ***Significant at p< .001 ns = non-significant

Predicting Truck Crash Involvement - 2018 56
APPENDIX D: ENFORCEMENT ANALYSIS
State Number of Inspections Percent
Number of Traffic
Enforcement Inspections
Percent Number
of Crashes
Percent Difference
IN* 69,356 2.11% 31,023 8.31% 4,833 3.45% -4.86% NM* 72,392 2.21% 13,800 3.70% 725 0.52% -3.18% WA* 87,940 2.68% 14,058 3.77% 1,624 1.16% -2.61% CA* 519,412 15.83% 37,318 9.99% 10,755 7.68% -2.32% MD* 108,838 3.32% 12,967 3.47% 2,083 1.49% -1.99% IA* 56,002 1.71% 9,795 2.62% 1,794 1.28% -1.34% NV* 33,360 1.02% 5,105 1.37% 360 0.26% -1.11% AZ* 88,611 2.70% 9,985 2.67% 2,353 1.68% -0.99% KY* 73,005 2.22% 11,118 2.98% 2,802 2.00% -0.98% IL 99,158 3.02% 21,673 5.80% 7,080 5.05% -0.75% CT 19,127 0.58% 4,614 1.24% 680 0.49% -0.75% MI* 49,755 1.52% 14,540 3.89% 4,659 3.33% -0.57% ID 11,093 0.34% 3,795 1.02% 652 0.47% -0.55% MA 13,457 0.41% 5,969 1.60% 1,545 1.10% -0.50% NE 28,062 0.86% 4,403 1.18% 1,041 0.74% -0.44% SD 28,617 0.87% 2,074 0.56% 344 0.25% -0.31% NH 11,785 0.36% 1,762 0.47% 367 0.26% -0.21% RI 3,432 0.10% 1,070 0.29% 178 0.13% -0.16% NY 96,804 2.95% 12,780 3.42% 4,583 3.27% -0.15% TN 71,558 2.18% 8,929 2.39% 3,142 2.24% -0.15% VT 5,641 0.17% 1,138 0.30% 258 0.18% -0.12% SC 47,524 1.45% 7,039 1.89% 2,584 1.84% -0.04% PA 109,647 3.34% 16,349 4.38% 6,106 4.36% -0.02% AK 6,191 0.19% 246 0.07% 92 0.07% 0.00% UT 33,729 1.03% 3,026 0.81% 1,138 0.81% 0.00% DE 6,222 0.19% 1,283 0.34% 485 0.35% 0.00% MT 41,125 1.25% 1,635 0.44% 621 0.44% 0.01% HI 2,448 0.07% 190 0.05% 87 0.06% 0.01% LA 53,742 1.64% 9,099 2.44% 3,430 2.45% 0.01% WY 17,125 0.52% 2,374 0.64% 959 0.68% 0.05% WV 19,867 0.61% 2,357 0.63% 970 0.69% 0.06% CO 44,746 1.36% 4,620 1.24% 1,966 1.40% 0.17% KS 54,918 1.67% 3,601 0.96% 1,600 1.14% 0.18% ND 12,199 0.37% 1,346 0.36% 854 0.61% 0.25% AR 36,335 1.11% 4,876 1.31% 2,209 1.58% 0.27% ME 16,822 0.51% 902 0.24% 743 0.53% 0.29% WI 27,614 0.84% 4,932 1.32% 2,370 1.69% 0.37% FL 121,557 3.70% 14,293 3.83% 5,960 4.25% 0.43% OR 52,050 1.59% 2,319 0.62% 1,469 1.05% 0.43% OK 27,620 0.84% 6,815 1.83% 3,200 2.28% 0.46%
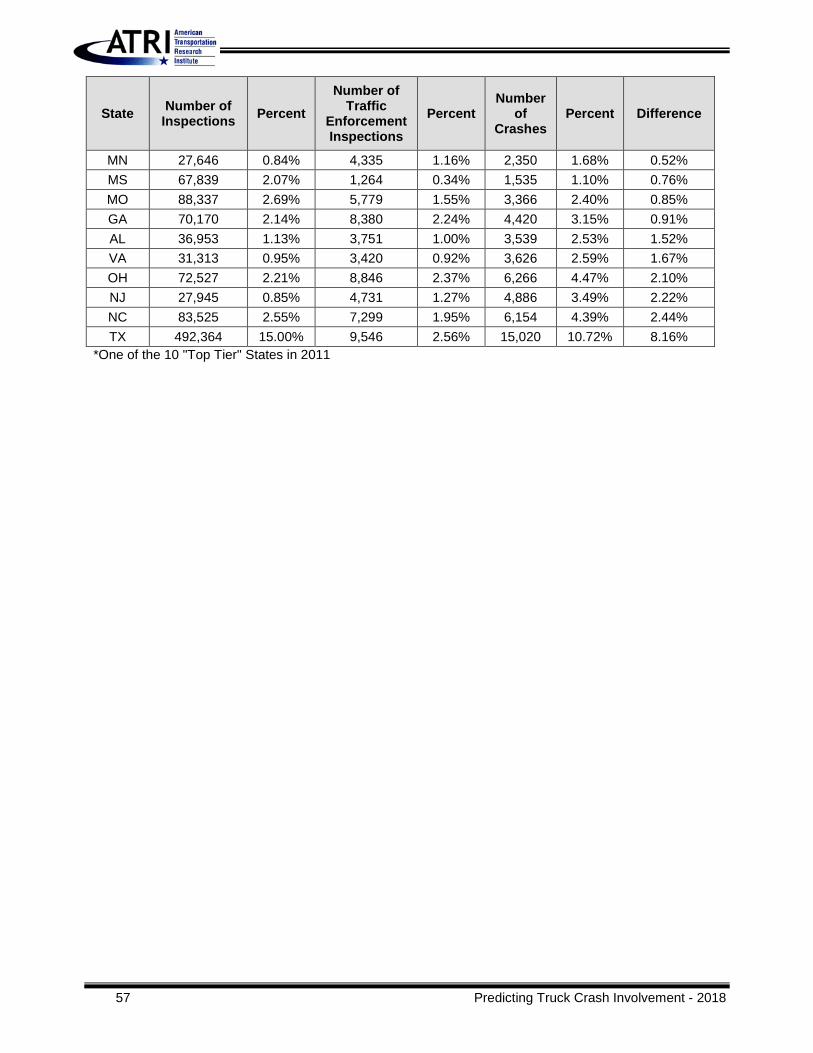
57 Predicting Truck Crash Involvement - 2018
State Number of Inspections Percent
Number of Traffic
Enforcement Inspections
Percent Number
of Crashes
Percent Difference
MN 27,646 0.84% 4,335 1.16% 2,350 1.68% 0.52% MS 67,839 2.07% 1,264 0.34% 1,535 1.10% 0.76% MO 88,337 2.69% 5,779 1.55% 3,366 2.40% 0.85% GA 70,170 2.14% 8,380 2.24% 4,420 3.15% 0.91% AL 36,953 1.13% 3,751 1.00% 3,539 2.53% 1.52% VA 31,313 0.95% 3,420 0.92% 3,626 2.59% 1.67% OH 72,527 2.21% 8,846 2.37% 6,266 4.47% 2.10% NJ 27,945 0.85% 4,731 1.27% 4,886 3.49% 2.22% NC 83,525 2.55% 7,299 1.95% 6,154 4.39% 2.44% TX 492,364 15.00% 9,546 2.56% 15,020 10.72% 8.16%
*One of the 10 "Top Tier" States in 2011

July 2018
Predicting Truck Crash Involvement: 2018 Update