prediction of cast-in-place concrete strength of the
TRANSCRIPT

Construction and Building Materials 254 (2020) 119224
Contents lists available at ScienceDirect
Construction and Building Materials
journal homepage: www.elsevier .com/locate /conbui ldmat
Prediction of cast-in-place concrete strength of the extradosed bridgedeck based on temperature monitoring and numerical simulations
https://doi.org/10.1016/j.conbuildmat.2020.1192240950-0618/� 2020 The Authors. Published by Elsevier Ltd.This is an open access article under the CC BY-NC-ND license (http://creativecommons.org/licenses/by-nc-nd/4.0/).
⇑ Corresponding author.E-mail address: [email protected] (A. Kuryłowicz-
Cudowska).
Aleksandra Kuryłowicz-Cudowska ⇑, Krzysztof Wilde, Jacek ChróscielewskiDepartment of Mechanics of Materials and Structures, Faculty of Civil and Environmental Engineering, Gdansk University of Technology, Narutowicza 11/12, 80-233 Gdansk, Poland
h i g h l i g h t s
� Augmented maturity method using FEM-based numerical tests in addition to the usual laboratory and field experimental methodology.� Recommendations for an effective laboratory research program and a reliable temperature measurement system.� FEM analysis of compressive strength distribution in the concrete deck of extradosed bridge.� The complex system of concrete monitoring improves the confidence of decisions on prestressing tendons or formwork removal and provides economicbenefit.
a r t i c l e i n f o
Article history:Received 19 April 2019Received in revised form 10 April 2020Accepted 15 April 2020
Keywords:Cast-in-place concreteTemperature of concreteEarly-age compressive strengthAugmented maturity methodNumerical simulationsExtradosed bridge
a b s t r a c t
The work is devoted to the implementation of a monitoring system for high performance concreteembedded in the span of an extradosed bridge deck using a modified maturity method augmented bynumerical simulations conducted by the authors’ FEM code. The paper presents all research stages ofbridge construction and considers the conclusions drawn from the results of laboratory tests, field mea-surements, and numerical calculations. The monitored structure is the largest extradosed bridge inEurope in terms of the span’s length. Due to the considerable size and duration of the investment, itwas beneficial to use an alternative method for estimating the compressive strength of concrete basedon the maturity function. The bridge sections were investigated in three stages: in summer, autumn,and early spring (in June, September, and March). The monitoring of in-place concrete provided informa-tion on the actual temperature of the concrete and its gradients. Based on recorded temperatures andproposed numerical procedures, the actual strength of the cast-in-place concrete and the optimal datesof prestressing were determined. This contributed to shortening the work cycle and speeding up the workschedule.� 2020 The Authors. Published by Elsevier Ltd. This is an open access articleunder the CCBY-NC-ND license
(http://creativecommons.org/licenses/by-nc-nd/4.0/).
1. Introduction
Currently, the development of technical infrastructure is largelybased on cement and concrete composites. Research studies arefocused on improving the parameters of building materials andstrive to reduce construction costs. The primary motivation toanalyse the assessment of concrete compressive strength on thebasis of temperature was the interest of contractors of concretestructures in increasing the certainty, quality, and optimizationof building works. Newly constructed bridges are primarily madeof concrete. In addition, the number of structures built of pre-stressed concrete is increasing compared to those of reinforced
concrete. In Poland, the ratio was 25.3–60.4% in 2007, respectively,and 41.0–44.2% in 2016. For prestressed structures, the time atwhich the concrete reaches the required compressive strength isthe most important factor, not only for bridges but also for residen-tial buildings. That allows for the start of the post-tension tendons.Because concrete works are being performed during extremeweather conditions, information on the cast-in-place concretestrength is crucial.
The thermal influences in young concrete are studied by manyscientific teams [1–4]. The researchers consider maturity methodfor various types of concrete. Velay-Lizancos et al. [5] examinedthe influence of fine and coarse recycled aggregates on the accu-racy of the maturity method. The authors found that a uniquecurve for vibrated and self-compacting concrete can be used inde-pendent of the percentage of recycled aggregate. Ji Jin et al. [6]investigated the prediction of the compressive strength of
2 A. Kuryłowicz-Cudowska et al. / Construction and Building Materials 254 (2020) 119224
Do
wnl
oad
ed f
rom
mo
stw
ied
zy.p
l
early-age epoxy resin concrete and concluded that the maturitymethod is a non-destructive test useful for cast-in-place applica-tions. Zhang et al. [7] presented a maturity concept supported bynew experimental evidence for predicting the development ofthe mechanical properties of high-performance concrete over time.
In the early stages of the construction process, the monitoringof concrete hardening is a practical source of knowledge aboutthe advancement of the cement hydration. The present study isfocused on predicting the compressive strength of early age con-crete, in real time. On the building site, temperature changes inthe hardening concrete are relatively easy to measure. Currently,measuring the concrete temperature not only provides informationabout the occurrence of significant temperature gradients, but alsoenables the estimation of the in-place compressive strength of con-crete. The measurement techniques allow the tracking of concretetemperature changes in the structure and transfer the obtaineddata to research teams. The usage of a wide range of additives,admixtures, aggregates [8–13], and various types of cement makeseach concrete different, and thus the monitoring of the concretestructure becomes an individual task. The measurement moduleof concrete temperature can be also a part of the structural healthmonitoring system, e.g., [14,15].
In Poland, the assessment of concrete strength is carried out onsamples taken from each batch of concrete, i.e., every 50 m3 forbridge structures. During the construction of the subject bridge,approximately 330 batches of concrete were made, and 3300 con-crete samples were collected and tested. This generates a lot ofwork including the necessity of recycling the large number of con-crete specimens.
This paper proposes extensions and modifications of the appli-cable research procedures within the maturity method accordingto ASTM C1074 [16] and its development in the form of supple-mentation with a numerical program to determine the actualstrength of concrete over time and volume of the monitored struc-ture or structural segment. The authors’ finite element methodcode was implemented in the construction process of the extra-dosed bridge built in Ostróda, in northern Poland. The applicationof the proposed technology made it possible to determine the post-tension dates for every segment of the bridge deck.
2. Augmented maturity method – procedure with numericalsimulations
The cast-in-place compressive strength of concrete can bedetermined using two groups of methods. The first one, conven-tional and widely used, is expressed as the strength of standardspecimens taken from mixtures delivered to the construction site.
Fig. 1. Overview of the laborator
These samples are cured in laboratory conditions (at a temperatureof 20 ± 2 �C and relative humidity � 95% [17]) and tested at spec-ified time intervals. The disadvantage of this approach is therequired inference about the concrete strength of the structurebased on the test results of samples curing under completely dif-ferent conditions than the concrete in a real structure.
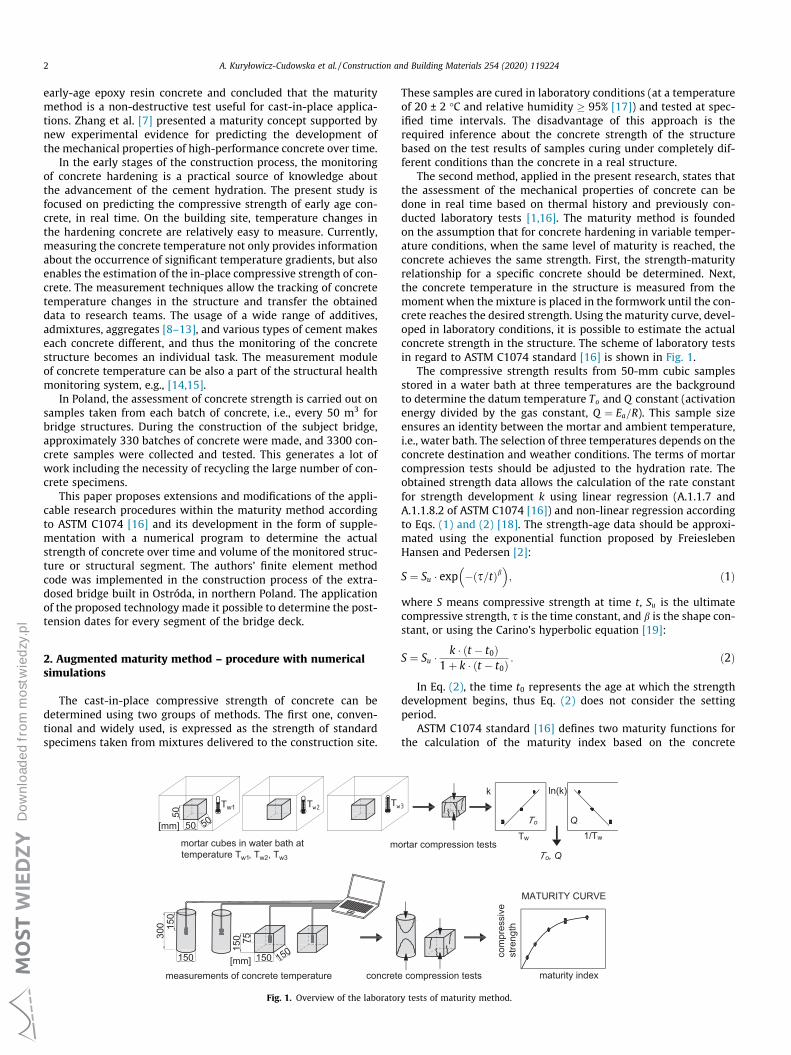
The second method, applied in the present research, states thatthe assessment of the mechanical properties of concrete can bedone in real time based on thermal history and previously con-ducted laboratory tests [1,16]. The maturity method is foundedon the assumption that for concrete hardening in variable temper-ature conditions, when the same level of maturity is reached, theconcrete achieves the same strength. First, the strength-maturityrelationship for a specific concrete should be determined. Next,the concrete temperature in the structure is measured from themoment when the mixture is placed in the formwork until the con-crete reaches the desired strength. Using the maturity curve, devel-oped in laboratory conditions, it is possible to estimate the actualconcrete strength in the structure. The scheme of laboratory testsin regard to ASTM C1074 standard [16] is shown in Fig. 1.
The compressive strength results from 50-mm cubic samplesstored in a water bath at three temperatures are the backgroundto determine the datum temperature To and Q constant (activationenergy divided by the gas constant, Q ¼ Ea=R). This sample sizeensures an identity between the mortar and ambient temperature,i.e., water bath. The selection of three temperatures depends on theconcrete destination and weather conditions. The terms of mortarcompression tests should be adjusted to the hydration rate. Theobtained strength data allows the calculation of the rate constantfor strength development k using linear regression (A.1.1.7 andA.1.1.8.2 of ASTM C1074 [16]) and non-linear regression accordingto Eqs. (1) and (2) [18]. The strength-age data should be approxi-mated using the exponential function proposed by FreieslebenHansen and Pedersen [2]:
S ¼ Su � exp � s=tð Þb� �
; ð1Þ
where S means compressive strength at time t, Su is the ultimatecompressive strength, s is the time constant, and b is the shape con-stant, or using the Carino’s hyperbolic equation [19]:
S ¼ Su � k � ðt � t0Þ1þ k � ðt � t0Þ : ð2Þ
In Eq. (2), the time t0 represents the age at which the strengthdevelopment begins, thus Eq. (2) does not consider the settingperiod.
ASTM C1074 standard [16] defines two maturity functions forthe calculation of the maturity index based on the concrete
y tests of maturity method.

A. Kuryłowicz-Cudowska et al. / Construction and Building Materials 254 (2020) 119224 3
Do
wnl
oad
ed f
rom
mo
stw
ied
zy.p
l
temperature history. One of them, using an Arrhenius type law, isexpressed by the equivalent age te of concrete:
te ¼X
e� Q 1T � 1
Trð ÞDt; ð3Þ
where Tr means the reference temperature. In contrast to thetemperature-time factor M, Eq. (3) uses a non-linear relationshipbetween the initial strength rate and the curing temperature.
The next step is focused on compression tests of the concretesamples. The ASTM C1074 standard [16] suggests moulding 15cylindrical samples: 2 are intended for temperature measurementsand the others for destructive tests performed on 5 specified dates(1, 3, 7, 14, and 28 days). The procedures described above are thebasic way to implement the maturity method in a constructionsite.
The proposed comprehensive method to estimate the concretestrength of a bridge deck considers modified assumptions of thematurity method and numerical calculations within the finite ele-ment method. The novel element of this paper is a complex solu-tion for in-place concrete strength estimation, includinglaboratory, field, and numerical tests. The concept of the researchalgorithm is illustrated in Fig. 2. The suggested procedure has beenapplied during the construction of the extradosed bridge, and theconclusions gained from this work have been included in the pro-posed method.
Fig. 2. The research algorithm.
The first remarks relate to the laboratory studies. To simplifythe tests on mortar samples, compression tests should be per-formed in the constant time interval appropriate to the rate ofstrength increase. The determination of k-constants using the lin-ear regression proposed in A1.1.7 and A.1.1.8.2 [16] is an incorrectsolution, because the character of the strength gain at an early ageis strongly nonlinear. After analysing linear and nonlinear proce-dures for the extradosed bridge data, it was determined that thebest results are provided by the nonlinear regression of thestrength-age data using the exponential function proposed byFreiesleben Hansen and Pedersen [2,20]. Due to the wide rangeof admixtures and additives used in the currently designed mix-ture, the determination of k and then the Q value by the empiricalmethod is more advantageous than adopting the activation energybased on the literature data, in which the cement type is the onlyfactor. In addition, k-constants computed on the basis of mortarsamples combine the dependence not only on temperature but alsoon strength. Studies performed on mortar cubes allow the defini-tion of the maturity function for a concrete under consideration.The conducted analysis indicated that calculations of the maturityindex expressed in the form of the equivalent age te are moreappropriate. In comparison to the temperature time factor M, thestudies conducted by authors and the other researchers [21,22]have shown that Eq. (3) better describes the effect of higher con-crete temperatures in the early age and largely eliminates discrep-ancies between the strength–maturity relationship for variousearly hardening temperatures.
ASTM C1074 [16] recommends drawing the maturity curvebased on cylindrical samples, but also permits tests on concretecubes. The conducted research indicates that the cubic specimensprovide more repeatable results of compressive strength, and theiravailability on Polish construction sites is definitely larger. Due tothe fact that concrete is a heterogeneous material and taking intoaccount the authors’ experience as well as European standards[23], the minimum number of cubic samples to be tested is equalto 17 (5�3 + 2), and the concrete compression test dates shouldbe adapted to each case individually. It is also proposed to intro-duce additional data laboratory tests at the age of 56 days. Theknowledge of the later-age strength of concrete (the ultimatestrength) will increase the accuracy of the maturity curveapproximation.
To describe the concrete strength–maturity relationship, suit-able solutions are the hyperbolic curve proposed by Carino [19],the exponential curve of Freiesleben Hansen and Pedersen [2], aswell as Chin’s hyperbolic function [24]. Another function that prop-erly describes the strength development of concrete versus thematurity index can also be used, for example, the power functionapplied in the case of the investigated high performance concrete.The comparison of mentioned functions is demonstrated in a paper[20]. The least suitable and not recommended is Plowman’s loga-rithm equation [25]. Carino [1] noted that it does not provideproper results in terms of the low and high values of the maturityindex (at early and late stages). Galobardes et al. [26] examined thematurity method for the application of sprayed concrete. Theauthors concluded that due to the influence of the accelerator inthe hydration kinetics of cement, Plowman’s formulation providesa poor correlation between the maturity index and the compres-sive strength. The above remarks constitute a set of our own andother authors’ experiences that will be used to develop the bestindividual maturity curve for a specific concrete.
Due to the fact that the in situ concrete temperature measure-ments are limited to the selected few points, the most importantaspect is getting to know the temperature distribution in the wholevolume of the embedded concrete using Finite Element Method(FEM) modelling. In the next part of the paper, the thermo-chemical modelling and finite element procedure is described.

4 A. Kuryłowicz-Cudowska et al. / Construction and Building Materials 254 (2020) 119224
Do
wnl
oad
ed f
rom
mo
stw
ied
zy.p
l
Our own method to identify model parameters, based on temper-ature registration in cubic samples curing in semi-adiabatic andisothermal conditions, has been adopted [27]. Considering bound-ary conditions, the convective heat transfer coefficients weredetermined experimentally with the use of atmospheric conditiondata. A forecast of the temperature field in concrete before startingconstruction provides the potential of using proper curing tech-niques or allows the eventual modification of the designed mix-ture. The complex approach including heat transport modellingand the improved maturity method favourably affects the predic-tion of the compressive strength distribution, which opens newpossibilities of planning the working cycles, especially for therepeated sections of structure (e.g., sections of bridge span).
The presented work focuses on the real construction process ofa large and relatively complex bridge structure that is dynamic andprone to unexpected changes. Thus, the integration and coopera-tion between the chief engineer and the scientific team workingat the construction site and laboratory is very important and isthe key factor to the success or failure of the proposed maturitymethod application.
2.1. Thermo-chemical aspect of concrete hydration
The process of concrete hardening is related to the change ofphase composition of the medium [28]. A thermodynamic analysisallows for the determination of the amount of heat exchanged bythe cement medium passing through one equilibrium state toanother and for the control of the rate of those changes. As a resultof heat conduction, a temperature field appears in every area of theconcrete body. The energy balance in relation to the First Law ofThermodynamics may be stated:
_Ein þ _Eg � _Eout ¼ _Est; ð4Þwhere Ein is the input energy, Eg is the energy generated due tocement hydration, Eout is the output energy, and Est is the energystored within the representative elementary volume [29]. The inter-nal heat source associated with the hydration reaction causes a spa-tial temperature field variation. In the macroscopic approach, wecan assume that concrete is an isotropic and homogeneous mate-rial, thus the thermal conductivity k is spatially constant. Finally,the partial differential equation of a parabolic type is obtained:
r � krTð Þ þ qc ¼ qc _T: ð5ÞThe heat conduction Eq. (5) can be expressed as a function of
the derivate of concrete temperature in regard to time _T , volumet-ric heat generation rate qc , specific mass q, and specific heat of thematerial c.
Based on the fact that the model describes the temperature evo-lution from the moment the concrete is mixed, the initial conditioncan be expressed by the initial temperature of the concrete mix-ture, T0. The energy balance equation between the concrete surfaceand the environment (air movement or insulation layer) can beexpressed by Newton’s (convection) [3] or Stefan-Boltzmann’s (ra-diation) condition. The heat flux at the concrete surface must beabsorbed by the surrounding air. Irrespective of the driving forcefor air movement, the heat flow from the element surface can bewritten using Newton’s law:
q0 ¼ a ðTsurf � TenvÞ; ð6Þwhere a is the heat transfer coefficient, and Tenv and Tsurf are theambient and concrete surface temperatures, respectively.
The numerical simulation intended to supplement the maturitymethod should be based only on the temperature measurements atthe few selected locations within the structure. The calculationsmust be as simple as possible because the numerical results must
be available in real time, i.e., immediately on request by the con-struction manager. Therefore, the authors stated that a coupledmodel such as Di Luzio–Cusatis’s [30] approach (thermo-chemo-hygro-mechanical model with two reactions expressed by thedegree of hydration and the silica reaction) would be too complexfor in situ applications. Finally, formulations developed by Cerveraet al. [31] have been adopted. This model simplifies the heat trans-port equation by omitting the heat movement of migrating mois-ture, and it assumes that the heat transport is carried out onlythrough conduction. According to many authors, the influence ofmoisture diffusion on heat transfer in concrete is not significant[32,33].
Cervera’s model consists of two coupled equations: the thermalequilibrium (7) and the chemical kinetics equation expressed as afunction of the evolution of the hydration degree (8):
r � krT þ Q n_n ¼ qc _T; ð7Þ
_n ¼ A�ðnÞ exp � Ea
R T
� �: ð8Þ
The following parameters: q, c, k, material constant Q n (heat ofcement hydration in concrete), activation energy Ea, and gas con-stant R, are responsible for the heat transfer phenomenon. In thismodel, a normalised internal variable, i.e., the hydration degree nthat concerns the advancement of the hydration reaction, wasintroduced [34]. The rate of the internal heat source expressed inEq. (5) is described by the formula: qc ¼ Q n
_n. Due to the thermallyactivated nature of cement hydration, a strong dependence n ontemperature T is observed. The function of hydration progress
A�ðnÞ is expressed as the product of the chemical affinity and per-
meability, thus, the rate of hydration is finally expressed by theformula:
_n ¼ jn0
A0
j1
nmaxþ n
� �ðnmax � nÞ exp �n
� nnmax
� �|fflfflfflfflfflfflfflfflfflfflfflfflfflfflfflfflfflfflfflfflfflfflfflfflfflfflfflfflfflfflfflfflfflfflfflfflfflfflfflfflfflfflfflffl{zfflfflfflfflfflfflfflfflfflfflfflfflfflfflfflfflfflfflfflfflfflfflfflfflfflfflfflfflfflfflfflfflfflfflfflfflfflfflfflfflfflfflfflffl}
A�ðnÞ¼A� g ðnormalised chemical affinityÞ
exp � Ea
R T
� �|fflfflfflfflfflfflfflfflffl{zfflfflfflfflfflfflfflfflffl}ðArrhenius typ lawÞ
ð9Þ
Normalised chemical affinity A�ðnÞ is directly measurable during
an adiabatic calorimetric test. The three parameters j=n0, A0=j,and n
�are adjusted through a regression analysis by fitting the
function A�ðnÞ to the results of the calorimetric experiment [31].
2.2. Finite element procedure for nonlinear thermal problem
The adoption of the mathematical description of hardening con-crete allows for relatively quick simulations of selected thermo-mechanical properties of the concrete, provided that the boundaryconditions are correctly described. The structure of the proposedprogram for the numerical solution of the initial-boundary valueproblem by means of the Finite Element Method (FEM) is describedbelow.
The heat balance is expressed by the transient Fourier equationfor heat conduction with internal sources:
r � krTð Þ þ qc � qc _T ¼ 0 on structural body B ð10Þwhere q and c are constants, k is the constitutive diagonal tensorcontaining kx, ky, and kz (constant), qc ¼ Q n
_nmeans the internal rateof energy production by hydration, and rT ¼ @T
@x ex þ @T@y ey þ @T
@z ez,
(Fig. 3).The boundary conditions of the analysed concrete structures
may be limited only to Dirichlet:
Tðx; y; z; tÞ ¼ T�@BT ðx; y; z; tÞ for t > 0 on @BT ð11Þ

Fig. 3. The structural body.
A. Kuryłowicz-Cudowska et al. / Construction and Building Materials 254 (2020) 119224 5
Do
wnl
oad
ed f
rom
mo
stw
ied
zy.p
l
and convective (Newman):
�krTð Þ � n ¼ a T � Tenvð Þ ¼ q0 for t > 0 on @Bq ð12Þ
boundary conditions, where T�@BT is the prescribed temperature on
boundary @BT , Tenv is the environmental temperature, a is the heattransfer coefficient, q0 is the heat flux on boundary @Bq, �krT ¼ qis the heat flux, and n is the unit vector pointing out of the struc-tural body (Fig. 3). In addition, it is assumed that the initial condi-tions are defined in the form:
Tðx; y; z; t ¼ 0Þ ¼ T0ðx; y; zÞ onB ð13ÞIn this study, a two dimensional Lagrange family n-node
(n ¼ 4;9;16) solid element is adopted. For the spatial discretizationof the thermal problem, standard isoparametric finite elements areemployed [35]:
xðfÞ ¼ NðeÞðfÞxe; yðfÞ ¼ NðeÞðfÞye; Tðf; tÞ ¼ NðeÞðfÞ TðeÞðtÞ ð14ÞIn the above equation, N denotes the interpolation matrix,
f ¼ ðf1; f2Þ 2 ½�1;þ1� � ½�1;þ1� R2 parent coordinates, TðeÞðtÞ
designates the nodal temperatures, and xe, ye are the nodal coordi-nates for a given finite element with volume BðeÞ and edge @BðeÞ. Theweak form for the thermal equations (accounting for the Newmanand trivially fulfilling the Dirichlet conditions) becomes:ZBðeÞ
rNTðeÞkrTdB�
ZBðeÞ
NTðeÞQ n
_ndBþZBðeÞ
NTðeÞqc _TdB
þZ
@Bq \@BðeÞ
NTðeÞaTðeÞdð@BÞ �
Z@Bq\@BðeÞ
NTðeÞaTenvdð@BÞ ¼ 0 ð15Þ
After spatial discretization, the resulting finite element equa-tions on BðeÞ [ @BðeÞ ) B [ @B are:
MðeÞ _TðeÞ þ KMðeÞ þ KLðeÞ� �
TðeÞ ¼ fqcðeÞ þ fTenv ðeÞ
) M _TðtÞ þ KTðtÞ ¼ fðtÞ ð16Þ
KMðeÞ ¼ZBðeÞ
rNTðeÞkrNðeÞ dB;KLðeÞ ¼
Z@Bq \ @BðeÞ
NTðeÞaNðeÞdð@BÞ; ð17Þ
MðeÞ ¼ZBðeÞ
NðeÞTqcNðeÞdB; ð18Þ
fqcðeÞ ¼ZBðeÞ
NTðeÞ qc dB¼
ZBðeÞ
NTðeÞQ n
_ndB; fTenv ðeÞ ¼Z
@Bq \ @BðeÞ
aTenvNTðeÞdð@BÞ
ð19Þwhere K ¼ A
nðeÞe¼1 KMðeÞ þ KLðeÞ
� �is the conductivity matrix, M ¼
AnðeÞe¼1 MðeÞ is the capacity matrix, f ¼ fqc þ fTenv ¼ A
nðeÞe¼1 fqcðeÞ
n oþ
AnðeÞe¼1 fTenvðeÞ
n oequals the load vector, ne is the number of finite
elements, and AnðeÞe¼1 is the standard assembling operator. This equi-
librium equation is ready for the time approximation.For the transient response, Eq. (16) should be integrated with
respect to time. Thermal problems with nonlinearities, due to thedependency of the hydration rate on the temperature, expressedin an Arrhenius-type law (9) and variable boundary conditions,require incrementally-iterative techniques. In this study, thebackward-Euler integration scheme for tnþ1 (20) in two-level iter-
ative procedure is adapted (at a structural level for TðIÞnþ1 (21) and
at a local level for nðiÞnþ1 (22)). The solution of the concrete temper-ature field as a function of time consists of the followingapproximation:
_Tnþ1 ¼ Tnþ1 � Tn
Dt; _nnþ1 ¼ nnþ1 � nn
Dt; ð20Þ
1Dt
Mþ K� �
TðIÞnþ1 ¼ fðIÞnþ1 þ
1Dt
MTn; fðIÞnþ1 ¼ fTenv nþ1 þ fðIÞqc nþ1 ð21Þ
1Dt
nðiÞnþ1 � nn� �
� kn0
� A0
k � n1þ nðiÞnþ1
� �� ðn1 � nðiÞnþ1Þ
� e�n�
nðiÞnþ1n1
� �� e
� Ea
R � TðIÞnþ1
� �¼ 0: ð22Þ
where Dt ¼ tnþ1 � tn is the time-step.The implementation of the Newton-Raphson method allows
for the solution of Eq. (22) and the extraction of the hydration
degree nðiÞnþ1 related to the local temperature T ðIÞnþ1, which is
achieved using a standard interpolation over the nodal con-
crete temperatures TðIÞnþ1. This nodal temperature TðIÞ
nþ1 is assuredby an ‘outer’ Newton-Raphson algorithm stated at the struc-
tural level by Eq. (21). The hydration rate _nðiÞnþ1 is calculated
from Eq. (22) _nðiÞnþ1 ¼ 1
Dt ðnðiÞnþ1 � nnÞ after solving Eq. (22) for
nðiÞnþ1. Eq. (20), according to Eq. (19) fðIÞqcðeÞ nþ1 ¼ RBðeÞ
NTðeÞQ n
_nðiÞnþ1 dB
supplies a new trial vector for fðIÞqc nþ1, and as a result improves
the solution for TðIÞnþ1 by Eq. (21), [31]. The time-step using the
numerical integration of the hydration degree should be lowerthan the one assumed for the structural problem, because thehydration rate _n is mostly greater than _T. An interpolation isneeded to determine the sub-incremental values of the tem-perature at the integration point within time-steps (Eq. (22)),[31]. In this paper, a linear interpolation between Tn and
TðIÞnþ1 was adopted.
3. The extradosed bridge located in Ostróda
The considered structure is a 4-span road bridge (Fig. 4). Thetotal length of the deck equals 677.0 m (2 � 132.5 m + 2 � 206.0m). The structure was built using a cantilever-forming traveller.The main spans are 206 m long, and they are divided into 52 seg-ments. This bridge is one of the largest extradosed bridges in theworld and the longest extradosed structure in Europe in terms ofthe span length. The superstructure of the bridge is typical andhas the form of a three-chambered box with a total width of28.4 m (Fig. 5) made of high performance concrete, C 60/75 class.The deck height changes from 4 m in the spans to 6 m in the sup-port zones.
A volume of 34809 m3 of concrete was used for the constructionof the bridge, including 1275 m3 of non-structural concrete class C12/15–C 20/25 and 33534 m3 of structure concrete C 25/30–C60/75, and 19646 m3 of C 60/75 concrete was used for the con-struction of a span. The construction process lasted from June

Fig. 4. View of the bridge with monitored zones.
Fig. 5. Cross section number 3.18.
Table 1Overview of mix proportions.
Component (kg/m3)
CEM I 52.5N SR3/NA 440Water 143Sand 0/2 632Basalts 2/8 498Basalts 8/16 785Plasticisers 8.49
6 A. Kuryłowicz-Cudowska et al. / Construction and Building Materials 254 (2020) 119224
Do
wnl
oad
ed f
rom
mo
stw
ied
zy.p
l
2015 to December 2017, when the bridge passed the loading tests[36].
The technological project of the bridge construction divided thedeck into assembly sections:
nos. 1–2 – start sections over the support, 15.2 m long, variableheight;nos. 3–6 – overhanging sections, 3.6 m long, variable height;nos. 7–10 – overhanging sections, 4.0 m long, variable height;nos. 11–26 – overhanging sections, 4.0 m long, fixed height;closer segment – 2 m long.
The monitoring of the concrete hardening was implementedfor three sections (4.1–2, 4.4, and 3.18) built in a differentway. The concreting of the starting section (no. 4.1–2) locatedabove the P4 support was divided into four stages: the bottomplate, webs and support transverse beam, the top plate betweenthe outer webs, and the top plate – the external cantilever ofthe plate. The value of 60% of the characteristic strength ofthe built-in concrete constituted the minimum value for pre-stressing the structure in the following order: transverse post-tension of the top plate, transverse post-tension of the bottomplate, and longitudinal post-tension of the starting section. Forthe case of the overhanging section no. 4.4, casting operationsincluded two stages: the bottom plate and webs and then thetop plate. For the span section, not hung, with a fixed construc-tion height (no. 3.18), concreting with the entire cross-sectionwas carried out.
The formwork of the bridge deck consisted of 3-SO plywood andH20N beams spaced at approximately 30 cm. For the overhangingsegments, the shuttering on the outer circuit was insulated withStyrofoam FS-15, 10 cm thick.
The original project approach was to prestress each section ofthe deck after 3 days of concrete placement. To shorten this time,the contractor together with technologists imposed the design ofC 60/75 high performance concrete to be able to prestress thestructure after 48 h. The compressive strength of the designed con-crete was supposed to rise by 1 MPa/h.
4. Implementation of research procedures at the bridgeconstruction site
4.1. Laboratory tests
Laboratory tests were carried out on three sets of 50-mm mor-tar cubes (a total of 54 specimens), 20 cylindrical (150/300 mm),and 26 cubic (150 mm) samples made of concrete according tothe recipe given in Table 1. The scope of research included com-pression tests on mortar and concrete specimens and temperaturemeasurements inside concrete samples. Cement (Table 2), fine andcoarse aggregate as well as additives and admixtures from the con-crete plant indicated by the contractor were taken. The details ofthe considered mortar and concrete samples are described in theauthors’ previous work [20].
4.1.1. Mortar testsThe mortar cubes (18 per set) were cured in a water bath at the
temperatures: Tw1 ¼ 5 C, Tw2 ¼ 24 C, Tw3 ¼ 35 C. Compressiontests for cubes stored at 24 and 35 �C were carried out after 1, 2,3, 5, 7, and 14 days, but the tests were conducted on samples curedat 5 �C after 2, 3, 4, 5, 7, and 14 days due to the lower rate ofstrength gain in low temperatures. The strength-age relationshipsshown in the Fig. 6 were calculated using the exponential Eq. (1),discussed in Section 2, and fit by a least-squares regression tothe data.

Table 2Chemical and physical properties of cement.
Component CEM I 52.5N SR3/NA
SO3 2.6%Cl- 0.07%Na2O 0.5%Al2O3 3.9%C3A 1.8%C3AF + 2C3A 18.9%SiO2 20.8%CaO 66.2%C3S 59.9%C2S 16.4%Density 3.2 g/cm3
Specific surface area 3789 cm2/gLOI 1.1%
Fig. 6. The average compressive strength of mortar cubes: measured data andexponential regression Eq. (1).
A. Kuryłowicz-Cudowska et al. / Construction and Building Materials 254 (2020) 119224 7
Do
wnl
oad
ed f
rom
mo
stw
ied
zy.p
l
The rapid hydration of mortar samples curing at 35 �C is incom-parably higher than that at 5 �C, accepted as the minimum valuefor concrete cast in place (Fig. 6). After two days, the samples curedat 5 �C reached an average strength of 6.89 MPa. On the other hand,after 24 h, the cubes matured at 35 �C achieved 47.28 MPa. After14 days, the highest strength was reached by the specimens storedat 24 �C (close to standard temperature), slightly lower for thosestored at 35 �C, and the lowest for those stored at 5 �C, reaching90.07, 88.73, and 84.07 MPa, respectively.
The constants To and Q were identified based on the relation-ship between the rate constants k for strength development andthe curing temperature with use of linear and nonlinear regressionprocedures. The obtained values are summarised in Table 3. Theresults of the exponential regression were established to be mean-
Table 3Regression analysis [20].
Regression type T (�C) (k1/day)
Linear A.1.1.7 ASTM C1074 5 0.33424 1.05235 1.750
Linear A.1.1.8.2 ASTM C1074 5 0.16224 0.67635 1.050
Hyperbolic, Eq. (2) 5 0.25424 0.74735 1.272
Expotential, Eq. (1) 5 0.27324 0.74935 1.397
ingful because the strength estimated by the equivalent age andthe measured strength were the most similar to each other. Thehydration process slows down rapidly for the datum temperatureequal to �1.0 �C. Considering the activation energy divided bythe gas constant (4620 K), the maturity function of the consideredhigh performance concrete expressed in the form of an equivalentage is determined to be:
te ¼X
e� 4620 1T � 1
273;15þ24ð ÞDt: ð23Þ
4.1.2. Concrete testsCubic specimens (8 � 3 ¼ 24 cubes) were moulded at a concrete
plant and then transported to the university laboratory where twosamples of each type for measuring the concrete temperature wereformed. Compression tests at 1, 2, 3, 5, 7, 14, 21, and 28 days wereperformed. The compliance criteria according to PN–EN 206-1 [23](criterion I: f cm P f ck þ 4 and criterion II: f ci P f ck � 4) were met.After 24 h, the tested concrete samples reached 40% of the 28-day strength.
The temperature evolution of the concrete specimens duringthe first four days (96 h) is shown in Fig. 7a. The initial temperaturefor the concrete was considered to be 22.9 �C. As a result of theexothermic hydration process, the maximum concrete tempera-ture occurred in the 19th hour, and the average maximum temper-ature was equal to 29.2 �C.
The thermal history of the concrete samples, compressivestrength results, and Eq. (23) are a complete data set for the devel-opment of the maturity curve of the concrete C 60/75 class. Theproposed power function adequately fits the data as shown bythe R2 value (Fig. 7b). The other maturity-strength relationshipsdescribed in Section 2 were also considered [20]. The most appro-priate curve, suitable in the entire range, i.e., for low and high val-ues of equivalent age te, was the power equation indicated inFig. 7b.
4.1.3. FEM modelThe implementation of numerical methods enable one-, two-,
and three-dimensional models of the heat conduction equationto be solved [37]. In this work, the calculations of the hardeningconcrete in the bridge deck using a two-dimensional (2D) modelwere made. Forecasting the concrete temperature developmentallowed an estimation of the concrete strength in time, space,and volume of the tested bridge segment.
Numerical simulations of the concrete’s temperature field wereconducted using the authors’ FEM code called MAl_Temp. Geomet-ric parameters for the monitored overhanging section of the bridgewere adopted from technical documentation. The c and k values ofconcrete in agreement with the specific heat and thermal conduc-
To (�C) RTo2 (–) Q (K) RQ
2 (–)
�1.3 0,9792 4766 0.9984
�0.1 0,9961 5452 0.9863
�1.6 0,9711 4606 0.9998
�1.0 0,9431 4620 0.9981

Fig. 7. (a) Temperature evolution of cubic specimens, (b) maturity curve related to cubic strength.
8 A. Kuryłowicz-Cudowska et al. / Construction and Building Materials 254 (2020) 119224
Do
wnl
oad
ed f
rom
mo
stw
ied
zy.p
l
tivity of individual components were calculated according to theformulas proposed by Breugel and Lura [38]. The maximum heatof hydration Qmax was determined based on data from the cementproducer. According to the Mills formula [39], the final hydrationdegree nmax was computed using the water-cement ratio.
To identify the parameters j=n0, n�, A0=j an adiabatic hydration
curve was necessary. Therefore, a novel way to determine theabove model parameters was proposed. First, temperature mea-surements in the concrete cubic samples curing in semi-adiabaticand isothermal conditions were performed. The next step was toformulate relationships for the three mentioned parameters, whichstrongly depend on atmospheric and geometry conditions. Due tothe symmetry of the analysed cross-section, the calculations weremade for half the cross-section. In the symmetry axis, the convec-tive heat transfer coefficient a ¼ 0 was assumed. The boundaryconditions indicated by green, red, and black contour lines wereadopted in accordance with Fig. 8. The heat transfer coefficients
afc for the free surface and a forms for the surface protected by the
formwork were assumed. The average ambient temperature mea-
sured during the 10 days T 10daysenv
� �was taken.
A mesh with nine-node quadrilateral surface elements andthree-node linear elements on the edges was used for space dis-cretization of the section. In terms of the formal use of the finiteelement method, a convergence analysis of the solution was car-ried out. The FEM model was generated using 7370 surface finiteelements, 1380 linear finite elements, and 30,860 nodes. The GIDprogramwas used to generate a mesh of the cross-section and thento postprocess and produce a graphical presentation of the results.
4.2. Monitored sections
Due to the different concrete technologies (start segments onstationary scaffolds, typical segments built up using cantilevertechnology), to the changing cross-section of the bridge box, andto various weather conditions (seasons), the bridge deck was mon-itored in three stages. The first stage included the monitoring of the
Fig. 8. Boundary conditions.
start sections no. 4.1–2, executed in June. The second stage con-cerned the overhang section no. 4.4 with variable height (Septem-ber), and the last stage was the overhang section no. 3.18 with afixed height (March). The localization of the measurement seg-ments is shown in Fig. 4. In Figs. 9–11, the monitored section zonesare presented.
4.3. Novel measurement system
The new temperature measurement system designed and builtfor the field tests is shown in Fig. 12. The device makes it possibleto measure the concrete temperature at 20 points simultaneouslyand works on water-resistant, digital 1-wire sensors, ds18b20type. The temperature sensors can be assembled individually orby using a prefabricated strip with a series of detectors arrangedin accordance with a pre-prepared project. This allows the mini-mization of wiring that is exposed to damage during constructionworks. The device can be powered with a battery for approxi-
Fig. 9. Monitored section no. 4.1–2.
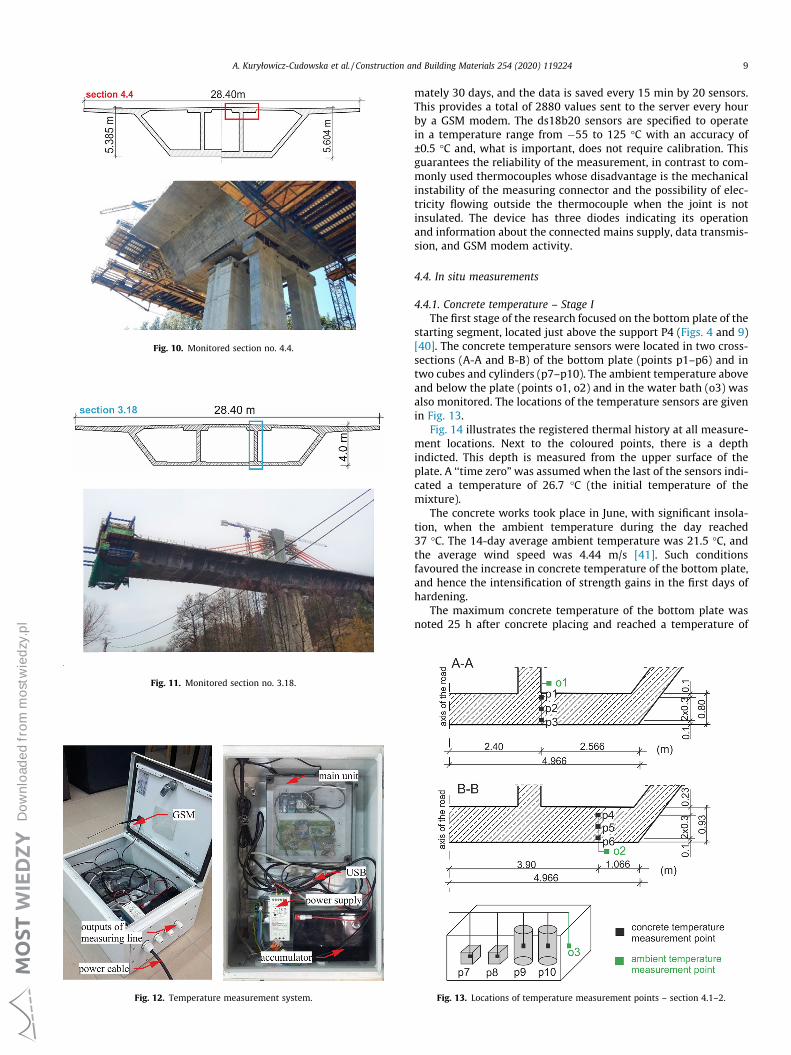
Fig. 10. Monitored section no. 4.4.
Fig. 11. Monitored section no. 3.18.
Fig. 12. Temperature measurement system.
A. Kuryłowicz-Cudowska et al. / Construction and Building Materials 254 (2020) 119224 9
Do
wnl
oad
ed f
rom
mo
stw
ied
zy.p
l
mately 30 days, and the data is saved every 15 min by 20 sensors.This provides a total of 2880 values sent to the server every hourby a GSM modem. The ds18b20 sensors are specified to operatein a temperature range from �55 to 125 �C with an accuracy of±0.5 �C and, what is important, does not require calibration. Thisguarantees the reliability of the measurement, in contrast to com-monly used thermocouples whose disadvantage is the mechanicalinstability of the measuring connector and the possibility of elec-tricity flowing outside the thermocouple when the joint is notinsulated. The device has three diodes indicating its operationand information about the connected mains supply, data transmis-sion, and GSM modem activity.
4.4. In situ measurements
4.4.1. Concrete temperature – Stage IThe first stage of the research focused on the bottom plate of the
starting segment, located just above the support P4 (Figs. 4 and 9)[40]. The concrete temperature sensors were located in two cross-sections (A-A and B-B) of the bottom plate (points p1–p6) and intwo cubes and cylinders (p7–p10). The ambient temperature aboveand below the plate (points o1, o2) and in the water bath (o3) wasalso monitored. The locations of the temperature sensors are givenin Fig. 13.
Fig. 14 illustrates the registered thermal history at all measure-ment locations. Next to the coloured points, there is a depthindicted. This depth is measured from the upper surface of theplate. A ‘‘time zero” was assumed when the last of the sensors indi-cated a temperature of 26.7 �C (the initial temperature of themixture).
The concrete works took place in June, with significant insola-tion, when the ambient temperature during the day reached37 �C. The 14-day average ambient temperature was 21.5 �C, andthe average wind speed was 4.44 m/s [41]. Such conditionsfavoured the increase in concrete temperature of the bottom plate,and hence the intensification of strength gains in the first days ofhardening.
The maximum concrete temperature of the bottom plate wasnoted 25 h after concrete placing and reached a temperature of
Fig. 13. Locations of temperature measurement points – section 4.1–2.
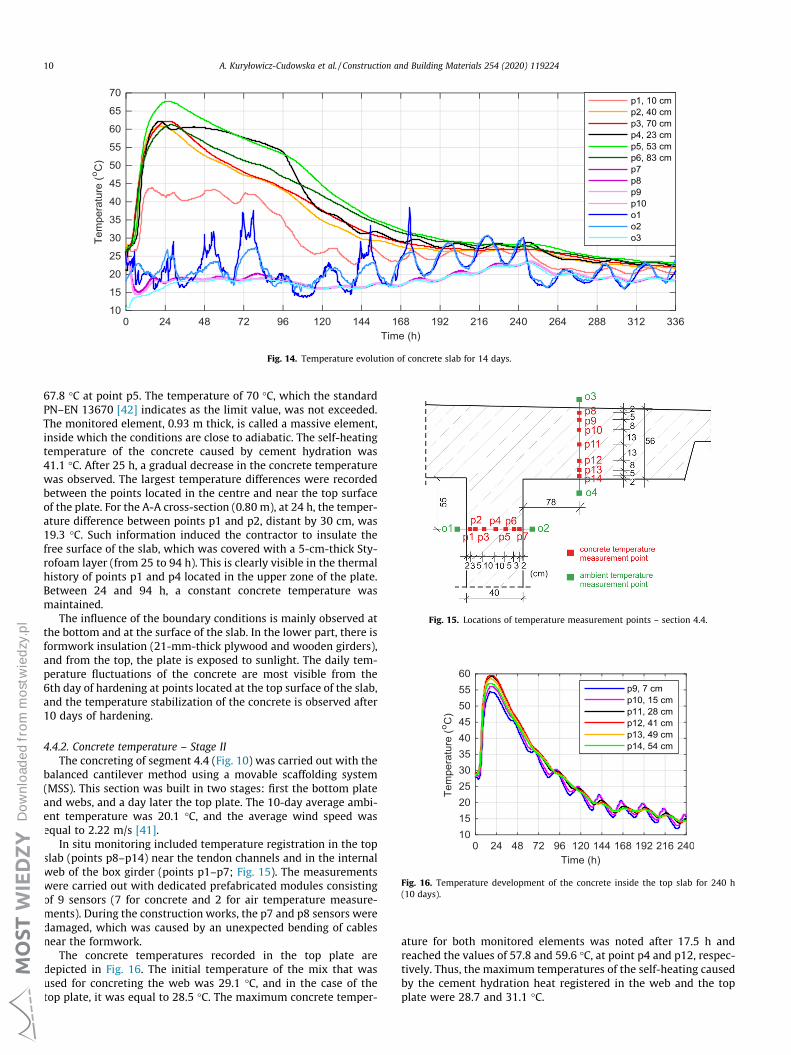
Fig. 14. Temperature evolution of concrete slab for 14 days.
Fig. 15. Locations of temperature measurement points – section 4.4.
Fig. 16. Temperature development of the concrete inside the top slab for 240 h(10 days).
10 A. Kuryłowicz-Cudowska et al. / Construction and Building Materials 254 (2020) 119224
Do
wnl
oad
ed f
rom
mo
stw
ied
zy.p
l
67.8 �C at point p5. The temperature of 70 �C, which the standardPN–EN 13670 [42] indicates as the limit value, was not exceeded.The monitored element, 0.93 m thick, is called a massive element,inside which the conditions are close to adiabatic. The self-heatingtemperature of the concrete caused by cement hydration was41.1 �C. After 25 h, a gradual decrease in the concrete temperaturewas observed. The largest temperature differences were recordedbetween the points located in the centre and near the top surfaceof the plate. For the A-A cross-section (0.80 m), at 24 h, the temper-ature difference between points p1 and p2, distant by 30 cm, was19.3 �C. Such information induced the contractor to insulate thefree surface of the slab, which was covered with a 5-cm-thick Sty-rofoam layer (from 25 to 94 h). This is clearly visible in the thermalhistory of points p1 and p4 located in the upper zone of the plate.Between 24 and 94 h, a constant concrete temperature wasmaintained.
The influence of the boundary conditions is mainly observed atthe bottom and at the surface of the slab. In the lower part, there isformwork insulation (21-mm-thick plywood and wooden girders),and from the top, the plate is exposed to sunlight. The daily tem-perature fluctuations of the concrete are most visible from the6th day of hardening at points located at the top surface of the slab,and the temperature stabilization of the concrete is observed after10 days of hardening.
4.4.2. Concrete temperature – Stage IIThe concreting of segment 4.4 (Fig. 10) was carried out with the
balanced cantilever method using a movable scaffolding system(MSS). This section was built in two stages: first the bottom plateand webs, and a day later the top plate. The 10-day average ambi-ent temperature was 20.1 �C, and the average wind speed wasequal to 2.22 m/s [41].
In situ monitoring included temperature registration in the topslab (points p8–p14) near the tendon channels and in the internalweb of the box girder (points p1–p7; Fig. 15). The measurementswere carried out with dedicated prefabricated modules consistingof 9 sensors (7 for concrete and 2 for air temperature measure-ments). During the construction works, the p7 and p8 sensors weredamaged, which was caused by an unexpected bending of cablesnear the formwork.
The concrete temperatures recorded in the top plate aredepicted in Fig. 16. The initial temperature of the mix that wasused for concreting the web was 29.1 �C, and in the case of thetop plate, it was equal to 28.5 �C. The maximum concrete temper-
ature for both monitored elements was noted after 17.5 h andreached the values of 57.8 and 59.6 �C, at point p4 and p12, respec-tively. Thus, the maximum temperatures of the self-heating causedby the cement hydration heat registered in the web and the topplate were 28.7 and 31.1 �C.

A. Kuryłowicz-Cudowska et al. / Construction and Building Materials 254 (2020) 119224 11
Do
wnl
oad
ed f
rom
mo
stw
ied
zy.p
l
The temperature recorded in the web, surrounded on both sideswith formwork, is very similar at all measurement points. The topplate is free on the one side and protected with shuttering on theother, which is a reason for the temperature difference (e.g.,Dp9� p12 ¼5.2 �C). Due to the relatively high ambient tempera-ture, these differences are not significant.
4.4.3. Concrete temperature – Stage IIIThe third stage of work was performed on section 3.18 (Fig. 4).
The entire segment was concreted in one cycle. The 10-day averageambient temperature was 4.4 �C, and the average wind speed was3.61 m/s [41].
The measurement cross-section was located in the middle ofsection 3.18, which had a thickness of 4 m. The temperature sen-sors were placed in the top slab (p1–p5), web (p6–p8), and bottomplate (p9–p13). The temperature registration in the deck was car-ried out with a prefabricated measuring module, which consistedof 13 sensors and was designed for this task. The temperature inthe samples (p14, p15) and the air temperature over (o16), inside(o17, o18), and under the bridge box (o19) were also monitored(Fig. 17).
The monitored elements with thicknesses of 0.35, 0.40, and0.57 m are so-called medium-sized concrete elements. The initialtemperature of the concrete mix delivered to the construction sitewas 14.8 �C. The recorded temperature changes at all measure-ment points and in individual structural elements are illustratedin Figs. 18 and 19.
Fig. 17. Locations of temperature me
Fig. 18. Temperature ev
The concrete temperature of the bottom plate (Fig. 19a) isalmost the same at all points. The maximum concrete temperaturewas equal to 34.7 �C (point p11) and occurred after 20 h.
In the web, the maximum recorded temperature (Fig. 19b) was34.3 �C, which is approximately 23.5 �C lower than the maximumtemperature registered for the same element during the secondstage of research.
The temperature evolution in the top plate is the most diverse(Fig. 19c). The maximum concrete temperature was equal to42.8 �C (at point p4), which was 16.8 �C lower than the maximumtemperature recorded for the same element during the secondstage of the research. The self-heating temperature caused by thecement hydration recorded in the top plate was 28.0 �C. Fig. 20shows the temperature changes in the cross-sectional concretemeasurements at 12, 24, 36, 48, 96, and 168 h. Different boundaryconditions (formwork at the bottom, free top surface) and a lowambient temperature generated a temperature difference equalto 15.7 �C between the concrete core (p4) and the surface (p1) ofthe top plate. In general, the temperature difference should notbe greater than 15–20 �C, depending on the thickness of theelement.
The boundary conditions have the greatest influence on theintensity of the heat released during cement hydration (exceptfor the mixture composition). The evolution of the concrete tem-perature depends strictly on the ambient temperature, geometry,formwork, and influence of adjacent concrete blocks. The homoge-neous boundary conditions for the bottom plate or web cause the
asurement points – section 3.18.
olution for 10 days.

Fig. 19. Temperature development of the concrete for 168 h (7 days) inside: (a) thebottom slab, (b) the web, (c) the top slab.
Fig. 20. The evolution of concrete temperature.
12 A. Kuryłowicz-Cudowska et al. / Construction and Building Materials 254 (2020) 119224
Do
wnl
oad
ed f
rom
mo
stw
ied
zy.p
l
same temperature increase during the heating phase at all mea-surement points. For the top plate, the exposed top surface is sub-jected to additional daily temperature variations, causingsignificant gradients inside the hardening plate. Therefore, protect-ing the free surfaces of concrete elements is very important. Theobservations made in this paragraph are also valid for all the eval-uated span sections.
4.4.4. Validation samplesThe 150 mm cubic specimens moulded during the casting oper-
ations of each section of the bridge deck were used for validationstudies. The continuous monitoring of the temperature in the con-crete samples allowed the computation of the maturity index (inthe form of equivalent age te), and with respect to thelaboratory-tested compressive strength, the maturity-strength plotwas updated. Three specimens were tested each time.
This approach enabled a real check of the concrete maturitycurve developed during the initial phase. Destructive tests are alsoa good way to verify the concrete delivered to the construction site.The rate of compressive strength gain of the cubic specimensinvestigated during the first stage of the study was visibly higherthan during the initial tests and also stage numbers two and three.This was probably due to different curing conditions (high ambienttemperatures in June) or the fact that it was the first section, andtechnological conditions in the concrete plant varied in relationto the next segments. Therefore, the results of the compressiontests of the cubic samples taken during the first stage of theresearch were rejected. Fig. 21 presents the final, updated maturitycurve for concrete C 60/75 class.
5. Results – Compressive strength
5.1. Compressive strength at the selected locations
The measured temperature of the concrete sections as well asthe developed maturity curves made it possible to plot the strength– age relationship for the selected points. In the third stage of thestudy, the visible strength increase during the first approximately24 h is observed (Fig. 22). This is related to the amount of heatreleased, which in the initial phase is characterised by a significantintensity, and as the process continues, the cooling phase takesplace, and the temperature of the hardening concrete stabilises.
At the age of 12 h, the concrete in the top plate reaches thecubic compressive strength of 11.1 MPa (acc. to p1), for the web16.4 MPa (acc. to p7), and for the bottom plate 17.9 MPa (acc. top13; Fig. 22). Thus, the highest early-age strength was noted inthe bottom slab, and the lowest in the top one. The post-tensionof the bridge span could have started after the concrete reached
Fig. 21. Maturity curve related to cubic strength.

Fig. 22. Cubic strength of the section 3.18 (selected points: p1, p7, p13) and cubicsample (p15) versus age.
Table 460% of the characteristic strength.
60%�75 = 45 MPa/rate ofstrength gain
Time (h) Rate (MPa/h)
Stage I b.s. 13.7 3.3
Stage II t.s. 15.1 3.0web 14.3 3.1
Stage III t.s. 39.3 1.1web 32.0 1.4b.s. 29.3 1.5
A. Kuryłowicz-Cudowska et al. / Construction and Building Materials 254 (2020) 119224 13
Do
wnl
oad
ed f
rom
mo
stw
ied
zy.p
l
60% of the characteristic strength (45 MPa for class C 60/75). Thislevel is reached for the concrete in the top plate (p1) in 39.3 h,for the web (p7) in 32.0 h, and for the bottom plate (p13) in29.3 h. In turn, the 45 MPa strength, estimated on the basis ofin-place temperature measurements in a cubic sample (p15),would be reached only after 4 days (95.9 h). The compressivestrength determined during the destructive tests of the cubic sam-ples, cured for first 24 h in building site and after that under stan-dard conditions, was 51.2 MPa (68%) at the age of 48 h. The resultsfrom both cases proved that the assessment of in-place concretebased on specimens is inefficient and predicts an extended timeto achieve required strength. After 28 days, the predicted strengthof the top plate concrete is 79.3 MPa (acc. to p1), of the web79.1 MPa (acc. to p7), and the bottom plate 79.6 MPa (acc. top13). The strength requirements for class C 60/75 are met.
To compare the concrete strength gain in the three stages of thestudy, Fig. 23 summarises the strength development achieved dur-ing the individual stages and in the construction elements (b.s. -bottom slab, t.s. – top slab, web). This figure also shows air temper-ature changes. Representative strength curves were developed onthe basis of the measurement points, for which the lowest concretetemperature was recorded (stage I according to p1, stage II accord-ing to p1 and p9, and stage III according to p1, p7, and p13). Thereis a significant difference in the concrete strength evolution in thestructure at every stage, which proves how large the influence of
Fig. 23. Cubic compressive strength of structure in three st
the boundary conditions is, including air temperature, on theself-heating of concrete and thus on the compressive strengthvalue (Fig. 23).
In Table 4, the time needed to achieve the level of 60% of thecharacteristic strength and the rate of strength increase are listed.In stage III, in relation to stages I and II, the estimated time is abouttwice as long. For stages I and II it is an average of 14.4 h, and forstage III, 33.5 h. Nevertheless, the rate of strength gain is significantand consistent with the project. In all cases, the technologist’sassumption of regarding strength gain equal to 1 MPa/h, even atthe temperature considered as minimum for concreting (5 �C),was met. In conclusion, the fastest possible date for the post-tension of the bridge section was set at 1.0–2.0 days, mainlydependent on atmospheric conditions.
5.2. FEM results
Based on the developed FEM program, maps of the concretetemperature and compressive strength distribution for the over-hanging section (no. 3.18) were prepared. The thermophysicalparameters of C 60/75 concrete were adopted in accordance withTable 5 and Table 6 using nomograms developed in paper [27].
Fig. 24 presents the concrete compressive strength calculatedon the basis of concrete temperature measured during the thirdstage of the study and the maturity curve according to Fig. 21 (solidlines), as well as the strength obtained as a result of numerical cal-culations (dashed lines) for selected measurement points. Themodel shows similar strength evolutions as measured experimen-tally for the overhanging section of the bridge. It should be addedthat in the FEM model, a constant ambient temperature of 4.4 �Cwas adopted, and in the real structure, a significant effect from
ages and appropriate ambient temperature versus age.

Table 5Thermophysical properties of concrete C 60/75 class.
C (kg/m3) q (kg/m3) Ea=R (K) w=c (–) nmax (–) Qmax (kJ/kg) c (kJ/(kg�K)) k (W/(m�K))440 2570 4620 0.325 0.65 330 0.84 2.0
Table 6Model parameters – stage III.
j=n0 (1/h) n�(–) A0=j (–) T0 (�C) Tenv
10days (�C) a forms (W/(m2�K)) afc (W/(m2�K))
12.0�106 4.0 1�10�4 14.8 4.4 5.6 10.3
Fig. 24. The estimated compressive strength based on the measured temperatureand temperature achieved from the numerical model at selected points of theanalysed section.
Table 7FEM results.
Age Concrete temperature
12 h
24 h (1 day)
48 h (2 days)
84 h (3,5 days)
240 h (10 days)
672 h (28 days)
14 A. Kuryłowicz-Cudowska et al. / Construction and Building Materials 254 (2020) 119224
Do
wnl
oad
ed f
rom
mo
stw
ied
zy.p
l
the daily fluctuations of air temperature on the in-place concretetemperature is observed.
The maps of the concrete temperature field were made in atwo-dimensional model. Table 7 reports the temperature maps ofthe concrete section in 12, 24, 48, 84, 240, and 672 h. After 24 h,for the top plate in the cross-section passing through the centreof the inner web, the temperature difference between the concretesurface of the bridge box (23.3 �C) and 40 cm below (40.8 �C) isequal to 17.5 �C (Table 7). The biggest source of thermal energyis located in places with the largest volume of embedded concrete.The internal and external web, due to the presence of formwork onboth sides, is in the most uniform thermal state. The parts of thetop and bottom slabs with the smallest thickness and the end ofthe plate cantilever are particularly susceptible to the cooling pro-cess. At the age of approximately 10 days, the cooling phase of theconcrete ends, and throughout the entire section, a temperatureclose to the air temperature is observed (Table 7).
The results of the concrete temperature field in the bridge boxallowed for elaborate maps of the concrete compressive strength
Cubic compressive strength

Fig. 25. Map of the cubic compressive strength of the overhanging section at the age of 48 h with indication of the position of tendons.
A. Kuryłowicz-Cudowska et al. / Construction and Building Materials 254 (2020) 119224 15
Do
wnl
oad
ed f
rom
mo
stw
ied
zy.p
l
distribution (Table 7). At the age of 12 h, the strength of young con-crete changes from 7.8 MPa for the free surface of the plates to21.0 MPa for the zone with the largest amount of built-in concrete.At the age of 24 h, the minimum concrete strength equals 25.7 MPaand applies mainly to the corners and external zones of the 25-cm-thick top/bottom slab (Table 7).
At the age of 48 h, the compressive strength of concrete variesfrom 38.0 to 63.3 MPa. At point 5.1, the suggested possible datefor starting the post-tension of the span section was determinedto be 2 days, which is confirmed by FEM simulations for thecross-section passing through the centre of the inner box’s web.However, the concrete in the thinnest part of the top and bottomslab, at the age of 48 h, does not reach the level of 60% of charac-teristic strength. The compressive strength of concrete equal to45 MPa is achieved in the considered cross-section after 3.5 daysof concrete placement (Table 7).
At the age of 28 days, high-performance concrete achieves acompressive strength of 75 MPa in the entire volume, thus meetingthe requirements of class C 60/75 (Table 7).
A detailed analysis of the compressive strength variation at theage of 48 h is presented in Fig. 25. The picture also shows the loca-tion of the prestressing cable channels. The results allow the anal-ysis of the concrete maturity in the neighbourhood of the plasticducts to facilitate the decisions on speeding up the post-tensioning tendons. In the case of an unfavourable strength distri-bution in the vicinity of the prestressing channel, longer maturingperiods might be chosen to ensure the safety of the conductedworks.
The results of the numerical simulations emphasise the impor-tance of the selection of the measurement points to estimate theconcrete strength in the structure. The application of the maturitymethod extended by numerical calculations based on the FEM sig-nificantly increases the accuracy of the prediction method of theconcrete strength in the structure. Before the concrete placementand the implementation of the monitoring system on the construc-tion site, it is possible to conduct many numerical calculations toconsider the different thermophysical parameters of the concreteand the initial-boundary conditions, e.g., the evaluation of theimpact of Styrofoam insulation.
The application of these 2D calculations enables the accuratetracking of temperature and concrete strength changes in theentire cross-section of the concrete element. Such knowledge canbe complementary material for the engineer and building inspec-tor in the interest of the construction control process as well asto increase the work safety for the benefit of the final productquality.
6. Final remarks
The paper presents modified experimental and numerical pro-cedures for estimating the early-age compressive strength of con-
crete using in-situ temperature measurements. The standardmaturity method was analysed in a multithreaded way with regardto increasing its effectiveness. The results of laboratory testsshowed some limitations and shortcomings of the method andprovided ideas for its improvement. Based on the gained experi-ences from laboratory tests the following recommendations canbe made:
� use the Freiesleben Hansen and Pedersen function to describethe strength-age data of mortar cubes and apply a nonlinearregression to determine the k-constants;
� express concrete maturity as a function of an equivalent age;� approximate the maturity-strength data of high-performanceconcrete with the proposed power function and improve theapproximation by adding a laboratory test at the age of 56 days;
� use only cubic specimens for maturity curve determination forpractical reasons and to increase the certainty of the compres-sive strength results.
A very important practical aspect is the method of temperaturemeasurement at the construction site. The following conclusionsare drawn after the application of the authors’ measurementsystem:
� to ensure the reliability of measurement, it is suggested to usedigital 1-wire sensors, ds18b20 type, because they work on onlyone cable and do not require calibration;
� it is proposed to use prefabricated measurement rods on whichthe sensors are fixed to protect against accidental damage;
� the data acquisition system must have an independent powersupply, resistant housing and the ability to send data througha wireless connection for online monitoring.
The analysis of the temperature and strength data obtained dur-ing all stages of measurements on the bridge deck allowed the for-mulation of the following findings:
� the parameter that significantly delays or accelerates the devel-opment of the temperature in the concrete deck is the ambienttemperature and initial temperature of the concrete mix;
� temperature measurements in the concrete structure enablesthe proper care of individual sections e.g., to apply a Styrofoamlayer;
� the destructive tests of the validation samples successfully ver-ifies the maturity curve developed in the preparatory phase,which contributes to increasing the accuracy of the appliedmethod;
� the concrete embedded in the bridge deck achieves the level of60% of the characteristic strength required to prestress muchfaster (24–48 h after the concrete was placed) than it did inthe evaluation carried out on the basis of the compression tests

16 A. Kuryłowicz-Cudowska et al. / Construction and Building Materials 254 (2020) 119224
Do
wnl
oad
ed f
rom
mo
stw
ied
zy.p
l
of standard concrete sample, and this significantly acceleratesthe work schedule.
The authors’ FEM code for modelling the temperature field inconcrete and the detailed validation of the numerical model withrespect to data collected in field studies was carried out. The mainissues and advantages of the proposed two-dimensional FEMmodel are listed below:
� the 2D numerical calculations enable the prediction of the dis-tribution of concrete compressive strength, the identification ofplaces particularly exposed to slowing down the rate ofstrength gain and the detailed analysis of the strength distribu-tion near the cable channels;
� the procedure of using tests of concrete hardening underisothermal and semi-adiabatic conditions allows for the properdefinition of boundary conditions and model parameters;
� the biggest advantage of strength estimation based on the 2Dmodel in comparison with the measurements in a limitednumber of points is the knowledge of local changes in strengthin all areas of the entire analysed cross-section of the samestructure;
� numerical results give the basis for the best selection of temper-ature measurement points in real structures.
The algorithm of the proposed augmented maturity methodmight be an important part of the design process of the mixtureand construction of concrete structural elements. Knowledge ofthe maturity-strength relationship determined in laboratory con-ditions provides information on the development of concretestrength before the final concreting of the structure. The concretemonitoring system verifies the mixture delivered to the construc-tion site and makes it possible to correct planned actions or adjustthe parameters of the fresh mix. The proposed method also allowsa limitation on the number of compression tests to monitor thecondition of concrete in the structure. 2D maps of the sectionalconcrete strength of the extradosed bridge provided practicallyonline during the construction improve the confidence at decisionmaking stages and finally, due to benefits resulting from adjust-ments of the construction schedule, give an economic profit. Theproposed algorithm of the augmented maturity method, with thedeveloped package of the numerical solutions for predicting thedevelopment of temperature and strength of concrete, may beapplied to any engineering structure with a complex geometry.An attempt to extend the predicted mechanical properties of con-crete (tensile strength and Young’s modulus) has already beenundertaken; hence, the proposed method will be constantly devel-oped and will consider that the FEM simulations must be fastbecause the results need to be available online almost simultane-ously with the temperature measurements.
CRediT authorship contribution statement
Aleksandra Kuryłowicz-Cudowska: Conceptualization,Methodology, Software, Validation, Investigation, Data curation,Writing - original draft, Visualization, Project administration.Krzysztof Wilde: Conceptualization, Resources, Writing - review& editing, Supervision. Jacek Chróscielewski: Methodology, Soft-ware, Formal analysis, Supervision.
Declaration of Competing Interest
The authors declare that they have no known competing finan-cial interests or personal relationships that could have appearedto influence the work reported in this paper.
References
[1] N.J. Carino, H.S. Lew, The maturity method: from theory to application,Proceedings of the Structures Congress & Exposition, May 21–23, Washington,D.C., American Society of Civil Engineers, Reston, Virginia, 2001.
[2] P. Freiesleben Hansen, E.J. Pedersen, Curing of Concrete Structures. Draft DEB –Guide to Durable Concrete Structures. Appendix 1, Comite Euro-Internationaldu Beton, Switzerland, 1985.
[3] J.E. Jonasson, P. Groth, H. Hedlund, Modelling of temperature and moisturefield in concrete to study early age movements as a basis for stress analysis, in:International Symposium Thermal Cracking in Concrete at Early Ages, Munich,1994, pp. 45–52.
[4] B. Klemczak, K. Flaga, A. Knoppik-Wrobel, Analytical model for evaluation ofthermal-shrinkage strains and stresses in RC wall-on-slab structures, Arch. Civ.Mech. Eng. 17 (1) (2017) 75–95.
[5] M. Velay-Lizancos, I. Martinez-Lage, P. Vazquez-Burgo, The effect of recycledaggregates on the accuracy of the maturity method on vibrated and self-compacting concretes, Arch. Civ. Mech. Eng. 19 (2019) 311–321.
[6] N. Ji Jin, I. Seung, Y.S. Choi, J. Yeon, Prediction of early-age compressivestrength of epoxy resin concrete using the maturity method, Constr. Build.Mater. 152 (2017) 990–998.
[7] J. Zhang, D. Cusson, P. Monteiro, J. Harvey, New perspectives on maturitymethod and approach for high performance concrete applications, Cem. Concr.Res. 38 (12) (2008) 1438–1446.
[8] E. Horszczaruk, P. Sikora, K. Cendrowski, E. Mijowska, The effect of elevatedtemperature on the properties of cement mortars containing nanosilica andheavyweight aggregates, Constr. Build. Mater. 137 (2017) 420–431.
[9] M. Kurpinska, B. Grzyl, A. Kristowski, Cost analysis of prefabricated elements ofthe ordinary and lightweight concrete walls in residential construction,Materials 12 (21) (2019) 3629.
[10] M. Kurpinska, L. Kułak, Predicting performance of lightweight concrete withgranulated expanded glass and ash aggregate by means of using artificialneural networks, Materials 12 (12) (2019) 2002.
[11] A. Mariak, L. Grabarczyk, B. Wojtasik, M. Zbawicka, Influence of selectedadditives and admixtures on underwater concrete and the environment,MATEC Web Conf. 219 (2018) 03013.
[12] A. Mariak, M. Kurpinska, The effect of macro polymer fibres length andcontent on the fibre reinforced concrete, MATEC Web Conf. 219 (2018)03004.
[13] E. Haustein, A. Kuryłowicz-Cudowska, The effect of fly ash microspheres on thepore structure of concrete, Minerals 10 (1) (2020) 58.
[14] M. Miskiewicz, Ł. Pyrzowski, K. Wilde, Structural health monitoring system forsuspension footbridge, in: Proceedings 2016 Baltic Geodetic Congress(Geomatics), IEEE, 2017, pp. 321–325.
[15] A. Mariak, M. Miskiewicz, B. Meronk, Ł. Pyrzowski, K. Wilde, Reference FEMmodel for SHM system of cable-stayed bridge in Rzeszów, Adv. Mech.: Theor.Comput. Interdiscip. Issues (2016) 383–387.
[16] ASTM C1074, Standard Practice for Estimating Concrete Strength by theMaturity Method, ASTM, West Conshohocken, PA, 2019.
[17] EN 12390-2, Testing Hardened Concrete – Part 2: Making and curingSpecimens for Strength Tests, CEN (European Committee for Standardization),Brussels, Belgium, 2019.
[18] A.G. Brooks, A.K. Schindler, R.W. Barnes, Maturity method evaluated forvarious cementitious materials, J. Mater. Civ. Eng. 19 (12) (2007) 1017–1025.
[19] N.J. Carino, Temperature Effects on the Strength-Maturity Relation of Mortar,National Bureau of Standards, Washington, 1981.
[20] A. Mariak, M. Kurpinska, K. Wilde, Maturity curve for estimating the in-place strength of high performance concrete, MATEC Web Conf. 262 (2019)06007.
[21] N.J. Carino, Maturity functions for concrete, in: Proceedings, RILEMInternational Conference on Concrete at Early Ages, Paris, I, 1982, pp. 123–128.
[22] J. Byfors, Plain Concrete at Early Ages, Technical Rep. No. 3:80, SwedishCement and Concrete Institute, Stockholm, Sweden, 1980.
[23] EN 206+A1, Concrete: Specification, Performance, Production and Conformity,CEN (European Committee for Standardization), Brussels, Belgium, 2013.
[24] F.K. Chin, Relation between strength and maturity of concrete, ACI J. Proc. 68(3) (1971) 196–203.
[25] J.M. Plowman, Maturity and the strength of concrete, Mag. Concr. Res. (1956,)8.
[26] I. Galobardes, S.H. Cavalaro, C.I. Goodier, S. Austin b, Á. Rueda, Maturitymethod to predict the evolution of the properties of sprayed concrete, Constr.Build. Mater. 79 (2015) 357–369.
[27] A. Kuryłowicz-Cudowska, Determination of thermophysical parametersinvolved in the numerical model to predict the temperature field of cast-in-place concrete bridge deck, Materials 12 (19) (2019) 3089.
[28] A. Mariak, J. Chróscielewski, K. Wilde, Numerical simulation of hardening ofconcrete plate, Shell Struct. Theor. Appl. 4 (2018) 557–560.
[29] M. Azenha, Numerical simulation of the structural behaviour of concrete sinceits early ages (Ph.D. Thesis), University of Porto, 2009.
[30] G. Di Luzio, G. Cusatis, Solidification–microprestress–microplane (SMM)theory for concrete at early age: theory, validation and application, Int. J.Solids Struct. 50 (2013) 957–975.
[31] M. Cervera, R. Faria, J. Oliver, T. Prato, Numerical modelling of concrete curing,regarding hydration and temperature phenomena, Comput. Struct. 80 (2002)1511–1521.

A. Kuryłowicz-Cudowska et al. / Construction and Building Materials 254 (2020) 119224 17
Do
wnl
oad
ed f
rom
mo
stw
ied
zy.p
l
[32] Z.P. Bazant, W. Thonguthai, Pore pressure and drying of concrete at hightemperature, J. Eng. Mech. Div. 104 (5) (1978) 1059–1079.
[33] C.E. Majorana, V. Salomoni, B.A. Schrefler, Hygrothermal and mechanicalmodel of concrete at high temperature, Mater. Struct. 31 (6) (1998) 378–386.
[34] M. Kaszynska, Early age properties of high-strength/high-performanceconcrete, Cem. Concr. Compos. 24 (2002) 253–261.
[35] J. Chróscielewski, J. Makowski, W. Pietraszkiewicz, Statyka i dynamika powłokwielopłatowych. Nieliniowa teoria i metoda elementów skonczonych, 2004 (inPolish).
[36] M. Miskiewicz, Ł. Pyrzowski, Load test of new European record holder in spanlength among extradosed type bridges. Seminary on geomatics, Civil andenvironmental engineering (2018 BGC), EDP Sci. (2018) 1–6.
[37] K.J. Bathe, Finite Element Procedures, Prentice Hall, 1982.
[38] P. Lura, K. Breugel, Thermal Properties of Concrete: Sensitivity Studies. IPACSDocument, Subtask 2.5, 2001.
[39] R.H. Mills, Factors influencing cessation of hydration in water cured cementpastes, special report No. 90, in: Proceedings of the Symposium on theStructure of Portland Cement Paste and Concrete, Highway Research Board,Washington DC, USA, 1966, pp. 406–424.
[40] J. Chróscielewski, A. Mariak, A. Sabik, B. Meronk, K. Wilde, Monitoring ofconcrete curing in extradosed bridge supported by numerical simulation, Adv.Sci. Technol. Res. J. 10 (32) (2016) 254–262.
[41] Weather: https://www.ekologia.pl/pogoda.[42] EN 13670, Execution of Concrete Structures, CEN (European Committee for
Standardization), Brussels, Belgium, 2010.