prediction of climate change impacts on groundwater storage by analysis and modeling of hydrograph...
TRANSCRIPT

Prediction of Climate Change Impacts on Groundwater Storage by Prediction of Climate Change Impacts on Groundwater Storage by Analysis and Modeling of Hydrograph Recession Curves: Application Analysis and Modeling of Hydrograph Recession Curves: Application
to the Bar Watershed, Iranto the Bar Watershed, Iran
Majid Taie Semiromi1, Manfred Koch1, Siavash Taie Semiromi2
1 Department of Geohydraulics and Engineering Hydrology, University of Kassel, Germany
2 Department of Watershed Management Engineering, Tarbiat Modares University, Iran

IntroductionIntroductionWhile 67% of Earth’s surface is covered by
water, only less than 2.7% of global water is freshwater. Most of the freshwater (2.05%) are locked in ice caps and glaciers. Only less than 0.7% is available for human use.
2

Volume of water stored inVolume of water stored inthe water cycle's reservoirsthe water cycle's reservoirs
Reservoir Volume of water
(106 km³)
Percent
of total
Ocean 1370 97.25
Ice caps & glaciers 29 2.05
Groundwater 9.5 0.68
Lakes 0.125 0.01
Soil Moisture 0.065 0.005
Atmosphere 0.013 0.001
Streams & rivers 0.0017 0.0001
Biosphere 0.0006 0.00004


Climate and climate changeClimate and climate change
Climate = a region’s long-term pattern of atmospheric conditions
Global climate change = changes in Earth’s climate, including temperature, precipitation, and other variables
Global warming = an increase in Earth’s average surface temperature
Climate changes naturally, but the recent rapid warming of the planet and its change in atmospheric composition are widely thought to be due to human activities.

Climate Change = Hydrologic ChangeClimate Change = Hydrologic Change
http://www.fs.fed.us/emphasis/products/water-climate-brochure.pdf

Groundwater and climate changeGroundwater and climate change
Groundwater is the source of 35% of global human waterwithdrawals, and even of 42% of global irrigation water withdrawals
Climate change affects on groundwater resources in two ways:1- Direct impacts: reducing or increasing of recharge2-indirect impacts: Due to increased temporal variability of surface water flows, climate change is likely to lead to higher demands for groundwater
In this regard, using global hydrological models, global groundwater recharge and thus renewable groundwater resources were estimated to be 13 000–15 000 km3 per year under current climate conditions, and to account for approximately one third of the total renewable water resources (Döll and Fiedler 2008, Wada et al 2010).

groundwater resources in Irangroundwater resources in Iran1- Groundwater utilization in 1970: around 20 BCM2- Groundwater utilization now: more than 74 BCM3- There is no clear picture of just how much of groundwater resources is economically and technically exploitable.4- Sea water intrusion and groundwater contamination5- Drought6- Climate change

Objectives of the present research Objectives of the present research
1- Assessing the groundwater storage during 1- Assessing the groundwater storage during the historical data record (1970 to 2010) by the historical data record (1970 to 2010) by
analyzing recession curves of the annual analyzing recession curves of the annual hydrographshydrographs
2- Forecasting the groundwater reserves 2- Forecasting the groundwater reserves under different climate change scenariosunder different climate change scenarios

Expected results (hypotheses)Expected results (hypotheses)
1- The groundwater storage has been 1- The groundwater storage has been significantly decreasing during reference periodsignificantly decreasing during reference period
2- Groundwater storage will be reducing as a 2- Groundwater storage will be reducing as a result of climate change under climate result of climate change under climate projectionsprojections

Literature reviewLiterature review
Chen, Z., Grasby, S.E., Osadetz, K.G., 2002Chen, Z., Grasby, S.E., Osadetz, K.G., 2002Issar, A. S., 2003. Issar, A. S., 2003. Brouyère, S., Carabin, G., Dassargues, A., 2004Brouyère, S., Carabin, G., Dassargues, A., 2004Holman, I., 2006 Holman, I., 2006 Dettinger, M.D., Earman, S., 2007Dettinger, M.D., Earman, S., 2007IPCC, 2007. IPCC, 2007. Scibek, J., Allen, D.M., Cannon, A.J., Whitfield, P.H., 2007. Scibek, J., Allen, D.M., Cannon, A.J., Whitfield, P.H., 2007. Green T.R., Taniguchi, M., Kooi, H., Gurdak, J.J., Allen, D.M., Hiscock, K.M., Treidel, H., Aureli, Green T.R., Taniguchi, M., Kooi, H., Gurdak, J.J., Allen, D.M., Hiscock, K.M., Treidel, H., Aureli, A., 2011A., 2011Herrera-Pantoja, M.; Hiscock, K.M., Boar, R. R., 2012Herrera-Pantoja, M.; Hiscock, K.M., Boar, R. R., 2012Hirata, R.; Conicelli, B.P., 2012Hirata, R.; Conicelli, B.P., 2012José-Luis Molina, David Pulido-VelJosé-Luis Molina, David Pulido-Velللzquez b, José Luis Garczquez b, José Luis Garcييa-Ara-Ar ََstegui c, Manuel Pulido-stegui c, Manuel Pulido-VelVelللzquez, 2013zquez, 2013IPCC, 2013IPCC, 2013
•

Study area: Physiography of IranStudy area: Physiography of Iran

Climatological Condition Mean Annual Precipitation Iran≈ 250 mm(World: 860 mm)
Mean Annual Evaporation Iran ≈ 2100 mm (World: 700 mm)

Around 85% of the country is covered by arid and Around 85% of the country is covered by arid and semi- arid areassemi- arid areas

Case studyCase study

MethodologyMethodology
1- Selecting rain gauge and hydometery stations1- Selecting rain gauge and hydometery stations2- Analysis of hydro- climate time series during observed period (1970- 2- Analysis of hydro- climate time series during observed period (1970- 2010)2010)3- Simulation of hydro- climate variable by General Circulation Models 3- Simulation of hydro- climate variable by General Circulation Models (GCMs) and choosing appropriate GCMs(GCMs) and choosing appropriate GCMs4- Downscaling with LARS- WG model in the scale of Bar watershed4- Downscaling with LARS- WG model in the scale of Bar watershed5- Using downscaled data including mean, max and min temperature, 5- Using downscaled data including mean, max and min temperature, precipitation and solar radiation as the inputs into a rainfall- runoff modelprecipitation and solar radiation as the inputs into a rainfall- runoff model6- Rainfall- runoff simulation by IHACRES model6- Rainfall- runoff simulation by IHACRES model

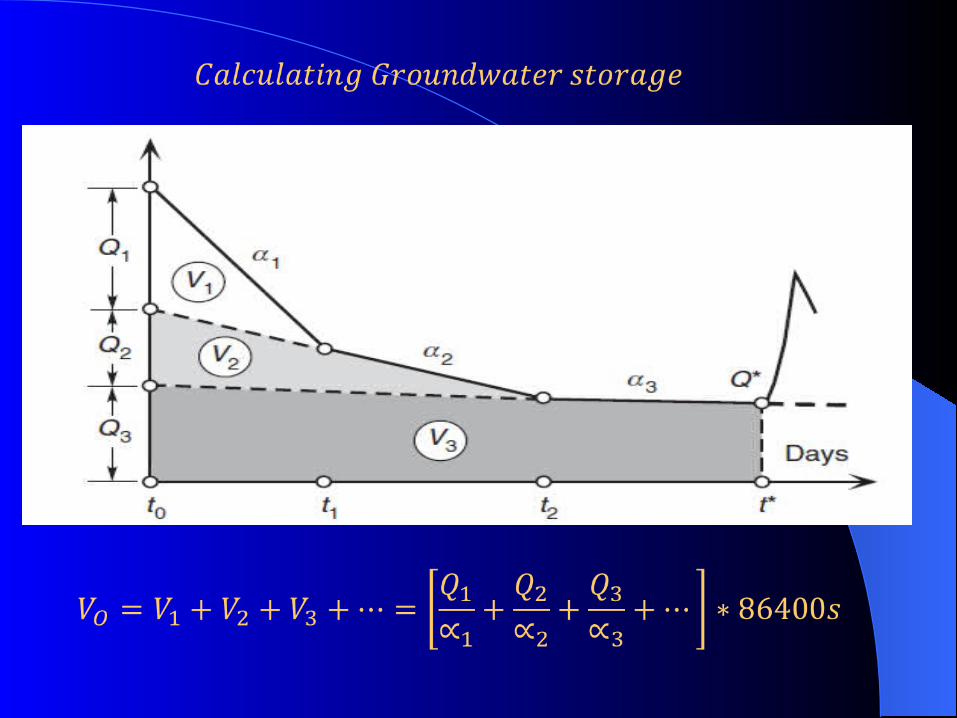
7- Recession curve modeling (Recession Analysis)7- Recession curve modeling (Recession Analysis)

1- The Boussinesq equation is of hyperbolic form:1- The Boussinesq equation is of hyperbolic form:Qt = Q0/ Qt = Q0/ [1 + α([1 + α(t − t0)]t − t0)]22
where t = time since the beginning of recession for which the flow where t = time since the beginning of recession for which the flow rate is calculated and t0 = time at the beginning of recession usually rate is calculated and t0 = time at the beginning of recession usually (but not necessarily) set equal to zero.(but not necessarily) set equal to zero.2- The Maillet equation which is more commonly used, is an 2- The Maillet equation which is more commonly used, is an exponential functionexponential functionQt = Q0 · eQt = Q0 · e−−α(α(t−t0)t−t0)
The dimensionless parameter α in both equations represents the The dimensionless parameter α in both equations represents the coefficient of discharge (or recession coefficient), which depends on coefficient of discharge (or recession coefficient), which depends on the transmissivity and specific yield of the aquifer. The Maillet the transmissivity and specific yield of the aquifer. The Maillet equation, when plotted on a semilog diagram, is a straight line withequation, when plotted on a semilog diagram, is a straight line withthe coefficient of discharge (α) being its slope:the coefficient of discharge (α) being its slope:


ResultsResultsAnalysis of trend in hydro- climate variables Analysis of trend in hydro- climate variables
during observed period (1970- 2010)during observed period (1970- 2010)
Significant test SD Average Max Min
Variable
0.002* 0.32 0.62 1.7 0.12 (M3/sec) River
discharge
0.051 108 319 505 150 Rainfall (mm)
0.73 1.3 39 42.2 36.7Maximum temperature
(C)
0.94 3.2 -15.2 -23.6 -10.4Minimum temperature
(C)
0.005* 226 2850 3196 2130Hours of sunlight
(hours/yr)

Downscaled GCMs under different scenarios in Downscaled GCMs under different scenarios in comparison with observed data (1970- 2010)comparison with observed data (1970- 2010)Precipitation Temperature
GCM
PBIS MAE Nash R2 RMSE PBIS MAE Nash R2 RMSE
23- 0.23 -0.320.01
4.11 0.78 0.1 0.940.82
4.20
B2
Hadcm3
9.44 0.83 0.010.02
3.56 -0.24 0.33 0.990.84
4.04
A2
-0.44 0.35 -0.450.09
4.13 -0.51 0.06 0.790.73
4.52
A1BCGCM

Determination of the model accuracy
n
i i
n
i ii
O
SOPBIAS
1
1
)(
100*)(
2
1
1
2
1
N
t i
N
t ii
OO
SONSE
)(/11 i
n
i i OSnMAE
2/12
1)(
1
i
N
i i OSN
RMSE
2
12
1
OS
n
mii OOSS
nR

Simulated monthly rainfall by LARS- WG model Simulated monthly rainfall by LARS- WG model compared to observed rainfallcompared to observed rainfall
Month

Simulated maximum monthly temperature by LARS- Simulated maximum monthly temperature by LARS- WG model compared to observed dataWG model compared to observed data

Simulated minimum monthly temperature by LARS- Simulated minimum monthly temperature by LARS- WG model compared to observed dataWG model compared to observed data

Relative variations - compared with the 1970-2010 reference Relative variations - compared with the 1970-2010 reference period - of maximum temperature (left) and rainfallperiod - of maximum temperature (left) and rainfall
(right) projected by the HadCM3-model under scenario A2 for (right) projected by the HadCM3-model under scenario A2 for
the future periods 2010-2039, 2040- 2069 and 2070- 2099the future periods 2010-2039, 2040- 2069 and 2070- 2099..

IHACRES- calibrated (left) and validated (right) IHACRES- calibrated (left) and validated (right) streamflow of the Bar river for the 1970-2010 reference streamflow of the Bar river for the 1970-2010 reference
periodperiod

Recession curve analysis for calculating Recession curve analysis for calculating groundwater reservesgroundwater reserves


IHACRES-simulated monthly Bar river streamflow (left panel) and annual recession-computed groundwater storage (right panel) for the reference- and projected future periods.

Summarized resultsSummarized results 1- Predicted mean annual maximum and minimum
temperatures will be increased equally by 1.1, 3.2 and 4.6 ◦C
2-Precipitation will be decreased by 16.4, 17.6 and 31.4 % during the projected periods 2010- 2039, 2040- 2069 and 2070- 2099, respectively, when compared to the past 1970-2010 reference period
3- Annual future hydrographs are constructed which indicate that, compared to the 1970- 2010 reference period, the Bar river streamflow will be abated by 9, 44 and 66 %, during the projected periods 2010-2039, 2040- 2069 and 2070- 2099, respectively.
4-Groundwater storage will drop by 36.9, 52 and 61%, for the three named projected periods, respectively.

Luna Leopold
A river is the report card for its watershed.
Thank you for your attention!Any Question?