prediction of mold contamination from microbial volatile organic compound profiles using head space...
TRANSCRIPT

Microchemical Journal 103 (2012) 119–124
Contents lists available at SciVerse ScienceDirect
Microchemical Journal
j ourna l homepage: www.e lsev ie r .com/ locate /mic roc
Prediction of mold contamination from microbial volatile organic compound profilesusing head space gas chromatography/mass spectrometry
Barry K. Lavine a,⁎, Nikhil Mirjankar a, Ryan LeBouf b, Alan Rossner b
a Department of Chemistry, Oklahoma State University, Stillwater, OK 74078-3071, United Statesb Environmental Health Sciences Program, Department of Biology, Clarkson University, Potsdam, NY 13676, United States
⁎ Corresponding author.E-mail address: [email protected] (B.K. Lavin
0026-265X/$ – see front matter © 2012 Elsevier B.V. Aldoi:10.1016/j.microc.2012.01.017
a b s t r a c t
a r t i c l e i n f oArticle history:Received 23 January 2012Accepted 26 January 2012Available online 31 January 2012
Keywords:Mold detectionVOC air samplingGC/MSPattern recognition analysisMicrobial volatile organic compound (MVOC)profiles
A set of volatile organic compound (VOC) profiles was developed with corresponding bioaerosol measure-ments as input–output pairs for a discriminant to predict mold exposure in indoor environments. EntechBottle-Vacs were used to collect whole air grab samples while viable spores were collected concurrentlyusing an Andersen impactor in conjunction with malt extract agar and dichloran glycerol 18. By comparingthe bioaerosol data to VOC profiles that were obtained using a GC/MS equipped with a cold trap preconcen-trator, a discriminant was developed to classify a residence as to potential mold growth based on its microbialvolatile organic (MVOC) profile.
© 2012 Elsevier B.V. All rights reserved.
1. Introduction
Mold contamination in the indoor environment has become a publicsafety concern. Mold infestations have closed schools, condemnedhouses, caused lost revenue in industrial settings, rendered crops unfitfor human consumption, and caused allergic reactions in sensitivepopulations [1–9]. Current mold sampling techniques are not effectiveat elucidating the fungal load in a contaminated area nor are theyeconomic and timely in providing results. Therefore, there is interestin developing new sampling and analytical approaches that can dis-criminate mold contamination from mold free areas in a cost effectiveand timely manner.
In a previous study [10], an integrated chemical and microbiologicalapproach was used to develop a new analytical methodology to charac-terize the fungal load of a contaminated area in a building. A set of volatileorganic compound (VOC) profiles was developed with correspondingbioaerosol measurements as input–output pairs for a discriminant topredict the presence or absence of mold contamination in indoor envi-ronments. Spore collection to characterize the indoor air quality of build-ings was carried out using an Anderson N6 impactor. Simultaneously,solid phase microextraction (SPME) was used as a passive samplingdevice to collect VOCs from the air for GC/MS analysis. The VOC signa-tures that emit molds as reflected by the gas chromatographic (GC) pro-files were compared to the impactor data collected from each samplingsite. The VOC profiles and the corresponding bioaerosol measurements
e).
l rights reserved.
served as input–output pairs for a discriminant to predict the presenceor absence of mold contamination in indoor environments. By compar-ing the bioaerosol data to VOC profiles, a discriminant was trained toclassify a residence as to potential mold growth based on its microbialvolatile organic (MVOC) profile. However, MVOC profiles from moder-ate mold count exposure environments could not be reliably differenti-ated from the background due to the low quality of the SPME-GC data.
In this study, VOC air sampling was performed using EntechBottle-Vacs [11]. Sampling volatile organics in air using evacuatedcontainers, which can be shipped out for analysis, has been shownto be a viable low-cost method that can be performed in seconds bybuilding occupants or homeowners [12]. The air sampleswere analyzedby GC/MS equipped with a cold trap preconcentrator to improve thequality of the GC data obtained from air sampling.
2. Experimental
Bioaerosol and chemical sampling data were collected concurrentlyat 10 locations in Northern New York during 17 sampling periods fromJuly 2006 to August 2007 with the majority of samples collected duringthe summer. Because cooking and cleaning activities can produce con-siderable chemical interference, occupants at these locations agreed toabstain from these activities for 12 h prior to sampling and during sam-pling events. Whole-air grab samples for MVOCs were collected usingEntech Bottle-Vacs. The bottles were checked by an analog pressuregauge prior to sampling to ensure that a proper vacuumwasmaintained.Each sample was analyzed by an Agilent 6890/5973N GC/MS (AgilentTechnologies, Santa Clara, CA) equipped with a 7500 Autosamplerattached to a 7100A extended cold trap dehydration preconcentrator
120 B.K. Lavine et al. / Microchemical Journal 103 (2012) 119–124
(Entech Instruments, Inc., Simi Valley, CA). Separation of the MVOCmixture was performed by a DB-1 column (60 m by 0.32 mm ID with afilm thickness of 1 μm). Calibration standards used in the analysis includ-ed bromochloromethane, 1, 4-difluorobenzene and chlorobenzene-d5.Relative response factors were calculated for several MVOCs. All sampleswere analyzed in both SIM and Scan mode. Eighteen chemicals wereselected as representative MVOCs (see Table 1) known to be emittedby molds during metabolic activity. All concentrations determinedwere blank corrected.
Bioaerosol data was collected using an Anderson N6 Impactor [13]in conjunction with malt extract agar (MEA) and dichloran glycerol(DG18) in Petri dishes to obtain viable mold samples. Since MEA is amesophilic agar whereas DG18 is a xerophilic agar, a broader rangeof fungi can be cultured giving a better representation of the fungalecology by using both types of agar. During each sampling event, 6samples of each agar type were collected with an associated fieldblank. The samples were cultured for 6 days with colony countsblank corrected with a positive-hole correction applied [14]. Themold count values, which were expressed as a ratio using the fieldblank, were divided into three categories: low (less than 1.2), medium(1.2 to 3.0) and high (greater than 3.0). These values were used toassign the MVOC gas chromatographic (GC) profiles with the appro-priate class label.
For pattern recognition analysis, each gas chromatogram wasrepresented as a data vector X=(x1, x2, x3 … x18) where the compo-nents of the data vector are the concentrations of the VOCs identifiedby GC/MS. All profiles were normalized to constant sum and the datawas autoscaled to ensure that each compound had equal weight inthe analysis. Because of the preprocessing methods used, the focusof the pattern recognition analysis is the concentration pattern presentin the GC profiles, not the total amount of VOCs captured in the wholeair grab samples by the Entech Bottle-Vacs.
3. Pattern recognition analysis
The 58 GC profiles were analyzed for patterns indicative of moldexposure using the Advanced Data Analysis and Pattern RecognitionToolkit (ADAPT) [15] written in MATLAB 7.6.0.324 (R2008a). Thefour main types of pattern recognition methods are mapping and dis-play, discriminant development, clustering, and modeling. ADAPT hasroutines in all four areas (e.g., principal component analysis, canonicalvariate analysis, hierarchical clustering, FCV clustering, linear discrimi-nant analysis, quadratic discriminant analysis, regularized discriminantanalysis, K-nearest neighbor classification, and back propagation neuralnetworks), andmostwere used in this study. A description of the variouspattern recognition routines that comprise ADAPT can be found else-where [16–19].
In this study, a genetic algorithm (GA) for pattern recognitionanalysis was used to identify specific VOCs fromwhich a discriminatingrelationship could be developed [20–24]. The pattern recognition GAidentifies VOCs that optimize the separation of the classes or level ofmold infestation in a plot of the two or three largest principal compo-nents of the data. The principal component analysis [25] routineembedded in the fitness function of the pattern recognition GA acts as
Table 1MVOC compounds.
2-Methylfuran 1-Pentanol2-Butanone 2-Hexanone3-Methylfuran 2-Heptanone2-Methyl-1-propanol 1-Octen-3-ol3-Methyl-2-butanol 3-Octanone2-Pentanol 2-Pentylfuran1, 4 Dioxane 3-Octanol3-Methyl-1-butanol 2-Ethyl-1-hexanol2-Methyl-1-butanol 1-Octanol
an information filter, significantly reducing the size of the searchspace, since it restricts the search to VOCs whose PC plots show cluster-ing on the basis of the samples class label. In addition, the algorithmfocuses on those classes and or samples that are difficult to classify byboosting the corresponding class and sample weights. Samples thatconsistently classify correctly are not as heavily weighted as those sam-ples that are difficult to classify. Over time, the algorithm learns itsoptimal parameters in a manner similar to a neural network.
The fitness function of the pattern recognition GA emulates humanpattern recognition through machine learning to score the PC plotsand identify the VOCs that optimize the separation of the 3 classes ina plot of the two or three largest PCs of the data. To facilitate the trackingand scoring of the PC plots, class and sample weights, which are anintegral part of the fitness function, are computed, see Eqs. (1) and (2)where CW(c) is the weight of class c (with c varying from 1 to thetotal number of classes in the data set), and SWc(s) is theweight of sam-ple s in class c. Class weights sum to 100, and sample weights for theobjects comprising a class sum to a value equal to the class weight ofthe class in question.
CW cð Þ ¼ 100CW cð Þ
∑cCW cð Þ : ð1Þ
SWðsÞ ¼ CWðcÞ SWðsÞ∑sec
SWðsÞ: ð2Þ
Each PC plot for each VOC is scored using the K-nearest neighborclassification algorithm [26]. For a given data point, Euclidean dis-tances are computed between it and every other point in the PCplot. These distances are arranged from smallest to largest. A poll istaken of the point's Kc nearest neighbors. For themost rigorous classifica-tion of the datawhichwas used in this study, Kc equals the number of airsamples in the class towhich the point belongs. Thenumber of Kc nearestneighbors with the same class label as the sample point in question, theso-called sample hit count, SHC(s), is computed (0≤SHC(s)≤Kc) foreach air sample. It is then a simple matter to score each PC plot (seeEq. (4)). First, the contribution to the overall fitness by each VOC samplein class 1 is computed, with the scores of the VOC samples comprisingthe class summed to yield the contribution by this class to the overallfitness. This same calculation is repeated for the other classes in thedata set with the scores from each class summed to yield the overallfitness, F (d).
F dð Þ∑c∑sec
1Kc
� SHC sð Þ � SW sð Þ: ð3Þ
The fitness function of the pattern recognition GA is able to focuson samples and classes that are difficult to classify by boosting theirweights over successive generations. For boosting, it is necessary tocompute both the sample-hit rate (SHR), which is the mean valueof SHC/Kc over all VOC subsets produced in a particular generation(see Eq. (5)), and the class-hit rate (CHR), which is the mean samplehit rate of all samples in a class (see Eq. (6)). ϕ in Eq. (5) is the numberof feature subsets (i.e., chromosomes) in the population, and AVG inEq. (6) refers to the average or mean value. During each generation, aperceptron is used to adjust class and sample weights (see Eqs. (6)and (7)) with the momentum, P, set by the user. (In Eqs. (6) and (7),g+1 refers to the current generation, whereas g defines the previousgeneration.) Classes with a lower class hit rate are boosted to a greaterdegree than classes that score well.
SHR sð Þ ¼ 1ϕ
Xϕ
i¼1
SHCi sð ÞKc
: ð4Þ

-6 -4 -2 0 2 4 6 8-4
-3
-2
-1
0
1
2
3
4
5
6
1 1
1 1
1 1 1
1
1 1
1 1 1 1
1 1 1
1
1 1
2 2 2 2 2
3 3
3
3 3
3 3
3 3
3
3 3
3 3
3 3 3 3
3 3
3
3
3
3 3
3
3
3
3 3
3 3
3
3
PC 1
PC
2
Fig. 1. Plot of the two largest principal components of the 18 VOCs for DG18. Each airsample is represented as a point in the plot. 1 = lowmold count exposure, 2=moderatemold count exposure, and 3 = high mold count exposure.
121B.K. Lavine et al. / Microchemical Journal 103 (2012) 119–124
CHRg cð Þ ¼ AVG SHRg sð Þ : ∀ sec
� �: ð5Þ
CWgþ1 sð Þ ¼ CWg sð Þ þ P 1� CHRg sð Þ� �
: ð6Þ
SWgþ1 sð Þ ¼ SWg sð Þ þ P 1� SHRg sð Þ� �
: ð7Þ
Boosting is crucial to ensure the successful operation of thepattern recognition GA because it modifies the fitness landscape byadjusting the values of the class and sample weights. This minimizesthe problem of convergence to a local optimum. The fitness functionof the pattern recognition GA is changing as the population evolvestowards a solution.
4. Results and discussion
Each MVOC profile (air sample) was assigned two class labels asviable mold samples were collected using two different types ofagar. One label was based on spore counts from DG18 agar and theother on spore counts from MEA agar. The two bioaerosol data sets(which are summarized in Table 2) have 20 MVOC profiles in commonfor low mold count exposure, 5 for medium mold count exposure, and29 for high mold count exposure. The 58 MVOC profiles in the DG18data set were divided into 3 classes on the basis of the impactor data.Fig. 1 shows a PC plot of all 18 compounds for the DG18 data set. Eachair sample is represented as a point in the plot. MVOC profiles of thehigh mold count air samples are well separated from medium andlow mold count samples in the PC plot of the data.
A genetic algorithm for pattern recognition analysis was used toidentify specific compounds in the data characteristic of the MVOCprofile of each class. The GA sampled key feature subsets, scoredtheir principal component plots, and tracked those samples and/orclasses that were difficult to classify. The boosting routine used thisinformation to steer the population to an optimal solution. After 100generations, the GA identified 8 MVOCs whose PC plot showed cluster-ing of the gas chromatograms on the basis of mold count (see Fig. 2).This result suggests that information about mold count is containedwithin the gas chromatograms of these air samples.
Table 3 shows the results of a K-NN classification study for the8 MVOCs identified by the pattern recognition GA. Each profile wasclassified according to a majority vote of its K-nearest neighbors. Foreach sample, Euclidean distances were computed between it andevery other sample in the data set. These distances were arrangedfrom smallest to largest to define the samples' nearest neighbors.Based on the class label of amajority of the samples' K-nearest neighbors,each sample was assigned to one of the three classes in the data set. Theoverall classification success rate, calculated over the entire set of pointsusing the 1-NN and 3-NN classification rule, indicated a high degree ofclustering of the air samples based on the mold count. Only 2 sampleswere misclassified using the 1-NN classification rule and 5 samples bythe 3-NN classification rule.
The 8 VOCs identified by the pattern recognition GA were selectedfor further study using a technique known as cross validation [27] tosimulate the ability of the descriptors (i.e., compounds) to predict themold count exposure of an unknown air sample. Twenty-nine sets ofVOC profiles were developed by random selection, where each training
Table 2Bioaerosol data.
Mold count Number of samples
DG18 MEA
Low 20 22Medium 5 7High 33 29
set consisted of 56 MVOC profiles and the corresponding prediction setcontained the remaining 2 profiles. Each profile was only present in oneof the 29 prediction sets generated. The training sets were analyzed bythree classificationmethods [28,29]: linear discriminant analysis (LDA),quadratic discriminant analysis (QDA), and a 3-layer back propagationneural network (BPNN) using a sigmoid transfer function. The moldcount exposure of the samples in the corresponding prediction setwas determined using these trained models. Table 4 summarizes theresults of the validation study. High classification success rates wereobtained for both high and low mold count exposures suggesting thata distinct VOC profile representative of the MVOCs which could bedifferentiated from the blank was identified by the pattern recognitionmethodology. For moderate mold count exposure, the classificationsuccess rates were low with the misclassified VOC profiles assigned tothe low mold count exposure class. This indicates that problems existwith differentiating background from VOCs of air samples collected inindoor environments with moderate mold counts.
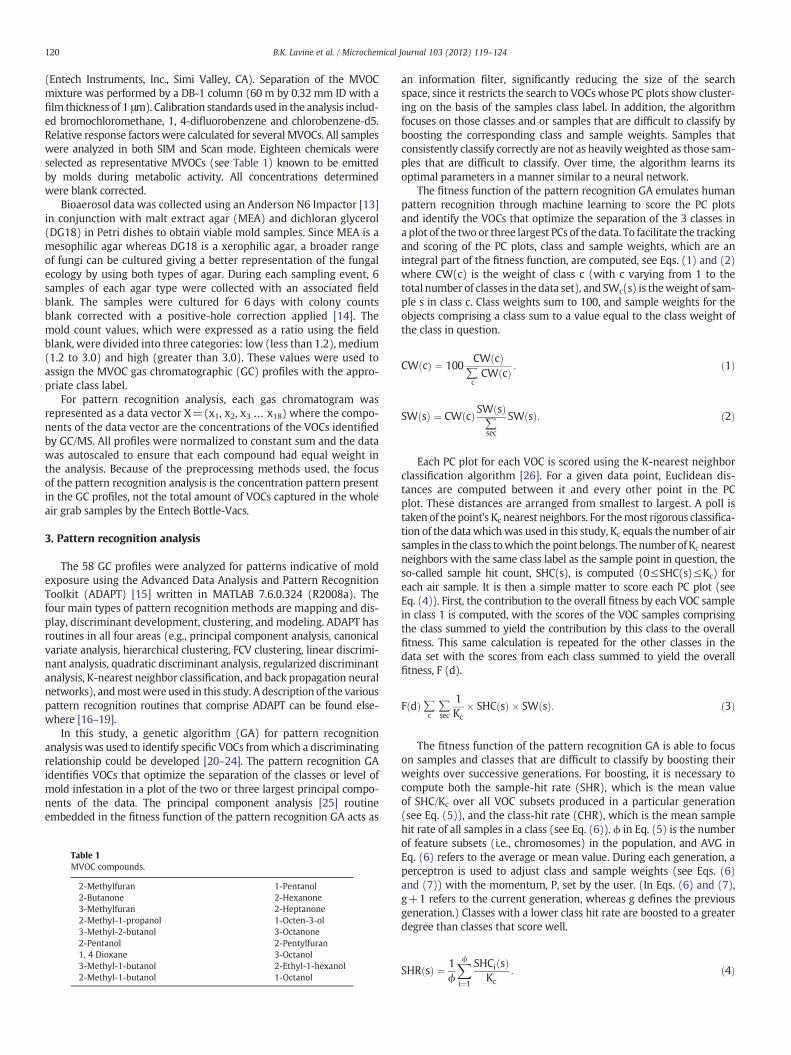
The 58 gas chromatograms from the MEA data set were also ana-lyzed using pattern recognition methods. Fig. 3 shows a plot of thetwo largest principal components of the 58 air samples and 18
Fig. 2. Plot of the two largest principal components of the 8 VOCs identified by the pat-tern recognition GA for DG18. Each air sample is represented as a point in the plot. 1 =low mold count exposure, 2 = moderate mold count exposure, and 3 = high moldcount exposure.
-6 -4 -2 0 2 4 6 8-4
-3
-2
-1
0
1
2
3
4
5
6
1 1
1 1
1 1 1
1
1 1
1 1 1 1
1 1 1
1
1 1 1
1 2 2
2 2
2 2 2
3 3
3
3 3
3 3
3 3
3
3 3
3 3
3 3 3 3
3
3 3
3
3
3
3 3
3 3
3
3
PC 1
PC
2
Fig. 3. Plot of the two largest principal components of the 18 VOCs for MEA. Each airsample is represented as a point in the plot. 1 = lowmold count exposure, 2=moderatemold count exposure, and 3 = high mold count exposure.
-2 -1 0 1 2 3-2
-1
0
1
2
3
1 1
1 1 1 1
1 1
1
1
1
1
1 1 1 1
1
1
1 1
1
1
2
2
2 2
2
2 2 3
3 3 3 3 3 3 3 3 3
3 3
3 3 3 3
3 3 3
3 3
3
3
3
3
3
3 3 3
3
PC 1
PC
2
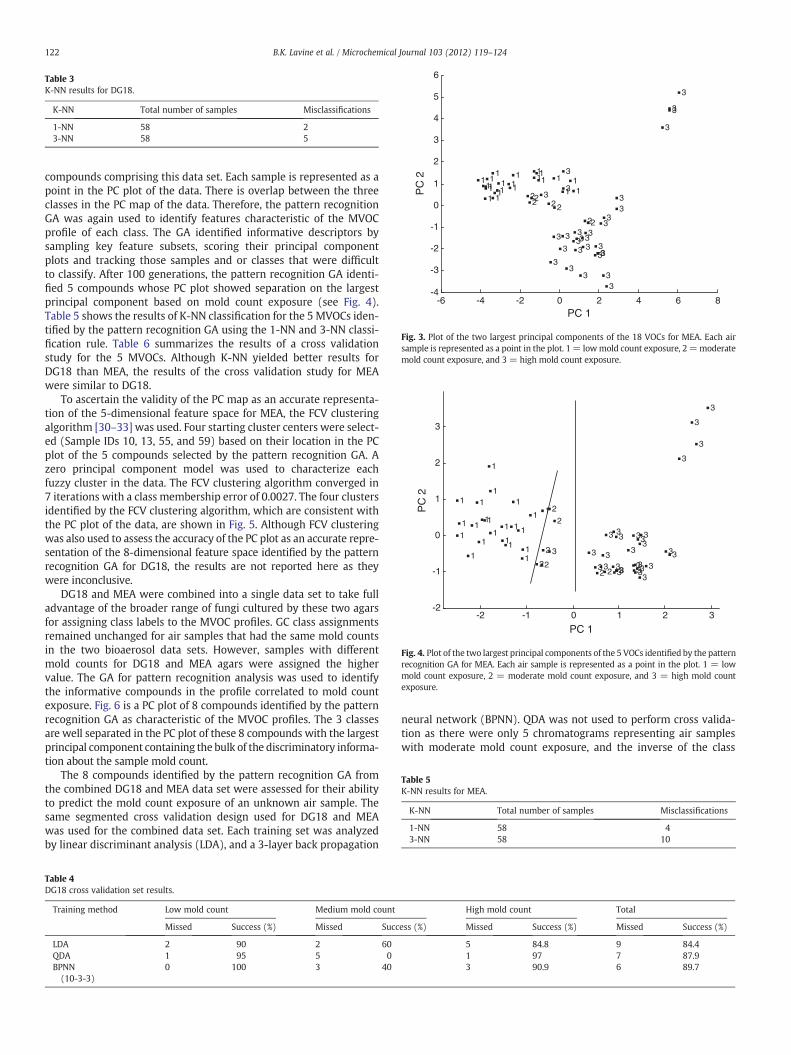
Fig. 4. Plot of the two largest principal components of the 5 VOCs identified by the patternrecognition GA for MEA. Each air sample is represented as a point in the plot. 1 = lowmold count exposure, 2 = moderate mold count exposure, and 3 = high mold countexposure.
Table 5K-NN results for MEA.
K-NN Total number of samples Misclassifications
1-NN 58 43-NN 58 10
Table 3K-NN results for DG18.
K-NN Total number of samples Misclassifications
1-NN 58 23-NN 58 5
122 B.K. Lavine et al. / Microchemical Journal 103 (2012) 119–124
compounds comprising this data set. Each sample is represented as apoint in the PC plot of the data. There is overlap between the threeclasses in the PC map of the data. Therefore, the pattern recognitionGA was again used to identify features characteristic of the MVOCprofile of each class. The GA identified informative descriptors bysampling key feature subsets, scoring their principal componentplots and tracking those samples and or classes that were difficultto classify. After 100 generations, the pattern recognition GA identi-fied 5 compounds whose PC plot showed separation on the largestprincipal component based on mold count exposure (see Fig. 4).Table 5 shows the results of K-NN classification for the 5 MVOCs iden-tified by the pattern recognition GA using the 1-NN and 3-NN classi-fication rule. Table 6 summarizes the results of a cross validationstudy for the 5 MVOCs. Although K-NN yielded better results forDG18 than MEA, the results of the cross validation study for MEAwere similar to DG18.
To ascertain the validity of the PC map as an accurate representa-tion of the 5-dimensional feature space for MEA, the FCV clusteringalgorithm [30–33] was used. Four starting cluster centers were select-ed (Sample IDs 10, 13, 55, and 59) based on their location in the PCplot of the 5 compounds selected by the pattern recognition GA. Azero principal component model was used to characterize eachfuzzy cluster in the data. The FCV clustering algorithm converged in7 iterations with a class membership error of 0.0027. The four clustersidentified by the FCV clustering algorithm, which are consistent withthe PC plot of the data, are shown in Fig. 5. Although FCV clusteringwas also used to assess the accuracy of the PC plot as an accurate repre-sentation of the 8-dimensional feature space identified by the patternrecognition GA for DG18, the results are not reported here as theywere inconclusive.
DG18 and MEA were combined into a single data set to take fulladvantage of the broader range of fungi cultured by these two agarsfor assigning class labels to the MVOC profiles. GC class assignmentsremained unchanged for air samples that had the same mold countsin the two bioaerosol data sets. However, samples with differentmold counts for DG18 and MEA agars were assigned the highervalue. The GA for pattern recognition analysis was used to identifythe informative compounds in the profile correlated to mold countexposure. Fig. 6 is a PC plot of 8 compounds identified by the patternrecognition GA as characteristic of the MVOC profiles. The 3 classesare well separated in the PC plot of these 8 compounds with the largestprincipal component containing the bulk of the discriminatory informa-tion about the sample mold count.
The 8 compounds identified by the pattern recognition GA fromthe combined DG18 and MEA data set were assessed for their abilityto predict the mold count exposure of an unknown air sample. Thesame segmented cross validation design used for DG18 and MEAwas used for the combined data set. Each training set was analyzedby linear discriminant analysis (LDA), and a 3-layer back propagation
Table 4DG18 cross validation set results.
Training method Low mold count Medium mold count
Missed Success (%) Missed Succ
LDA 2 90 2 60QDA 1 95 5 0BPNN(10-3-3)
0 100 3 40
neural network (BPNN). QDA was not used to perform cross valida-tion as there were only 5 chromatograms representing air sampleswith moderate mold count exposure, and the inverse of the class
High mold count Total
ess (%) Missed Success (%) Missed Success (%)
5 84.8 9 84.41 97 7 87.93 90.9 6 89.7

Table 6MEA cross validation set results.
Training method Low mold count Medium mold count High mold count Total
Missed Success (%) Missed Success (%) Missed Success (%) Missed Success (%)
LDA 2 90.91 4 57.14 3 89.7 9 84.75QDA 0 100 5 28.57 1 96.6 6 89.7BPNN(10-3-3)
2 90.91 2 71.43 2 93.1 6 89.7
-2 -1 0 1 2 3-2
-1
0
1
2
3
1 1
1 1 1 1
1 1
1
1
1
1
1 1 1 1
1
1
1 1
1
1
2
2
2 2
2
2 2 3
3 3 3 3 3 3 3 3 3
3 3
3 3 3 3
3 3 3
3 3
3
3
3
3
3
3 3 3
3
PC 1
PC
2
Cluster 1
Cluster 2
Cluster 3
Cluster 4
Fig. 5. The samples comprising each cluster identified by the FCV clustering algorithmare circled and shown in the PC plot of the 5 VOCs that were identified by the patternrecognition GA for MEA. Each air sample is represented as a point in the plot. 1 = lowmold count exposure, 2 = moderate mold count exposure, and 3 = high mold countexposure.
-3 -2 -1 0 1 2 3 4-3
-2
-1
0
1
2
3
4
5
6
1 1
1
1 1 1 1
1 1
1
1 1 1
1 1
1
1 1
1 1 1
1 2 2
2 2 2
3
3
3 3
3 3
3
3
3 3
3
3
3 3 3 3
3 3
3 3 3 3
3
3
3 3 3
3
3 3
3
PC 1
PC
2
Fig. 6. Plot of the two largest principal components of the 8 VOCs identified by the patternrecognition GA for DG18-MEA. Each air sample is represented as a point in the plot. 1 =low mold count exposure, 2 = moderate mold count exposure, and 3 = high moldcount exposure.
Table 7DG18-MEA cross validation set results.
Training method Low mold count Medium mold count
Missed Success (%) Missed Succ
LDA 2 90.91 1 80BPNN(10-3-3)
0 100 0 100
123B.K. Lavine et al. / Microchemical Journal 103 (2012) 119–124
variance–covariance matrix cannot be directly computed from thedata when the number of observations in a class is less than the num-ber of measurements used to characterize the class. Table 7 summa-rizes the results of the validation study for LDA and BPNN. All GCprofiles were correctly classified using a back propagation neural net-work. As for LDA, the assumption of equal class covariance, which wasassessed by computing the determinant of the variance–covariancematrix for each class, did not hold for this data. Therefore, it is notsurprising that LDA did not perform as well as the neural networkwhich does not utilize the class covariance matrix in the developmentof decision surfaces to classify profile data.
5. Conclusions
A distinct profile indicative of MVOCs was developed from the airsampling data that could be readily differentiated from the blank forboth high mold count and moderate mold count exposure samples.However, these results should be viewed as preliminary due to thesmall number of air samples from moderate mold count exposureenvironments. Future studies will also need to be undertaken inother locales to further assess the validity of the proposed method.
Acknowledgments
The authors thank Entech Instruments for providing samples andJulie Choiniere, Madison Quinn, and Cristina Gauthier at Entech forsample analysis. Alan Rossner and Ryan LeBouf thank the Center forthe Environment and Clarkson University for their support, andBarry Lavine and Nikhil Mirjankar acknowledge the generous supportof Oklahoma State University.
References
[1] T.G. Lee, Health symptoms caused by molds in a courthouse, Arch. Environ.Health 58 (2003) 442–446.
[2] M.R. Gray, J.D. Thrasher, R. Crago, R.A. Madison, L. Arnold, A.W. Campbell, A.Vojdani, Mixed mold mycotoxicosis: immunological changes in humans follow-ing exposure in water-damaged buildings, Arch. Environ. Health 58 (2003)410–420.
[3] F. Fung, D. Tappen, G. Wood, Alternaria-associated asthma, Appl. Occ. Environ.Hyg. 15 (2000) 924–927.
[4] P. Carrer, M. Maroni, D. Alcini, D. Cavallo, Allergens in indoor air: environmentalassessment and health effects, Sci. Total Environ. 270 (2001) 33–42.
[5] U. Gehring, J. Douwes, G. Doekes, A. Koch, W. Bischof, B. Fahlbusch, K. Richter, H.Wichmann, J. Heinrich, β(1-3)-Glucan in house dust of German homes: housingcharacteristics, occupant behavior, and relations with endotoxins, allergens andmolds, Environ. Health Perspect. 109 (2001) 139–144.
[6] R. Savilahti, J. Uitti, P. Laippala, T. Husman, P. Roto, Respiratory morbidity amongchildren following renovation of water-damaged school, Arch. Environ. Health 55(2000) 405–410.
High mold count Total
ess (%) Missed Success (%) Missed Success (%)
0 100 3 94.90 100 0 100
124 B.K. Lavine et al. / Microchemical Journal 103 (2012) 119–124
[7] J. Bunger, G. Westphal, A. Monnich, B. Hinnendahl, E. Hallier, M. Muller, Cytotox-icity of occupationally and environmentally relevant mycotoxins, Toxicology 202(2004) 199–211.
[8] J.D. Spengler, J.K. Jaakkola, H. Parise, B.A. Katsnelson, L.I. Privalova, A.A. Kosheleva,Housing characteristics and children respiratory health in the Russian Federation,Am. J. Public Health 94 (2004) 657–662.
[9] H.A. Burge, Fungi: toxic killers or unavoidable nuisance, Ann. Allergy AsthmaImmunol. 87 (2001) 52–56.
[10] B. K. Lavine, N. Mirjankar, R. LeBouf, and A. Rossner, “Prediction of mold contam-ination from microbial volatile organic compound profiles using solid phasemicroextraction and gas chromatography/mass spectrometry,” MicrochemicalJournal, in press
[11] R.L. LeBouf, S.A. Schuckers, A. Rossner, Preliminary assessment of a model topredict mold contamination based on microbial volatile organic compoundprofiles, Sci. Total Environ. 408 (2010) 3648–3653.
[12] R.F. LeBouf, C. Casteel, A. Rossner, Evaluation of air sampling technique for assessinglow-level volatile organic compounds in indoor environments, J. Air & WasteManagement Assoc 60 (2010) 156–162.
[13] C. Yang, P.A. Heinsohn, Sampling and Analysis of Indoor Microorganisms, JohnWiley & Sons, New York, 2007.
[14] A. Andersen, New sampler for the collection, sizing, and enumeration of viableairborne particles, J. Bacteriol. 76 (1958) 471–484.
[15] B.K. Lavine, N. Mirjankar, R.K. Vander Meer, Analysis of chemical signals in red fireants by gas chromatography and pattern recognition techniques, Talanta 83(2011) 1308–1316.
[16] K. Varmuza, P. Filzmoser, Introduction to Multivariate Statistical Analysis inChemometrics, CRC Press, Boca Raton, FL, 2009.
[17] M. Otto, Chemometrics — Statistics and Computer Applications in AnalyticalChemistry, Wiley-VCH, New York, 1999.
[18] K. Fukunaga, Introduction to Statistical Pattern Recognition, 2nd Edition AcademicPress, New York, 1990.
[19] G.L. McLachlan, Discriminant Analysis and Statistical Pattern Recognition, WileyInterscience, NY, 1992.
[20] B.K. Lavine, N. Mirjankar, S. Ryland, M. Sandercock, Wavelets and genetic algo-rithms applied to search prefilters for spectral library matching in forensics,Talanta 87 (2011) 46–52.
[21] J. Karasinski, L. White, Y. Zhang, E. Wang, S. Andreescu, O.A. Sadik, B. Lavine, M.N.Vora, Detection and identification of bacteria using antibiotic susceptibility and amulti-array electrochemical sensor with pattern recognition, Biosens. Bioelectron.22 (2007) 2643–2649.
[22] J. Karasinski, S. Andreescu, O.A. Sadik, B. Lavine, M.N. Vora, Multiarray sensorswith pattern recognition for the detection, classification, and differentiation ofbacteria at subspecies and strain levels, Anal. Chem. 77 (2005) 7941–7949.
[23] B.K. Lavine, C.E. Davidson, W.T. Rayens, Machine learning based pattern recognitionapplied tomicroarray data, Comb. Chem. High Throughput Screen. 7 (2004) 115–131.
[24] B.K. Lavine, C.E. Davidson, C. Breneman, W. Katt, Electronic Van der Waals surfaceproperty descriptors and genetic algorithms for developing structure–activitycorrelations in olfactory databases, J. Chem. Inf. Science 43 (2003) 1890–1905.
[25] I.T. Jolliffe, Principal Component Analysis, Springer Verlag, New York, 1986.[26] J.T. Tou, R.C. Gonzalez, Pattern Recognition Principles, Addison Wesley Publishing
Co., Reading, MA, 1974.[27] S. Arlot, A survey of cross-validation procedures for model selection, Stat. Surv. 4
(2010) 40–79.[28] M. James, Classification Algorithms, Wiley Interscience, NY, 1985.[29] J. Zupan, J. Gasteiger, Neural Networks in Chemistry and Drug Design, 2nd Edition
Wiley-VCH, New York, 1999.[30] J.C. Bezdek, C.R. Coray, R.W. Gunderson, J.D. Watson, Detection and characterization
of cluster substructure II, SIAM J. Appl. Math. 40 (1981) 358–372.[31] B.K. Lavine, L. Morel, R.W. Gunderson, J.H. Han, A. Stine, FCV-false color data
imaging: a new pattern recognition technique for analyzing gas chromatographicprofile data, Microchem. J. 41 (1990) 288–297.
[32] B.K. Lavine, H. Mayfield, A. Stine, X. Qin, Gas chromatography—pattern recognitiontechniques in pollution monitoring, Anal. Chim. Acta 277 (1993) 357–368.
[33] B.K. Lavine, A.B. Stine, H. Mayfield, R. Gunderson, Application of high-resolutioncomputer graphics to pattern recognition analysis, J. Chem. Inf. Comp. Sci. 33(1993) 826–834.