prediction of settlement of a six story building in...
TRANSCRIPT

________________________________________________________________________________ Majalah Ilmiah UKRIM Edisi 1/th XVII/2012 1
PREDICTION OF SETTLEMENT OF A SIX STORY BUILDING IN
KATHMANDU USING FINITE DIFFERENCE ANALYSIS
_________________________________________________________________________
Handali, S 1)
, Maharjan, S 2)
1)
Jurusan Teknik Sipil Universitas Kristen Immanuel Yogyakarta
e-mail : [email protected] 2)
Geotechnical Engineer at Macquarie Geotechnical Pty Ltd, NSW, Australia
ABSTRACT
Makalah ini memuat hasil dari program finite difference yang
dikembangkan untuk memprediksi penurunan gedung enam tingkat yang dibangun di atas
endapan lempung organik di Kalimati, Kathmandu, Nepal. Program tersebut dibuat
berdasarkan teori konsolidasi satu dimensi dari Terzaghi dengan mengikut sertakan faktor
pembebanan bertahap sesuai dengan sejarah pembebanan gedung yang sesungguhnya dan
kondisi tanah yang berlapis. Hasil akhir dari program adalah kurva penurunan dengan
waktu. Hasil tersebut kemudian dibandingkan dengan hasil pengukuran penurunan yang
dilakukan setiap minggu terhadap gedung tersebut di tujuh lokasi kolom utama bangunan,
mulai dari hari ke 136 sampai dengan hari ke 441 dihitung dari awal pembangunan.
Hasil analisa menunjukkan bahwa sampai dengan hari ke 441 penurunan
bangunan mencapai 107 mm yang terjadi pada tingkat derajat konsolidasi rata-rata
sebesar 42% dari penurunan maximum tanah yang diprediksi akan mencapai 254 mm.
Dibandingkan dengan hasil pengukuran penurunan di ketujuh lokasi kolom-kolom terluar
bangunan dapat dikatakan bahwa program finite difference yang ditujukan untuk
memprediksi penurunan di titik pusat berat bangunan menunjukkan hasil yang konsisten
dengan besar penurunan maupun pola penurunan yang diamati pada bangunan tersebut
sampai dengan akhir pengamatan penurunan di hari ke 441.
Introduction
Settlement records of a six story building founded on Kalo Mato, an organic soil
deposit in Kalimati area in Kathmandu, have been presented in an earlier paper by Handali
and Maharjan (2011). Settlement readings from the building were taken since its early
stage of construction, namely after the columns at the basement have been cast until the
completion of the last floor, covering a period of about ten months. Readings were taken
using auto level instrument on markers placed on seven reinforced concrete columns
located at the perimeter of the basement. In this paper the result of settlement prediction of

________________________________________________________________________________ Majalah Ilmiah UKRIM Edisi 1/th XVII/2012 2
the building using finite difference analysis is presented. The result of the prediction is
them compared with the settlement records.
Geotechnical properties of the subsoil at the site have been obtained from soil
investigation carried out by Central Material Testing Laboratory (CMTL), Institute of
Engineering, Tribhuvan University in 2005. Soil investigation work was carried out in
conjunction with the planning and construction of the six story building. Three boreholes
were drilled to 30 m depth, out of which disturbed and undisturbed samples were retrieved
and tested in the lab. Of these boreholes, the borehole located at the center of area of the
building was used to provide data for part of the research of Upadhyay (2005) for his
Master‟s thesis and therefore more undisturbed samples were taken from this borehole
compared to the other two boreholes. The samples from this borehole were also subjected
to tests to find the organic content of the soil.
The finite difference analysis was developed for 1-D consolidation settlement. The
program utilized Microsoft Office‟s Excel program. The analysis included varying load
history following the real loading history of the building, multi – layered soil and that the
initial pore pressure distribution with depth was equal to that of the vertical stress based on
elastic theory. Immediate and secondary settlements were ignored.
Nature of Subsoil
The soil profile at the construction site is presented in Fig 1. The sub-soil was entirely
organic clay with organic content found to increase with depth, ranging between 5% at the
top part and 13% at the lower part. Slight variations of the colour and index properties of
the subsoil could be observed between the top, middle and bottom parts of the borehole. At
the top to a depth of 6 m the clay was grayish brown in colour. Underneath it the colour
changed to dark gray up to about 15 m. The lower part of the soil up to 30 m depth
consisted of an even darker layer. Handali et al (2007) showed that the soil properties were
affected by the amount of organic content. Water content, liquid limit, Plasticity Index and
void ratio with the increase of organic content while on the contrary the specific gravity,
bulk density and dry density decrease with the increase in organic content. The
compression index also increases with increasing organic content. Table 1 shows the range
of values of the soil properties, roughly showing the properties of the three soil layers.

________________________________________________________________________________ Majalah Ilmiah UKRIM Edisi 1/th XVII/2012 3
Fig. 1 The Variations of Soil Properties with Depth (Upadhyay, 2005)
Table 1 Range of Soil Properties
Depth,
m
w
%
LL
%
PI
% Gs
gr/cc
d
gr/cc eo Cc
su
KN/m2
0 – 6 40 75 18-25 2.7 1.6 1.12 1.0-1.5 0.25-0.5 79
6 – 15 60 60-80 25 2.5 1.4-1.5 0.75-1 1.5-1.7 0.5-0.7 11-57
15 – 25 75 75-125 > 40 2.45 1.5 < 0.8 > 1.7 > 1 55

________________________________________________________________________________ Majalah Ilmiah UKRIM Edisi 1/th XVII/2012 4
The (e, log v‟) graphs from 1-D consolidation tests conducted on undisturbed samples
taken at depth interval of 3 m can be seen in Fig. 3. Fig. 4 shows the relationship between
coefficient of consolidation and effective vertical stress from the same tests.
Fig. 3 Relationship between Void Ratio and Effective Stress from the Consolidation Tests
(Upadhyay, 2005)
Fig. 4 Variation of cv with and Effective Vertical Stress at Different Depths
3m
6m
9m
12m15m
18m
0.40
0.60
0.80
1.00
1.20
1.40
1.60
1.80
2.00
2.20
2.40
1 10 100 1000
logσv, kN/m2
e3m
6m
9m
12m
15m
18m
0
0.05
0.1
0.15
0.2
0.25
0.3
0.35
1.00 10.00 100.00 1000.00
log (KN/m2)
Cv
(m2 /d
ay)
3m
6m
9m
12m
15m
18m
Depth
________________________________________________________________________________ Majalah Ilmiah UKRIM Edisi 1/th XVII/2012 5
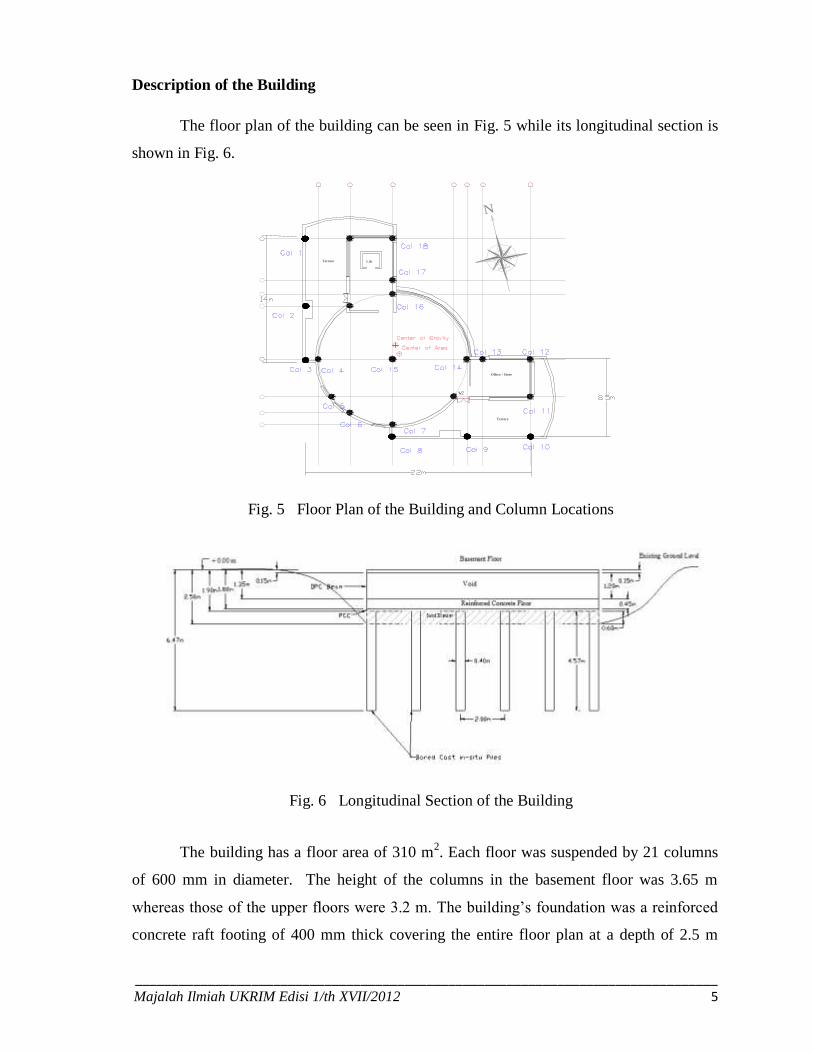
Description of the Building
The floor plan of the building can be seen in Fig. 5 while its longitudinal section is
shown in Fig. 6.
Fig. 5 Floor Plan of the Building and Column Locations
Fig. 6 Longitudinal Section of the Building
The building has a floor area of 310 m2. Each floor was suspended by 21 columns
of 600 mm in diameter. The height of the columns in the basement floor was 3.65 m
whereas those of the upper floors were 3.2 m. The building‟s foundation was a reinforced
concrete raft footing of 400 mm thick covering the entire floor plan at a depth of 2.5 m
Terrace
Office / Store
Terrace
Lift
APPROX
N

________________________________________________________________________________ Majalah Ilmiah UKRIM Edisi 1/th XVII/2012 6
below the original ground surface. The raft was supported by 102 bored piles, placed at a
distance of 2 m from other. Each pile has a diameter of 400 mm and length of 5.4 m.
Below the raft footing was a concrete slab of 100 mm thick, underlain by 600 mm thick
sand layer. Reinforced concrete beams of 1200 mm depth were placed above the raft and a
150 mm thick basement floor was constructed over the beam, creating an empty space of
1.2 m height between the raft footing and the basement floor.
Loading History
The loading history of the building is shown in Fig. 7. The loading chart started
with the removal of overburden due to excavation before the laying of the sand blanket,
taken as day zero i.e, the beginning of loading. Settlement measurement started on
February 21, 2006, 136 days since the laying of the sand blanket. Settlement records were
taken until day 400, which means that the recording covered a period of 364 days.
Fig. 7 Loading History of the Building
Ultimate Consolidation Settlement
The lower boundary of the consolidating layer under the raft was taken as the depth
under the load where the stress level was 10% of the load. Distribution of the vertical
stress under the center of gravity of the building was calculated by means of Newmark‟s
50.00
40.00
30.00
20.00
10.00
0.00
10.00
20.00
30.00
-50 0 50 100 150 200 250 300 350 400
Time (Days)
Lo
ad (
KN
/m2 )
Excavation
sand blanket
PCC
Raft
DPC
Basement floor
Basement col
G.F slab
G.F col column
1st floor slab
6th floor slabStart of settlement record (day 136)

________________________________________________________________________________ Majalah Ilmiah UKRIM Edisi 1/th XVII/2012 7
Chart, from which it was discovered that the lower boundary of the compressed layer was
24 m below the foundation level. The ultimate consolidation settlement was calculated as:
i
oi
H*e1
es
n
i
i (1)
eoi = void ratio prior to reloading, ∆ei = change in void ratio, Hi = thickness of sub-layer
and n = number of sub-layers. ∆ei was determined from the relevant stress change
experienced by the soil as revealed by the (e, log‟) graph in Fig. 3.
The correction factor from Skempton and Bjerrum (1957) was assumed to be 1.
Effect of Piles
As mentioned earlier, bored piles of 5.9 m length were constructed under the raft footing at
a spacing of 2 m between each other. The piles were meant to provide anchoring for the
building against earthquake and to increase the safety factor against bearing capacity
failure by nailing the soil beneath the foundation. The presence of the piles, however,
introduced some complications to the settlement analysis, particularly with regards to the
compressibility of the soil between the piles. The conventional solution to estimate the
settlement of pile group is to treat the pile group as an equivalent raft, the size and location
of the base being determined by the assumption of load transfer mechanism which depends
on the subsoil conditions. Consolidation settlement is then calculated by assuming the
equivalent raft resting on the layer underneath it. The pile-soil within the enclosure of the
pile group is assumed to act as a rigid block, i.e., no settlement occurs within the pile
group. This approach is suitable if the building load is entirely carried by the piles. For the
building in this study, however, the 102 piles carried about 30% of the building load only,
i.e., 70% of the load was transferred by the raft to the soil right beneath it. In addition to
that, the load transferred by the shaft of the piles (which was significantly larger than the
load transferred by the tips) to the surrounding soil was carried by the same soil that also
sustained the vertical load transferred directly by the raft. This led to the conclusion that
the entire load of the building was directly transferred to the subsoil beneath the raft as if
no piles were present.

________________________________________________________________________________ Majalah Ilmiah UKRIM Edisi 1/th XVII/2012 8
Finite Difference Formulation
When loading on compressed later is applied gradually, the dissipation of excess
pore pressure with respect to time under 1-D loading according to Terzaghi is:
t
q
z
uc
t
u2
2
v
(2)
where t
q
is the rate of loading. At any node within the soil layer, Eq. 2 can be expressed
in finite difference form as follows:
For 0 ≤ t ≤ tc
ui,j+1 = ui,j + (ui-1,j + ui+1 – 2ui,j) + j+1 - j (3)
Where, j = load intensity at time j.
j+1 = load intensity at time j +1
tc = end of loading period
The subsoil consisted of three different layers, with boundary between layers at
depths of 6 m and 15 m. The finite difference formula at the boundary nodes:
ui,j+1 = ui,j + '(C1 * ui-1,j + C2 * ui+1 – 2ui,j) + j+1 - j (4)
Where,
2
1
1
2
1
2
1
c
c
k
k1
k
k1
*β'β
v
vx
(5)
C1 = 21
1
kk
k2
(6)
C2 = 21
2
kk
k2
(7)
2
1
1)z(
t.c
v (8)
2
2
2)z(
t.c
v (9)
The coefficients of consolidation cv1 and cv2 were those of two adjacent layers with
k1 and k2 their coefficients of permeability. 1 and 2 were operators of the adjacent layers.

________________________________________________________________________________ Majalah Ilmiah UKRIM Edisi 1/th XVII/2012 9
At the impermeable boundary:
ui,j+1 = ui,j + 2(2ui-1,j – 2ui,j) + j+1 - j (10)
For t > tc
At any node within the soil later:
ui,j+1 = ui,j + (ui-1,j + ui+1 – 2ui,j) (11)
At the boundary of different soil layers:
ui,j+1 = ui,j + '(C1 * ui-1,j + C2 * ui+1 – 2ui,j) (12)
At the impermeable boundary:
ui,j+1 = ui,j + 2(2ui-1,j – 2ui,j) (13)
The finite difference grid involving depth and time variables for the compressed
layer can be seen in Fig. 8.
days were determined to cause β ≤ 0.5 for the solution to converg
Fig. 8 Finite Difference Grid within a Soil layer
The upper surface of the consolidating layer was assumed to be free draining (the
sand layer under the raft) while the lower boundary was impermeable.
Excess pore pressure at each node was calculated for each time interval, resulting in
pore pressure profile across the depth of the compressed soil layer at any particular time.
The average degree of consolidation across the depth of the compressed layer at the
particular time is:
j
j
0 1 2 3 4 5 6 7 8 9
1
2
3
4
5
∆z=
h/m
=
H/m
ui, j
ui+1,j
ui, j-1 ui, j+1
∆t = t / n
Time
Depth
ui-1,j

________________________________________________________________________________ Majalah Ilmiah UKRIM Edisi 1/th XVII/2012 10
o
i
iu
uU 1 (14)
iU and iu = average degree of consolidation and average excess pore at the particular
time, respectively, ou = average of cumulative initial excess pore pressure from the
beginning of consolidation until that particular time. Settlement at any particular time:
fii SUS * (15)
Sf = ultimate consolidation settlement for the stage of load at that particular time.
Selection of Consolidation Parameters
The coefficients of consolidation were determined from Fig. 4. The coefficients of
permeability were calculated as:
k = cv * mv * w (16)
While mv and cv vary with stress level, k was assumed to be constant throughout the
loading. Each mv used in the calculation of settlement at each stage of loading was
determined from void ratio-pressure graph for the relevant stress levels.
Ultimate Consolidation Settlement
Calculation of ultimate consolidation settlement resulted in a settlement of 254 mm
at day 400. The predicted settlement was considerably higher than the limit of maximum
settlement stated by IS Code 1902 -1978, where the maximum settlement is 100 mm for
raft foundation on clay soils. The same limit has been proposed by MacDonald and
Skempton (1955).
Result of Finite Difference Prediction and Comparison with Actual Settlement
Figure 9 depicts graphs showing the variation of excess pore pressure with depth
after the application of major construction load as predicted by the finite difference
analysis. The initial increase in pore pressure was generated by the pressure imposed by
600 mm thick sand blanket. The profile of the initial excess pore pressure was identical
with that of the vertical stress due to the uniformly deposited sand layer. The excess pore
pressure dissipated in upward direction towards the sand layer. The subsequent increase in

________________________________________________________________________________ Majalah Ilmiah UKRIM Edisi 1/th XVII/2012 11
load in the form of 100 mm thick concrete slab resulted in increase in the excess pore
pressure through out the depth of the consolidating layer beyond the remaining excess pore
pressure generated by the sand blanket. The same process was followed stage by stage
until the application of the final construction load, after which the dissipation of excess
pore pressure continued uninterrupted until the end of consolidation. The average degree
of consolidation reaches 98% at 7000 days, or around 19 years after consolidation started,
as indicated by the figure.
Fig. 9 Pore Pressure Profile at Different Stages of Construction Calculated from Finite
Difference Method
Fig. 10 Average Degree of Consolidation
0
5
10
15
20
25
0 5 10 15 20 25 30 35
Excess Pore Pressure (KN/m2)
Dep
th b
elo
w E
xcav
atio
n (
m)
Sand Blanket
PCC
Raft
DPC
Basement Floor
Basement Column
1st floor
4th floor
6th floor
2.5 years
4 years
5.5 years
8.2 years
11 years
19 years
0
5
10
15
20
25
30
35
40
45
0 50 100 150 200 250 300 350 400 450 500
Time (days)
Deg
ree
of C
onso
lidat
ion
(%)

________________________________________________________________________________ Majalah Ilmiah UKRIM Edisi 1/th XVII/2012 12
Figure 10 shows the average degree of consolidation vs. time while Fig. 11 shows
the predicted settlement–time curve. The calculation of excess pore pressure and its rate of
dissipation started with the application of the sand blanket. The analysis predicted that the
sand blanket imposed 6 mm settlement within 10 days, before the 100 mm thick PCC slab
was applied. Though the increase of pore pressure due to the sand blanket was included in
the finite difference analysis, the resulting settlement was omitted in Fig. 11 because it was
not part of the settlement experienced by the structure, which started when the 100 mm
PCC slab was laid.
Fig. 11 Settlement vs. Time from Finite Difference Prediction
Figure 12 shows the settlement records of the building, measured at seven
reinforced concrete columns located at the perimeter of the building. Each column was
identified by a number and the locations of the columns within the building can be seen in
Fig. 5.
Fig. 12 Actual Settlement Record of the Building at Each Column Location
120.00
100.00
80.00
60.00
40.00
20.00
0.00
20.00
40.00
-50 50 150 250 350 450 550
Time (Days)
Se
ttle
me
nt
(mm
)
load
FD predicted
Lo
ad
(K
N/m
2)
Excavation
sand drain
PCC
Raft
G.F slab
1st floor col
Observation Record Started
140.00
120.00
100.00
80.00
60.00
40.00
20.00
0.00
20.00
40.00
-25 25 75 125 175 225 275 325 375 425 475
Time (Days)
Se
ttle
me
nt
(mm
)
col 1
col 3
col 5
col 6
col 8
col 10
col 12
load
Lo
ad
(K
N/m
2)
day
165
day
192
day
260
day
310
day
325
day
136

________________________________________________________________________________ Majalah Ilmiah UKRIM Edisi 1/th XVII/2012 13
Settlement observation commenced on day 136 after the laying of the sand blanket,
hence no record of settlement was yet available for the period between the casting of 100
mm thick concrete slab at day 10 (the first load on the subsoil which was due to the
structure), until day 136. To compensate the absence of settlement readings, the result of
the finite difference prediction (shown in Fig. 11) between day 10 and 136 was „patched‟ to
the initial parts of all the settlement records. The amendment to the initial readings resulted
in an addition of 21 mm settlement, assumed to be uniformed for al the settlement points.
Figure 13 shows the adjusted settlement curves, along with the entire settlement curve
predicted by the finite difference analysis until day 441, the last day of the settlement
readings. The prediction shows a settlement of 107 mm at day 441, which corresponded
average degree of consolidation of 42% (Fig. 10).
Fig. 13 Modified Actual Settlement and Predicted Settlement
It has been mentioned earlier that the settlement prediction was made for the center
of gravity of the building. Since the center of gravity nearly coincided with the center of
area of the building (see Fig. 5), it could be assumed the settlement curve represented
settlement at the center of area of the building. The settlement prediction therefore, was
meant to indicate more or less the average settlement of the building. In Fig. 13 it can be
observed that predicted settlement curve was found nested among those of the settlement
records obtained from the different locations of the building around its center of area. It
could be said that that the result of prediction satisfied the requirement that it should show
160
140
120
100
80
60
40
20
0
20
40
-25 25 75 125 175 225 275 325 375 425 475Time (Days)
Se
ttle
me
nt
(mm
)
col 1
col 3
col 5
col 6
col 8
col 10
col 12
load
FD Predicted
Lo
ad
(K
N/m
2)
FD Predicted
day
165
day
192
day
260
day
310
day
325
day
136

________________________________________________________________________________ Majalah Ilmiah UKRIM Edisi 1/th XVII/2012 14
the average of the settlement measured at the different points of the building, at least
qualitatively.
Figure 14 shows the settlement of Columns 1, 10 and that from the finite difference
prediction. The positions of Columns 1 and 10 were diametrically opposite from each
other and almost at the same distance from the building‟s center of area. As pointed out by
Handali and Maharjan (2011), the settlement readings suggested that during the
construction the building tilted more or less along the line of Column 1 – Column 10, with
axis of rotation in the northeast-southwest direction passing through the center of gravity (≈
center of area) of the building. The differential settlement between those two columns on
day 441 was 50 mm. This requires that the settlement of the center of gravity of the
building should be somewhere between those shown by the two measuring points, in other
words the curve of the predicted settlement should be found between the curves of the
columns. As can be observed in Fig. 14, the predicted curve was found to be between the
graphs of Column 1 and Column 10. This indicates that the result of the prediction was at
least consistent with the results of settlement observations of the two columns, both in the
range of values as well as the pattern of the settlement in the entire building.
Fig. 14 Comparison of Settlement Curves of Columns 1 and 10
with the Settlement Curve from the Prediction
The same consistency between the result of the prediction and observation can be
seen in Figure 15, showing the settlements of Columns 5 and 6. These two columns were
located more or less along the axis of rotation of the tilt which passed through the center of
140.00
120.00
100.00
80.00
60.00
40.00
20.00
0.00
20.00
40.00
-25 25 75 125 175 225 275 325 375 425 475
Time (Days)
Sett
lem
en
t (m
m)
col 1
col 10
load
FD Predicted
Lo
ad
(K
N/m
2)
FD Predicted
day
165
day
192
day
260
day
310
day
325
day
136

________________________________________________________________________________ Majalah Ilmiah UKRIM Edisi 1/th XVII/2012 15
gravity (or center of area) of the building. It should be expected that those two columns
would have settlements which were more or less similar to that of the center of the
building. This figure shows that the predicated curve was reasonably close to those
measured at the two columns. This reinforces the earlier finding that the result of the
prediction was consistent in terms of the amount of settlement as well as the pattern of the
settlement observed on the entire building.
Fig. 15 Comparison of Settlement Curves of Columns 5 and 6
with the Settlement Curve from the Prediction
Acknowledgement
The authors want to thank Civil Homes Pvt. Ltd for allowing settlement
measurements to be conducted on the Civil Saving and Credit Co-operative Limited Head
Office in Kalimati for this research. Note of thanks was also given to Mr. Him Bandhu
Upadhyay and to Central Material Testing Laboratory, Institute of Engineering, Pulchowk
Campus, Tribhuvan University, for providing the soil investigation data used for the
development of the finite difference analysis.
References
Central Material Testing Laboratory, IOE, TU, 2005, “Final Report on Soil Investigation
Work for Proposed Civil Saving and Credit Co-operative Limited Head Office, Soaltee
Mode, Kalimati, Kathmandu,” Unpublished Report.
Handali, S., Maharjan, S, 2011, Settlement Observation of a Six-Story Building in
Kathmandu, Majalah Ilmiah UKRIM, Edisi 1/th XVI/2011
160.00
140.00
120.00
100.00
80.00
60.00
40.00
20.00
0.00
20.00
40.00
-25 25 75 125 175 225 275 325 375 425 475Time (Days)
Se
ttle
me
nt
(mm
)
col 5
col 6
load
FD Predicted
Lo
ad
(K
N/m
2)
FD Predicted
day
165
day
192
day
260
day
310
day
325
day
136

________________________________________________________________________________ Majalah Ilmiah UKRIM Edisi 1/th XVII/2012 16
Handali, S., Khadka, P., Neupane, R, Upadhayay, H.B., Acharya, G., 2007, Pengaruh
Kandungan Organik pada Besaran Indeks Tanah Kalo Mato, di Kathmandu, Nepal,
Majalah Ilmiah UKRIM, Edisi 2/th XII, 2007
MacDonald, D.H., and A.W. Skempton, 1955, “A Survey of Compression between
Calculated and Observed Settlements of Structures on Clay,” Conf. on Correlation
of Calculated and Observed Stresses and Displacements, ICE London, pp. 318-
337.
Skempton, A.W., and Bjerrum, L., 1957, A Contribution to the Settlement Analysis of
Foundations on Clay, Geotechnique, 7, 1968-78.
Upadhyay, H.B. 2005, “Geotechnical Properties of Some Organic Deposits in
Kathmandu Valley,” M.Sc Thesis, Institute of Engineering, Pulchowk, Laitpur.