prediction of the squash loads of concrete-filled tubular...
TRANSCRIPT

Thin-Walled Structures 49 (2011) 85–93
Contents lists available at ScienceDirect
Thin-Walled Structures
0263-82
doi:10.1
n Corr
E-m
journal homepage: www.elsevier.com/locate/tws
Prediction of the squash loads of concrete-filled tubular section columns withlocal buckling
Young Bong Kwon a,n, Sang Jung Seo a, Doo Won Kang b
a Department of Civil Engineering, Yeungnam University, Gyongsan 712-749, Republic of Koreab Department of Civil Engineering, Lotte Construction and Consulting Co. Ltd., Seoul 137-723, Republic of Korea
a r t i c l e i n f o
Article history:
Received 1 February 2010
Accepted 23 August 2010Available online 15 September 2010
Keywords:
Circular hollow steel (CHS) sections
Concrete-filled tubular (CFT) sections
Squash load
Ultimate strength
Compression tests
Diameter to thickness ratio
Width to thickness ratio
Direct strength method
31/$ - see front matter & 2010 Elsevier Ltd. A
016/j.tws.2010.08.009
esponding author. Tel.: +82 11 802 2418; fax
ail address: [email protected] (Y. Bong Kwon
a b s t r a c t
This paper describes a series of compression tests of circular hollow steel (CHS) sections and circular
concrete-filled tubular (CFT) sections. The diameter to thickness ratios of the test specimens ranged 45–140.
This range was set to investigate the effect of local buckling in the circular steel skin on the ultimate
strength of CFT columns. The confining effect against filled-in concrete was also studied. A squash load
formula for CFT stub columns is proposed to account for the post-local-buckling strength of steel skin. The
ultimate strength of steel skin was predicted by a kind of Direct Strength Method (DSM). The proposed DSM
does not require the computation of the effective area of the steel skin, but uses the gross area of the steel
skin and the design strength formula based on various test results. The compressive strength formula of the
filled-in concrete accounting for the strength ratio of steel skin to filled-in concrete is also proposed to
consider the increase in compressive strength of the filled-in concrete, due to the confining effect of the
steel skin. The design strengths of CFT columns were compared with the test results for verification.
& 2010 Elsevier Ltd. All rights reserved.
1. Introduction
The attractive way to solve the local instability and the lowductility of thin hollow steel tubes is filling them with concrete.The concrete-filled tubular (CFT) composite sections are beingwidely used as columns of high-rise buildings and bridge piers inrecent years. Since the steel skin confines the filled-in concretetri-axially and the concrete resists against the inward deformationof steel skin, both steel and concrete contribute to the strengthenhancement of the CFT column.
The CFT columns are susceptible to local buckling of the steelskin, which in many cases is very thin. The post-local-bucklingstrength of the steel skin and the concrete compressive strengthdue to tri-axial confinement by the locally buckled steel skin, bothof which contribute to the ultimate strength of CFT columns, needto be estimated accurately to predict the ultimate strength of CFTcolumns reasonably. The confining effect of a steel skin canincrease the concrete compressive strength beyond 0.85Fc.However, since micro-cracking can reduce the tri-axial effect,Chen and Atusta [1] and Bradford [2] have conservativelysuggested that the effective strength of concrete in a steel casingshould not exceed 0.85Fc. The Eurocode4 (2004) [3] has theprovision, where 1.0Fc can replace 0.85Fc for the concrete-filledhollow sections and some additional amount of strengths canbe considered for circular composite tubes, and the AISC
ll rights reserved.
: +82 53 810 4622.
).
specifications (2005) [4] applies 0.85Fc as the limit for rectangularconcrete-filled tubular steel sections and 0.95Fc for circularconcrete-filled tubular steel sections.
In this paper, a series of compression tests of circular hollow steel(CHS) sections and circular concrete-filled tubular sections wereconducted. Since the steel tubes for CFT columns are usually thin,they may be subjected to the effects of local buckling. Local bucklingof the steel skin occurs before the critical stress of the steel skinreaches the yield stress; in such a case, post-local-buckling can affectthe ultimate strength of the composite sections. The diameter-thickness ratio of the test specimens ranged 45–140; this range wasselected to study the correlation between the compressive strengthof the filled-in concrete and the local buckling stress of the circularsteel skin. Simple ultimate strength formulae for the steel skin weredeveloped to account for the local buckling stress and the post-local-buckling strength reserve. While the post-local-buckling strengthreserve may be included in the current design specifications such asAASHTO specifications (2007) [5], AISC specifications (2005) [4],Eurocode4 (2004) [3] by the Effective Width Method, the strengthformula for the Direct Strength Method [6,7] proposed does not needto compute the effective area of the steel skin, and uses the gross areaof the steel skin. The strength formula uses the elastic local bucklingstress of the steel skin, which can be computed by a rigorous analysisprogram or theoretical equations, and the ultimate strength formulabased on the various test results. A design compressive strengthformula for the filled-in concrete is also proposed to account for thestrength ratio of the steel skin and filled-in concrete and the localbuckling stress of the steel skin. The formula proposed canconsequently account for the increase in compressive strength of

Y.B. Kwon et al. / Thin-Walled Structures 49 (2011) 85–9386
the filled-in concrete, due to the confining effect of the steel skinagainst the outward deformation of filled-in concrete. The designstrengths of circular and rectangular CFT columns predicted by theproposed strength formulae were compared with the currentspecifications and previous test results.
2. Material and section properties
The tensile coupon test was performed to determine themechanical properties of the test sections. The tensile coupon testresults showed that the yield and the ultimate stresses werehigher than the nominal strengths. The average values of stressesand strains are summarized in Table 1. The average yield stress ishigher than the nominal yield stress by approximately 10.4% andthe average ultimate tensile stress is higher than the nominaltensile stress by 18.5%. To determine the compressive strength ofthe filled-in concrete, 6 cylinders (10 cm in diameter�20 cm inheight) were cast from the same batch concrete used as filled-inconcrete for concrete-filled composite sections. The measuredaverage compressive strength and Young’s Modulus of concretewere 25.4 and 23,690 MPa, respectively.
A series of compression tests were performed on the circularhollow steel (CHS) sections and circular concrete-filled tubular(CFT) sections to investigate the structural behavior and perfor-
Table 1Material properties of steel.
Steel Fy(MPa) Fu(MPa) ey eu Es(MPa)
265.0 474.0 0.0016 0.241 205,700
Fig. 1. Test s
Table 2Geometries of CHS and CFT sections.
Specimens D(mm) t(mm) D/t L/r
SC-47 151.0 3.2 47.2 11.9
SC-47a 150.0 3.2 47.1 11.9
SC-62 199.0 3.2 62.2 12.1
SC-62a 198.0 3.2 61.9 12.1
SC-78 251.0 3.2 78.4 12.0
SC-94 300.0 3.2 93.8 11.9
SC-109 350.0 3.2 109.4 12.0
SC-125 401.0 3.2 125.3 11.9
SC-140 450.0 3.2 140.6 12.0
mance of CFT columns. The thickness of the test sections was3.2 mm, and the nominal yield and ultimate stresses were 240.0and 400.0 MPa, respectively. The test sections shown in Fig. 1were fabricated by continuous gas welding. End plates of 30 mmin thickness were welded to both ends of the specimens tominimize eccentric loading and to prevent local failure of thespecimen ends. A 100.0 mm hole for concrete casting was pre-cutin the bottom end plate. The detailed dimensions of the testcolumns are listed in Table 2. The diameter to thickness ratios ofthe test sections ranged 47.2–140.6, which was selected to besomewhat lower or higher than the yield limit ratio of 90–100provided in the current specifications, such as AISC (2005) [4] andEC4 (2004) [3]. The column lengths were three or four times thediameter of the test sections, and the slenderness ratios (L/r) wereapproximately between 9.0 and 12.0. Therefore, since overallbuckling was not likely to occur, local buckling and post-local-buckling strength or yielding of the sections was expected togovern the member strength of the test columns. For the sectionsof large diameter to thickness ratios, local buckling of the steelskin was expected to occur before the first yield of the material.The post-buckling strength in a local mode should be accountedto accurately predict the ultimate strength of CFT columns.
3. Column tests
3.1. CHS column tests
A series of compression tests were performed to investigatethe buckling and the ultimate strengths of CHS columns. Theloaded end was hinged and the bottom end was fixed. Aconcentric compression test was conducted, using a 3000 kN
ections.
L(mm) As(mm2) Ac(mm2) nAs+Ac(mm2)
620 1486 16,422 29,796
620 1476 16,196 29,480
835 1968 29,134 46,819
835 1958 28,832 46,454
1050 2489 46,990 69,391
1250 2989 67,702 94,603
1468 3487 92,725 124,108
1680 4000 122,294 158,294
1888 4493 154,551 194,988

Fig. 3. Axial load versus shortening curves of CHS sections.
Table 3Local buckling and maximum stresses of CHS columns.
Sections D/t fmax(MPa) fcrl(MPa)
Nonlinear
analysis
Tests Tests Elastic
analysis
US-47 47 265 306 272 3177
US-62 62 261 265 243 2362
US-78 78 259 273 229 1952
US-94 93 258 273 200 1746
US-109 109 258 281 200 1619
US-125 125 257 267 208 1540
US-140 140 256 278 185 1495
Y.B. Kwon et al. / Thin-Walled Structures 49 (2011) 85–93 87
Shimazu Universal Testing Machine. Downward loading wascontrolled by the displacement control method at the loadingvelocity of 0.01 mm/s. Vertical displacement was obtained fromthe machine directly and horizontal displacements were mea-sured by displacement transducers, which were attached at thecenter and at the quarter points of the test specimens. Since thelocal buckling stress was slightly lower than the yield stress,elastic local buckling did not occur even for the section with D/tratio larger than 100 during testing. Inelastic local bucklingoccurred with different numbers of lobes along the columns andbuckle waves in the circumference. Deformation due to localbuckling increased according to the increase of load, until themaximum load was reached. The typical final collapse mode ofthe CHS section is shown in Fig. 2. Most sections showed kinksacross the section. However, some of the sections finally collapsedbecause the half-wave, which was located near the bottom end ofthe columns, was flattened out into a rhombus or triangle shapeshown in Fig. 2. Although both the number of buckle half-wavesin the cross section and the number of lobes along the columnwere different between test sections, the final collapse modeswere quite similar except at the locations of the kinks.
The axial load-shortening curves of the CHS columns tested areshown in Fig. 3. As shown in the figure, as the compressive load wasincreased after the initial take-up of loading, most specimensshowed a linear load versus shortening behavior before theoccurrence of local buckling at several locations along the column.After the maximum load, the column of low D/t ratio did notcollapse abruptly, but showed a stable behavior. However, in thecase of the sections of large D/t ratio, the column displayed a fairlysharp drop of axial load in comparison with the columns of low D/tratio. The sections of high D/t ratios showed a significant post-local-buckling strength reserve up to the ultimate load. However, after thepeak load was reached, the load decreased more sharply than thesections of low D/t ratios.
The test ultimate and the local buckling stresses of the CHSsections are compared with the inelastic analysis results obtained,using the LUSAS (ver. 14.3) [8] in Table 3. In the FE analysis, anelastic buckling analysis was conducted first and the localbuckling mode was assumed as the initial imperfections, wherethe magnitude was taken as t/100. An elastic-perfect plasticstress–strain relation was assumed and the von-Mises yieldcriteria were applied. The local buckling stresses, fcrl, for thesections of D/t ratios 47 and 62 were higher than the nominalyield stress of 240.0 MPa. The local buckling stresses of thesections whose D/t ratios were higher than 78 were estimated tobe lower than the nominal yield stress. However, regardless of theD/t ratios, the maximum stresses, fmax, of all the test sections were
Fig. 2. Failure modes
higher than the test yield stress of 265.0 MPa, due to a significantpost-local-buckling strength reserve. The higher the diameter-thickness ratio was, the larger the post-local-buckling strengthreserve was. The elastic local buckling stresses of the test sectionswere much higher than the test yield stress, which meant thatmost of the test sections underwent inelastic local buckling andsome of them yielded to failure. The maximum D/t limit of 90–100for the yield criteria in current specifications such as AISC
of CHS columns.
Y.B. Kwon et al. / Thin-Walled Structures 49 (2011) 85–9388
specifications (2005) [4], AASHTO specifications (2007) [5]and Eurocode3 (2003) [9] seems to be slightly conservative inconsideration of the test results.
3.2. Circular concrete-filled tubular (CFT) column tests
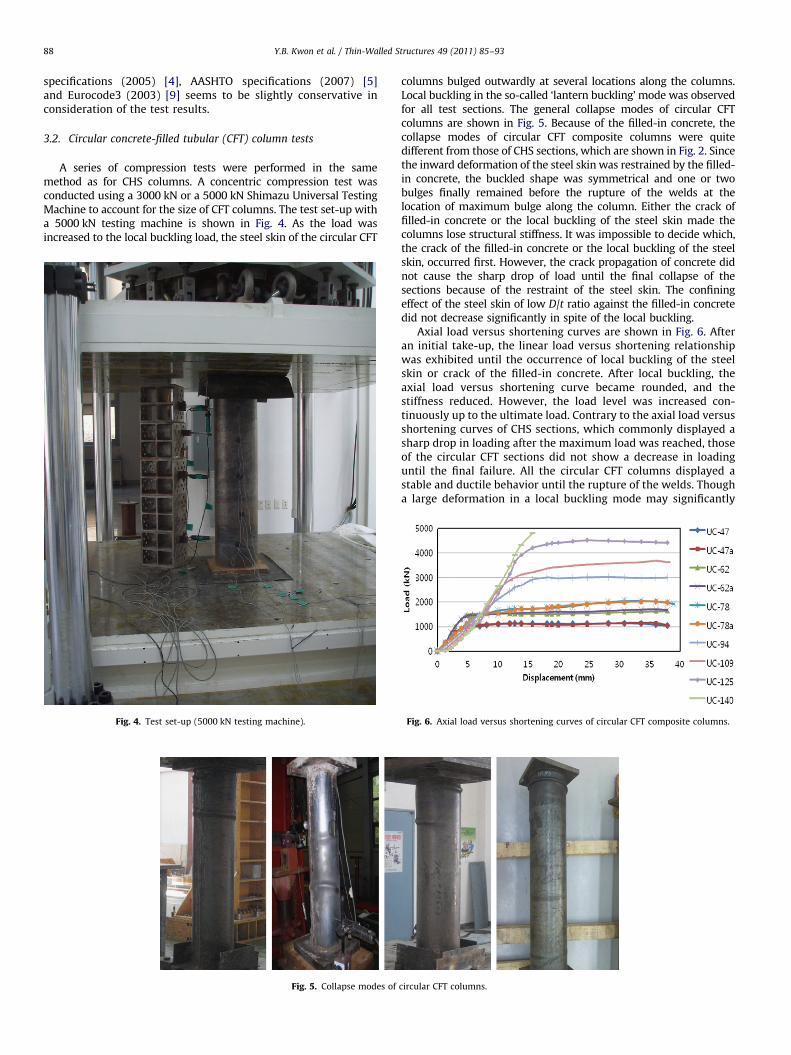
A series of compression tests were performed in the samemethod as for CHS columns. A concentric compression test wasconducted using a 3000 kN or a 5000 kN Shimazu Universal TestingMachine to account for the size of CFT columns. The test set-up witha 5000 kN testing machine is shown in Fig. 4. As the load wasincreased to the local buckling load, the steel skin of the circular CFT
Fig. 4. Test set-up (5000 kN testing machine).
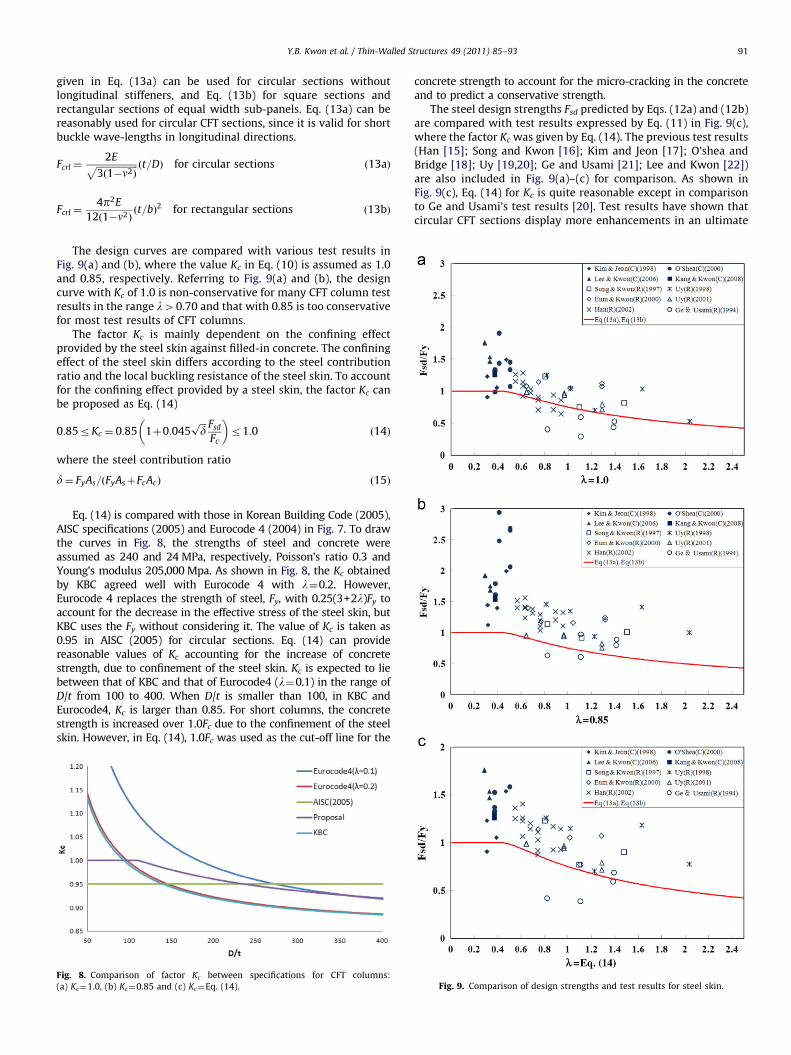
Fig. 5. Collapse modes of
columns bulged outwardly at several locations along the columns.Local buckling in the so-called ‘lantern buckling’ mode was observedfor all test sections. The general collapse modes of circular CFTcolumns are shown in Fig. 5. Because of the filled-in concrete, thecollapse modes of circular CFT composite columns were quitedifferent from those of CHS sections, which are shown in Fig. 2. Sincethe inward deformation of the steel skin was restrained by the filled-in concrete, the buckled shape was symmetrical and one or twobulges finally remained before the rupture of the welds at thelocation of maximum bulge along the column. Either the crack offilled-in concrete or the local buckling of the steel skin made thecolumns lose structural stiffness. It was impossible to decide which,the crack of the filled-in concrete or the local buckling of the steelskin, occurred first. However, the crack propagation of concrete didnot cause the sharp drop of load until the final collapse of thesections because of the restraint of the steel skin. The confiningeffect of the steel skin of low D/t ratio against the filled-in concretedid not decrease significantly in spite of the local buckling.
Axial load versus shortening curves are shown in Fig. 6. Afteran initial take-up, the linear load versus shortening relationshipwas exhibited until the occurrence of local buckling of the steelskin or crack of the filled-in concrete. After local buckling, theaxial load versus shortening curve became rounded, and thestiffness reduced. However, the load level was increased con-tinuously up to the ultimate load. Contrary to the axial load versusshortening curves of CHS sections, which commonly displayed asharp drop in loading after the maximum load was reached, thoseof the circular CFT sections did not show a decrease in loadinguntil the final failure. All the circular CFT columns displayed astable and ductile behavior until the rupture of the welds. Thougha large deformation in a local buckling mode may significantly
circular CFT columns.
Fig. 6. Axial load versus shortening curves of circular CFT composite columns.
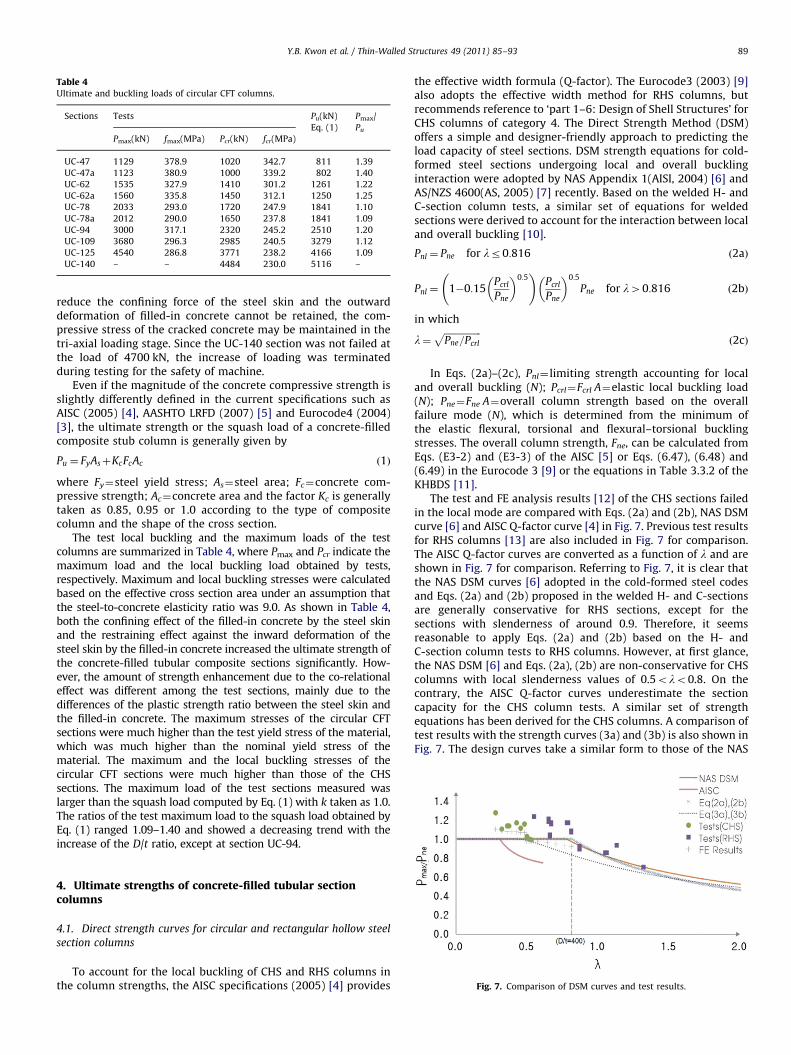
Table 4Ultimate and buckling loads of circular CFT columns.
Sections Tests Pu(kN)
Eq. (1)
Pmax/
Pu
Pmax(kN) fmax(MPa) Pcr(kN) fcr(MPa)
UC-47 1129 378.9 1020 342.7 811 1.39
UC-47a 1123 380.9 1000 339.2 802 1.40
UC-62 1535 327.9 1410 301.2 1261 1.22
UC-62a 1560 335.8 1450 312.1 1250 1.25
UC-78 2033 293.0 1720 247.9 1841 1.10
UC-78a 2012 290.0 1650 237.8 1841 1.09
UC-94 3000 317.1 2320 245.2 2510 1.20
UC-109 3680 296.3 2985 240.5 3279 1.12
UC-125 4540 286.8 3771 238.2 4166 1.09
UC-140 – – 4484 230.0 5116 –
Y.B. Kwon et al. / Thin-Walled Structures 49 (2011) 85–93 89
reduce the confining force of the steel skin and the outwarddeformation of filled-in concrete cannot be retained, the com-pressive stress of the cracked concrete may be maintained in thetri-axial loading stage. Since the UC-140 section was not failed atthe load of 4700 kN, the increase of loading was terminatedduring testing for the safety of machine.
Even if the magnitude of the concrete compressive strength isslightly differently defined in the current specifications such asAISC (2005) [4], AASHTO LRFD (2007) [5] and Eurocode4 (2004)[3], the ultimate strength or the squash load of a concrete-filledcomposite stub column is generally given by
Pu ¼ FyAsþKcFcAc ð1Þ
where Fy¼steel yield stress; As¼steel area; Fc¼concrete com-pressive strength; Ac¼concrete area and the factor Kc is generallytaken as 0.85, 0.95 or 1.0 according to the type of compositecolumn and the shape of the cross section.
The test local buckling and the maximum loads of the testcolumns are summarized in Table 4, where Pmax and Pcr indicate themaximum load and the local buckling load obtained by tests,respectively. Maximum and local buckling stresses were calculatedbased on the effective cross section area under an assumption thatthe steel-to-concrete elasticity ratio was 9.0. As shown in Table 4,both the confining effect of the filled-in concrete by the steel skinand the restraining effect against the inward deformation of thesteel skin by the filled-in concrete increased the ultimate strength ofthe concrete-filled tubular composite sections significantly. How-ever, the amount of strength enhancement due to the co-relationaleffect was different among the test sections, mainly due to thedifferences of the plastic strength ratio between the steel skin andthe filled-in concrete. The maximum stresses of the circular CFTsections were much higher than the test yield stress of the material,which was much higher than the nominal yield stress of thematerial. The maximum and the local buckling stresses of thecircular CFT sections were much higher than those of the CHSsections. The maximum load of the test sections measured waslarger than the squash load computed by Eq. (1) with k taken as 1.0.The ratios of the test maximum load to the squash load obtained byEq. (1) ranged 1.09–1.40 and showed a decreasing trend with theincrease of the D/t ratio, except at section UC-94.
Fig. 7. Comparison of DSM curves and test results.
4. Ultimate strengths of concrete-filled tubular sectioncolumns
4.1. Direct strength curves for circular and rectangular hollow steel
section columns
To account for the local buckling of CHS and RHS columns inthe column strengths, the AISC specifications (2005) [4] provides
the effective width formula (Q-factor). The Eurocode3 (2003) [9]also adopts the effective width method for RHS columns, butrecommends reference to ‘part 1–6: Design of Shell Structures’ forCHS columns of category 4. The Direct Strength Method (DSM)offers a simple and designer-friendly approach to predicting theload capacity of steel sections. DSM strength equations for cold-formed steel sections undergoing local and overall bucklinginteraction were adopted by NAS Appendix 1(AISI, 2004) [6] andAS/NZS 4600(AS, 2005) [7] recently. Based on the welded H- andC-section column tests, a similar set of equations for weldedsections were derived to account for the interaction between localand overall buckling [10].
Pnl ¼ Pne for lr0:816 ð2aÞ
Pnl ¼ 1�0:15Pcrl
Pne
� �0:5 !
Pcrl
Pne
� �0:5
Pne for l40:816 ð2bÞ
in which
l¼ffiffiffiffiffiffiffiffiffiffiffiffiffiffiffiffiPne=Pcrl
pð2cÞ
In Eqs. (2a)–(2c), Pnl¼ limiting strength accounting for localand overall buckling (N); Pcrl¼Fcrl A¼elastic local buckling load(N); Pne¼Fne A¼overall column strength based on the overallfailure mode (N), which is determined from the minimum ofthe elastic flexural, torsional and flexural–torsional bucklingstresses. The overall column strength, Fne, can be calculated fromEqs. (E3-2) and (E3-3) of the AISC [5] or Eqs. (6.47), (6.48) and(6.49) in the Eurocode 3 [9] or the equations in Table 3.3.2 of theKHBDS [11].
The test and FE analysis results [12] of the CHS sections failedin the local mode are compared with Eqs. (2a) and (2b), NAS DSMcurve [6] and AISC Q-factor curve [4] in Fig. 7. Previous test resultsfor RHS columns [13] are also included in Fig. 7 for comparison.The AISC Q-factor curves are converted as a function of l and areshown in Fig. 7 for comparison. Referring to Fig. 7, it is clear thatthe NAS DSM curves [6] adopted in the cold-formed steel codesand Eqs. (2a) and (2b) proposed in the welded H- and C-sectionsare generally conservative for RHS sections, except for thesections with slenderness of around 0.9. Therefore, it seemsreasonable to apply Eqs. (2a) and (2b) based on the H- andC-section column tests to RHS columns. However, at first glance,the NAS DSM [6] and Eqs. (2a), (2b) are non-conservative for CHScolumns with local slenderness values of 0.5olo0.8. On thecontrary, the AISC Q-factor curves underestimate the sectioncapacity for the CHS column tests. A similar set of strengthequations has been derived for the CHS columns. A comparison oftest results with the strength curves (3a) and (3b) is also shown inFig. 7. The design curves take a similar form to those of the NAS

Y.B. Kwon et al. / Thin-Walled Structures 49 (2011) 85–9390
DSM but differ only with respect to the constant of 0.25, which is0.15 in NAS DSM. The constant 0.25 reflects a slightly lower post-local-buckling strength reserve than that of open section columns.It is clear that Eqs. (3a) and (3b) can provide a safe envelope ofstrength for both CHS and RHS sections. Detailed evaluation of theproposed curves can be found in Kwon and Kang (2009) [12].
Pnl ¼ Pne for lr0:420 ð3aÞ
Pnl ¼ 1:0�0:25Pcrl
Pne
� �0:4 !
Pcrl
Pne
� �0:4
Pne for l40:420 ð3bÞ
where
l¼ffiffiffiffiffiffiffiffiffiffiffiffiffiffiffiffiPne=Pcrl
pð3cÞ
4.2. Design strength of concrete filled tubular (CFT) sections
4.2.1. Current specifications
The column strength formula given in Eq. (1) is generally adoptedfor the resistance of CFT stub columns in the current specifications,where the factor k is taken as 0.85, 0.95 or 1.0 according to the typeof composite column and the shape of the cross section. Thestrength formula can satisfactorily be used whenever the steelsection yields first before local buckling takes place. In currentspecifications such as AISC (2005) [4], AASHTO (2007) [5] andEurocode4 (2004) [3], to prevent local buckling in the steel skin ofCFT composite columns, the width to thickness ratio and theexterior diameter to thickness ratio are limited. Even though theformulae for the maximum D/t ratio in other current specificationsseem to be slightly different, the limitations range approximatelyfrom 80 to 100. However, in the AASHTO specifications (2007),higher ratios are permitted when their use is justified by test oranalysis. However, clear provisions for these ratios accounting forthe local buckling of the steel skin of CFT columns cannot be foundin any current specification. Whenever the sections with ratioshigher than the maximum limit are used, local buckling should beaccounted for in the prediction of design strengths for CFT columns.One way to take local buckling into consideration is to adopt theeffective width method for thin-walled steel sections. Since the localbuckling mode and the effective width of the steel skin of CFTsections are quite different from those of hollow steel sections ofsame geometries, the effective width formula for CFT sectionsshould be different from that for hollow steel sections. However, theeffective width formula for the CFT sections cannot be found in anycurrent specification, as far as the authors know. In a series ofcompression tests conducted in this research, even the sectionssatisfying the limitations of the diameter to thickness ratio, providedby the current design specifications, showed local buckling in thesteel skin of the circular CFT sections during testing. Therefore, forthe accurate prediction of the member strength of the circular CFTcolumns, a rational design method to account for the local bucklingof the steel skin needs to be developed.
In the plastic resistance of stub columns to compressionrepresented by Eq. (1) in AISC specifications (2005), the factor Kc
is taken as 0.85 for rectangular CFT columns and 0.95 for circularCFT columns. In Eurocode4 [3], the factor Kc may be taken as 1.0for concrete-filled composite sections. However, for circularsections, the increase in strength of concrete caused by confine-ment may be accounted for as
Kc ¼ 1þZ1
t
D
Fy
Fcð4Þ
where
Z1 ¼ 4:9�1:85lþ17l2ð5Þ
in which
l¼ffiffiffiffiffiffiffiffiffiffiffiffiffiffiPu=Pcr
pð6Þ
Pcr ¼p2ðEIÞe
l2ð7Þ
ðEIÞe ¼ EsIsþ0:8EcIc ð8Þ
However, when the concrete strength is increased, thestrength of steel, Fy, is replaced by 0.25(3+2l)Fy to account forthe decrease in the effective stress. In Korean Building Code(2005) [14], the factor Kc is taken as
Kc ¼ 0:85 1þ1:8t
D
Fy
Fc
� �ð9Þ
4.2.2. Proposed squash load for CFT stub columns
As explained briefly in the previous section, in the currentspecifications such as Eurocode4 (2003), AISC specifications(2005) and AASHTO specifications (2007), the nominal yieldstress of steel is generally adopted for the design strength for thesteel of composite columns, as shown in Eq. (1). For the concrete-encased composite sections and the concrete-filled compositesections of low D/t ratio for circular shapes and low b/t ratio forrectangular shapes, the current specifications can be reasonablyused. However, since a thin steel skin of higher ratios is generallyused for the circular and rectangular CFT sections, local bucklingin the steel skin should be considered in the prediction of theultimate strength. Up to now, the effective width method hasbeen the only way to account for the local buckling of the steelskin. However, since the effective width of the section isdependent on the stress level, its calculation should be conductedrepeatedly by the trial–error method. Moreover since the effectivewidth formulae in current design specifications are generally thesame as those for steel sections, the effective width of CFTsections may be too conservative. To overcome this problem, thesquash load of CFT stub columns can be expressed by Eq. (10).
Pu ¼ Fsd AsþKc Fc Ac ð10Þ
where Fsd¼steel design strength; As¼steel area; Fc¼concretecompressive strength; Ac¼concrete area. The portion of thereinforcement steel bar area is omitted in Eq. (10) for simplicity.
Substituting the test ultimate load, Pmax, for Pu in Eq. (10), themember strength of the steel skin, Fsd, generalized by the nominalyield stress can be given by
Fsd=Fy ¼Pmax�KcFcAc
FyAsð11Þ
Since the local buckling stress of steel skins is generally increasedby filled-in concrete, the DSM design curves for CHS columns in Eqs.(3a) and (3b) can be adopted conservatively for the design strengthcurves for the steel skin of CFT columns. The design strength curvesof a steel skin is expressed in terms of stress by
Fsd=Fy ¼ 1:0 for lr0:420 ð12aÞ
Fsd=Fy ¼1:0
l0:8�
0:25
l1:6for 0:420ol ð12bÞ
where
l¼ffiffiffiffiffiffiffiffiffiffiffiffiffiFy=Fcrl
qð12cÞ
The elastic local buckling stress, Fcrl, can be computed byrigorous computer programs. The well known theoretical equation
Y.B. Kwon et al. / Thin-Walled Structures 49 (2011) 85–93 91
given in Eq. (13a) can be used for circular sections withoutlongitudinal stiffeners, and Eq. (13b) for square sections andrectangular sections of equal width sub-panels. Eq. (13a) can bereasonably used for circular CFT sections, since it is valid for shortbuckle wave-lengths in longitudinal directions.
Fcrl ¼2Effiffiffiffiffiffiffiffiffiffiffiffiffiffiffiffiffiffi
3ð1�n2Þp ðt=DÞ for circular sections ð13aÞ
Fcrl ¼4p2E
12ð1�n2Þðt=bÞ2 for rectangular sections ð13bÞ
The design curves are compared with various test results inFig. 9(a) and (b), where the value Kc in Eq. (10) is assumed as 1.0and 0.85, respectively. Referring to Fig. 9(a) and (b), the designcurve with Kc of 1.0 is non-conservative for many CFT column testresults in the range l40.70 and that with 0.85 is too conservativefor most test results of CFT columns.
The factor Kc is mainly dependent on the confining effectprovided by the steel skin against filled-in concrete. The confiningeffect of the steel skin differs according to the steel contributionratio and the local buckling resistance of the steel skin. To accountfor the confining effect provided by a steel skin, the factor Kc canbe proposed as Eq. (14)
0:85rKc ¼ 0:85 1þ0:045ffiffiffidp Fsd
Fc
� �r1:0 ð14Þ
where the steel contribution ratio
d¼ FyAs=ðFyAsþFcAcÞ ð15Þ
Eq. (14) is compared with those in Korean Building Code (2005),AISC specifications (2005) and Eurocode 4 (2004) in Fig. 7. To drawthe curves in Fig. 8, the strengths of steel and concrete wereassumed as 240 and 24 MPa, respectively, Poisson’s ratio 0.3 andYoung’s modulus 205,000 Mpa. As shown in Fig. 8, the Kc obtainedby KBC agreed well with Eurocode 4 with l¼0.2. However,Eurocode 4 replaces the strength of steel, Fy, with 0.25(3+2l)Fy toaccount for the decrease in the effective stress of the steel skin, butKBC uses the Fy without considering it. The value of Kc is taken as0.95 in AISC (2005) for circular sections. Eq. (14) can providereasonable values of Kc accounting for the increase of concretestrength, due to confinement of the steel skin. Kc is expected to liebetween that of KBC and that of Eurocode4 (l¼0.1) in the range ofD/t from 100 to 400. When D/t is smaller than 100, in KBC andEurocode4, Kc is larger than 0.85. For short columns, the concretestrength is increased over 1.0Fc due to the confinement of the steelskin. However, in Eq. (14), 1.0Fc was used as the cut-off line for the
Fig. 8. Comparison of factor Kc between specifications for CFT columns:
(a) Kc¼1.0, (b) Kc¼0.85 and (c) Kc¼Eq. (14).
concrete strength to account for the micro-cracking in the concreteand to predict a conservative strength.
The steel design strengths Fsd predicted by Eqs. (12a) and (12b)are compared with test results expressed by Eq. (11) in Fig. 9(c),where the factor Kc was given by Eq. (14). The previous test results(Han [15]; Song and Kwon [16]; Kim and Jeon [17]; O’shea andBridge [18]; Uy [19,20]; Ge and Usami [21]; Lee and Kwon [22])are also included in Fig. 9(a)–(c) for comparison. As shown inFig. 9(c), Eq. (14) for Kc is quite reasonable except in comparisonto Ge and Usami’s test results [20]. Test results have shown thatcircular CFT sections display more enhancements in an ultimate
Fig. 9. Comparison of design strengths and test results for steel skin.
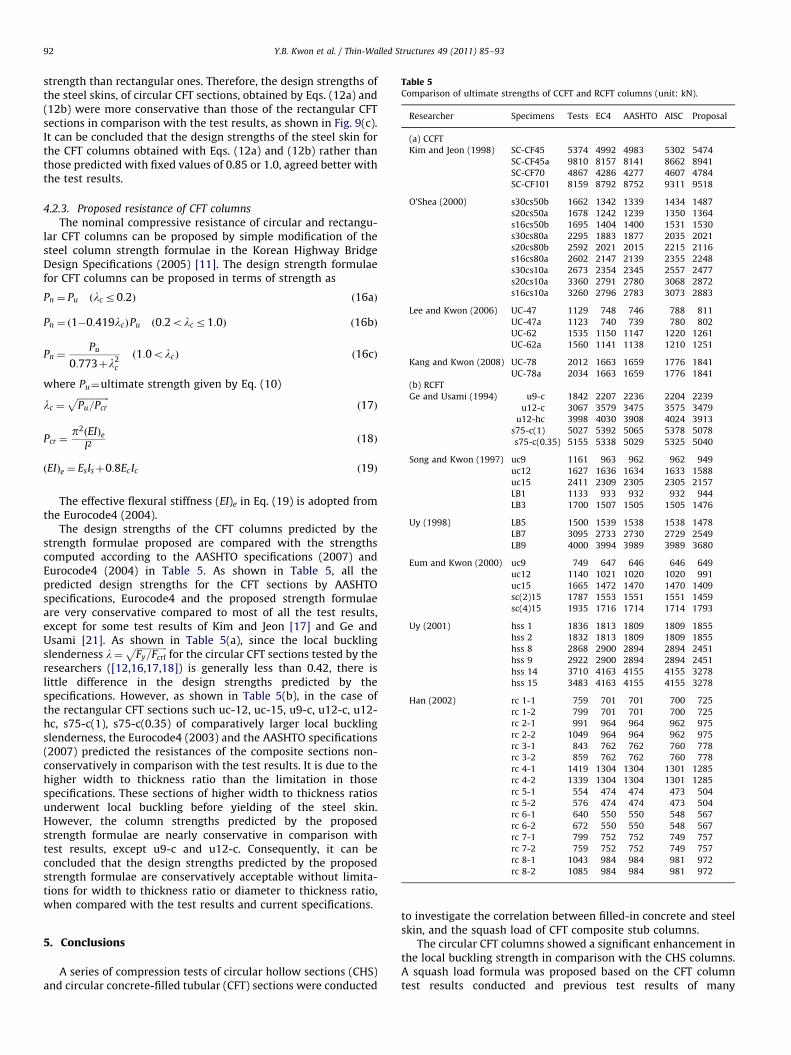
Table 5Comparison of ultimate strengths of CCFT and RCFT columns (unit: kN).
Researcher Specimens Tests EC4 AASHTO AISC Proposal
(a) CCFT
Kim and Jeon (1998) SC-CF45 5374 4992 4983 5302 5474
SC-CF45a 9810 8157 8141 8662 8941
SC-CF70 4867 4286 4277 4607 4784
SC-CF101 8159 8792 8752 9311 9518
O’Shea (2000) s30cs50b 1662 1342 1339 1434 1487
s20cs50a 1678 1242 1239 1350 1364
s16cs50b 1695 1404 1400 1531 1530
s30cs80a 2295 1883 1877 2035 2021
s20cs80b 2592 2021 2015 2215 2116
s16cs80a 2602 2147 2139 2355 2248
s30cs10a 2673 2354 2345 2557 2477
s20cs10a 3360 2791 2780 3068 2872
s16cs10a 3260 2796 2783 3073 2883
Lee and Kwon (2006) UC-47 1129 748 746 788 811
UC-47a 1123 740 739 780 802
UC-62 1535 1150 1147 1220 1261
UC-62a 1560 1141 1138 1210 1251
Kang and Kwon (2008) UC-78 2012 1663 1659 1776 1841
UC-78a 2034 1663 1659 1776 1841
(b) RCFT
Ge and Usami (1994) u9-c 1842 2207 2236 2204 2239
u12-c 3067 3579 3475 3575 3479
u12-hc 3998 4030 3908 4024 3913
s75-c(1) 5027 5392 5065 5378 5078
s75-c(0.35) 5155 5338 5029 5325 5040
Song and Kwon (1997) uc9 1161 963 962 962 949
uc12 1627 1636 1634 1633 1588
uc15 2411 2309 2305 2305 2157
LB1 1133 933 932 932 944
LB3 1700 1507 1505 1505 1476
Uy (1998) LB5 1500 1539 1538 1538 1478
LB7 3095 2733 2730 2729 2549
LB9 4000 3994 3989 3989 3680
Eum and Kwon (2000) uc9 749 647 646 646 649
uc12 1140 1021 1020 1020 991
uc15 1665 1472 1470 1470 1409
sc(2)15 1787 1553 1551 1551 1459
sc(4)15 1935 1716 1714 1714 1793
Uy (2001) hss 1 1836 1813 1809 1809 1855
hss 2 1832 1813 1809 1809 1855
hss 8 2868 2900 2894 2894 2451
hss 9 2922 2900 2894 2894 2451
hss 14 3710 4163 4155 4155 3278
hss 15 3483 4163 4155 4155 3278
Han (2002) rc 1-1 759 701 701 700 725
rc 1-2 799 701 701 700 725
rc 2-1 991 964 964 962 975
rc 2-2 1049 964 964 962 975
rc 3-1 843 762 762 760 778
rc 3-2 859 762 762 760 778
rc 4-1 1419 1304 1304 1301 1285
rc 4-2 1339 1304 1304 1301 1285
rc 5-1 554 474 474 473 504
rc 5-2 576 474 474 473 504
rc 6-1 640 550 550 548 567
rc 6-2 672 550 550 548 567
rc 7-1 799 752 752 749 757
rc 7-2 759 752 752 749 757
rc 8-1 1043 984 984 981 972
rc 8-2 1085 984 984 981 972
Y.B. Kwon et al. / Thin-Walled Structures 49 (2011) 85–9392
strength than rectangular ones. Therefore, the design strengths ofthe steel skins, of circular CFT sections, obtained by Eqs. (12a) and(12b) were more conservative than those of the rectangular CFTsections in comparison with the test results, as shown in Fig. 9(c).It can be concluded that the design strengths of the steel skin forthe CFT columns obtained with Eqs. (12a) and (12b) rather thanthose predicted with fixed values of 0.85 or 1.0, agreed better withthe test results.
4.2.3. Proposed resistance of CFT columns
The nominal compressive resistance of circular and rectangu-lar CFT columns can be proposed by simple modification of thesteel column strength formulae in the Korean Highway BridgeDesign Specifications (2005) [11]. The design strength formulaefor CFT columns can be proposed in terms of strength as
Pn ¼ Pu lc r0:2ð Þ ð16aÞ
Pn ¼ ð1�0:419lcÞPu ð0:2olc r1:0Þ ð16bÞ
Pn ¼Pu
0:773þl2c
ð1:0olcÞ ð16cÞ
where Pu¼ultimate strength given by Eq. (10)
lc ¼ffiffiffiffiffiffiffiffiffiffiffiffiffiffiPu=Pcr
pð17Þ
Pcr ¼p2ðEIÞe
l2ð18Þ
ðEIÞe ¼ EsIsþ0:8EcIc ð19Þ
The effective flexural stiffness (EI)e in Eq. (19) is adopted fromthe Eurocode4 (2004).
The design strengths of the CFT columns predicted by thestrength formulae proposed are compared with the strengthscomputed according to the AASHTO specifications (2007) andEurocode4 (2004) in Table 5. As shown in Table 5, all thepredicted design strengths for the CFT sections by AASHTOspecifications, Eurocode4 and the proposed strength formulaeare very conservative compared to most of all the test results,except for some test results of Kim and Jeon [17] and Ge andUsami [21]. As shown in Table 5(a), since the local bucklingslenderness l¼
ffiffiffiffiffiffiffiffiffiffiffiffiffiffiFy=Fcrl
pfor the circular CFT sections tested by the
researchers ([12,16,17,18]) is generally less than 0.42, there islittle difference in the design strengths predicted by thespecifications. However, as shown in Table 5(b), in the case ofthe rectangular CFT sections such uc-12, uc-15, u9-c, u12-c, u12-hc, s75-c(1), s75-c(0.35) of comparatively larger local bucklingslenderness, the Eurocode4 (2003) and the AASHTO specifications(2007) predicted the resistances of the composite sections non-conservatively in comparison with the test results. It is due to thehigher width to thickness ratio than the limitation in thosespecifications. These sections of higher width to thickness ratiosunderwent local buckling before yielding of the steel skin.However, the column strengths predicted by the proposedstrength formulae are nearly conservative in comparison withtest results, except u9-c and u12-c. Consequently, it can beconcluded that the design strengths predicted by the proposedstrength formulae are conservatively acceptable without limita-tions for width to thickness ratio or diameter to thickness ratio,when compared with the test results and current specifications.
5. Conclusions
A series of compression tests of circular hollow sections (CHS)and circular concrete-filled tubular (CFT) sections were conducted
to investigate the correlation between filled-in concrete and steelskin, and the squash load of CFT composite stub columns.
The circular CFT columns showed a significant enhancement inthe local buckling strength in comparison with the CHS columns.A squash load formula was proposed based on the CFT columntest results conducted and previous test results of many

Y.B. Kwon et al. / Thin-Walled Structures 49 (2011) 85–93 93
researchers. To estimate the ultimate strength of the steel skin ofCFT stub columns which undergo local buckling, a simple strengthformula for Direct Strength Method was adopted. The designstrength of filled-in concrete was also proposed to account for theconfinement effect, due to the strength ratio between steel skinand filled-in concrete, and the local buckling stress of the steelskin. The squash load formula proposed can predict the ultimatestrength of CFT stub columns conservatively. The ultimatestrengths of CFT columns predicted by AASHTO specifications(2007), Eurocode4 (2004) and the proposed strength equationswere in good agreement with the test results of the CFT columnsof comparatively low diameter to thickness (D/t) and width tothickness (b/t) ratios, respectively. However, in the case ofrectangular CFT columns of higher width to thickness ratio thanthe limitation in the current specifications, the current specifica-tions showed non-conservative strengths for the rectangular CFTcolumns in comparison with the test results. The ultimatestrength predicted by procedures proposed showed good agree-ment with tests results of CFT columns, with either low or highwidth to thickness ratios. Therefore, it can be concluded that theproposed squash load formula can predict the ultimate strengthfor the CFT columns reasonably. However, the strength formulaeshould be calibrated further against various test results for theCFT columns of comparatively large diameter to thickness ratiosfor practical use.
Acknowledgement
This work was supported by the 2008 research grants from theYeungnam University.
References
[1] Chen WF, Atsuta t. Theory of beam-columnA—volume 1: in-plane behaviorand design. New York: McGraw-Hill; 1991.
[2] Bradford MA. Design of short concrete-filled RHS sections. Civil EngineeringTransactions, Institution of Engineers, Australia 1991;CE33(3):189–94.
[3] European Committee for Standardisation (ECS). Eurocode 4: design ofcomposite steel and concrete structures, Part 1-1: general rules and rulesfor buildings. Brussels, Belgium; 2004.
[4] American Iron and Steel Construction (AISC). Specification for steel structuralbuildings. Chicago, IL, USA; 2005.
[5] American Association of State Highway and Transportation Officials (AASH-TO). AASHTO LRFD bridge design specifications. Washington D.C.; 2007.
[6] American Iron and Steel Institute.North American specifications for thedesign of cold-formed steel structural members, Supplement no. 1.Washington DC, USA; 2004.
[7] Standards Australia. Cold-formed steel structures AS/NZS 4600: 2005.Sydney, NSW, Australia;. 2005.
[8] FEA Co., Ltd.. Lusas element reference manual & user’s manual (version 14.3);2009.
[9] European Committee for Standardisation (ECS). Eurocode 3: design of steelstructures, Part 1-1: general rules and rules for buildings. Brussels, Belgium;2003.
[10] Kwon YB, Kim NK, Hancock GJ. Compression tests of welded section columnsundergoing buckling interaction. Journal of Constructional Steel Research2007;63:1590–602.
[11] Korean Association of Highway and Transportation Officials. Korea highwaybridge design specifications. Seoul, Korea; 2005.
[12] Kang DW, Kwon YB. A study on the structural behavior and strength ofcircular hollow section columns. Journal of Korean Society of SteelConstruction 2009;21(5):505–14. in Korean.
[13] Um CS, Song JY, Kwon YB. An experimental study on the structuralbehavior of welded steel box piers. Journal of Structural Engineering, KSCE2001;2(6-A):837–848. in Korean.
[14] Korean Association of Building and House Officials. Korean building codes.Seoul, Korea; 2005.
[15] Han LH. Tests on stub columns of concrete-filled RHS sections. Journal ofConstructional Steel Research 2002;58(3):353–72.
[16] Song JY, Kwon YB. An experimental study on the ultimate strength ofconcrete-filled rectangular stub columns. Journal of Korean Society of CivilEngineering 1997;17(1–4):607–15. in Korean.
[17] Kim JH, Jeon SH. An experimental study on the ultimate strength of concrete-filled stub columns. Journal of Steel Structures (in Korean), Korean Society ofSteel Construction 1999;11(5):495–506.
[18] O’Shea MD, Bridge RQ. Design of circular thin-walled concrete-filled steeltubes. Journal of Structural Engineering 2000;126(10–12):1295–303.
[19] Uy B. Local and post-local-buckling of concrete filled steel welded boxcolumns. Journal of Constructional Steel Research 1998;47(1–2):47–72.
[20] Uy B. Strength of short concrete filled high strength steel box columns.Journal of Constructional Steel Research 2001;57(2):113–34.
[21] Ge HUsami T. Development of earthquake-resistant ultimate strength designmethod for concrete filled steel structures. Research Report no. 1994-1,Nagoya University, Japan; 1994.
[22] Lee JHKwon YB. The ultimate strength of concrete-filled steel compositecolumns. In: Proceedings, IABSE2007, Weimar; 2007, p. 500–1.