prediction of weld pool geometry in pulsed current micro
TRANSCRIPT

*Corresponding author (Kondapalli Siva Prasad). Tel/Fax: +91-9849212391 E-mail addresses: [email protected] 2011. International Transaction Journal of Engineering, Management, & Applied Sciences & Technologies. Volume 2 No.3. ISSN 2228-9860. eISSN 1906-9642. Online Available at http://TuEngr.com/V02/325-336.pdf
325
International Transaction Journal of Engineering, Management, & Applied Sciences & Technologies
http://www.TuEngr.com, http://go.to/Research
Prediction of Weld Pool Geometry in Pulsed Current Micro Plasma Arc Welding of SS304L Stainless Steel Sheets Kondapalli Siva Prasada*, Ch. Srinivasa Raob, D. Nageswara Raob
a Department of Mechanical Engineering, Anil Neerukonda Institute of Technology & Sciences, INDIA b Department of Mechanical Engineering, Andhra University, INDIA A R T I C L E I N F O
A B S T RA C T
Article history: Received 21 March 2011 Received in revised form 27 May 2011 Accepted 13 June 2011 Available online 14 June 2011 Keywords: Pulsed Current MPAW, SS304L, ANOVA, Bead Geometry
Pulsed Micro Plasma Arc Welding (MPAW) is a metal joining technique widely used in manufacturing of thin sheet components due to its inherent properties. The weld quality and productivity are controlled by the process parameters. The paper discuses about development of mathematical models for weld pool geometry of stainless steel 304L sheets. Design of experiments based on full factorial design is employed for the development of a mathematical model correlating the important controlled pulsed MPAW process parameters like peak current, background current, pulse and pulse width with front width, back width, front height and back height. The developed mode has been checked for adequacy based on ANOVA analysis. Weld bead parameters obtained by the models are found to confirm actual values with high accuracy. Using these models effect of pulsed MPAW process parameters on weld pool geometry are studied.
2011 International Transaction Journal of Engineering, Management, & Applied Sciences & Technologies. Some Rights Reserved.
1. Introduction The plasma welding process was introduced to the welding industry in 1964 as a method
of bringing better control to the arc welding process in lower current ranges (Modern
Application News, 1999 ). Today, plasma retains the original advantages it brought to the
2011 International Transaction Journal of Engineering, Management, & Applied Sciences & Technologies. 2011 International Transaction Journal of Engineering, Management, & Applied Sciences & Technologies.

326 K. Siva Prasad, Ch.Srinivasa Rao, D.Nageswara Rao
industry by providing an advanced level of control and accuracy to produce high quality
welds in both miniature and pre precision applications and to provide long electrode life for
high production requirements at all levels of amperage. Plasma welding is equally suited to
manual and automatic applications. It is used in a variety of joining operations ranging from
welding of miniature components to seam welding to high volume production welding and
many others.
The welding optimization literature frequently reveals correlation among responses.
(D.K.Zhang et.al,2010) studied the influence of welding current, arc voltage, welding speed,
wire feed rate and magnitude of ion gas flow on front melting width, back melting width and
weld reinforcement of Alternating Current Plasma Arc Welding process of LF6 Aluminum
alloy of thickness 3mm using Artificial Neural Network- Back Propagation algorithm.
(Sheng-Chai Chi et. al ,2001) developed an intelligent decision support system for Plasma
Arc Welding of stainless steel plates of thickness range from 3 to 9 mm based on fuzzy Radial
Basis Function (RBF) neural network by performing experiments using Taguchi method. (Y.
F. Hsiao et. Al,2008) studied the optimal parameters process of plasma arc welding of SS316
of thickness 4mm by Taguchi method with Grey relational analysis is studied. Torch stand-
off, welding current, welding speed and plasma gas flow rate (Argon) were chosen as input
variables and welding groove root penetration, welding groove width, front-side undercut
were measured as output parameters. (K.Siva et.al, 2008) used central composite rotatable full
factorial design matrix and conducted experiments in optimization of weld bead geometry in
Plasma arc hardfaced austenitic stainless steel plates using Genetic Algorithm.
(A.K.Lakshminarayan et.al, 2008) predicted the Dilution of Plasma Transferred Arc
Hardfacing of Stellite on Carbon Steel using Response Surface Methodology (RSM). (V
Balasubramanian et.al, 2009) used Response Surface Methodology to predict and optimize the
percentage of dilution of iron-based hardfaced surface produced by the Plasma transferred arc
welding process.
From the earlier works, it has been observed that much work is not reported so far to
investigate the effect of pulsed current MPAW process parameters on stainless steel weld
characteristics; and developing the related mathematical models to predict the same especially
for welding of thin stainless steel sheets. Hence an attempt was made to correlate important
pulsed MPAW process parameters to bead geometry of thin AISI 304L stainless steel welds

*Corresponding author (Kondapalli Siva Prasad). Tel/Fax: +91-9849212391 E-mail addresses: [email protected] 2011. International Transaction Journal of Engineering, Management, & Applied Sciences & Technologies. Volume 2 No.3. ISSN 2228-9860. eISSN 1906-9642. Online Available at http://TuEngr.com/V02/325-336.pdf
327
by developing mathematical models. The models developed will be very useful to predict the
weld pool geometry parameters for desired bead geometry. A statistically designed
experiment based on full factorial design has employed for the development of mathematical
models (Montgomery DC ,2005).
Figure 1: Typical weld pool geometry.
2. Experimental procedure Austenitic stainless steel sheets of type AISI 304L 100×50×0.25 mm are welded
autogenously with square butt joint without edge preparation. To evaluate the quality of
MPAW welds, measurements of the front width, back width, front height and back height of
the weld pool are considered. Figure 1 indicates the typical weld pool geometry. Table 1
indicates the chemical composition of AISI 304L stainless steel sheet. Experiments are
conducted using the Pulsed Micro Plasma Arc Welding (MPAW) process with pulse DCEN.
Industrial pure and commercial grade argon gases are used for shielding and back purging,
respectively. Automatic voltage control available in the welding equipment is used. Fixture
variation effects are not considered as the same setup has been used throughout the
experiment. Some of the welding process parameters are fixed based on earlier work and also
from the trial run so as to obtain full penetration weld. Trial runs are conducted to find the
limits of each controllable process parameter so as to obtain full penetration weld, free from
any visible defects. Because of computational ease and enhanced interpretability of the
models, parameters are converted to coded form for developing mathematical models
(Giridharan PK et.al, 2007). The upper limit of a factor is coded as +1 and the lower limit as
328 K. Siva Prasad, Ch.Srinivasa Rao, D.Nageswara Rao
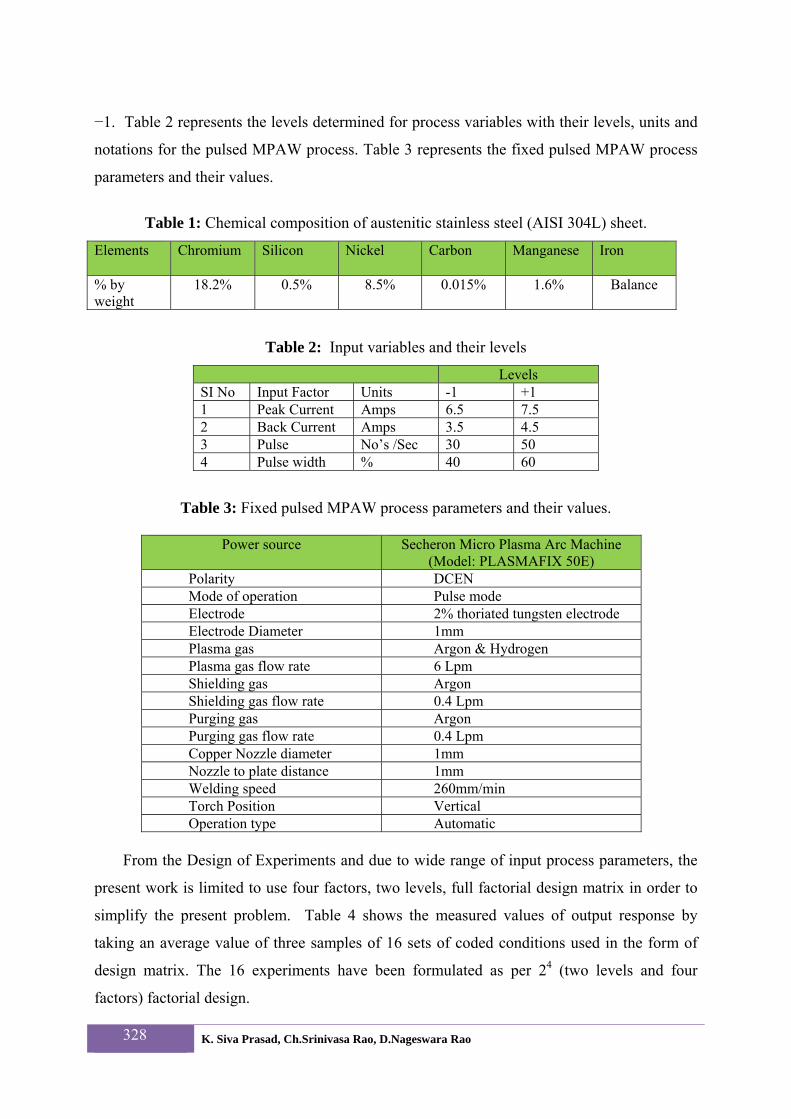
−1. Table 2 represents the levels determined for process variables with their levels, units and
notations for the pulsed MPAW process. Table 3 represents the fixed pulsed MPAW process
parameters and their values.
Table 1: Chemical composition of austenitic stainless steel (AISI 304L) sheet.
Elements Chromium Silicon Nickel Carbon Manganese Iron
% by weight
18.2% 0.5%
8.5% 0.015%
1.6% Balance
Table 2: Input variables and their levels
Levels SI No Input Factor Units -1 +1 1 Peak Current Amps 6.5 7.5 2 Back Current Amps 3.5 4.5 3 Pulse No’s /Sec 30 50 4 Pulse width % 40 60
Table 3: Fixed pulsed MPAW process parameters and their values.
Power source Secheron Micro Plasma Arc Machine (Model: PLASMAFIX 50E)
Polarity DCEN Mode of operation Pulse mode Electrode 2% thoriated tungsten electrode Electrode Diameter 1mm Plasma gas Argon & Hydrogen Plasma gas flow rate 6 Lpm Shielding gas Argon Shielding gas flow rate 0.4 Lpm Purging gas Argon Purging gas flow rate 0.4 Lpm Copper Nozzle diameter 1mm Nozzle to plate distance 1mm Welding speed 260mm/min Torch Position Vertical Operation type Automatic
From the Design of Experiments and due to wide range of input process parameters, the
present work is limited to use four factors, two levels, full factorial design matrix in order to
simplify the present problem. Table 4 shows the measured values of output response by
taking an average value of three samples of 16 sets of coded conditions used in the form of
design matrix. The 16 experiments have been formulated as per 24 (two levels and four
factors) factorial design.
*Corresponding author (Kondapalli Siva Prasad). Tel/Fax: +91-9849212391 E-mail addresses: [email protected] 2011. International Transaction Journal of Engineering, Management, & Applied Sciences & Technologies. Volume 2 No.3. ISSN 2228-9860. eISSN 1906-9642. Online Available at http://TuEngr.com/V02/325-336.pdf
329
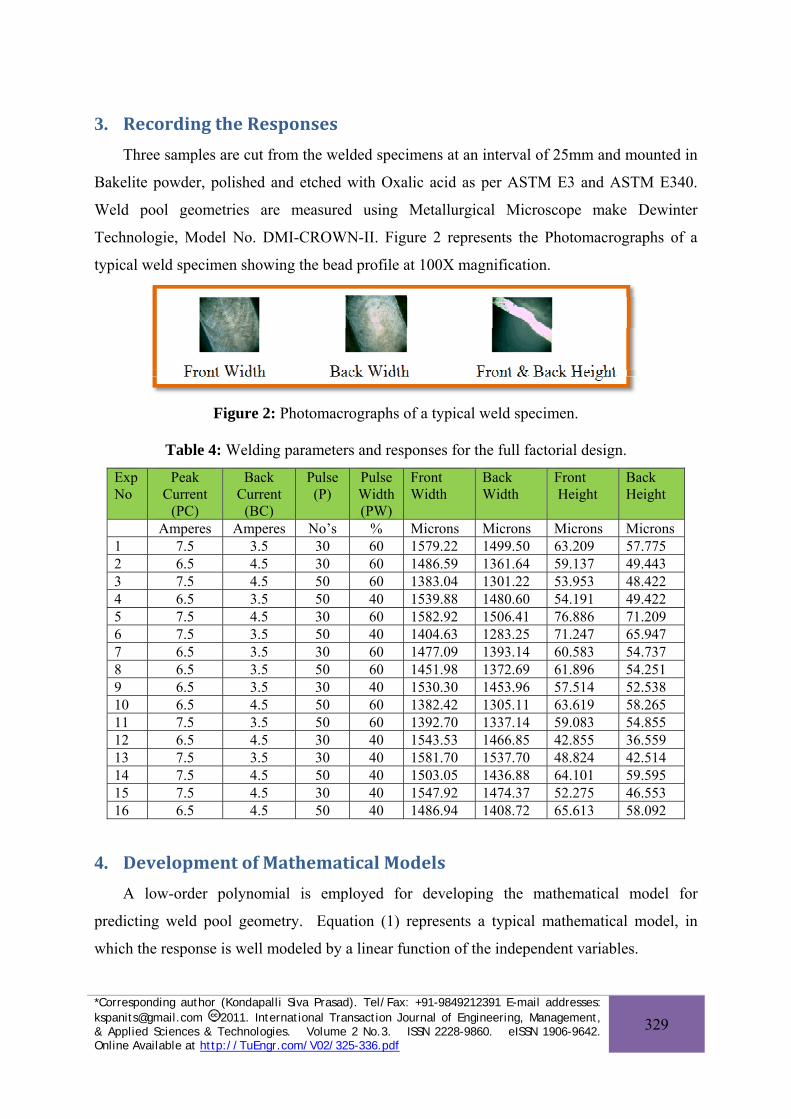
3. Recording the Responses Three samples are cut from the welded specimens at an interval of 25mm and mounted in
Bakelite powder, polished and etched with Oxalic acid as per ASTM E3 and ASTM E340.
Weld pool geometries are measured using Metallurgical Microscope make Dewinter
Technologie, Model No. DMI-CROWN-II. Figure 2 represents the Photomacrographs of a
typical weld specimen showing the bead profile at 100X magnification.
Figure 2: Photomacrographs of a typical weld specimen.
Table 4: Welding parameters and responses for the full factorial design.
Exp No
Peak Current
(PC)
Back Current
(BC)
Pulse (P)
Pulse Width (PW)
Front Width
Back Width
Front Height
Back Height
Amperes Amperes No’s % Microns Microns Microns Microns 1 7.5 3.5 30 60 1579.22 1499.50 63.209 57.775 2 6.5 4.5 30 60 1486.59 1361.64 59.137 49.443 3 7.5 4.5 50 60 1383.04 1301.22 53.953 48.422 4 6.5 3.5 50 40 1539.88 1480.60 54.191 49.422 5 7.5 4.5 30 60 1582.92 1506.41 76.886 71.209 6 7.5 3.5 50 40 1404.63 1283.25 71.247 65.947 7 6.5 3.5 30 60 1477.09 1393.14 60.583 54.737 8 6.5 3.5 50 60 1451.98 1372.69 61.896 54.251 9 6.5 3.5 30 40 1530.30 1453.96 57.514 52.538 10 6.5 4.5 50 60 1382.42 1305.11 63.619 58.265 11 7.5 3.5 50 60 1392.70 1337.14 59.083 54.855 12 6.5 4.5 30 40 1543.53 1466.85 42.855 36.559 13 7.5 3.5 30 40 1581.70 1537.70 48.824 42.514 14 7.5 4.5 50 40 1503.05 1436.88 64.101 59.595 15 7.5 4.5 30 40 1547.92 1474.37 52.275 46.553 16 6.5 4.5 50 40 1486.94 1408.72 65.613 58.092
4. Development of Mathematical Models A low-order polynomial is employed for developing the mathematical model for
predicting weld pool geometry. Equation (1) represents a typical mathematical model, in
which the response is well modeled by a linear function of the independent variables.

330 K. Siva Prasad, Ch.Srinivasa Rao, D.Nageswara Rao
Table 5: ANOVA test results.
ANOVA for Front Width Source Main Effects 2-Way Interactions 3-Way Interactions Residual Error Total R2 Value =94.05
DF 4 6 4 1
15
Seq SS 25659 23462 23142 4575
76837
Adj SS 25659 23462 23142 4575
Adj MS 6415 3910 5785 4575
F 1.40 0.85 1.26
ANOVA for Back Width Source Main Effects 2-Way Interactions 3-Way Interactions Residual Error Total R2 Value = 96.24
DF 4 6 4 1
15
Seq SS 35868 38078 19057 3633
96636
Adj SS 35868 38078 9057 3633
Adj MS 8967 6346 4764 3633
F 2.47 1.75 1.31
ANOVA for Front Height Source Main Effects 2-Way Interactions 3-Way Interactions Residual Error Total R2 Value = 95.18
DF 4 6 4 1
15
Seq SS 499.22 335.64 157.23 50.23
1042.32
Adj SS 499.22 335.64 157.23 50.23
Adj MS 124.80 55.94 39.31 50.23
F 2.48 1.11 0.78
ANOVA for Back Height Source Main Effects 2-Way Interactions 3-Way Interactions Residual Error Total R2 value = 97.39
DF 4 6 4 1
15
Seq SS 487.77 336.44 233.81 28.32
1086.34
Adj SS 487.77 336.44 233.81
32
Adj MS 121.94 56.07 58.45 28.32
F 4.31 1.98 2.06
Where SS =Sum of Squares, MS=Mean Square, F=Fishers ratio
Y = β + β1 x1 + β2 x2 + …._ βx xx + ∈ (1)
The regression coefficients were calculated using MINITAB14 software and Equations
(2), (3), (4), and (5) represent the developed mathematical models with welding parameters in
coded form.
Front Width =1492.12+(38.45*X1)-(6.42*X2)+(7.07*X3)+(5.85*X4) +(26.12*X1*X2)
+(9.6*X1*X3)+(24.67*X1*X4)+(2.1*X2*X3)+(4.17*X2*X4)-(7.86*X3*X4)+
(16.27*X1*X2*X3)+(28.66*X1*X2*X4)-(10.35*X1*X3*X4)-(15.91*X2*X3*X4) (2)

*Corresponding author (Kondapalli Siva Prasad). Tel/Fax: +91-9849212391 E-mail addresses: [email protected] 2011. International Transaction Journal of Engineering, Management, & Applied Sciences & Technologies. Volume 2 No.3. ISSN 2228-9860. eISSN 1906-9642. Online Available at http://TuEngr.com/V02/325-336.pdf
331
Back Width =1413.7+(46.21*X1)-(5.53*X2)-(1.79*X3)+(8.53*X4)-(34.34*X1*X2)
+(15.69*X2*X3)+(27.73*X1*X4)+(9.46*X2*X3)-(1.52*X2*X4)-(9.7*X3*X4)+
(10.7*X1*X2*X3)+(28.4*X1*X2*X4)-(10.32*X1*X3*X4)-(12.8*X2*X3*X4) (3)
Front Height = 59.687-(1.253*X1)-(0.756*X2)+(3.032*X3)-(4.457*X4)
+(1.146*X1*X2)+(3.509*X1*X3)-(1.707*X1*X4)-(1.891*X2*X3)+(0.676*X2*X4)
-(0.639*X3*X4)+(0.937*X1*X2*X3)-(0.304*X1*X2*X4)+(0.529*X1*X3*X4)+
(2.929*X2*X3*X4) (4)
Back Height = 53.761-(1.212*X1)-(0.513*X2)+(2.845*X3)-(4.545*X4)
+(0.637*X1*X2)+(3.731*X1*X3)-(1.436*X1*X4)-(1.886*X2*X3)+(0.671*X2*X4)
-(0.795*X3*X4)+(0.571*X1*X2*X3)-(0.195*X1*X2*X4)+(1.25*X1*X3*X4)
+(3.562*X2*X3*X4) (5)
Table 6: Comparison of actual and predicted values of responses.
Front Width Back Width Front Height Back Height Run
Order Actual Predicted Actual Predicted Actual Predicted Actual Predicted
1 1579.22 1562.31 1499.5 1484.43 63.209 61.4371 57.775 56.4446 2 1486.59 1469.68 1361.64 1346.57 59.137 57.3651 49.443 48.1126 3 1383.04 1399.94 1301.22 1316.28 53.953 55.7249 48.422 49.7524 4 1539.88 1556.79 1480.6 1495.67 54.191 55.9629 49.422 50.7524 5 1582.92 1566.01 1506.41 1491.34 76.886 75.1141 71.209 69.8786 6 1404.63 1421.54 1283.25 1298.32 71.247 73.0189 65.947 67.2774 7 1477.09 1460.18 1393.14 1378.07 60.583 58.8111 54.737 53.4066 8 1451.98 1435.07 1372.69 1357.62 61.896 60.1241 54.251 52.9206 9 1530.3 1513.39 1453.96 1438.89 57.514 55.7421 52.538 51.2076
10 1382.42 1365.51 1305.11 1290.04 63.619 61.8471 58.265 56.9346 11 1392.7 1409.60 1337.14 1352.21 59.083 60.8549 54.855 56.1854 12 1543.53 1560.44 1466.85 1481.92 42.855 44.6269 36.559 37.8894 13 1581.7 1564.79 1537.7 1522.63 48.824 47.0521 42.514 41.1836 14 1503.05 1519.95 1436.88 1451.95 64.101 65.8729 59.595 60.9254 15 1547.92 1564.83 1474.37 1489.44 52.275 54.0469 46.553 47.8834 16 1486.94 1503.85 1408.72 1423.79 65.613 67.3849 58.092 59.4224
5. Checking the Adequacy of the Mathematical Models The adequacy of the developed models is tested using Analysis of Variance (ANOVA)
technique. As per this technique, if the calculated value of Fratio of the developed model is less
332 K. Siva Prasad, Ch.Srinivasa Rao, D.Nageswara Rao
than the standard Fratio (from F-table) value at a desired level of confidence (say 99%), then
the model is said to be adequate within the confidence limit. ANOVA test results of all the
responses are presented in Table 5.
The ANOVA table (Table 5) reveals that all the calculated F values are less than standard
table F value; hence developed mathematical models are adequate.
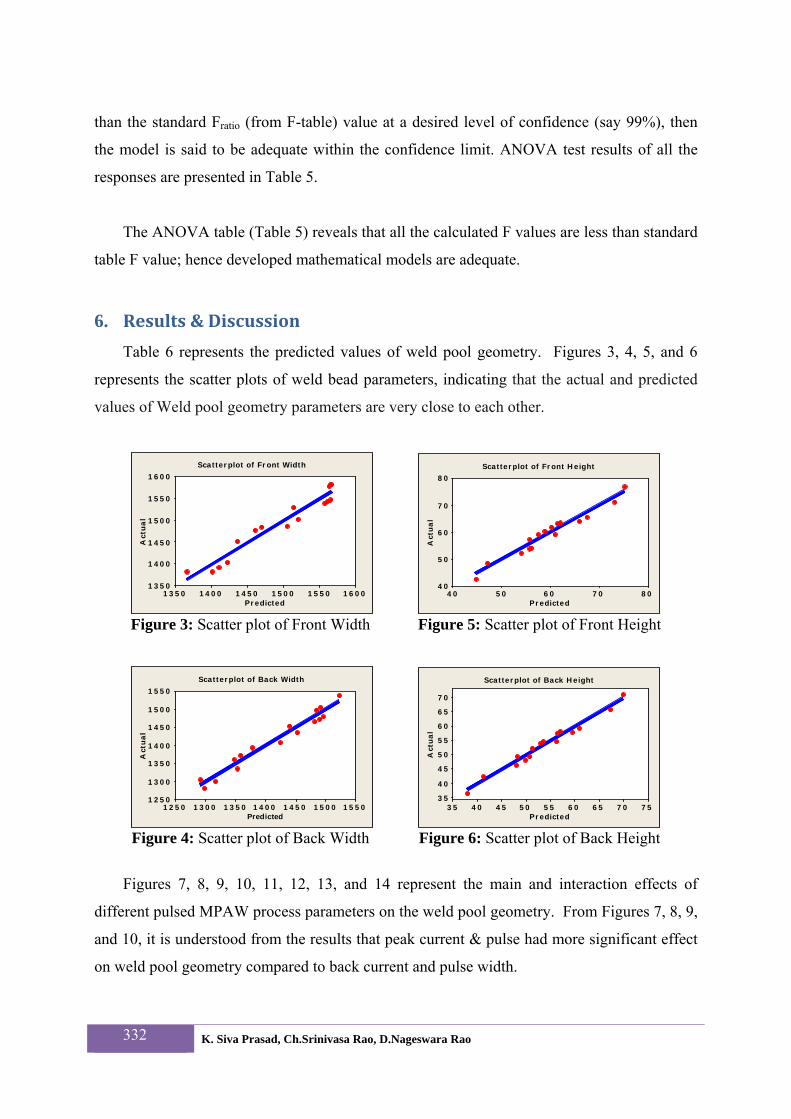
6. Results & Discussion Table 6 represents the predicted values of weld pool geometry. Figures 3, 4, 5, and 6
represents the scatter plots of weld bead parameters, indicating that the actual and predicted
values of Weld pool geometry parameters are very close to each other.
Predicted
Act
ua
l
160015501500145014001350
1600
1550
1500
1450
1400
1350
Scatterplot of Front Width
Predicted
Act
ua
l
8070605040
80
70
60
50
40
Scatterplot of Front Height
Figure 3: Scatter plot of Front Width Figure 5: Scatter plot of Front Height
Predicted
Act
ua
l
1550150014501400135013001250
1550
1500
1450
1400
1350
1300
1250
Scatterplot of Back Width
Predicted
Act
ua
l
757065605550454035
70
65
60
55
50
45
40
35
Scatterplot of Back Height
Figure 4: Scatter plot of Back Width Figure 6: Scatter plot of Back Height
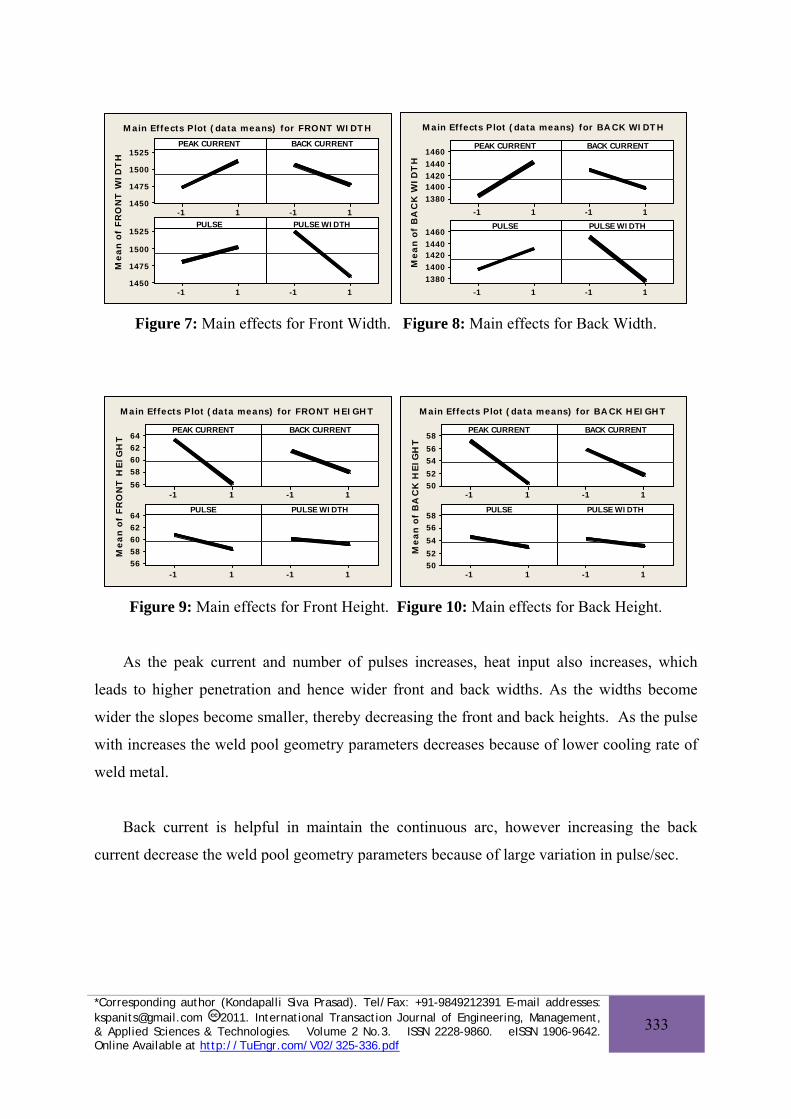
Figures 7, 8, 9, 10, 11, 12, 13, and 14 represent the main and interaction effects of
different pulsed MPAW process parameters on the weld pool geometry. From Figures 7, 8, 9,
and 10, it is understood from the results that peak current & pulse had more significant effect
on weld pool geometry compared to back current and pulse width.
*Corresponding author (Kondapalli Siva Prasad). Tel/Fax: +91-9849212391 E-mail addresses: [email protected] 2011. International Transaction Journal of Engineering, Management, & Applied Sciences & Technologies. Volume 2 No.3. ISSN 2228-9860. eISSN 1906-9642. Online Available at http://TuEngr.com/V02/325-336.pdf
333
Me
an
of
FR
ON
T W
IDT
H
1-1
1525
1500
1475
14501-1
1-1
1525
1500
1475
14501-1
PEAK CURRENT BACK CURRENT
PULSE PULSE WIDTH
Main Effects Plot (data means) for FRONT WIDT H
Me
an
of
BA
CK
WID
TH
1-1
14601440142014001380
1-1
1-1
14601440142014001380
1-1
PEAK CURRENT BACK CURRENT
PULSE PULSE WIDTH
Main Effects Plot (data means) for BA CK WIDT H
Figure 7: Main effects for Front Width. Figure 8: Main effects for Back Width.
Me
an
of
FR
ON
T H
EIG
HT
1-1
64626058
561-1
1-1
6462605856
1-1
PEAK CURRENT BACK CURRENT
PULSE PULSE WIDTH
Main Effects P lot (data means) for FRONT HEIGHT
Me
an
of
BA
CK
HE
IGH
T
1-1
58
5654
5250
1-1
1-1
5856
54
5250
1-1
PEAK CURRENT BACK CURRENT
PULSE PULSE WIDTH
Main Effects Plot (data means) for BA CK HEIGHT
Figure 9: Main effects for Front Height. Figure 10: Main effects for Back Height.
As the peak current and number of pulses increases, heat input also increases, which
leads to higher penetration and hence wider front and back widths. As the widths become
wider the slopes become smaller, thereby decreasing the front and back heights. As the pulse
with increases the weld pool geometry parameters decreases because of lower cooling rate of
weld metal.
Back current is helpful in maintain the continuous arc, however increasing the back
current decrease the weld pool geometry parameters because of large variation in pulse/sec.
334 K. Siva Prasad, Ch.Srinivasa Rao, D.Nageswara Rao
PEAK CURRENT
PULSE
PULSE WIDTH
BACK CURRENT
1-1 1-1 1-1
1550
1500
1450
1550
1500
1450
1550
1500
1450
PEAKCURRENT
-11
BACKCURRENT
-11
PULSE-11
Interaction Plot (data means) for FRONT WIDT H
PEAK CURRENT
PULSE
PULSE WIDTH
BACK CURRENT
1-1 1-1 1-11500
1400
1500
1400
1500
1400
PEAKCURRENT
-11
BACKCURRENT
-11
PULSE-11
Interaction Plot (data means) for BA CK WIDT H
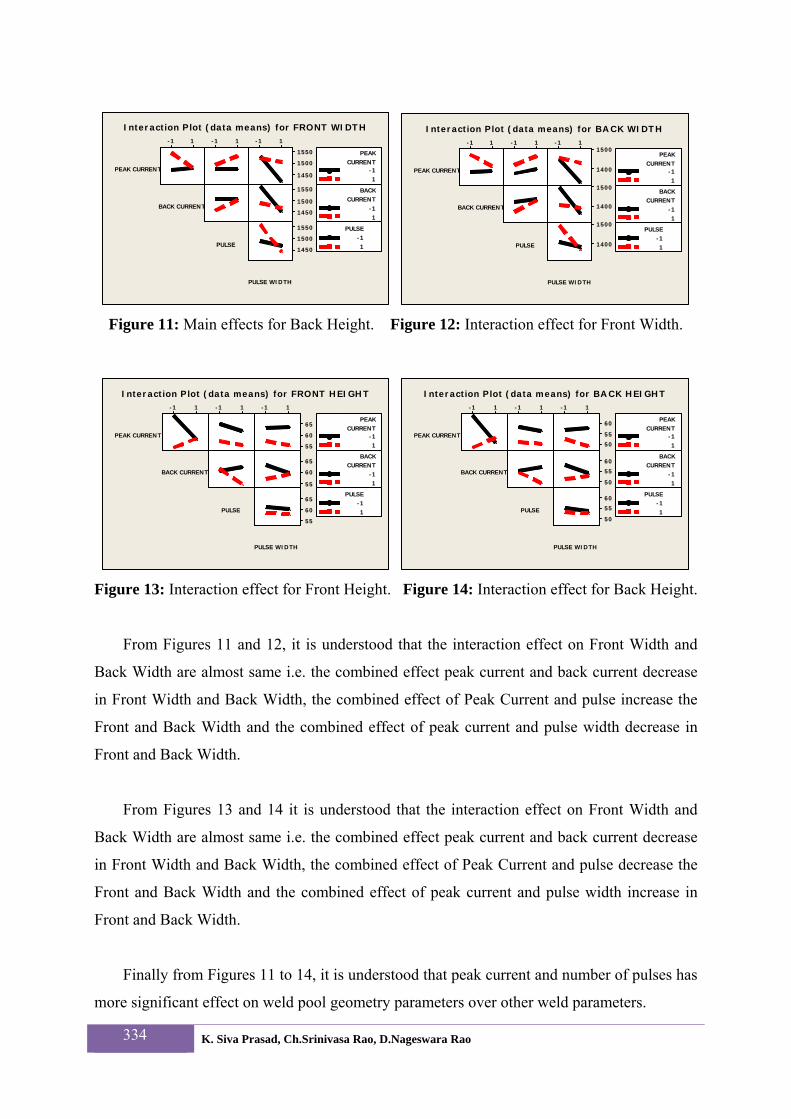
Figure 11: Main effects for Back Height. Figure 12: Interaction effect for Front Width.
PEAK CURRENT
PULSE
PULSE WIDTH
BACK CURRENT
1-1 1-1 1-1
65
60
55
65
60
55
65
60
55
PEAKCURRENT
-11
BACKCURRENT
-11
PULSE-11
Interaction Plot (data means) for FRONT HEIGHT
PEAK CURRENT
PULSE
PULSE WIDTH
BACK CURRENT
1-1 1-1 1-1
60
55
50
60
55
50
60
55
50
PEAKCURRENT
-11
BACKCURRENT
-11
PULSE-11
Interaction Plot (data means) for BA CK HEIGHT
Figure 13: Interaction effect for Front Height. Figure 14: Interaction effect for Back Height.
From Figures 11 and 12, it is understood that the interaction effect on Front Width and
Back Width are almost same i.e. the combined effect peak current and back current decrease
in Front Width and Back Width, the combined effect of Peak Current and pulse increase the
Front and Back Width and the combined effect of peak current and pulse width decrease in
Front and Back Width.
From Figures 13 and 14 it is understood that the interaction effect on Front Width and
Back Width are almost same i.e. the combined effect peak current and back current decrease
in Front Width and Back Width, the combined effect of Peak Current and pulse decrease the
Front and Back Width and the combined effect of peak current and pulse width increase in
Front and Back Width.
Finally from Figures 11 to 14, it is understood that peak current and number of pulses has
more significant effect on weld pool geometry parameters over other weld parameters.

*Corresponding author (Kondapalli Siva Prasad). Tel/Fax: +91-9849212391 E-mail addresses: [email protected] 2011. International Transaction Journal of Engineering, Management, & Applied Sciences & Technologies. Volume 2 No.3. ISSN 2228-9860. eISSN 1906-9642. Online Available at http://TuEngr.com/V02/325-336.pdf
335
7. Conclusion From the developed mathematical models predicted values of weld pool geometry
parameters were computed and found to be very close to actual values. Front Width & Back
Width increases with Peak Current & Pulse, where as it decreases with Back Current and
Pulse Width. Front Height and Back Height decreases with Peak Current, Back Current, Pulse
and Pulse Width. The present study is limited to four process parameters namely peak
current, back current, pulse and pulse width for predicting the weld pool geometry. One may
consider other factors like welding speed, nozzle stand of distance, plasma and shielding gas
flow rates and more levels for improving the statistical mathematical model.
8. Acknowledgements We express our sincere thanks to Shri. R.Gopla Krishnan, Director, M/s Metallic Bellows
(I) Pvt Ltd, Chennai, INDIA and management of MVGR Engineering College, Vizianagaram,
INDIA for their support to carry out experimentation. A very special thank you is due to
Associate Professor Dr. Bovornchok Poopat for insightful comments, helping clarify and
improve the manuscript.
9. References Lakshinarayana.A.K, Balasubramanian.V, Varahamoorthy.R and Babu.S. (2008). Predicted
the Dilution of Plasma Transferred Arc Hardfacing of Stellite on Carbon Steel using Response Surface Methodology, Metals and Materials International, Vol.14, No.6, pp.779-789.
Balasubramanian.V, Lakshminarayanan.A.K, Varahamoorthy.R and Babu.S. (2009). Application of Response Surface Methodolody to Prediction of Dilution in Plasma Transferred Arc Hardfacing of Stainless Steel on Carbon Steel, Science Direct, Volume 16, Issue 1, pp.44-53.
Giridharan P.K, Murugan N. (2007). Effect of pulsed gas tungsten arc welding process parameters on pitting corrosion resistance of type 304L stainless steel welds, Corros J,63(5),pp.433–441.
Hsiao.Y.F, Tarng.Y.S and Huang.W.J. (2008). Optimization of Plasma Arc Welding Parameters by Using the Taguchi Method with the Grey Relational Analysis, Journal of Materials and Manufacturing Processes, 23, pp.51–58.
Montgomery DC, Design and analysis of experiments, 6th Ed. Wiley, New York, 2005.

336 K. Siva Prasad, Ch.Srinivasa Rao, D.Nageswara Rao
Plasma Welding: more accurate, better control at lower currents, Modern Application News, December 1999.
Siva.K, Muragan.N, Logesh.R. (2008). Optimization of weld bead geometry in Plasma transferred arc hardfacing austenitic stainless steel plates using genetic algorithm, Int J Adv Manuf Technol, Volume 41,Numbers 1-2, pp.24-30.
Sheng-Chai Chi, LI-Chang Hsu. (2001). A fuzzy Radial Basis Function Neural Network for Predicting Multiple Quality characteristics of Plasma Arc Welding, IEEE,0-7803-7078-3/01,pp.2807 -2812.
Zhang. D.K. and Niu.J.T. (2010). Application of Artificial Neural Network modeling to Plasma Arc Welding of Aluminum alloys, Journal of Advanced Metallurgical Sciences, Vol.13, No.1,pp.194-200.
K.Siva Prasad is an Assistant Professor of Department of Mechanical Engineering at Anil Neerukonda Institute of Technology & Sciences, Visakhapatnam, India. He received his Bachelors degree from Osmania University, India and Master Degree from JNTU, Hyderabad, India. He is also a part time scholar at Andhra University. He is a member of various professional bodies like ISTE, FPSI, ISHRAE etc. His area of research is micro welding processes.
Dr.Ch.Srinivasa Rao is an Associate Professor in the Mechanical Engineering Department at Andhra University, Visakhapatnam, India. He obtained his PhD degree from Andhra University, Visakhapatnam, India. He has published his research papers in various International Journals and conferences proceedings. He is a member of various professional bodies like ISTE, IE etc. His area of interest is manufacturing sciences, rapid prototyping and robotics.
Dr.D.Nageswara Rao is a Professor in the Mechanical Engineering Department at Andhra University, Visakhapatnam, India. He obtained his PhD degree from Indian Institute of Technology Delhi, India. He is the coordinator for Centre for Nanotechnology at Andhra University. He has successfully completed various projects sponsored by DST, UGC, AICTE, NRB etc. His area of research is manufacturing sciences and nanotechnology.
Peer Review: This article has been internationally peer-reviewed and accepted for publication
according to the guidelines given at the journal’s website.