predictions of plasma performance in iter based on mixed b
TRANSCRIPT

TIJSAT
1Thammasat International Journal of Science and Technology, Vol. 17, No. 3, July-September 2012
Abstract
Three different turbulent transport models (Mixed Bohm/gyro-Bohm (Mixed B/gB) model, Multi-mode (MMM95) model, and Current Diffusive Ballooning Mode (CDBM) model) are used in the predictions of ITER plasma performance. Self-consistent simulations of ITER are carried out using two integrated predictive modeling codes, BALDUR and TASK/TR with these turbulent transport models. It is found that when TASK/TR is used with the CDBM turbulent transport model, the most promising plasma performance is obtained among the simulations in this work. It is also found that the electron and ion temperatures, as well as the plasma performance, increase as plasma current, heating power, or line average density increase.
Predictions of Plasma Performance in ITER based on Mixed B/gB, MMM95, and CDBM Transport Models
Keyword: Plasma, Fusion, Tokamak, ITER
Correspondence: T. Onjun School of Manufacturing Systems and Mechanical Engineering, Sirindhorn International Institute of Technology, Thammasat University, Pathum Thani, 12121, Thailand
J. Promping1, Y. Pianroj2, A. Fukuyama3, and T. Onjun4
1 Thailand Institute of Nuclear Technology (Public Organization), Chatuchak, Bangkok, 10900, Thailand. 2 Prince of Songkhla University (Surat Thani campus), Maung, Surat Thani, 84000, Thailand. 3 Department of Nuclear Engineering, Kyoto University, Kyoto, 606-8501, Japan. 4 School of Manufacturing Systems and Mechanical Engineering, Sirindhorn International Institute of Technology, Thammasat University, Pathum Thani, 12121, Thailand.
1. Introduction The International Thermonuclear Experimental Reactor (ITER) is an international collaborative effort with an aim to demonstrate the scientific and technological feasibility of fusion energy using magnetic confinement fusion [1]. One of the goals for ITER is to produce plasma with sufficiently high fusion energy for a long enough time to achieve a sustained fusion burn. Producing a significant fusion reaction rate inside a Tokamak requires the ability to heat and to contain high-temperature plasma The prediction of plasma performance in a Tokamak can be achieved by using integrated predictive modelling code to compute the time evolution of plasma profiles such as temperature and density. This task has been done using various integrated predictive modeling codes, for example BALDUR[2], TASK/TR[3], JETTO[4], CRONOS[5], and ASTRA[6]. Cross-comparison between the predictions of different codes is important for the research in order to improve our confidence on these codes’ predictive capability. Moreover, it is known that plasma performance in a Tokamak depends on many parameters. Therefore, the purpose of this paper is to compare plasma performance as the plasma parameters are varied; examples of these quantities are plasma current, heating power, and line average density. Two

TIJSAT
2 Thammasat International Journal of Science and Technology, Vol. 17, No. 3, July-September 2012
integrated predictive modelling codes, BALDUR and TASK/TR, are used because they are readily available with three different core transport models Multimode (MMM95) model, Mixed Bohm gyro-Bohm (Mixed B/gB) model, and Current Diffusive Ballooning Mode (CDBM) model. In recent years, the BALDUR integrated predictive modelling code with Mixed B/gB and MMM95 anomalous core transport models was used to predict the performance of ITER [7-18]. Moreover, the ITER performance was studied by T. Onjun. et. al [19]. In this study, the internal transport barrier (ITB) and edge transport barrier were included in BALDUR with Mixed B/gB turbulent transport model. The ITER performance, which is shown in this work, was extremely promising when the ITB occurred. Y. Pianroj et. al [20] used BALDUR and TASK/TR to simulation the performance of a small Tokamak reactor. The simulation results carried out by TASK/TR with the CDBM turbulent transport model show higher performance than others. M. Honda [3] reported that the promising ITER performance was found by including the strong ITB in TASK/TR with the CDBM turbulent transport model. The simulation results show that the fusion gain Q, the normalized beta, and the heating power fraction due to alpha particles were 3, 1.8 and 36%, respectively. This paper is organized as follows: brief descriptions for BALDUR and TASK/TR integrated predictive modeling codes, Multi-mode transport model, Mixed Bohm/gyro-Bohm transport model, and CDBM transport model, are given in Section 2. Simulation protocol is described in Section 3. The results and discussion are presented in Section 4. Finally, in Section 5 conclusions are presented. 2. Integrated Predictive Modeling Code Basically, an integrated predictive modeling code is a collection of several modules containing different physics, such as a neutral beam heating module, an RF heating module, a core transport module, and an impurity radiation module, in which each module is responsible for its own specific tasks. These modules are solved self-consistently with one another, resulting in a complicated calculation. In general, the input data needed for an integrated predictive modeling code is the controlled plasma parameters in experiments, such as magnetic field, total heating power, and plasma current. With these plasma parameters, a time evolution of plasma simulations is carried out according to the selected modules.
2.1 Baldur Code The BALDUR code is an integrated predictive modelling code developed to compute the time evolution of plasma profiles including electron and ion temperatures, deuterium, tritium, helium and impurity densities, magnetic q, neutrals, and fast ions. These time-evolving profiles are computed by combining the effects of many physical processes self-consistently, including the effects of transport, plasma heating, particle influx, boundary conditions, the plasma equilibrium shape, and sawtooth oscillations. Fusion heating power and helium ash accumulation are also computed self-consistently. The BALDUR simulations have been intensively compared against various plasma experiments, which yield agreement with 10% relative RMS deviation as in Refs. [21, 22].
2.2 Task/Tr Code The TASK/TR transport code is based on the diffusive transport equation. The code can calculate a temporal evolution of the density and temperature for every species of particles in a plasma core: electrons, deuterium, tritium, thermalized α paricles, neutrals, multiple impurities, and the other particles of interest. The code can also deal with a local temporal evolution for the two kinds of beam ion associated with the heating by fast α particle and neutral beam injections. Also, analysis including neutral beam injection, heating current drive, pellet injection, and current ramp up is possible and it can evaluate quantitatively a plasma response to these external actuators since the transport equations include various geometric factors. Furthermore, it is easy to carry out a transport simulation coupled with two-dimensional

TIJSAT
3Thammasat International Journal of Science and Technology, Vol. 17, No. 3, July-September 2012
equilibrium code. The code may incorporate experimental profile data through a standard type of data file or data base. The TASK/TR transport code solves the one-dimensional diffusive equation for densities, temperature and a poloidal magnetic flux with respect to the normalized minor radius ρ [23]. The effect of E×B shear stabilization is considered to be important because it allows the plasma to form a transport barrier. Applying this effect appropriately for simulation, the TASK/TR calculates the radial electric field, which is derived by the radial ion force balance. It should be noted that the toroidal velocity used is taken from the experimental data, and every discharge in the profile database does not always contain the toroidal velocity information. Therefore, it can be made up by multiplying the toroidal angular speed by the surface averaged geometrical major radius, both of which are usually included in the database. The poloidal velocity is computed using the NCLASS module. Moreover, the TASK/TR includes various neoclassical transport models to evaluate the transport coefficients, the bootstrap current, the neoclassical resistivity, and the poloidal flow velocity and viscosity. The theory-based turbulent transport models: the CDBM model is included in TASK/TR. A brief description of the models is given next.
2.3 Turbulent Transport Models In this work, three theory-based turbulent transport models are used: the MMM95 model, the Mixed B/gB model, and the CDBM model. A brief description of the models is given as follows. 2.3.1 MMM95 model The MMM95 model [24] is a transport model which computes transport coefficients as a linear combination of theory-based transport models, consisting of the Weiland model for the ion temperature gradient (ITG) and trapped electron modes (TEM), the Guzdar-Drake model for drift-resistive ballooning modes (RB) [25], and kinetic ballooning modes (KB). The linear combination of transport coefficients in MMM95 can be expressed as:
χi = 0.8 χi,ITG&TEM + χi,RB + χi,KB (1)
χe = 0.8 χe,ITG&TEM + χe,RB + χe,KB (2)
DH = 0.8 DH,ITG&TEM + DH,RB + DH,KB (3) DZ = 0.8 DZ,ITG&TEM + DZ,RB + DZ,KB (4)
χi = 0.5 χgB + 4.0 χB (5)
χe = 1.0 χgB + 2.0 χB (6)
where xi and xe are the ion and electron thermal transport coefficients, respectively, DH and DZ are the particle and impurity transport coefficients, respectively. All the anomalous transport contributions to the MMM95 transport model are multiplied by K-4 to extend the model for elongated plasmas. 2.3.2 Mixed B/gB model The Mixed B/gB core transport model [26] is an empirical transport model, which is a combination of Bohm and gyro-Bohm terms. The transport diffusivity in models with Bohm scaling is gyro-radius, a function of the profile shapes (characterized by normalized gradients) and other plasma parameters such as magnetic q. The gyro-Bohm term is proportional to the square of the plasma linear dimension. The Mixed B/gB transport model can be expressed as follows:
TIJSAT
4 Thammasat International Journal of Science and Technology, Vol. 17, No. 3, July-September 2012
where χgB is the gyro-Bohm contribution, χB is the Bohm contribution, ρ is normalized minor radius, Te is the local electron temperature in keV, BT is the toroidal magnetic field, s is the magnetic shear, ωExB is the shearing rate, γITG is the linear growth rate, R is the major radius, and ne is the local electron density. The linear growth rate γITG can be calculated as vth/qR, where vth is the electron thermal velocity. 2.3.3 CDBM model The Current Diffusive Ballooning Mode model is based on the theory of self-sustained turbulence due to the ballooning mode [27, 28] driven by the turbulent current diffusivity. Inclusion of the electron viscosity which has often been neglected in a conventional MHD theory allows the electromagnetic fluctuation to enhance electron viscosity and to make instabilities more unstable in a short-wavelength mode. As the fluctuation amplitude increases, however, the stabilizing effect due to the thermal diffusivity and the ion viscosity eventually overcomes the destabilizing effect of the current diffusivity. The saturation level is determined by the balance of these effects, and solving an eigen-value problem for the ballooning mode [29]. 3. Simulation Protocol In this work, the self-consistent simulations are carried out using either BALDUR code or TASK/TR code. For each simulation, an anomalous transport is calculated using a semi-empirical based Mixed Bohm/gyro-Bohm (Mixed B/gB) model, or using a theoretical-based Multimode (MMM95) model, or using a theoretical-based Current Diffusive Ballooning Mode (CDBM) model. The turbulent transport is combined with the neoclassical transport computed using NCLASS module [30] to describe plasma core transport. The boundary conditions in each simulation are set with the same conditions. The engineering parameters are shown in Table 1. The boundary conditions are taken at the top of the pedestal, which are provided by the pedestal model [31]. The boundary values for different plasma condition are shown in Fig. 1. In this work, we focus on electron temperature, ion temperature, electron density at the plasma centre (Te0, Ti0, and Ne0), alpha power (Pα), and total energy of plasma (WTOT). These parameters reflect the performance of ITER. The density and temperature, which are predicted by BALDUR, will be used as an initial condition for TASK/TR because TASK/TR needs the fixed density and temperature profile. It is worth mentioning that the electron and ion pedestal temperatures are assumed to be the same in all simulations.
DH = DZ1.0 χgB + 2.0 χB (7)
where,
(8) χgB = 5x10 -6 √ Te B2
Te ∇ Ø
(9) χB = 4x10⁻⁵ R q2
neBØ
(neTe) ∇ Te,0.8-Te,1.0
Te,1.0

TIJSAT
5Thammasat International Journal of Science and Technology, Vol. 17, No. 3, July-September 2012
Table 1 Plasma parameters used in simulation
R (m) Major radius 6.20 a (m) Minor radius 2.00 Ip (MA) Plasma current 15.00 BT (T) Toroidal field 5.30 ne (m-3) Line average density 1.0x10²⁰
Paux (MW) Auxiliary power 0.45 q95* Safety factor 3.00 Zeff Effective charge 1.40 K95 Elongation 1.70 δ95 Triangularity 0.33
Parameter Physical Description Values
Fig. 1. Boundary conditions for temperature (left panels) and density (right panels) are shown as a function of plasma current (upper left), auxiliary heating power (middle left) and line average density (bottom left).

TIJSAT
6 Thammasat International Journal of Science and Technology, Vol. 17, No. 3, July-September 2012
4. Result And Discussion Fig. 2 shows the profile of electron temperature as a function of normalized minor radius at 2000 sec when plasma current is equal to 15 MA and auxiliary power is equal to 40 MW. Note that the plasma has already reached a steady state at this time. These results are illustrated for simulations that are carried out using the Mixed B/gB core transport model. It can be seen that the electron temperatures at the plasma edge are the same at 2.76 keV Its central temperature increases to 17.7 keV for that using BALDUR code and 19.8 keV using TASK/TR code. The ion temperatures at the plasma edge started at the same initial value of 3.09 keV then both increase to 17 keV. In Fig. 3, the simulations were carried using TASK/TR code with the CDBM model and BALDUR code with the MMM95 model. Both show electron and ion temperatures with central electron temperatures of 23.7 and 33.9 keV, for TASK/TR code with the CDBM model and BALDUR code with the MMM95 model, respectively. The ion central temperatures increase to 21.9 and 30.4 keV, for TASK/TR code with the CDBM model and BALDUR code with the MMM95 model, respectively. Note that the electron and ion temperatures profiles obtained from the simulations using TASK/TR with the CDBM core transport model tend to be higher than those obtained using BALDUR with the MMM95 core transport model. The electron and ion density profiles obtained from the simulations using BALDUR with the MMM95 core transport model are higher than that obtained from TASK/TR with the CDBM core transport model.
Fig. 2. Profile of electron and ion temperature (upper) and Profile of electron and ion density (lower) as a function of normalized minor radius at 2000 sec. The red data line is based on the BALDUR-Mixed B/gB model and the blue data line is based on the TASK/TR- Mixed B/gB model.

TIJSAT
7Thammasat International Journal of Science and Technology, Vol. 17, No. 3, July-September 2012
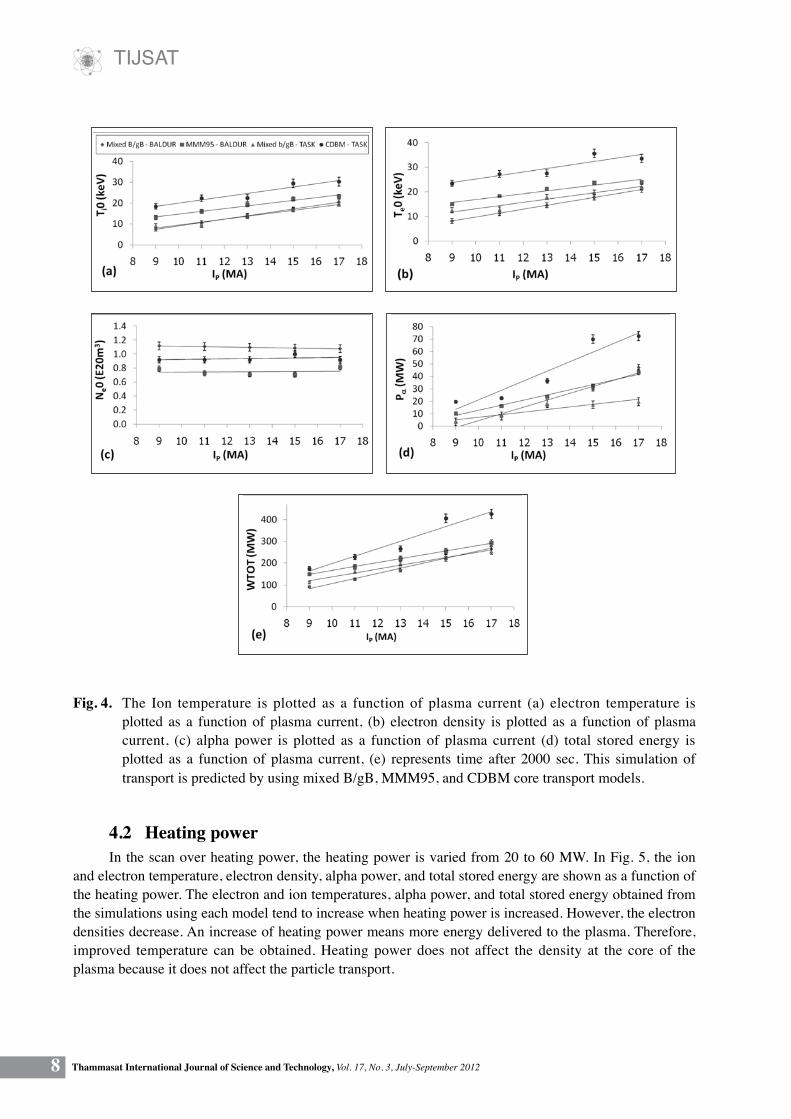
4.1 Plasma current In the scan of plasma current, the plasma current is varied from 9 to 17 MA. In Fig. 4, the ion and electron temperature, electron density, alpha power, and total stored energy are shown as a function of the plasma current. The electron and ion temperature, heating power, and total stored energy obtained from the simulations using each model tend to increase when plasma current is increased, but the electron densities decrease. It can be concluded that an increase of plasma current results in an increase of temperature and hence the energy. The density of plasma obtained from the results does not change much.
Fig. 3. Profile of electron and ion temperature (upper) and Profile of electron and ion density (lower) as a function of normalized minor radius at 2000 sec. The red data line is based on the BALDUR- MMM95 model and the blue data line is based on the TASK/TR-CDBM model.
TIJSAT
8 Thammasat International Journal of Science and Technology, Vol. 17, No. 3, July-September 2012
4.2 Heating power In the scan over heating power, the heating power is varied from 20 to 60 MW. In Fig. 5, the ion and electron temperature, electron density, alpha power, and total stored energy are shown as a function of the heating power. The electron and ion temperatures, alpha power, and total stored energy obtained from the simulations using each model tend to increase when heating power is increased. However, the electron densities decrease. An increase of heating power means more energy delivered to the plasma. Therefore, improved temperature can be obtained. Heating power does not affect the density at the core of the plasma because it does not affect the particle transport.
Fig. 4. The Ion temperature is plotted as a function of plasma current (a) electron temperature is plotted as a function of plasma current, (b) electron density is plotted as a function of plasma current, (c) alpha power is plotted as a function of plasma current (d) total stored energy is plotted as a function of plasma current, (e) represents time after 2000 sec. This simulation of transport is predicted by using mixed B/gB, MMM95, and CDBM core transport models.

TIJSAT
9Thammasat International Journal of Science and Technology, Vol. 17, No. 3, July-September 2012
4.3 Line average density Fig. 6 shows the case of line average density variation, which is set at 0.8×10²⁰ m3, 0.9×10²⁰ m3, 1.0×10²⁰ m3, 1.1×10²⁰ m3, and 1.2×10²⁰ m3. The ion and electron temperature, electron density, alpha power, and total stored energy are shown as a function of the line average density. The electron and ion temperatures, electron density, alpha power, and total stored energy obtained from the simulations using each model tend to increase while line average density increaseds. Line average density affects the density at the plasma core. This result shows that more line average density, results in higher central plasma density. On the other hand, line average density does not affect the temperature profile as much. Even though the plasma total energy is increased, there are more particles to share that energy. As a result, the temperature does not increase with plasma energy.
Fig. 5. The Ion temperature is plotted as a function of heating power, (a) electron temperature is plotted as a function of heating power, (b) electron density is plotted as a function of heating power, (c) alpha power is plotted as a function of heating power, (d) total stored energy is plotted as a function heating power, (e) represents time after 2000 sec. This simulation of transport is predicted by using Mixed B/gB, MMM95, and CDBM core transport models.

TIJSAT
10 Thammasat International Journal of Science and Technology, Vol. 17, No. 3, July-September 2012
5. Conclusion The simulations for ITER plasma are carried out either using BALDUR or TASK/TR codes. Several choices of turbulent transport models, including MMM95, Mixed B/gB and CDBM models, are used in this work. Sensitivity studies of plasma current, heating power and line average density are also investigated. It is found that when TASK/TR is used with the CDBM turbulent transport model, the most promising performance is obtained among the simulations in this work. The trend of electron and ion temperatures, as well as plasma performance which is represented in terms of the alpha power, increases as the plasma current, heating power, or line average density increase.
6. Acknowledgments This work was supported by the Annual Research Budget through Thammasat University and the Higher Education Research Promotion and National Research University Project of Thailand, Office of the Higher Education Commission.
Fig. 6. The Ion temperature is plotted as a function of line average density, (a) electron temperature is plotted as a function of line average density, (b) electron density is plotted as a function of line average density, (c) alpha power is plotted as a function of line average density (d), total stored energy is plotted as a function of line average density, (e) represents time after 2000 sec. This simulation of transport is predicted by using Mixed B/gB, MMM95, and CDBM core transport models.
TIJSAT
11Thammasat International Journal of Science and Technology, Vol. 17, No. 3, July-September 2012
7. References [1] Aymar, R., Barabaschi, P. and Shimomura, Y, (for the ITER team). The ITER design, Plasma Phys. Control. Fusion, Vol. 44, pp. 519-566, 2002. [2] Singer, C. E., et al. A one-dimensional plasma transport code, Comput. Phys. Comm, Vol. 49, pp. 275-398, 1988. [3] Honda M, Transport simulation of Tokamak plasmas including plasma rotation and radial electric field, Ph.D. Thesis, Nuclear Engineering, Kyoto University, 2007. [4] Genacchi G. and Taroni A. JETTO: a free boundary plasma transport code (basic version) Rapporto ENEA RT/TIB, Vol. 5, 1988. [5] Basiuk V. Artaud J.F, Imbeaux F. et al. Simulations of steady-state scenarios for Tore Supra using the CRONOS code, Nuclear Fusion, Vol. 43, pp. 822-830, 2003. [6] Pereverzev G.V, Soldner F.X, Bartiromo R. et al. Transport analysis of lower hybrid current drive plasmas in ASDEX, Nuclear Fusion, Vol. 32, pp. 1023-1036, 1992. [7] Bateman, G., Onjun, T. and Kritz, A. H. Integrated predictive modelling simulations of burning plasma experiment designs. Plasma Phys. Control. Fusion, Vol. 45, pp. 1939, 2003. [8] Onjun, T., Tharasrisuthi, K. and Onjun, O. Projected performance of international thermonuclear experimental reactor Tokamak based on different pedestal width scaling, J. Phys.: Conf. Ser: 123, pp. 012034, 2008. [9] Thararisuthi, K. Onjun, T, and Onjun, O. Projections of ITER performance based on different pedestal width scaling, Thammasat International J. Sci. Technol, Vol. 13, pp. 45, 2008. [10] Picha, R., Onjun, T. et al. Dependence of ITER Performance on Pedestal Temperature, Average Electron Density, Auxiliary Heating Power, and Impurity Content, Proc. 35th EPS on Plasma Physics ECA, Vol. 32, pp. 4.040, 2008. [11] Pianroj, Y. and Onjum, T. “Simulations of H-Mode Plasmas in Tokamak Using a Complete Core-Edge Modeling in the BALDUR Code,” Plasma Science and Technology, Vol. 14, No. 9 pp. 778-788, 2012. [12] Pianroj, Y. and Onjum, T., “Projection of bootstrap current in the ITER with standard type I ELMy H-mode and steady state scenarios”, Songklanakarin J. Sci. Technol, Vol. 34, No. 1 pp 77-91, 2012. [13] Klaywitthaphat, P. and Onjun, T., “Simulations of plasma behavior during pellet injection in ITER” Plasma Physics Reports Vol. 38, No. 6, pp 496-502, 2012. [14] Painroj, Y., Techakunchaiyanunt, J. and Onjun, T., “Model for Pedestal Transport Based on Suppression of Anomalous Transport Using ωE ×B Flow Shear and Magnetic Shear” J. Phys. Soc. Jpn, Vol. 81, No. 4, pp 044502, 2012. [15] Leekhaphan, P. and Onjun, T.,“Pellet Injection into H-mode ITER Plasma with the Presence of Internal Transport Barriers,” Plasma Physics Reports, Vol. 37, No. 4, pp 321-337, 2011. [16] Wisitsorasak, A. and Onjun, T., “Impacts of Pellets Injected from the Low Field Side on Plasma in ITER,” Plasma Physics Reports, Vol. 37, No. 1, pp. 1-18, 2011. [17] Chatthong, B., Onjun, T. and Singhsomroje, W., “Model for toroidal velocity in H-mode plasmas in the presence of internal transport barriers,” Nuclear Fusion Vol. 50, pp. 064009, 2010. [18] Pianroj, Y., Chuchinda, C., Leekhaphan P. and Onjun, T., “Behaviors of Impurity in ITER Plasma with Standard Type I ELMy H-mode and Steady State Scenarios,” Plasma Physics Reports Vol. 36, No. 10, pp. 827, 2010. [19] Onjun, T. And Pianroj, Y. Simulations of ITER with combined effect of internal and edge transport barriers, Nuclear Fusion, Vol. 32, pp. 075003, 2009. [20] Pianroj, Y. and Onjun, T. Performance Analysis of Low-power Tokamak Reactors using Predictive Integrated Modeling Code, 2010.

TIJSAT
12 Thammasat International Journal of Science and Technology, Vol. 17, No. 3, July-September 2012
[21] Hannum, D. Bateman, G. Kinsey, J. et al. Comparison of high-mode predictive simulations using Mixed Bohm/gyro-Bohm and Multi-Mode (MMM95) transport models, Physics of Plasmas, Vol. 8, pp. 964-974, 2001 [22] Onjun, T. Bateman, G. Kritz, A.H. et al. Comparison of low confinement mode transport simulations using the mixed Bohm/gyro-Bohm and the Multi-Mode-95 transport model, Physics of Plasmas, Vol. 8, pp. 975-985, 2001. [23] Honda M and Fukuyama A. Comparison of turbulent transport models of L- and H-mode plasmas, Nuclear Fusion, Vol. 46, pp. 580-593, 2006. [24] Bateman, G. Kritz, A.H. Kinsey, J.E. et al. Predicting temperature and density profiles in Tokamaks, Physics of Plasmas, Vol. 5, pp. 1793-1799, 1998. [25] Guzdar, P.N. Drake, J.F. McCarthy, D. et al. Three-dimensional Fluid Simulations of the Nonlinear Drift-resistive Ballooning Modes in Tokamak Edge Plasmas, Physics of Fluids, Vol. 5, pp. 3712, 1993. [26] Tala T J J, Heikkinen J A and Parail V V. ITB formation in term of ωExB flow shear and magnetic shear on JET, Plasma Phys. Control. Fusion, Vol. 43, pp. 507-524, 2001. [27] Itoh K, Yagi M, Itoh S I, et al. L-mode confinement medel based on transport-MHD theory in Tokamaks, Plasma Phys. Control. Fusion, Vol. 35, pp. 543-549, 1993. [28] Itoh K, Itoh S I, Fukuyama A, et al. Self-sustained turbulence and L-mode confinement in toroidal plasmas, Plasma Phys. Control. Fusion, Vol. 36, pp. 279-306, 1994. [29] Fukuyama A, Itoh K, Itoh S I, et al. Transport simulation on L-Mode and improved confinement associated with current profile modification, Plasma Phys. Control. Fusion, Vol. 37, pp. 611-631, 1995. [30] W.A. Houlberg, K. C. Shaing, S. P. Hirshman et al. (1997) Bootstrap current and neoclassical transport in tokamaks of arbitrary collisionality and aspect ratio, Physics of Plasmas, 4, pp.3230-3242. [31] Onjun, T. Bateman, G. Kritz, A.H. et al. Models for the pedestal temperature at the edge of H-mode Tokamak plasmas, Physics of Plasmas, Vol. 9, pp. 5018-5030, 2002.