predictive analytics with ux research data: yes we can!
TRANSCRIPT

Predic've Analy'cs with UX Research Data: Yes We Can!
Mike Fritz Paul Berger
UXPA BOSTON 2015 1
Paul Berger Visi'ng Scholar and Professor of Marke'ng, and Academic Director of Master of Science in Marke'ng Analy'cs, Bentley University Ph.D. Sloan School, MIT
Mike Fritz Manager of Usability and User Experience Research PeopleFluent MS in Human Factors in Informa'on Design Bentley University
Who We Are
2

Our book: March 2015
3

What we’re going to discuss today
• Basic (and not so basic) predic've analy'cs you can apply to the data you’re collec'ng today!
• We’ll show examples using data garnered from moderated and
unmoderated usability tests and surveys.
• Confidence Intervals • Correla'on • Simple Linear Regression • Stepwise Regression
• We’re going to concentrate on usability and survey data, but you can apply these techniques to all kind of data that you might collect using different methods: interviews, focus groups, card sor'ng, contextual inquiries, and even physiological tes'ng, such as eye tracking, heart rate variance and skin conductance.
4

Confidence Intervals
5

Confidence Intervals: A good way to depict them:
6
Put simply, a confidence interval is an interval which contains a popula'on value, such as the popula'on mean, with some specified probability, usually, 0.95 or 95%.

Confidence Intervals
7
• Confidence intervals are extremely useful—and even cri'cal—to any UX researcher.
• In fact, it’s easy to make a case that construc'ng a confidence interval is even more important when you have a small sample size.
• And, indeed, that’s exactly what we have in most usability datasets.
• However…consider the following:

How is preparing for a usability test and making a big bowl of chili for Sunday’s football game* the same?
*with or without Tom Brady

It’s almost the same amount of work gehng ready for 4….or 8.
9
So you might as well “serve” 8, because……

You will be able to report out your
findings with a LOT more sta's'cal
authority! 10

Usability Tes'ng: It’s all about the prep 'me……
• The prepara'on for crea'ng and preparing a test for 4 versus 8 is almost the same. That is, it’s the same amount of work to write up a test plan, define the tasks, get consensus on the tasks, and coordinate the assets for the test whether you’re tes'ng for 4 or 8.
• Admiledly, it’s going to take longer to recruit and actually run the tests, but it’s probably a difference of only one day of tes'ng.
11

Example: Likert Scale with 8 par'cipants
12
• Let’s assume you’ve just finished running a usability test for an online shoe store.
• Aner the test, par'cipants are asked to rate their agreement
with the statement “Finding running shoes in my size is easy” on a scale of 1 to 5, where 1 = Strongly Disagree and 5 = Strongly Agree.
• Let’s assume that there was an even split between “3”s and “4”s (4 each) for an average of 3.5.
• The resul'ng 95% confidence interval for the true mean ra'ng of 3.5 ± 0.45.

Example: Likert Scale with 4 par'cipants
13
• Now assume that you ran the same test with only 4 par'cipants. • Again, aner the test, par'cipants are asked to rate their agreement with
the statement “Finding running shoes in my size is easy” on a scale of 1 to 5, where 1 = Strongly Disagree and 5 = Strongly Agree.
• Again, let’s assume that there was an even split between “3”s and “4”s (2 each).
This &me, you s&ll have an average of 3.5, but now your confidence interval has more than doubled in width to 3.5 ± 0.92!
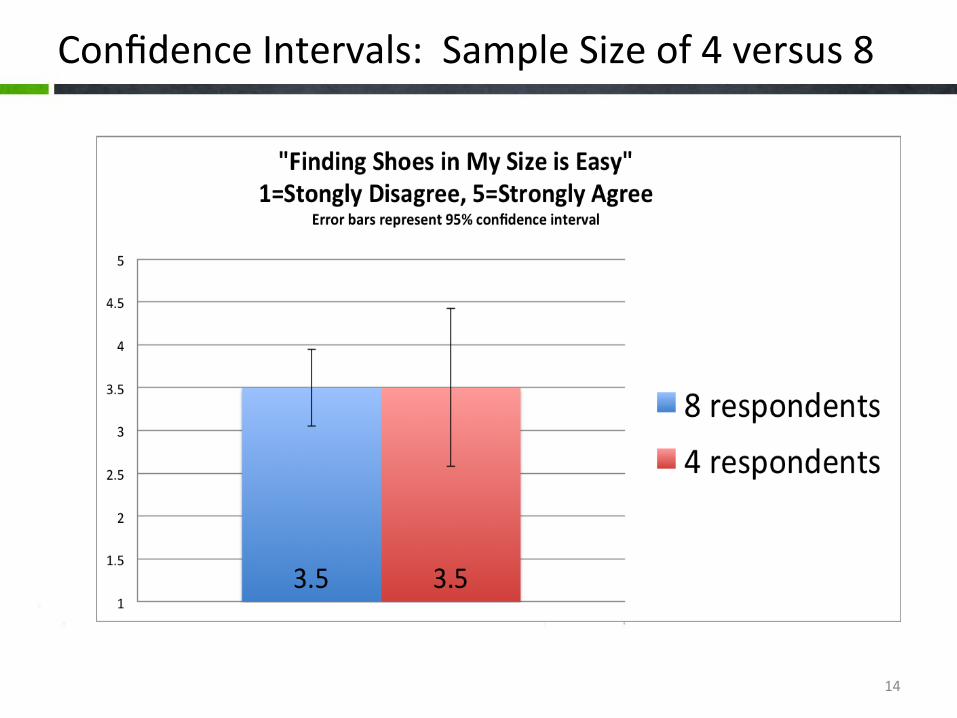
Confidence Intervals: Sample Size of 4 versus 8
14

Correla'on
15

Correla'on
16
• The “correla'on coefficient” reflects the rela'onship between two variables.
• Specifically, it measures the strength of a straight-‐line rela'onship between two variables, and also tells you the direc'on of the rela'onship, if any. It is a numerical value that ranges between −1 and +1 and is typically denoted by “r”:
− 1 ≤ r ≤ + 1

Correla'on Scenario
Scenario
• You’re a usability researcher at Behemoth.com, an employment Web site.
• The main source of Behemoth’s income is from employers who post jobs on the site and buy access to its enormous database of over a million resumes to search for good candidates to fill those jobs.
• The candidate search engine is not great, and is only
effec've for those savvy recruiters who know how to construct clever Boolean search strings that yield results that get them what they want.
17
Correla'on Scenario
Scenario(cont.) • You hear from the grapevine that Behemoth is about to spend 80 million dollars on a brand new “Turbo Search” (built by a Palo Alto start-‐up) that will “fundamentally change the way recruiters search for candidates through its algorithm that searches for people, not keywords.”
• What’s the rub? Turbo will kill Boolean search! Dissension in the ranks:
“Will recruiters abandon us if we abandon Boolean search?”
18

19

Correla'on Scenario
Your Challenge: Determine whether killing
Boolean capability is a mistake before Behemoth blows $80 million on a new search
engine!
20

Correla'on Methodology
1. Launch unmoderated usability test of the current Behemoth search engine to about 300 recruiters. All the respondents are tasked with finding good candidates for the same three requisi'ons.
2. Aner comple'ng the tasks of finding candidates for the three posi'ons, the par'cipants are asked to rate their percep'on of usefulness for each of the 15 fields in the search engine, on a scale of 1–5, where 1 = not at all useful and 5 = extremely useful.
3. Calculate the correla'on coefficient between the usefulness of the ability to perform a Boolean Search and the likelihood of adop'on of the Search engine.
21
Rated Search Engine Components
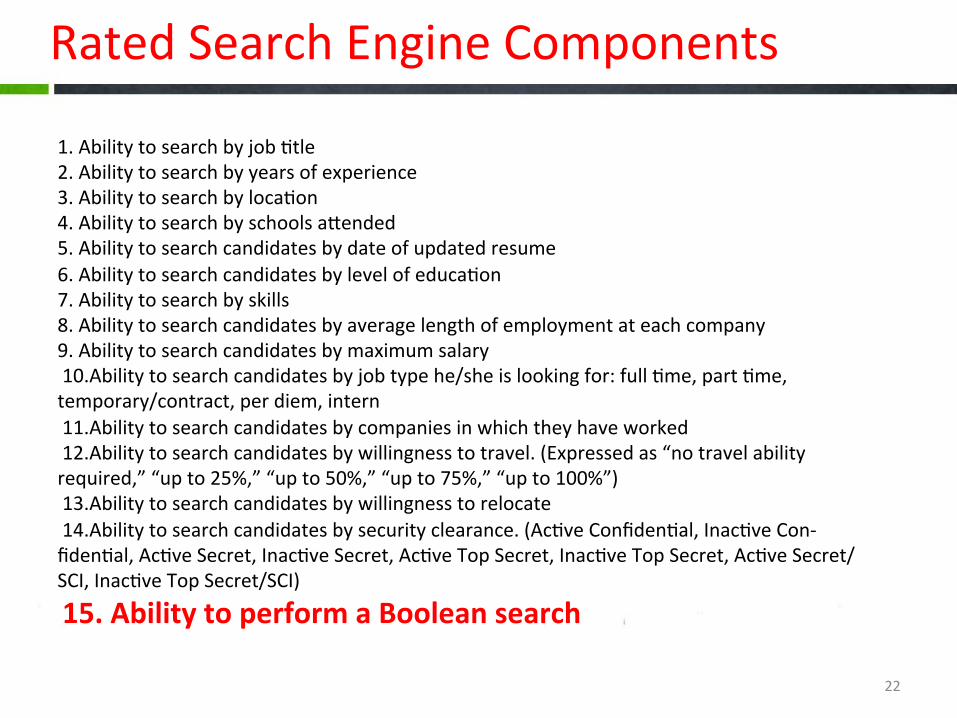
1. Ability to search by job 'tle 2. Ability to search by years of experience 3. Ability to search by loca'on 4. Ability to search by schools alended 5. Ability to search candidates by date of updated resume 6. Ability to search candidates by level of educa'on 7. Ability to search by skills 8. Ability to search candidates by average length of employment at each company 9. Ability to search candidates by maximum salary 10.Ability to search candidates by job type he/she is looking for: full 'me, part 'me, temporary/contract, per diem, intern 11.Ability to search candidates by companies in which they have worked 12.Ability to search candidates by willingness to travel. (Expressed as “no travel ability required,” “up to 25%,” “up to 50%,” “up to 75%,” “up to 100%”) 13.Ability to search candidates by willingness to relocate 14.Ability to search candidates by security clearance. (Ac've Confiden'al, Inac've Con-‐fiden'al, Ac've Secret, Inac've Secret, Ac've Top Secret, Inac've Top Secret, Ac've Secret/SCI, Inac've Top Secret/SCI)
15. Ability to perform a Boolean search
22

Dependent Variable
Methodology: 3. At the very end of the survey ra'ng, you insert the dependent variable ques'on(y): “Imagine that this search engine is available to you at no cost to find qualified candidates using the candidate databases you currently employ. Rate your likelihood of adopGng this candidate search engine on a scale of 1–5, where 1 = not at all likely and 5 = extremely likely.”
23

Correla'on Methodology: Excel Screen Shot
24

Correla'on Methodology: Excel Screen Shot
25
• We can see that the correla'on coefficient is +0.449. What this tells us is that a higher sense of usefulness of a Boolean search capability is associated with a higher likelihood of adop'on of the search engine.
• This also says that 20.2% (100 * (.449) ^ 2) of the variability in likelihood of adop'on of the search engine is explained by a recruiter’s assessment of the usefulness of having a Boolean search available.
We can also determine the specific rela'onship between the 2 variables:

Linear Regression
26

Linear Regression
27
• The fundamental purpose of regression analysis is to study the rela'onship between a “dependent variable” (which can be thought of as an output variable) and one or more “independent variables” (which can be thought of as input variables).
• A linear regression analysis will determine the best fihng slope and intercept of a linear rela'onship.
• In this scenario, we will have one independent variable—this form of regression is called “simple regression.”
• In our next scenario, we will have several input/independent variables (i.e., X’s)—this will be called “mul'ple regression.”

Linear Regression Methodology: Excel Screen Shot
28

Linear Regression Methodology: Excel Screen Shot
29

Results
• The very low p-‐value(less than once chance in a billion!) indicates that there is virtually no doubt that there is a posiGve linear relaGonship between the usefulness of the Ability to do a Boolean search, and the Likelihood of AdopGon of the search engine.
• Furthermore(and as noted earlier), the r-‐square value of 0.202 means we es'mate that the usefulness of Boolean, by itself, explains more than 20% of the responder’s choice for the Likelihood of Adop'on of the search engine query.
• The best fihng (or “least squares”) line is
Yp=2.4566 + 0.460 * X Example: if X=3, Yp=3.84
30

Example 2
Stepwise Regression
31

Stepwise Regression
• Your results trickle upwards in the managerial chain. Your CEO, Joey Vellucci, exasperated by all the nega've news that always comes from the usability lab, proclaims to his VP of development:
“These UX folks remind me of Agnew’s
‘naUering nabobs of negaGvism’. Why don’t they come up with their own ideal search engine instead of just finding problems all
the Gme in the lab?” 32

Stepwise Regression
Challenge Accepted!
Stepwise Regression to the Rescue!
33

For those of you born way aner Watergate:
34

Linear Regression Methodology
To refresh your memory: 1. You launched an unmoderated usability test of the current Behemoth search engine to about 300 recruiters. All the respondents were tasked with finding good candidates for the same three requisi'ons.
2. Aner comple'ng the tasks of finding candidates for the three posi'ons, the par'cipants are asked to rate their percep'on of usefulness for each of the 15 fields in the search engine, on a scale of 1–5, where 1 = not at all useful and 5 = extremely useful.
35

Stepwise Regression Example 3. At the very end of the survey ra'ng, you insert the moment of truth ques'on: “Imagine that this search engine is available to you at no cost to find qualified candidates using the candidate databases you currently employ. Rate your likelihood of adopGng this candidate search engine on a scale of 1–5, where 1 = not at all likely and 5 = extremely likely.”
36

Stepwise Regression Example
• Stepwise regression is a varia'on of regular mul'ple regression that was invented to specifically address the issue of variables that overlap a lot in the informa'on they provide about the “Y” (the output variable).
• It’s an automated process that brings variables in (and once in a while out) of the equa'on one at a 'me.
37

The beauty of stepwise regression!
Stepwise regression has 2 excellent quali'es: 1)All variables in the final equa'on are sta's'cally significant. 2)It is guaranteed that there are no variables not in the equa'on that would be sta's'cally significant.
38

Stepwise Regression Example: SPSS Screen Shots
39

Stepwise Regression Example: Screen Shots
40

Stepwise Regression Example: Screen Shots
41

Sta's'cally significant variables
42
• Ability to perform a Boolean search • Ability to search by skills • Ability to search by job 'tle • Ability to search candidates by companies in which they have worked
• Ability to search by loca'on • Ability to search by years of experience • Ability to search candidates by level of educa'on

Stepwise Regression Example
Yc = 0.528 + 0.311 * X15 + 0.177 * X7 + 0.121 * X11 + 0.153 * X1 + 0.106 * X + 0.106 * X2 + 0.055 * X6, or, if we order the variables by subscript, Yc = 528 + 0.153 * X1 + 0.106 * X2 + 0.106 * X3 + 0.055 * X6 + 0.177 * X7
+ 0.121 * X11 + 0.311 * X15.
In other words, this equa'on says that if we plug in a person’s value for X1, X3, X6, X7, X11, and X15, we get our “best” model for predicGng what the person will choose for Y, the likelihood on the 5-‐point scale that he/she will adopt the search engine. AND, NOTE THAT ALL THE COEFFICIENTS ARE POSITIVE!!
43

Stepwise Regression Example: Recommenda'ons
For your recommenda'ons, you produce a wireframe that illustrates the user interface for a new search home page: 1. Your new design shows a two-‐'ered system; a “basic search” includes the top seven variables iden'fied as significant in your stepwise regression analysis. 2. If desired, the user can click on “Advanced” search to reveal the remaining eight variables. Even though they were not staGsGcally significant, and cannot be said to “add to the story,” they nevertheless might be useful for certain recruiters looking for a very specific set of qualifica'ons. 44

Stepwise Regression Example: CEO LIKES IT!
45

Our book: March 2015
46

What we show you how to do in the book.
• Prac'cal Advice on choosing the right data analysis technique for each project
• A step-‐by-‐step methodology for applying each technique, including examples and scenarios drawn from the UX field.
• Detailed screen shots and instruc'ons for performing the techniques using Excel(both for PC and Mac) and SPSS
• Clear and concise guidance on interpre'ng the data output
• Exercises to prac'ce the techniques, along with access to sample data on the companion website.
47

Don’t fear the future…
48

Embrace it!
49

Predic've Analy'cs with UX Research Data: Yes We Can!
Mike Fritz Paul Berger
UXPA BOSTON 2015 50
[email protected] [email protected]
QUESTIONS?