predictive data driven dashboard as an academic guidance
TRANSCRIPT

Treball final de grau
GRAU D’ INFORMÀTICA
Facultat de Matemàtiques i InformàticaUniversitat de Barcelona
Predictive Data Driven Dashboard
as an Academic Guidance Support
Platform for Mentors
Autor: German Dempere
Directors: Dr. Eloi Puertas
Dra. Laura Igual
Realitzat a: Departament de Matemàtiques i Informàtica
Barcelona, 27 de juny de 2018


Contents
Abstract iii
1 Introduction 1
1.1 Motivation . . . . . . . . . . . . . . . . . . . . . . . . . . . . . . . . . . 2
1.2 Objectives . . . . . . . . . . . . . . . . . . . . . . . . . . . . . . . . . . 2
1.2.1 Data Science to predict Student Performance . . . . . . . . . . 2
1.2.2 Data Visualization for mentors . . . . . . . . . . . . . . . . . . 3
1.3 Thesis Structure . . . . . . . . . . . . . . . . . . . . . . . . . . . . . . . 3
1.4 Context of the Project . . . . . . . . . . . . . . . . . . . . . . . . . . . . 4
1.5 Related Work . . . . . . . . . . . . . . . . . . . . . . . . . . . . . . . . 4
2 Project Planning 7
3 Analysis and Design 9
3.1 Requirements . . . . . . . . . . . . . . . . . . . . . . . . . . . . . . . . 9
3.2 Design of the Data Science Process . . . . . . . . . . . . . . . . . . . . 10
3.3 Design of the Dashboard . . . . . . . . . . . . . . . . . . . . . . . . . . 11
3.3.1 Dashboard Back-end Technologies . . . . . . . . . . . . . . . . 11
3.3.2 Dashboard Front-end Technologies . . . . . . . . . . . . . . . 13
4 Development 15
4.1 Dashboard Backend . . . . . . . . . . . . . . . . . . . . . . . . . . . . . 15
4.1.1 Data Model . . . . . . . . . . . . . . . . . . . . . . . . . . . . . 16
4.1.2 Webservice API . . . . . . . . . . . . . . . . . . . . . . . . . . . 18
4.2 Dashboard Frontend . . . . . . . . . . . . . . . . . . . . . . . . . . . . 18
4.2.1 User Interface . . . . . . . . . . . . . . . . . . . . . . . . . . . . 19
i

4.2.2 Vue, Javascript Framework . . . . . . . . . . . . . . . . . . . . 21
5 Experiments and Results 23
5.1 Data Gathering and Cleaning . . . . . . . . . . . . . . . . . . . . . . . 23
5.2 Experimental Settings . . . . . . . . . . . . . . . . . . . . . . . . . . . 25
5.2.1 Random Forest Regression . . . . . . . . . . . . . . . . . . . . 25
5.2.2 Bayesian Ridge Regression . . . . . . . . . . . . . . . . . . . . 26
5.3 Comparative to Previous Work . . . . . . . . . . . . . . . . . . . . . . 27
5.4 Dashboard Usability . . . . . . . . . . . . . . . . . . . . . . . . . . . . 29
6 Conclusion and Future Work 31
Bibliography 33
Appendix A - Installation guide 37

Abstract
The early prediction of a student’s performance through their academic career
is very relevant for mentor guidance and personalized advice. We present a com-
bined data science and web application dashboard for analyzing real academic
data from 4 degrees in the Universitat de Barcelona. Very satisfactory results are
achieved on the prediction of course grades. After obtaining the predictions, We
display different visualizations of the predictions in a dashboard platform to help
mentors understand their set of students and identify ones in need of special at-
tention. Big opportunities open for the future.
Resum
La predicció del comportament i notes d’un estudiant durant la seva trajec-
tória universitària es d’especial importància per a les tasques d’un tutor acadèmic
i per tal de poder oferir consells personalitzats. Presentem un projecte combi-
nat de Ciència de Dades i desenvolupament d’una Aplicació Web en forma de
Dashboard per analizar dades acadèmiques reals de cuatre graus de la Universi-
tat de Barcelona. S’obtenen resultats molt satisfactoris en la predicció de notes
d’assignatures no cursades. Després d’obtenir les prediccions, les carregem a una
plataforma digital per ajudar al tutors a entendre els seus estudiants i poder iden-
tificar quins necesiten especial atenció. Grans oportunitats s’obren de cara al futur.
Resumen
La prediccion del comportamiento y las notas de un estudiante durante su car-
rera universitaria es de especial relevancia para las tareas de un tutor académico,
por tal de poder ofrecer consejos personalizados. Presentamos un proyecto combi-
nado de Ciencia de Datos y desarrollo de una Aplicacion Web en forma de Dash-
board para analizar datos académicos reales de cuatro grados de la Universidad
de Barcelona. Obtenemos resultados muy satisfactorios en cuanto a la prediccion
de notas de asignaturas aun no cursadas. Después de obtenir las predicciones, las
importamos a una plataforma digital para ofrecerlas a los tutores. De manera que
puedan entender mejor los estudiantes que tutelan y determinar cuales necesitan
de una atención especial. Oportunidades considerables se abren de cara al futuro.

iv Abstract

Chapter 1
Introduction
As part of an effort to improve learning conditions in academic communities of
students, most Universities today have developed a mentorship program wherein
a teacher is assigned to a student for the duration of their academic degree. This
mentor, as is often referred to, is tasked with following the development of all stu-
dents they are assigned to, and offer career advice and course recommendations
if requested by the student.
Due to the high enrollment rates of tertiary education[3], mentors are over-
whelmed by the amount mentored students that they have to follow. Right now
a single teacher may be in charge of upwards of 60 students, each with a com-
plex and interconnected academic record that can span multiple degrees, with a
considerable variance from student to student.
The aim of mentorship programs is to offer personalized guidance, but this
goal is jeopardized by the amount of data each student produces every passing
year. Data which is also often not very easy to access from a mentor’s standpoint.
Previous work has discussed the possibility of a tool aimed at teachers and
mentors [2] that would allow an ease of access to information on a student’s pro-
file in a way that is not currently possible. Furthermore, such tools have been
proven in limited trials to be effective [9] and that can be built off existing Learn-
ing Management Systems already in place in most universities. All studies point
to the data existing, just not being taken advantage of.
Since the last attempt [2] at applying predictive models to real data from the
1

2 Introduction
University of Barcelona a year ago, a full year’s worth of data has been generated.
Since machine learning methods generally improve their performance with more
data, a never attempt is performed at improving prediction metrics.
Visualizations of overall performance and global metrics has been conceptual-
ized in previous iterations of this project[2]. The next goal is to be able to present
an individualized student record coupled with the predictions in an easy-to-digest
manner. To that end we develop a Dashboard platform to be used by mentors. This
tool enables a full view of a student’s past and future in a way that is not currently
possible.
1.1 Motivation
The motivation for this project is continuing previous attempts [1, 2] at closing
the gap between data science for education, and mentors. Enabling the latter to
perform data-driven decisions based on true historical data and predictive models.
Many studies have focused on developing new Data Science methods for stu-
dent performance predictions but final working implementations are seldom fully
realized, this works aims to make a real attempt at developing a fully-featured
mentoring platform that is integrated with the output of ML algorithms.
1.2 Objectives
The objectives of this work are two-fold. One is to improve upon previous
performance metrics across all datasets for the grades prediction thanks to new
data (obtained 2016) and harvest the already obtained dropout intention predic-
tions [2]. The second objective is to present all of this data in a form that is most
accessible by Mentors and Heads of Department.
1.2.1 Data Science to predict Student Performance
Part of this projects focuses on expanding and improving on the data gathering
and cleaning previously done to predict future courses’ grades. To that end we
will use state-of-the-art prediction methods and evaluate various methods of data
cleaning and data exploration.

1.3 Thesis Structure 3
1.2.2 Data Visualization for mentors
Besides obtaining the predictions, we also develop a companion application to
Learning Management Systems (LMS) in the form of a dashboard accessible by
mentors. The goal of this dashboard is to present a huge amount of data in a way
that is easily browsable and discoverable about a mentor’s set of students.
Besides being able to show informative and interactive graphs, the dashboard
also aims to be actionable on discovery of a student in need of counseling sup-
port. In addition, it also pro-actively generates alerts for students with a predicted
positive dropout intention.
1.3 Thesis Structure
This thesis will be organized in several sections, each one detailing a part of the
process. From conceptualization and design, to implementation of the Academic
Guidance Support Platform.
• Project Planning: The work is laid out and planned according to realistic
expectations. The scope of what is and is not to be attempted or built is also
defined, so as to keep the list of features well defined.
• Analysis and Design: A careful design of the Machine Learning approach is
defined. Close cooperation necesary with the University of Barcelona’s Sec-
retary personnel is needed to obtain the data. As well as how the continuous
iterative design of the Academic Guidance System Dashboard is performed,
again in cooperation with teachers.
• Development: The designed Dashboard’s development phases and details
on the implementation. Split between developing the Machine learning al-
gorithms and data filtering, and developing from the ground up the mentor
Dashboard tool.
• Experiments and Results: Experiments detailed with the datasets used, show-
ing comparisons with previous work and results on new data for the Ma-
chine Learning predictions. Initial trials of the Dashboard and opinions are
also presented.

4 Introduction
• Discussion and Future Work: A final word on what has been accomplished
as well as evaluation of the results. Future applications and implementation
details on a non-controlled environment are discussed, as well as theorizing
a trial run.
1.4 Context of the Project
This thesis is part of the Teaching Innovation Project created in the Departa-
ment de Matemàtiques i Informàtica and the Departament de Mètodes de Investigació i
Diagnòstic en Educació (MIDE) of the University of Barcelona.
The final aim of the project is to create a tool to help academic advisors, men-
tors, and heads of department manage large sets of students. The project has been
divided into 5 phases:
1. Acquisition, centralization and anonymization of student’s data
2. Data Exploration, using data science, statistical and graphing techniques.
3. Use of Machine Learning Techniques to predict final students grades and
other useful prediction outputs.
4. Development of the System / Platform as a deployed finalized product.
5. Evaluation of the System / Platform in controlled trials.
This thesis continues the work started in [1, 2] continuing to advance to phase 3
and placing special effort in phase 4, completing the goal objective for that phase,
and delving into possibilities for phase 5.
1.5 Related Work
The usage of already-available data to perform Learning Analytics and run
Predictive models is a field that has recently attracted much attention. Some
works[11] suggest that there needs to be a concerted effort to understand, access,
and make use of the vast amounts of data that Academic Institutions possess.
Only by acknowledging and exploring that repository of data can we advance the
field of Learning Analytics, the paper suggests.

1.5 Related Work 5
Data Science has been successfully applied to education before[4] to predict the
final graduation grade of a student by looking at the best available data at each
point in the academic career of a student. Other efforts[5] have tried to go further
and predict degree completion probability and other performance metrics that are
of high relevance to mentors. The next step has been to predict outcomes on a per-
course basis, [6] attains this goal and extracts useful and actionable predictions on
courses that a student is currently enrolled in.
Learning Management System (LMS) powered dashboards are a recent field
of study, with early steps towards the goal of developing one. [7] conceptualizes
an Early Warning System (EWS) using data from a LMS in place at an academic
institution to generate alerts on outstanding occurrences to students. The work
was specially focused around the role of Mentors and Advisors as central pillars
of the entire process. [8] goes into further detail on the development of this EWS,
citing how the integration of already-existing LMS data was accomplishable. As
well as the adoption of it by academic advisors. Further literature [9] has gone
to explain how the use of accurate analytics-based teacher-student interventions
have proved successful in their goal of improving a student’s outlook. The paper
also goes into detail on how the data on interactions must also be feed back into
the system to measure and improve.
Finally, tools have been devised to evaluate the readiness of such teacher as-
sistance platforms. A recent paper[10] surveys data from 24 institutions that have
adopted Learning Management Systems and are actively using them to promote
proactive action from their mentors. The design of an evaluation instrument,
named Learning Analytics Readiness Instrument (LARI) by the publication, hopes
to standardize the metrics that need to be evaluated on any implementation of
Learning Analytics tools. From performance to the ethical implications of such
tools. Results from the various institutions are very mixed, regarding the effi-
cacy of implementation as well as the results. Some institutions have adopted bad
practices while others have seen their mentorship programs improve substantially.

6 Introduction

Chapter 2
Project Planning
The work is planed to be equivalent to an entire semester of University. Start-
ing from October 2017 and ending on June 2018. Since other related studies are
also executed during the development of the project, such as a Poster publication,
the total span of 9 months is justified. The initial approach is to find a mid-
dle ground between Waterfall Development and Agile, allowing some room for
changing requirements and iterative design in the middle. Complex or broad-
scope changes are not considered for the latter phases of development.
The final project Gantt chart is presented in 2.1. We can observe a sprint-
oriented cycle of development, with scheduled meetings every two weeks for the
most part of the project.
Figure 2.1: Gantt chart for the entire Project.
7
8 Project Planning
Scheduled meetings help review finished work as well as establish new re-
quirements for the next weeks. Of special note are the dependencies. Along the
development of the project complex dependencies arise from a second round of
gathering and cleaning data, in order to prepare the most up-to-date Machine
Learning report.
By the end of April and the beginning of May, an effort was also diverted to
write a small poster to be sent for review and further exposition to the IEEE Data
Science Workshop 2018.

Chapter 3
Analysis and Design
An analytical approach to all of the requirements is crucial to manage the scope
of the project. The goal is attaining a final product, careful choosing requirements
and technologies at every step.
3.1 Requirements
Before beginning any work on the project, The set of high-level requirements
has to be scoped. Formally, we want to define what constitutes a finished part of
the project. Namely, we split the project into four big parts:
1. Data Gathering and Cleaning: Before we even begin, we have to obtain an
up to date dataset of all the grades from relevant faculties of the University of
Barcelona. After obtaining the datasets, we have to explore the data, extract
what is relevant, and clean it prior to its use.
2. Machine Learning Algorithms: After obtaining the cleaned data, a study of
proven and new methods of Machine Learning is run on the Dataset, trying
to maximize evaluation metrics across all data sets. Once a model is deemed
satisfactory, we generate all of the relevant predictions.
3. Dashboard Back-end and Server Setup: After we obtain our historical data
and our grades and dropout predictions, we create a suitable data model
that will allow us to exploitate the data using modern Database Engines.
Additionally, a web service API has to be designed and developed, as it will
9

10 Analysis and Design
be the access point to all the rest of the data. This phase also includes setting
up a Linux server to host the entire project so it is available on the Internet.
4. Dashboard Front-end User Interface: Finally, once everything is in place, we
can develop a website application front-end that makes full use of modern
browsers and the latest libraries in data visualization and graphs to translate
all of our data into a fully featured dashboard
3.2 Design of the Data Science Process
Before designing the Machine Learning approach we want to take, we first
have to make a choice in what kind of Data Science Framework (DSF) we want to
use. A DSF is a choice of Programming Language, Libraries and Tools that make
developing Machine Learning algorithms more convenient and most of all, fast.
Instead of re-implementing everything ourselves, we would use well-established
and proven tools. A few options arise:
1. Custom-developed ML algorithms. Similar to what is performed in [2], we
would create our own algorithms basically from scratch.
2. Python: Scikit[13]. A very complete and high-level ML set of tools. From
model fitting to prediction and evaluation. Without the burden of develop-
ing the algorithm ourselves, we can focus on other tasks, such as finding the
optimal model and running several rounds of evaluation.
3. Python: Tensorflow / Keras. A Deep Learning toolkit that makes the world
of Neural Network Machine Learning more accessible to the casual program-
mer. Although theoretically has a higher roof of performance than more
traditional (statistical) ML methods, an issue arises from not having a large
enough dataset. DNN Models are very sensitive to big differences in dataset
size.
4. R: Machine Learning and Statistical Analysis R Packages. A complete and
production-ready environment for ML using the R language. Very widely
used by scientists to run simulations and statistical predictions. A huge
number of packages are available for almost any kind of model imaginable.

3.3 Design of the Dashboard 11
In the end we choose to use Python paired with the Scikit Toolkit. We choose
python as it has been the language for all of the previous work in [1, 2] and for
being widely accessible. The choice between Keras or Scikit is decided by looking
at the amount of data available. We cannot guarantee that with data from only
2009 onwards (first year we have data on) we have a large enough training set for
a Neural Network.
Besides Scikit, we will also be making extensive use of other Python libraries,
namely Pandas and NumPy.
3.3 Design of the Dashboard
Next we explore the technologies available to us to develop the the Academic
Guidance Support Platform for mentors we want to design and develop.
First off we define that we want to use a web application-based approach to
our Dashboard Platform. We choose to develop a web application as they are
widely compatible with a full range of devices. Accessible from anywhere without
requiring to install additional software, and always up-to-date by definition.
A web application architecture is split in two parts: a Back-end and a Front-
end . The two parts should be as separate as possible to facilitate making changes
in one without breaking the other. This architecture has been used extensively
(i.e. [14]) by many institutions and companies, in order to deploy services to a
wide audience with varying needs and accessibility options. Next we discuss the
different options we have for the two aspects of the web application regarding
available technologies.
3.3.1 Dashboard Back-end Technologies
The Back-end is the part of the Platform responsible for ultimately sending
any and all information from a server hosted on the general Internet and the end
user connecting from a web browser. Without this part, nothing would actually
load on a user’s desktop or mobile browser. We explore a wide range of new
and time-tested technologies. Technologies not mentioned here are not under the
umbrella of knowledge afforded by the author.

12 Analysis and Design
1. PHP (Laravel). One of the first and oldest web languages. Currently in use
by server computers in the University of Barcelona. An application frame-
work needs to be layered on-top to manage the complexities of web appli-
cations. One such framework is Laravel. One upside of the use of PHP is
that integration with existing systems would be mostly painless, due to the
existing infrastructure.
2. NodeJS (Express). Very modern web framework based on a modern JavaScript
engine (V8). One upside of using JavaScript for the back-end would be using
the same scripting language that is native to web browsers, thus making it
easier to reason about the data model. Adoption and integration of the Node
runtime environment poses a challenge for an institution as the University
of Barcelona.
3. Python (Django). Time-tested web framework. Builds upon the expres-
siveness of Python to deliver extremely quick development times for the
purpose of Web Applications. Additionally, data modeling and database
handling come packaged by default. A major upside to using Python is that
the same language for the Machine Learning algorithms is used, as decided
in the previous section. Integration of Python into production also poses a
challenge to big institution, albeit not as big as Node, due to being a more
mature environment.
After carefully considering each option, and their upsides and downsides, we
decide to settle on using Python with the Django framework. The main reasons in-
clude a very fast development cycle, familiarity with the language and framework,
ease of installation and deployment, and very complete and detailed documenta-
tion.
As well as a web framework, the back-end is also composed of a database
engine that will hold all the data we need to display to the end user, as well as
a way to access that data from the front-end. We made the following choices for
each requirement:
• MySQL RDMS Server. A commonly used Relational Data Storage System.
MySQL covers all of our data storage and access needs, as well as provide a

3.3 Design of the Dashboard 13
very solid foundation to expand upon later on.
• GraphQL API Design.[15] A fairly-recent API implementation guide. GraphQL
centers around thinking of your data as an interconnected web of nodes and
edges, allowing you to traverse a graph of objects though their relations.
GraphQL has been studied to be very optimal[16] running complex queries.
Most important of all, GraphQL is designed to let the consumer request what
parts of the data are relevant, unlkne REST APIs. The concrete implemen-
tation of GraphQL for Python is known as Graphene, and it’s what we are
using.
3.3.2 Dashboard Front-end Technologies
A web applicaton’s Front-end is the set of user-facing technologies that de-
liver the final experience to the user browsing our web. The modern landscape
of browsers is currently dominated by a single set of markup and scripting lan-
guages: HTML, CSS and Javascript. Within the confines of these languages, most
web applications nowadays use what is known as a Front-End Application Frame-
work. It is usually comprised of a very complete JavaScript library that abstracts
away most of the complexities of modern browser scripting.
For the purposes of this work, we are using a JavaScript framework known as
Vue[17]. It offers many of the benefits of larger and more featured frameworks,
without the need to adhere to strict guidelines enforced by other such frameworks.
Thanks to Vue, the development of Web Applications can be very iterative and
feature-driven.
Finally, to take care of the visual aspect of the Dashboard, we use the Gentelella[18]
Bootstrap template. Bootstrap is a widely used set of styles for web development,
that is aimed at providing a consistent and responsive visual experience across a
wide range of devices, from desktop computers to mobile phones. Gentelella is a
freely-distributed template and styles that gives us a solid foundation on which to
build the visual user experience on our Dashboard, as can be seen on Figure 3.1. It
would be out of the scope of this project to also develop a competent set of styles
from the ground up, so that is why we choose to make use of freely-available
templates.

14 Analysis and Design
Figure 3.1: Gentelella example design. Gentelella Github Repository. 2017.
To summarize, we’ve gone over every requirement and category in the de-
velopment of a Web Application, identified our needs and selected appropriate
technologies that match our objectives and allow the project to focus on high-level
development instead of dwelling with the details of the involved technologies.
Of special note is the wide availability of choices and technologies that are
completely free to use and very well documented. An attempt at developing a
project not dissimilar to this one would be able to select a completely different set
of technologies and it would be none the worse for it.

Chapter 4
Development
In this section we will focus on the concrete steps taken to fully realize the
project. Putting special attention on the implementation details for the Web Ap-
plication.
4.1 Dashboard Backend
The first development steps focus on the back-end for the web application.
As the back-bone of the application, the requirements for this part are two-fold:
Provide a platform to permanently store data and access it, and serve the pages to
the web browser.
Figure 4.1 represents a diagram of the various building blocks that compose
our designed architecture. As can be observed, there are two distinct entry points
to the back-end. One is in charge of serving the HTML pages to a browser, and
the other offers a direct view into the database.
Zooming in on the HTTP Server, this is the part that sends the HTML pages
that contain the front-end to any user that enters the website.
As we mentioned previously, for this part we are using the Django Web Frame-
work. We take advantage of its many features to implement the necessary set of
characteristics that allow the Web Application to work:
• Serve static assets (HTML, CSS, JS). These are files to be interpreted by the
browser.
15

16 Development
Figure 4.1: Back-end Diagram, with the various building blocks.
• Manage security of access through a Login portal. Only personnel who is
authorized to access the site though a set of credentials may advance further
than the Login portal.
• Manage a user’s session and track their movements on the site. We want
to know who is logged in and what kind of user they are. For example,
Mentors have different views and sets of permissions in contrast to Heads of
Department.
4.1.1 Data Model
The data model represents how the data inside the Database needs to be in-
terpreted. A data model is meant to abstract the real world to a level that is both
useful and realistic.

4.1 Dashboard Backend 17
Figure 4.2 represents the developed data model for the Platform. The data
model must permit a set of requirements identified during several meetings with
teachers:
Figure 4.2: Data model.
1. A student may have more than one Academic Record.
2. A student may have more than one grade per course.
3. A student may have more than one Mentor. In fact, mentors are interpreted
to be assigned to Academic Records, not Students.
A lot of relationships are necessary to capture the entire set of possibilities.
Thanks to this versatility, this data model is not restricted to a single Degree, Fac-
ulty or even Campus. The added complexity of many relationships is thankfully
solved by the next piece in the back-end Architecture.

18 Development
4.1.2 Webservice API
The Web Service API is in charge of presenting an end-point for the front-end
to interact directly with the database. In this project it is used mostly as a one-way
data extraction channel, but usually there is bi-directional data flow from the Web
Application back to the Database.
In our project we’ve chose a bold and modern API design known as GraphQL.
The real power of GraphQL comes from interpreting the data model as a fully
traversable graph, and allow the front-end framework to "program" queries with-
out having to modify the back-end to incorporate new data views.
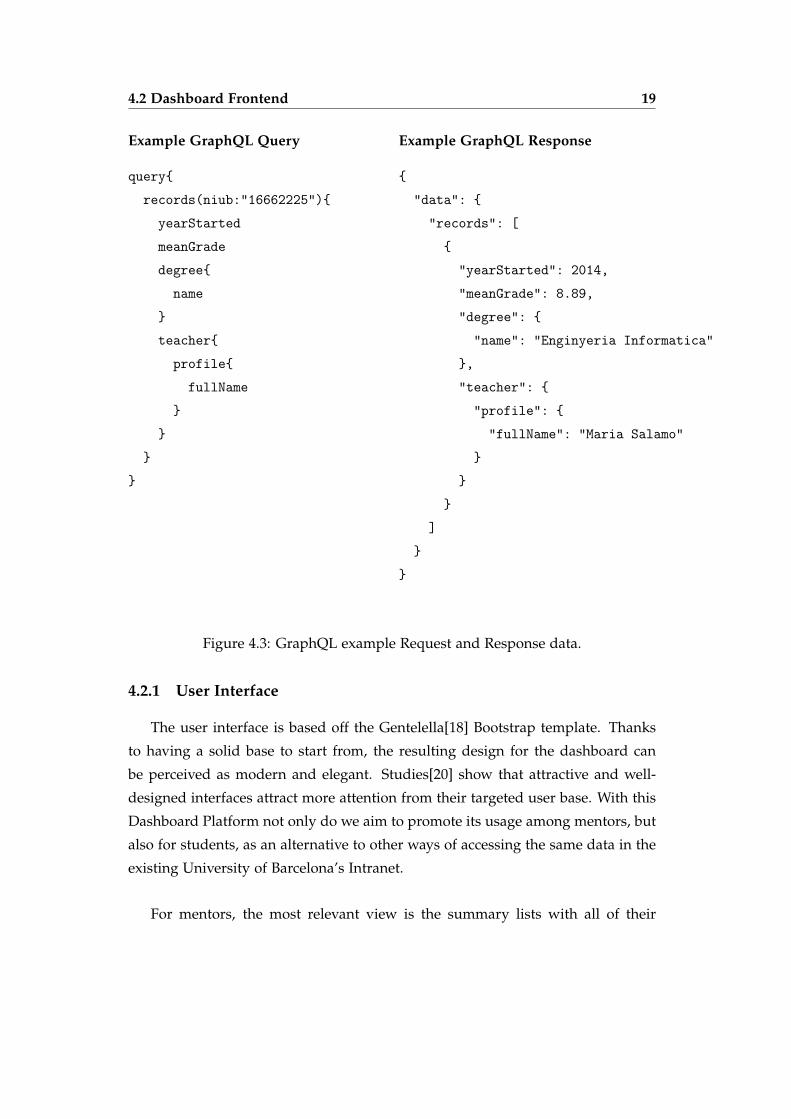
A clear example is presented in Figure 4.3, where we can observe what a
GraphQL query to get information about a particular student’s academic record
might look like. Please note how the graph traversal is performed via opening
and closing braces. Each brace opens up a node to explore the child nodes inside.
Eventually we get to the attributes, and those are returned as either strings or
numbers.
This Application Programing Interface (API) is used from the user’s browser
by the front-end framework, to recover data about a particular student or a set of
students.
As well as providing the requested data, the GraphQL API is also aware of
who is currently logged in and performing the requests. For example, a student
querying their academic record is fine, but if they try to query any other record,
the request is denied. The same thing happens for mentors, they may only access
data on the students they are assigned to. This prevents unauthorized access to
confidential data.
4.2 Dashboard Frontend
The front-end includes both the visible part of the website (layout and styles)
and the necessary scripts to interface with the Web service API.
4.2 Dashboard Frontend 19
Example GraphQL Query
query{
records(niub:"16662225"){
yearStarted
meanGrade
degree{
name
}
teacher{
profile{
fullName
}
}
}
}
Example GraphQL Response
{
"data": {
"records": [
{
"yearStarted": 2014,
"meanGrade": 8.89,
"degree": {
"name": "Enginyeria Informatica"
},
"teacher": {
"profile": {
"fullName": "Maria Salamo"
}
}
}
]
}
}
Figure 4.3: GraphQL example Request and Response data.
4.2.1 User Interface
The user interface is based off the Gentelella[18] Bootstrap template. Thanks
to having a solid base to start from, the resulting design for the dashboard can
be perceived as modern and elegant. Studies[20] show that attractive and well-
designed interfaces attract more attention from their targeted user base. With this
Dashboard Platform not only do we aim to promote its usage among mentors, but
also for students, as an alternative to other ways of accessing the same data in the
existing University of Barcelona’s Intranet.
For mentors, the most relevant view is the summary lists with all of their

20 Development
mentored students laid out in 3 separate boxed lists. As can be seen in Figure
4.4, the "Student List" view offers a very concise summary. Three sections are
immediately apparent:
Figure 4.4: Dashboard UI on the Student List View.
1. Top Students. Students placed in the top 10% that you happen to be a
mentor of are shown here.
2. Projected Dropouts. Students that you mentor and have been flagged by the
Machine Learning system as at risk of dropping out are listed here.
3. Mentored Students. The entire list of all students under your mentorship.
The list can be sorted by Surname (default) or by ascending / descending
order of their Academic Record’s mean grade.
In the case of students at risk of dropout, an additional alert is placed on their
profile page, as can be seen in Figure 4.5. This prompts mentors to initiate contact
with the Student to alleviate the situation and offer career advise.

4.2 Dashboard Frontend 21
Figure 4.5: Warning shown on projected dropouts.
4.2.2 Vue, Javascript Framework
Besides the style and design of the dashboard itself, a certain degree of dy-
namic integration with the data is expected of a Web application. To this end, Vue
has been used to interface with the Web Service API and convert the raw data into
palatable graphs and dynamic lists. In Figure 4.6 we can see an example of this.
Figure 4.6: Converting data to graphs and summary tables.
Vue recovers the academic record of a student and then displays it in a format
that is much more interpretable. In this case, predictions are also shown as we are

22 Development
logged in as a Mentor. In the case of students accessing their own profile, they
can’t see their predicted grades.
Chapter 5
Experiments and Results
5.1 Data Gathering and Cleaning
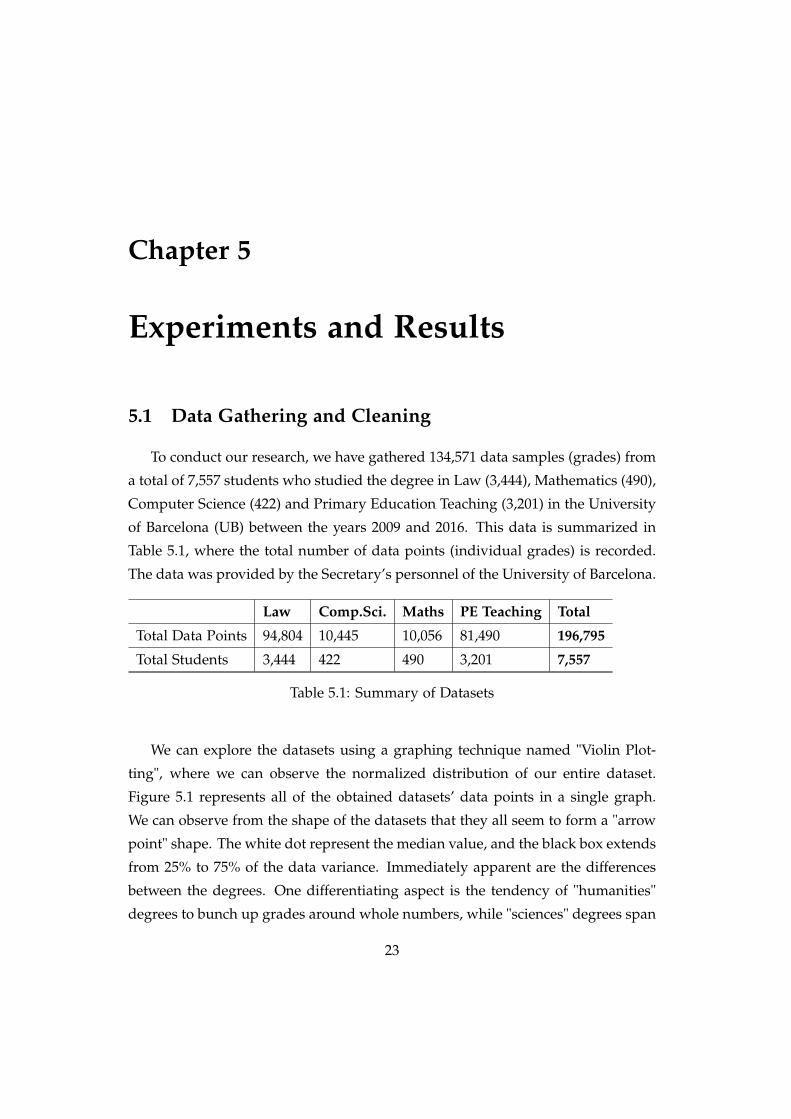
To conduct our research, we have gathered 134,571 data samples (grades) from
a total of 7,557 students who studied the degree in Law (3,444), Mathematics (490),
Computer Science (422) and Primary Education Teaching (3,201) in the University
of Barcelona (UB) between the years 2009 and 2016. This data is summarized in
Table 5.1, where the total number of data points (individual grades) is recorded.
The data was provided by the Secretary’s personnel of the University of Barcelona.
Law Comp.Sci. Maths PE Teaching Total
Total Data Points 94,804 10,445 10,056 81,490 196,795
Total Students 3,444 422 490 3,201 7,557
Table 5.1: Summary of Datasets
We can explore the datasets using a graphing technique named "Violin Plot-
ting", where we can observe the normalized distribution of our entire dataset.
Figure 5.1 represents all of the obtained datasets’ data points in a single graph.
We can observe from the shape of the datasets that they all seem to form a "arrow
point" shape. The white dot represent the median value, and the black box extends
from 25% to 75% of the data variance. Immediately apparent are the differences
between the degrees. One differentiating aspect is the tendency of "humanities"
degrees to bunch up grades around whole numbers, while "sciences" degrees span
23

24 Experiments and Results
the range in a much more continuous manner.
Figure 5.1: Violin plot of 4 grades datasets.
Before we attempt to run any Machine Learning algorithms, it is necessary to
clean and select the data that will truly be beneficial to run analysis on. According
to [21], Data Quality (DQ) is crucial to achieving the best performance a particular
Machine Learning model can reach given a dataset.
Even if we have obtained nearly 200,000 data points, the amount that is finally
used for training purposed is a much lower figure. The steps and justification for
each stage of cleaning are detailed below:
1. Discard all other attempts to pass a subject besides the first attempt. The fo-
cus of the predictions will be on predicting your "First Attempt" at a subject.
2. Students who have not attempted at least 80% of the first year’s curriculum
are excluded from the training set. This is done to select students who are
seriously attempting to enter the degree. First year part-timers and students
who have not completed most of the first year should not be used to model
student behavior. This way we intend to exclude outliers.
3. Students who have not attempted at least 70% of the second year’s curricu-
lum are excluded from the training set. The logic behind this is to also get

5.2 Experimental Settings 25
an accurate set of training data for the predictions.
The choice of numbers has been performed using a "Grid Search" of the best
parameters. Grid searching is an optimizing technique where a model is trained
multiple times using variable hyper-parameters. Hyper-parameters are parame-
ters that have huge implications on the final performance of the model and are set
a-priori. For our grid search, we explored the range between 50% and 100% for
both first year and second year. That is, we’ve run 25 simulations until reaching
the global optimun value of 80% for the first year and 70% for the second year.
5.2 Experimental Settings
For the purposes of predicting the grade that a student may obtain on their
first attempt at a new course, we want to explore several interesting Machine
Learning algorithms. Previous parts of this project [2] have focused on designing
a Collaborative Filtering method that tries to make lots of assumptions about how
students might behave and how they may rank the courses. The approach in this
thesis will be different.
After our data is cleaned and normalized to adhere to the same standards for
all datasets (regarding minimum number of attempts per year), we can proceed
to develop our machine learning algorithms. We choose a pair of distinct and
very relevant ML methods: Random Forest (RF) and Bayesian Ridge Regression
(BR). The choice of methods is motivated to be both concise and to explore both
non-linear (RF) and linear (BR) methods.
5.2.1 Random Forest Regression
A random forest regression is a meta estimator that fits a number of decision
tree classifiers on various sub-samples of the dataset and use averaging to improve
the predictive accuracy and limit over-fitting. After training N different trees with
different subsets of the data, predictions are made by averaging the prediction of
all N trees. A summary explanation can be observed in Figure 5.2
The "Forest" in RF comes from the multiple decision "Trees" that are contained
inside the model. Each Tree has non-linear decision boundaries to split the data

26 Experiments and Results
Figure 5.2: Random Forest Simplified, William Koehrsen, Medium, 2017.
at each Tree Node. Once a terminal node is reached, the value associated becomes
the final prediction for that Tree.
5.2.2 Bayesian Ridge Regression
Bayesian Ridge (BR) regression is a linear regression based on Bayesian Infer-
ence, wherein the probabilities of an outcome are updated as more data becomes
available. The use case for BR is in datasets that have errors approaching a normal
distribution[19]. In our case, this method seems adequate given that the grades
distributions follow a quasi-normal distribution in Figure 5.1.
To perform the model training, we first have to "fill in" the missing values in a
single student’s grades for each year of education. For example, if a student has
only attempted 8 out of the 10 courses for year 1, those last two must be extrapo-
lated somehow from existing data. Two methods are attempted and evaluated:
1. Fill in with the student mean grade. This effectively fills all missing values
for a single student with the same value, an average of all grades that a

5.3 Comparative to Previous Work 27
student has obtained.
2. Fill in with the mean grade for that subject. This fills the missing values
for a single student with different values, Taking the mean grade for each
subject, calculated using all other data points for that subject. Effectively
filling the same value for all students missing the same course grade.
After testing both methods and comparing the outcomes, the results for aver-
age course grade, option 2 is immediately discarded for being very detrimental to
the ML training step. Given how average grades hover almost always around 5.5,
it is easy to see why filling in that value for all students skews the predictions. We
are severely modifying the variance of the data.
5.3 Comparative to Previous Work
We train and evaluate both models proposed above on the 4 data sets. To
evaluate the models we follow the procedure specified in [2] to calculate the Mean
Absolute Error (MAE) of the predictions.
Training and predicting are done following the Leave-one-out cross-validation
technique. This technique is studied[22] to be of much higher statistical stability
and lower bias than other methods of cross-validation. In Figure 5.3, we can see a
bar plot of obtained Mean Absolute Error metrics across all datasets.
We are looking for low variation across datasets and the lowest possible values
for MAE. The lowest value is obtained by the Recommender in [2] evaluated on
the Primary Education Dataset. However we find that Bayesian Regression obtains
the overall lowest mean MAE score, and most importantly, whereas both other
methods seem to have a high variance in their MAE scores, BR is much more
stable.
To explore the results of the Bayesian Regresion prediction, we move to Figure
5.4. Here we have plotted the predictions of the LOO cross-validation of the BR
method against the real grades obtained by the students, run on the Computer
Science dataset.

28 Experiments and Results
Figure 5.3: MAE metric obtained for all methods across all datasets.
We have two color codes: Green colored points signify "properly classified" as
a passing or a failing grade. Red colored points signify "improperly classified"
passing or failing grade. In other words, if a real passing grade was predicted
to fail, or a real failing grade was predicted to pass, we consider that the "red"
portion of the graph. 67.5% of the total predictions are labeled correctly,
Additionally, a trend-line is painted ontop of the scatter plot. The trend-line
is a good indication of how good our predictions were. Ideally we want to bisect
the plot area across the 1st and 3rd quadrants, passing through (0,0). As we can
observe, our prediction still has room to improve.

5.4 Dashboard Usability 29
Figure 5.4: BR Predictions (y axis) against real grades (x axis). Trend-line in black.
5.4 Dashboard Usability
Initial demos of the Dashboard platform to target users have been well re-
ceived. The attractive visual design is effective in bringing interest to the platform,
and users find the data presented to them of use, both in the way that is presented
as well as in the value of such data. One example are the student graphs, seen in
Figure 4.6, that prove very useful for at-a-glance impressions on a student. Several
improvement suggestions are brought up by testers:
1. A clearer divide between Mentors and Heads of Department in terms of
what is shown. Currently, Mentors are shown a list of all their students,
while heads of Department have access to a more detailed dashboard with
relevant stats of their Degree.
2. Easier access to messaging capabilities from mentors to students.
3. Editing form on the front page, to put up announcements. This is however

30 Experiments and Results
related to opening up the platform for Students too, something which was
removed from the scope in the initial phases.
4. Better integration of data ingestion and import tool. The only way to import
data now is to load CSV file inside the server and then run python scripts to
insert them into the database. Not very user friendly.

Chapter 6
Conclusion and Future Work
We set on this project to bridge the gap between Machine Learning studies
and the applied use of technology to create real tangible products. The set of
requirements has lead us to reevaluate previous work and apply new Machine
Learning methods on a larger dataset. As a result of this, we have improved on
previous metrics of success by a non-marginal amount.
The great advantage of Learning Management Systems is that they accrue more
and more data every passing year. So in 5 years from now the models could be
trained with up to 50% more data points. This is very good news when using
Machine Learning algorithms that depend on rich and comprehensive datasets.
With more data, more extreme cleaning and filtering could be performed to only
select the most relevant data.
Regarding the development of a Data-Driven Guidance Platform for Mentors,
we can say we have successfully integrated both historical and predicted grades
data, as well as dropout intention alerts, successfully into a functioning online
platform. Powered by well-researched technologies, the adoption of such a plat-
form does not appear far-fetched. Significant effort on the part of the University
of Barcelona to accept updated software would have to occur.
In the future, to successfully integrate the platform the final stages of the de-
velopment must be completed, including a roll-out and production plan, as well as
creating more user-friendly data ingestion mechanisms. The datasets could also
31

32 Conclusion and Future Work
be enriched with more real-time data from platforms such as Moodle. It is not
unfeasible to attain near-real-time prediction and alert capabilities.
In the real of Machine Learning algorithms, the idea of using Neural Networks
should not be closed off completely in a future where more data is available. There
is a certain degree of non-linearity in most grades distributions, especially as seen
in humanities oriented degrees, where a NN-approach could work better than
purely statistical methods.

Bibliography
[1] Portell Penadès, Laura. (2016). Data science aplicat a resultats acadèmics
per a la millora del pla d accio mentorial a la Universitat de Barcelona,
http://hdl.handle.net/2445/105682.
[2] Rovira Cisterna, Sergi. (2017). Data science for a new generation of mentors:
building an academic-guidance system based on dropout and grades prediction,
http://hdl.handle.net/2445/119113.
[3] Eurostat, Europe 2020 indicators - educa-
tion , http://ec.europa.eu/eurostat/statistics-
explained/index.php/Europe_2020_indicators_-_education
[4] Tekin, A, (2014). Early prediction of students grade point averages at graduation:
A data mining approach. Eurasian Journal of Educational Research 54, 207-226.
[5] Ali Daud, Naif Radi Aljohani, Rabeeh Ayaz Abbasi. (2017). Predicting Stu-
dent Performance using Advanced Learning Analytics. ACM Digital Library
10.1145/3041021.3054164
[6] Rebecca Barber, Mike Sharkey. (2012). Course correction: using analytics to
predict course success. ACM ISBN: 978-1-4503-1111-3.
[7] Lonn, Steven & E. Krumm, Andrew & Waddington, Richard & Teasley,
Stephanie. (2012). Bridging the gap from knowledge to action: Putting analytics
in the hands of academic advisors. ACM International Conference Proceeding
Series. 10.1145/2330601.2330647.
[8] E Krumm, Andrew & Waddington, Richard & Teasley, Stephanie & Lonn,
Steven. (2014). A Learning Management System-Based Early Warning System for
33

34 BIBLIOGRAPHY
Academic Advising in Undergraduate Engineering. Learning Analytics: From
Research to Practice. 10.1007/978-1-4614-3305-7_6.
[9] E. Krumm, Andrew & Waddington, Richard & Lonn, Steven & Teasley,
Stephanie. (2014). Increasing Academic Success in Undergraduate Engineering
Education using Learning Analytics: A Design-Based Research Project.
[10] E. Arnold, Kimberly & Lonn, Steven & Pistilli, Matthew. (2014). An exercise
in institutional reflection: the learning analytics readiness instrument (LARI). 163-
167. 10.1145/2567574.2567621.
[11] Majeed, Insha & Naaz, Sameena. (2018). Current State of Art of Academic Data
Mining and Future Vision. 10.21817/indjcse/2018/v9i2/180902026.
[12] Mah, Dana-Kristin. (2016). Learning Analytics and Digital Badges: Potential
Impact on Student Retention in Higher Education. Technology, Knowledge and
Learning. 21. 10.1007/s10758-016-9286-8.
[13] Pedregosa et al. (2011) Scikit-learn: Machine Learning in Python. JMLR 12, pp.
2825-2830.
[14] Xiaoyin Kong & Li Liu & Lowe, Daiv (2006). Separation of Concenrs: a Web Ap-
plication Architecture Framework. Faculty of Enginnering, University of Tech-
nology, Sydney.
[15] Facebook, GraphQL: A data query language ,
https://code.facebook.com/posts/1691455094417024/graphql-a-data-
query-language/
[16] Hartig, Olaf & Perez, Jorge. An Initial Analysis of Facebooks GraphQL Language.
Linkoping University of Sweden.
[17] Introduction - What is Vue.js?. Vue 2 Official Documentation.
[18] Puikinsh. 2017. Gentelella: A free to use bootstrap template. Gentelella Github
Repository.
[19] Box, G. E. P.; Tiao, G. C. (1973). Bayesian Inference in Statistical Analysis. Wiley.
ISBN 0-471-57428-7.

BIBLIOGRAPHY 35
[20] Ravi Chandra Chaitanya Guntupalli. (2008). User Interface Design - Methods
and Qualities of a Good User Interface Design.. Department of Technology, Uni-
versity West, Swede.
[21] Valtorta, Marco. The Effects of Data Quality on Machine Learning Algorithms.
University of South Carolina, USA.
[22] Elisseeff, Andrè & Pontil, Massimiliano Leave-one-out error and stability of
learning algorithms with applications. Max Planck Institute for Biological Cy-
bernetics, Germany.

36 BIBLIOGRAPHY

A - Installation guide
This section will address what is required to install and deploy all the neces-
sary components to run the project on a server.
Requirements
The following requirements are absolutely necessary for the project.
1. Linux Operative System. Recommended distribution based on Ubuntu 16.04LTS
or above. Not tested on Widows Server platforms.
2. MySQL or equivalent server (MariaDB in the case of Linux Systems)
3. Python 2.7. Not compatible with Python 3+.
4. Virtualenv Python Package.
Installation Steps
The following requirements are absolutely necesary for the project.
1. Obtain the source code to the project.
2. Extract to a folder that is owned by a regular user and you have permission
to write in.
3. Create a new Python virtual environment folder named "env" and activate
it:
$ virtualenv env
$ source env/bin/activate
4. Install all python packages defined in the "requirements.txt" file:
37

38 A - Installation guide
$ pip install -r requirements.txt
5. Edit the "mentoring/settings.py" to reflect your database connection settings:
’default’: {
’ENGINE’: ’django.db.backends.mysql’,
’NAME’: ’<database name>’,
’USER’: ’<user>’,
’PASSWORD’: ’<password>’,
’HOST’: ’<host>’,
’PORT’: ’<port>’,
’OPTIONS’: {
’sql_mode’: ’STRICT_TRANS_TABLES’
}
}
Alternative, you may use the "SQLite" backend, but it has not been tested.
6. Edit the "mentoring/settings.py" to reflect your email server connection set-
tings:
EMAIL_HOST = "<host>"
EMAIL_PORT = <port>
EMAIL_HOST_USER = "<user>@<host>"
EMAIL_HOST_PASSWORD = "<password>"
7. Execute the server once to verify that it’s connecting properly. If the server
crashes, verify your installation:
$ python manage.py runserver 0:8080
8. If the server starts successfully, stop it with Ctrl+C and then run the migra-
tion process to create the necesary tabes in your database. Afterwards load
the included data.
$ python manage.py makemigrations
$ python manage.py migrate
$ python manage.py loaddata fixtures/database.json

39
9. If everything completed successfully, you should now be able to start the
server and log into your Dashboard.
$ python manage.py runserver 0:8080
Go to your browser of choice and input http://<server ip>:8080 on the nav-
igation bar. If you are running this on your local machine, the ip will look
like: http://localhost:8080 To log in, you have a choice of users:
<username>:<password>
admin:123456 (Django administrator)
eloi:123456 (Head of Department)
laura:123456 (Regular Teacher)
12637525:123456 (Student)
10. Congratulations, you have successfully installed the Dashboard Web appli-
cation on your server.
Please refer to the official Django documentation for version 1.11 if you get
stuck at any point during the installation.