predictive modelling of coastal habitats using remote
TRANSCRIPT

1
PREDICTIVE MODELLING OF COASTAL HABITATS USING REMOTE SENSING DATA AND FUZZY LOGIC
A CASE FOR SEAWEED IN BRITTANY (FRANCE) Eric De Oliveira1, Jacques Populus2, Brigitte Guillaumont2
1 LNHE - EDF R&D, 6 quai Watier, 78400 Chatou, France, [email protected] 2 Ifremer, Dyneco-AG, BP 70, 29280 Plouzané, France
ABSTRACT The aim of this study is to model seaweed species distribution with respect to environmental parameters. We focused on fixed species of algae, such as fucoids. First, we identified environmental parameters, such as substratum nature, immersion time, exposure, etc., which determine seaweed distribution. Secondly, we used field sampling to compute the distribution laws for seaweed according to the environmental parameters selected. Thirdly, we used the distribution laws and the environmental parameters to perform predictive mapping of seaweed belts with a fuzzy logic method.
Seaweed presence is directly dependent on the nature of the substratum. In the intertidal domain we used an alternative, because seaweed beds can be observed directly. We detected seaweed presence with Spot satellite imagery. The second parameter is immersion time. For each elevation value (surveyed by Lidar), we converted water tidal levels into annual percentages of immersion. The third environmental variable used was exposure to waves. During the fixation phase, seaweeds cannot withstand high levels of exposure. We used a model of wave propagation to delineate areas with different exposure levels.
The presence of seaweed species for each parameter was estimated from field sampling, along with 3D measurements (dGPS). Higher and lower limits of dominant seaweed belts were contoured. With reference to the three environmental variables selected, the distribution laws for each seaweed species were estimated.
A classification by fuzzy logic was applied using eCognition software. Two phases were used in this method: the first phase involved segmentation to obtain polygons, each polygon being homogenous in terms of the environmental parameters selected: vegetation cover, immersion time and exposure level. During the second phase, we implemented the distribution laws estimated from field sampling and finally a membership value was calculated for each targeted species and results discussed.
INTRODUCTION Seaweeds are an important component of coastal primary production. In terms of biodiversity, the impact of both climate change and the increased pressure on the coastal zone by human activities, their ecological importance needs to be assessed, as they are potentially reactive to environmental quality changes. There is also a steady demand for raw material by the seaweed industry. Although they are not priority habitats on the Ospar Convention list, kelp forests and fucoids have been long recognised as key habitats by the Habitat directive and more recently as potential benthic indicators by the Water Framework Directive. Along with knowledge about the resident biomass, the percentage of cover and the description of dominant species are of interest in understanding the long-term trends of these

2
habitats. It is noteworthy that groups of divers around Brittany have consistently reported an upward trend in the lower limit of the seaweed's extent.
Traditionally, marine ecologists have used the direct sampling method to characterise shallow and intertidal water marine habitats. However, this method is neither time nor cost effective for vast expanses. Remote sensing tools such as aerial photography, airborne and satellite imagery are appropriate for surveying and classifying marine habitats (Guillaumont et al., 1993; Kracker, 1999) in the tidal zone. Acoustic methods are suitable to remotely sample seafloor texture and depth in waters as deep as 200 metres (Brown et al., 2002). Usually some combination of environmental parameters is assumed to control the distribution of species and habitat types (Day and Roff, 2000). The key parameters usually used are depth, seabed roughness, substratum nature, exposure to waves, temperature and current strength. (Baxter, 2003). There are few examples of marine habitat classification in a spatial context based on physical factors (Zacharias et al., 1999; Roff et al., 2003). Applied to a marine context, these methodologies are expected to produce rules to understand species distribution according to environmental parameters and hence, predictive maps.
As regards seaweed mapping, a number of attempts can be found in the literature combining in situ observations and remote sensing tools (Guillaumont et al., 1997). Guillaumont (1993) used Spot1 imagery to map fucoids along the western coast of France, although with two limitations, namely the insufficiently fine 20 metre resolution and the limited discrimination power of Spot’s spectral band equipment. Bajjouk et al. (1996) and Zacharias (1992) investigated whether the hyperspectral sensor Casi could overcome these limitations.
The 13 band imagery at a resolution of about 5 metres allowed targets' spectral curves to be reconstructed to some extent, showing good discrimination between red, green and brown seaweed groups. However, they fell short of identifying the main seaweed belts, which are extremely similar when viewed from a distance. Figure 1 (Feldman 1978) shows a sketch of the distribution of seaweed in the tidal domain. In the subtidal zone Laminaria sp. belts are known to reach 40 metres in depth, depending on the water's clarity.
Besides their hypsometric position, seaweeds are known to be distributed according to some other parameters, such as wave exposure, light regime, temperature, nutrients etc.. This comes mostly from experts’ knowledge and these laws of distribution need to be better described. Perrot et al. (2004) developed a simple predictive approach to fucoid beds mapping by combining Spot imagery to a high resolution digital terrain model on a specific site in Brittany. Hypsometric elevations were with reference to the local tide amplitude. Their results were validated by a great number of in situ observations, namely the upper and lower limits of brown seaweed belts recorded with RTK dGPS with 10 cm vertical accuracy.
The Mesh project (Mapping European Seabed Habitats), an Interreg IIIB North-West Europe funded initiative that will be running until May 2007 is developing a predictive modelling action with two main targets: a) on a broad scale, to contribute to filling gaps in a holistic habitat map of the NW Europe seas, and b) on a finer scale, to predict the occurrence of a few given habitats of recognised relevance, whether for scientific (biodiversity) or management purposes. Predictive mapping is expected to reduce field sampling which could be limited to validating models based on abiotic factors.

3
Figure 1: Distribution of main seaweed species in the intertidal zone (from Feldman, 1978)
This paper focuses on fixed seaweed species such as Fucus sp. in the tidal zone of the Ile de Bréhat site. The driving physical parameters taken into account are the substratum, exposure to air and exposure to waves. Higher and lower limits of the dominant seaweed belts previously dGPS-recorded in the field are used for building rule-based decisions and functions are then assigned to the membership values. Therefore modelling with fuzzy logic indirectly leads to leads a membership value of presence for each targeted species.
MATERIAL AND METHODS Presentation of the study area Ile de Bréhat and Sillon du Talbert are located in the northern part of the east Trégor peninsula, limited on either side by the rivers Jaudy and Trieux. The Sillon du Talbert (figure 2) is a 3 km long tombolo that is highly exposed to ocean waves on its western side. It partly protects the Ile de Bréhat archipelago and entrance to river le Trieux on its eastern side.

4
(a) (b)
Figure 2: Location of the study area: a) regional, (b) detailed, with the Sillon du Talbert (1), Ile Modez (2), Ile de Bréhat (3). Site size is about 20 km across.
Seaweed species targeted Five seaweed belts were targeted in this study: Fucus spiralis, Ascophyllum nodosum, Fucus vesiculosus, Fucus serratus and Laminaria digitata. The following description of seaweeds and their habitats are issued from MarLIN (The Marine Life Information Network for Britain and Ireland) site (http://www.marlin.ac.uk/index.htm).
Fucus spiralis is an intertidal brown seaweed, found on the high shore. It grows up to 40 cm long, without air bladders and lives for up to 4 years. The species can tolerate a high level of dessiccation. Fucus spiralis attaches to rocky substrata on sheltered to moderately exposed shores. It lives on the upper shore below the zone of Pelvetia canaliculata and above Fucus vesiculosus and Ascophyllum nodosum.
Ascophyllum nodosum is a common, large brown seaweed, dominant on sheltered rocky shores. The species has long strap like fronds with large egg-shaped air bladders at regular intervals. The fronds of Ascophyllum nodosum are typically between 0.5 and 2m in length. Ascophyllum nodosum occurs on the middle of the shore, often with Fucus vesiculosus. The species grows slowly and plants can live to be several decades old. Individual fronds can become up to 15 years old before breakage. The species attaches to rocks and boulders on the middle shore in a range of habitats, from estuaries to relatively exposed coasts. It occupies a similar shore height as Fucus vesiculosus.
The bladder wrack Fucus vesiculosus is a large brown algae, common on the middle shore. It can be found in high densities living for about 4-5 years. The species is found intertidally on rocky shores in a wide range of exposures. It is common on the mid shore often with Ascophyllum nodosum, below Fucus spiralis and in a zone further up the shore from Fucus serratus.
Fucus serratus, the toothed wrack, is a robust, olive-brown shrubby seaweed that grows in high densities low on the seashore. The fronds bear no air bladders. The whole plant typically grows to about 60 cm long. The fronds have a serrated edge and grow from a short stalk. Fucus serratus is found on hard substrata on the lower shore in more sheltered areas of coastline.
Laminaria digitata is a large conspicuous kelp growing up to 2 m in length commonly found at low water during spring tides on rocky shores. The frond is broad and digitated, glossy and dark brown in colour. Found attached to bedrock or other suitable hard substrata in the lower intertidal and sublittoral fringe, but down to a maximum depth of 20 m in clear waters.

5
Laminaria digitata flourishes in moderately exposed areas or at sites with strong water currents. In exposed locations with a great deal of wave action the species may extend upwards into the lower eulittoral. Occurs in pools up to mid tide level and higher on wave exposed coasts.
Environmental parameters Substratum Fixed seaweed needs a rocky substratum. So the first parameter necessary for inferring seaweed presence is the substratum's nature. In the intertidal domain, direct detection of plant cover is possible thanks to the infrared capability of digital cameras and in particular those onboard remote sensing satellites.
Figure 3: Vegetation Cover Index (VCI) from Spot satellite Image (resolution: 20 m)
Vegetation cover is linked to the infrared backscatter intensity. Guillaumont et al. (1993) developed a method to compute vegetation cover. The result was coded as an image with levels of grey ranging from 0 to 200, which could be converted into vegetation cover from 0 to 100% (Fig. 3). For classification purposes, percentages above 20% only were considered as seaweed beds (Perrot, pers. com.). In cases where such cover data are not available, contours of rock substratum could act as a substitute for them.
Flooding frequency Seaweed distribution in the intertidal domain is conditioned by the ecological properties of each species. Seaweeds differently suffer from stress when they are out of the water, so flooding frequency is a key parameter to account for their presence. Flooding frequency at a given elevation is driven by the tidal regime (Fig. 4). Using a tide model, water levels can be translated into annual percentages of immersion. Seaweed distribution with respect to this parameter should then be comparable across the different sites regardless of their varying tidal amplitude, all the more so in Brittany where the tidal range varies from approximately 6 to 13 metres.
Very high resolution DTMs (Digital Terrain Model) are available for the study site from topographic Lidar surveys performed recently at low tide. The DTMs feature a 2 metre resolution and vertical accuracy of about 15 centimetres. This is compatible with the level of accuracy required with brown seaweed species mapping, as field sampling showed that typical lower belt limits exhibit very little scattering around the mean height.

6
Figure 4: Tide height predictions as a function of time at "Ile de Bréhat". Tide height prediction is expressed in cm on the Y axis and time is expressed in minutes on the X axis.
Predicted tidal heights are those expected under average weather conditions. When weather conditions differ from what is considered average, corresponding differences between predicted levels and those actually observed will occur. In this study, since an average situation was needed, we used sea level predictions provided by the French Navy's Hydrographic Office (SHOM). Three reference harbours are used to calculate flooding frequencies.
Over one year, for each elevation value, the mean percentage of immersion was computed from the cumulated histogram of sea levels. We did not take account of the local distortions and variations due to the influence of local currents. Figure 5 shows the curve that allows an elevation map to be converted into an immersion map. From the integration over time, a map of the annual percentage of immersion is then produced (Fig. 6).
Figure 5: Immersion percentage as a function of elevation (cm)

7
Figure 6: Map of annual percentage of immersion
Exposure to waves The third abiotic parameter used is the level of exposure to waves and currents. While a certain amount of turbulence seems necessary for seaweeds to thrive, a high level of exposure tends to prevent the fixation of juveniles. Different species may accept the same time of exposure but may not stand the same level of exposure, as is the case for. Ascophyllum nodosum and Fucus vesiculosus, for instance. In this paper, we will focus on exposure to waves.
To this end, a 25 year series of simulated wave and wind data were processed on a few positions offshore from Brittany (Fig. 7). This yielded the distributions of significant height, period and directional spread for the nine most usual propagation directions, from which extreme and mean values were derived.
(a) (b)
Figure 7: Compass card of wind (a) and significant height (b) at Ile de Bréhat.

8
A weighted sum of data from the nine directions was computed to best synthesise each variable. The waves were then propagated on a finite element model with mesh size varying from 3 km offshore to 300 metres in the area closer inshore. Since the finite element output data could not be imported to either ArcGis or eCognition software programs, Thiessen polygons (Bailey and Gatrell, 1995) were created for each mesh centre.
The simulations were carried out for extreme conditions (those most relevant to seaweed fixation) and spring high tide, so as to encompass the greatest part of the intertidal zone.
We noted as wdir, the temporal distribution of wave direction and hsdir, significant height for one direction, weighted average of significant height, μhs is: Figure 8 shows the map of weighted average of significant height at Il de Brehat. We can see two different areas. A north area very exposed and a south area sheltered.
.
dir dirdir
hsdir
dir
w hs
wμ =
∑∑
Figure 8: Weighted average of significant height at Ile de Bréhat under extreme conditions, spring tide amplitude and high water (m).
Seaweed in situ sampling data Both bespoke surveys and opportunity field data were used. Seaweed belts were surveyed in the field by following their upper/lower limits and measuring their heights with high precision dGPS in RTK mode (Fig. 9). Precision was estimated to be in the range of 5cm. This method delivered vertices that had to be converted into point files. These data are not quite randomly distributed in the field, however they cover quite a significant variety of distributions. On transects data points were decimated in order to avoid autocorrelation problems.
.

9
Figure 9: Sampling of upper and lower limits of seaweed belts.
Previously established contours of seaweed cover (Callens, 1994) were also considered, in spite of their age and the fact that they only distinguished Ascophyllum nodosum from other fucoids. These were large lobes of several square kilometres that gave the percentage of cover for the two groups (Fig. 10). This will of course reflect on the laws established below.
(a) (b)
Figure 10: Polygons of seaweed cover (from Callens, 1994).
These layers were cross-tabulated with vegetation cover index and simulation results of significant height whereby within these polygons, a) pixels with significant vegetation cover (above 20%) were first sorted out, b) for those pixels, average significant wave heights were expressed and colour coded as shown in Fig. 11.

10
Figure 11: Weighted average of significant height (m) applied, cross-referenced with vegetation cover index superior than 20%.
Estimation of distribution laws The way distribution laws are obtained is illustrated below for the percentage of immersion. The distribution function of the upper boundary was used directly, and for the lower boundary we used the complement of the latter.
(a) (b)
Figure 12: Rule-based presence of seaweed calculated by analysing the upper and lower limits sampled. On x axis, annual percentage of immersion. On y axis, (a) in red distribution function of upper belt boundary and in black the complement of the distribution of lower boundary. (b) Rule-based presence of species.
For each annual percentage of immersion there are two corresponding probabilities, one for the upper boundary and one for the lower one. We chose the minimal value for each percentage of immersion. A membership value of presence for each species according to the annual percentage of immersion was thus obtained (Fig. 12).
Fuzzy logic and segmentation with eCognition software The concept of fuzzy logic was introduced by Lofti Zadeh in 1965 and 1976. This concept is derived from the Boolean theory's being ill-adapted to some natural phenomena (Boolean variables can only take two values, ie, 1 or 0). The first processing step in fuzzy logic is to model each parameter by a membership function which assigns the degree of membership

11
of an identified state. This step to quantify the degree of membership is called “fuzzyfication”. It requires experience and is applied iteratively. To perform the classification, the eCognition software proceeded in two steps. The first one was a segmentation phase to obtain a set of homogeneous segments according to the three above-mentioned environmental parameters. In the second phase, the distribution laws estimated from field sampling were implemented.
From species map to holistic map After segmentation and modelling by fuzzy logic, a membership value was calculated for each species, for each polygon.
Predictive maps of membership value per species were tentatively combined to obtain a holistic map. The main problem lies in estimating two thresholds on membership values: a) one as a lower limit for significant species presence (set at 0.2), and b) the other to separate the dominant from the non-dominant species, which is set at 0.5. In other words, if two species differ by as much as 0.5 of membership value, the upper one is declared dominant. If such a discrepancy does not occur, the feature is described as a mix. These thresholds have been estimated from field observations and experts’ accounts.
RESULTS Sensitivity of seaweeds to flooding frequency Samples of the upper and lower boundaries of each seaweed belt were analysed, and each limit fitted with the normal rule (Fig. 13).
Fucus spiralis lives at the highest elevation of the intertidal area. The sampling results confirm this position. Its potential presence area is narrower than that of the other species, from 10% to 35% of immersion. From 20 to 23% of immersion, the membership value of Fucus spiralis presence is 1.
The presence areas of Ascophyllum nodosum, Fucus vesiculosus and Fucus serratus over-lapped considerably, between 48% and 90 % of immersion. But the areas of presence of Ascophyllum and Fucus vesiculosus were quite similar. The membership value of presence was equal to 1 between 33% and 71% for Ascophyllum nodosum and between 47 and 76% for Fucus vesiculosus. These species will then be differentiated by wave exposure. The upper limit of Fucus vesiculosus was less well delimited than the lower limit. This result was more obvious for Fucus serratus, whose presence area shifted to a high value of immersion, from 48% to 98% of immersion.
For Laminaria digitata, only the upper limit could be sampled, since the lower limit lies in the subtidal domain.

12
(a) (b)
(c) (d)
(e)
Figure 13: Histograms of elevation distribution (percentage of immersion) , showing upper boundary in red and lower boundary in black. (a) Fucus spiralis, (b) Ascophyllum nodosum, (c) Fucus vesiculosus, (d) Fucus serratus, (e) Laminaria digitata. On X axis annual percentage of immersion, on Y axis membership value of species presence.
From references and field sampling, we performed the distribution rule of seaweed presence with respect to flooding frequency (Fig. 14). These curves are obtained by assembling the curves of figure 13 according to the process explained above and illustrated by figure 12.

13
Figure 14: Distribution rules of targeted seaweeds with respect to flooding frequencies. On X axis annual percentage of immersion, on Y axis membership value of species presence.
Sensitivity of seaweed to wave exposure The upper and lower belt field contours could not be compared to wave simulations because the model's mesh size was too large with regard to the high local sampling density. For this purpose, sampling would need to be adapted. Instead, the rules established made use of former data collected by Callens in 1994 in the form of polygons which were homogeneous in terms of cover index and species (Ascophyllum nodosum and Fucoids in this case, see Fig. 10).
Ascophyllum nodosum was localized in four sectors, three of which with 20% and one with 100% of cover (Fig. 15). The histogram of significant height of 100% cover of Ascophyllum nodosum confirms that this species is present in the low exposure area. The maximum significant height observed for a complete cover of Ascophyllum nodosum was 1.45 m. The histogram of significant height for 20% cover illustrates the resolution problem between the level of exposure data and the contours of seaweed cover. We observed that Ascophyllum nodosum can be present at a high level of significant height, of around 5 meters.
(a) (b)
Figure 15: Histograms of 1821hsμ for Ascophyllum nodosum. (a) Cover percentage between 15
and 20%. (b) Cover percentage equal to 100%. On X axis significant wave height in metres, on Y axis membership value of species presence.

14
We note that fucoid species can tolerate a higher level of exposure, up to 6 meters (Fig. 16). The weighted average of significant height was 1.86 m for Ascophyllum nodosum and 2.89 for Fucoids.
(a) (b)
(c)
Figure 16: Histograms of 1821hsμ for fucoid species. (a) Cover percentage between 55 and
60%. (b) Cover percentage between 70and 80%. (c) Cover percentage equal to 95%. On X axis significant wave height in metres, on Y axis membership value of species presence.
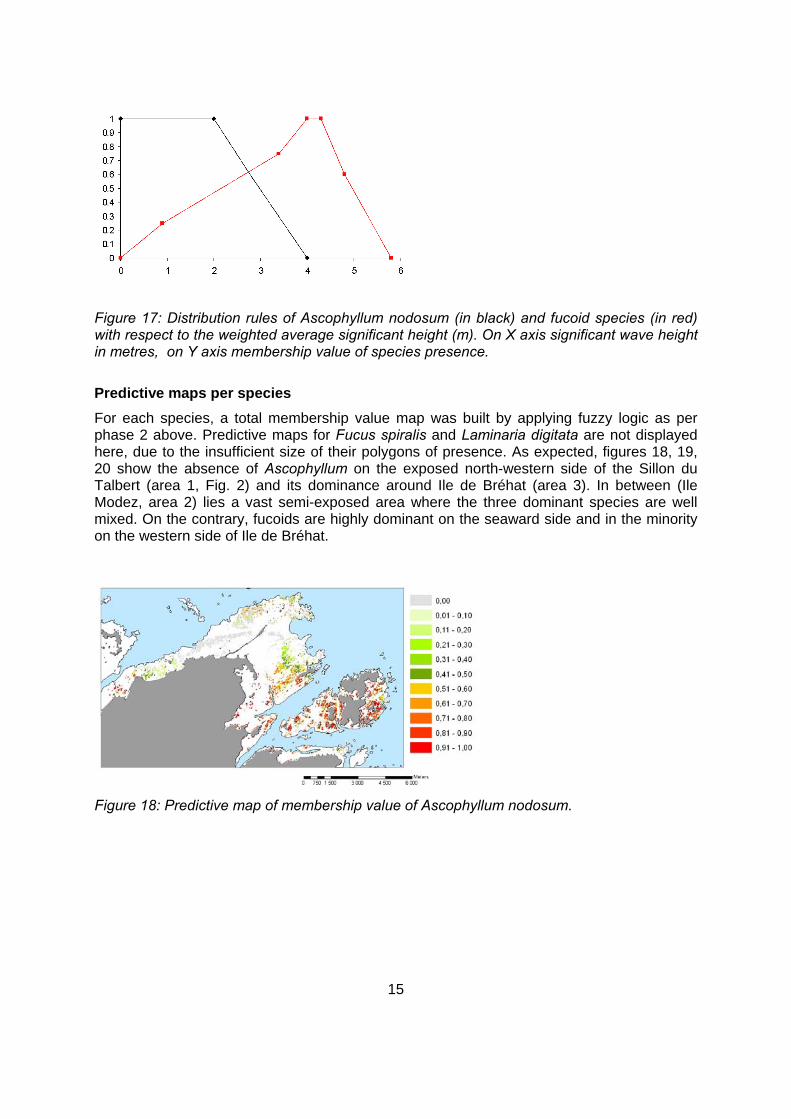
From these results and references, we established the distribution rules for Ascophyllum nodosum and the two other species, Fucus vesiculosus and Fucus serratus (Fig. 17), with respect to the significant height in extreme conditions, spring time amplitude and high water level.
15
Figure 17: Distribution rules of Ascophyllum nodosum (in black) and fucoid species (in red) with respect to the weighted average significant height (m). On X axis significant wave height in metres, on Y axis membership value of species presence.
Predictive maps per species For each species, a total membership value map was built by applying fuzzy logic as per phase 2 above. Predictive maps for Fucus spiralis and Laminaria digitata are not displayed here, due to the insufficient size of their polygons of presence. As expected, figures 18, 19, 20 show the absence of Ascophyllum on the exposed north-western side of the Sillon du Talbert (area 1, Fig. 2) and its dominance around Ile de Bréhat (area 3). In between (Ile Modez, area 2) lies a vast semi-exposed area where the three dominant species are well mixed. On the contrary, fucoids are highly dominant on the seaward side and in the minority on the western side of Ile de Bréhat.
Figure 18: Predictive map of membership value of Ascophyllum nodosum.

16
Figure 19: Predictive map of membership value of Fucus vesiculosus.
Figure 20: Predictive map of membership value of Fucus serratus.
Holistic map To produce a holistic map, the five individual maps above were combined taking into account the following rules: a) a threshold of degree of presence set to 0.2, from which a species is considered to be significantly present, b) where several species are present according to a), a second threshold set to 0.5 to maintain co-dominance: this is the maximum discrepancy between the dominant species and any other one.
On figure 21, we observe an important mixed area (Ile Modez, subarea 2 in Fig. 2) of Fucus vesiculosus, Fucus serratus and Ascophyllum nodosum. In the north, Ascophyllum is clearly absent and the two main species are Fucus vesiculosus and Fucus serratus. Around Bréhat Island, Ascophyllum is the main species due to the lower exposure found there.

17
Figure 21: Holistic map of seaweed. Fspir: Fucus spiralis; Asco: Ascophyllum nodosum; Fvesi: Fucus vesiculosus; Fserra: Fucus serratus; Lamin: Laminaria digitata. Order is conserved only for the mixed polygon of 2 species.
DISCUSSION Although fuzzy logic is very flexible to use, we were confronted with various difficulties.
First, the issue of resolution or spatial scale between the different parameters employed proved to be a limiting factor for this method. This seems to be a recurrent problem when different types of data are cross-referenced. Not all phenomena can be modelled or measured on the same scales. The smallest (ie, the least defined in spatial terms) scale was imperative for the study. An illustration of the problem can be seen with the resolution from the Lidar and that from the wave propagation model, since the Lidar provides resolution of about a metre, whereas the wave model's resolution is several tens of metres at best. This means that all the physical parameters will not have the same weight, spatially, when the rules of fuzzy logic are applied. Therefore, the predictive model will be more sensitive with regard to immersion than to wave-induced roughness. The problem will be all the more significant in the subtidal zone where the number of parameters to be taken into account will increase with the wide range of scales of representation.
Secondly, the sampling protocols for the boundaries of the seaweed belts were not specifically developed for this study. Delimiting the boundaries of upper and lower belts requires that the average position of the two boundaries be estimated for each species. Qualitative sampling requires that the predominant species be chosen in advance. If, for instance, a species is present over the entire foreshore, even if its biomass is insignificant, prediction results will give this species a very heavy weight. Therefore, the predominant species must be known in advance, and they alone must be taken into account. Quantitative sampling, although much more difficult to set up, would have been better adapted for this study, and would have provided a more realistic prediction, since it would have taken account of species' biomass. In fact, the model proposed here reports probabilities of presence and not biomasses.

18
The second type of in situ data (polygons of the major seaweed classes, shown in figure 11) has very low resolution compared to all the data sets used. However, they were the only data which could be cross-tabulated with the wave model results. As specified in the results described above, they did not enable very precise rules of distribution to be defined, but only allowed a priori knowledge to be confirmed and thresholds of Ascophyllum nodosum, Fucus vesiculosus and Fucus serratus presence to be estimated.
Generally speaking, we must keep a critical outlook regarding the computation of the environmental parameters used. The immersion percentages were obtained based on water depths calculated for reference harbours. For Le Trégor sector, three reference harbours were used. The depth was calculated for the reference harbour and then extrapolated over an entire area. The zones assigned to each reference harbour were large, and thus, extrapolation of immersion percentages could be improved.
As for the wave propagation model, since it is based on climatology, the picture of reality it supplies is an average. To compensate for this smoothing, the extreme conditions taken from the climatology (high water of the highest astronomical tide) were used, which made it possible to extrapolate the significant wave height over the largest possible foreshore surface area. The data from the model, the annual percentage of immersion and the wave exposure were averaged in order to highlight major trends.
The annual percentage of immersion was calculated for one year so that all seasons would be taken into account. The significant height used was a mean, weighted by the time distribution of wave directions.
CONCLUSION AND PERSPECTIVE A phase of validation is still needed. It would consist in conducting a new sampling survey, based on random stratified sampling for each physical parameter. The sampling could be achieved on the basis of "visual" measurements of the percentage of coverage for each of the targeted species and more accurately, using a dGPS measurement of position and an estimation of cover percentages of the different species of seaweed.
The method we have proposed and the data used to establish the rules of seaweed distribution enabled predictive mapping of predominant seaweed species in the intertidal zone to be proposed. Its originality lies on two points: a) firstly, in the use and crossing of different types of data: satellite data, Lidar data, digital model outputs and in situ measurements, and b) in the application of fuzzy logic. This method provides great flexibility in its application. Indeed, it enables the species distribution rules to be adjusted with respect to environmental parameters, and new parameters to be added. It would be interesting to develop a shear bed stress parameter taking account of all the hydrodynamic parameters of the environment, tidal current and the orbital wave velocity. This flexibility will mean improved results as our knowledge evolves.
The subtidal zone is more specifically concerned in perspectives for the future. The field of study envisaged involves large brown seaweeds (Laminaria sp). Based on in situ measurements or the marine habitat classification, the zones of presence with respect to environmental conditions will be established. Several physical parameters have already been listed, such as the nature of the sediment, bathymetry, turbidity, waves and surface temperature. For the area of immersion, a regional scale with a grid homogenised to about a kilometre could be imagined.

19
ACKNOWLEDGMENTS This study made use of results from the digital wave atlas for the coast of France, currently being developed in the framework of a collaboration between Météo-France, Cetmef and EDF-LNHE. We are most grateful to Michel Benoît from EDF for these key data for the computation of exposure to waves. The support of the Fondation Total pour la Biodiversité et le Mer should also be acknowledged as it allowed us to run the topographic Lidar survey. Finally, the use of subtidal depth originated from the French hydrographic survey SHOM is duly acknowledged. REFERENCES
i. Baatz, M. and A. Schäpe, 2000: Multiresolution segmentation – an optimisation approach for high quality multi-scale image segmentation. In Strobl, Blaschke and Greisebener (Edts): Angewandte Geographische Informationsverabeitung XI. Beiträge zum AGIT-Symposium Salzburg 1999. Karlsruher Wichmann Verlag.
ii. Bailey, T. C., and Gatrell, A. C. (1995) Interactive Spatial Data Analysis. Longman.
iii. Bajjouk T., Guillaumont B., Populus J., 1996. Application of airborne imaging spectrometry system data to intertidal seaweed classification and mapping. Hydrobiologia 326/327: 463-471, 1996.
iv. Baxter, K.J. 2003. Broad Scale Classification and Prediction of Marine Habitats: integrating GIS and rule based modeling. Coastal GIS 2003: An integrated approach to Australian coastal issues, C.D. Woodroffe and R.A. Furness (eds), p125-138, University of Wollongong, Australia.
v. Brown, C.J, Cooper, K.M., Meadows, W.J., Limpenny, D.S. and Rees, H.L. 2002. Small-scale mapping of seabed assemblages in the Eastern English Channel using sidescan sonar and remote sampling techniques. Estuarine, Coastal Shelf Science, 54, 236-278.
vi. Callens L. (1994): Mise au point d’une procédure de cartographie des stocks annuellement exploitables en fucales. Thèse de doctorat. Ecole Nationale d’Agronomie de Rennes.
vii. Day, J.C. and Roff, J.C. 2000. Planning for Representative Marine Protected Areas: A Framework for Canada’s Oceans. Report prepared for World Wildlife Fund Canada, Toronto.
viii. Feldmann, J., 1978. Les algues. In : Précis de Botanique. Les végétaux inférieurs. Masson (Eds). 95-320.
ix. Guillaumont et al., (1993). Spatial distribution and quantification of Fucus species and Ascophyllum nodosum beds in intertidal zones using Spot imagery. Hydrobiologia, 260/261, 297-305.
x. Guillaumont, B., Bajjouk, T. and Talec, P. 1997: Seaweed and Remote Sensing: a critical review of sensors and data processing; in Phycological, Vol. 12 p 213-282. F. E. Round/D. J. Chapman (eds).
xi. http://www.marlin.ac.uk/index.htm. The Marine Life Information System for Britain and Ireland.
xii. Kracker, L. 1999. The Geography of Fish: the use of remote sensing and spatial analysis tools in fisheries research. The Professional Geographer, 51, 440-450.

20
xiii. Perrot T., Dion P., Populus J., Guillaumont B., Brault D. (2004). A predictive approach to the mapping of fucoid beds using Spot magery and a digital elevation model. VIIIth International Seaweed Symposium », June 20-25, 2004, Bergen, Norway.
xiv. Roff, C., Taylor, M. E. and Laughren, J. 2003. Geophysical approach to the classification, delineation and monitoring of marine habitats and their communities. Aquatic Conser. Mar. Fresh. Ecosyst. 13:77-90.
xv. Zacharias et al., 1992. An assessment and classification of a multispectral bandset for the remote sensing of intertidal seaweeds. Canadian Journal of Remote Sensing, 18, 263-274.
xvi. Zacharias, M.A., Morris, M.C. and Howes, D.E. 1999. Large scale characterization of intertidal communities using a predictive model. Journal of Experimental Marine Biology and Ecology, 239, 223-241.
xvii. Zadeh, L., Fuzzy sets, Information Control 8, 338-353, 1965
xviii. Zadeh, L., A fuzzy-algorithmic approach to the definition of complex or imprecise concepts, Int. Jour. Man-Machine Studies 8, 249-291, 1976.