predictors of high school performance the otis quick
TRANSCRIPT
A COMPARATIVE STUDY OF THE KUNLMAN-ANDERSON AND
THE OTIS QUICK SCORING INTELLIGENCE TESTS AS
PREDICTORS OF HIGH SCHOOL PERFORMANCE
A THESIS
SUBMITTED TO THE FACULTY OF ATLANTA UNIVERSITY
IN PARTIAL FULFILLMENT OF THE REQUIREMENTS FOR
THE DEGREE OF MASTER OF ARTS
BY
EUGENE B. WIMBY
SCHOOL OF EDUCATION
ATLANTA UNIVERSITY
ATLANTA, GEORGIA
AUGUST 1965
I ( I
DEDICATION
To my wife, children, parents and friends,
whose inspiration, interest, patience and
encouragement have sustained me throughout the
period of this endeavor.
E.B.W.
11
ACKNOWLEDGENENT S
The writer is indeed grateful to the many persons
who have contributed, in any manner, to the gathering,
preparation, and presentation of the data included here.
The writer wishes to express gratitude and appreciation
to Dr. Huey Charlton, advisor, and all of his staff for
their guidance and patience throughout the conduction
of this study, and to Mrs. Addie Batey for her assistance
in the typing of this thesis.
E.B.W.
lii-
TABLE OF CONTENTS
DEDICATION •
ACKNOWLEDGEMENTS
LIST OF TABLES • •
Chapter
I. INTRODUCTION
Page
111
vi
1
RationaleEvolution of the ProblemContribution to Educational KnowledgeStatement of the ProblemPurpose of the StudyDefinition of Terms .
Description of InstrumentsLimitations of the StudySubjects and MaterialsLocale and Description of SubjectsMethod of ResearchProcedural StepsReview of Related Literature . .
13455567778810
II. ANALYSIS AND INTERPRETATION OF DATA 20
IntroductionSome Indices of Socio-economjc Conditions of
the SubjectsRelationships Between the Kuhiman-Anderson
Intelligence Test and the Otis QuickScoring Mental Ability Test
Relationships Between the Kuhiman-AndersonIntelligence Test and English
Relationships Between the Kuhlman-AndersonTest and Mathematics
Relationships Between the Kuhlman-AndersonTest and Social Studies
Relationships Between the Kuhlman-AndersonTest and Science
• . . . 20
• . . . 20
20
23
25
27
. . . 29
iv
TABLE OF CONTENTS--Continued
Chapter Page
II. ANALYSIS.AND INTERPRETATION OF DATA (Cont’d)
Relationships Between the Otis Test and English . . 31Relationships Between the Otis Test and
Mathematics 33Relationships Between the Otis Test and Social
Studies 35Relationships Between the Otis Test and Science . . . 36Significance of the Difference Between Correlations 38
III. SUMMARY AND CONCLUSIONS . . 41
Introduction 41Restatement of the Problem . 41Description of Procedures Used 42Summary of Related Literature 43Findings 45Conclusions 47Implications 48Recommendations 48
BIBLIOGRAPHY 49
VITA . . . . 51
V
LIST OF TABLES
Table Page
1. Intelligence Test Scores For Thirty Tenth GradeStudents on the Kuhlman-Anderson IntelligenceTest and the Otis Quick Scoring Mental Ability Test . . 22
2. Kuhlman-Anderson Intelligence Test Scores and GradePoint Averages in English for Thirty Tenth GradeStudents 24
3. Kuhiman-Anderson Intelligence Test Scores and GradePoint Averages in Mathematics for Thirty TenthGrade Students 26
4. Kuhiman-Anderson Intelligence Test Scores and GradePoint Averages in Social Studies for Thirty TenthGrade Students 28
5. Kuhlman-Anderson Intelligence Test Scores and GradePoint Averages in Science for Thirty Tenth GradeStudents 30
6. Otis Quick Scoring Mental Ability Test Scores andGrade Point Averages in English for Thirty TenthGrade Students 32
7. Otis Quick Scoring Mental Ability Test Scores andGrade Point Averages in Mathematics for ThirtyTenth Grade Students 34
8. Otis Quick Scoring Mental Ability Test Scores andGrade Point Averages in Social Studies for ThirtyTenth Grade Students 35
9. Otis Quick Scoring Mental Ability Test Scores andGrade Point Averages in Science for Thirty TenthGradeStudents 37
10. Fisher!s Z Test of Significance of the DifferencesBetween the Otis (Beta) Mental Ability Test andGPA and the Kuhlman-Anderson Intelligence Testand GPA 40
vi

CHAPTER I
INTRODUCTION
Rationale. --For a number of years, schools have made uses of
standardized tests. Some of the uses of these tests have been to aid
in the identification of learning capabilities of pupils, to evaluate
skills in various subject areas, to determine pupils’ interests, to
estimate adjustmental difficulties, to determine achievement diffi
culties, to group for instructional purposes, to predict performance
at higher educational levels and many others.
In order for tests to serve their many purposes, school
personnel must develop a high degree of knowledge and skill in the
selection and use of standardized tests. The day and age in which we
live continually demands that we become more sophisticated in
assessing the potential capabilities and the real achievement of our
children. This of course puts an increasing demand on the schools to
do a better job in this area.1-
Selecting tests that are capable of measuring the extent to
which the objectives of the instructional program are realized is of
utmost importance. One of the most important characteristics of the
test to be considered is the validity of the test. Is the test valid
‘H. S. Shearouse, “Introduction,” Guidance For Georgia Schools(September, 1962), p. iii.
1
2
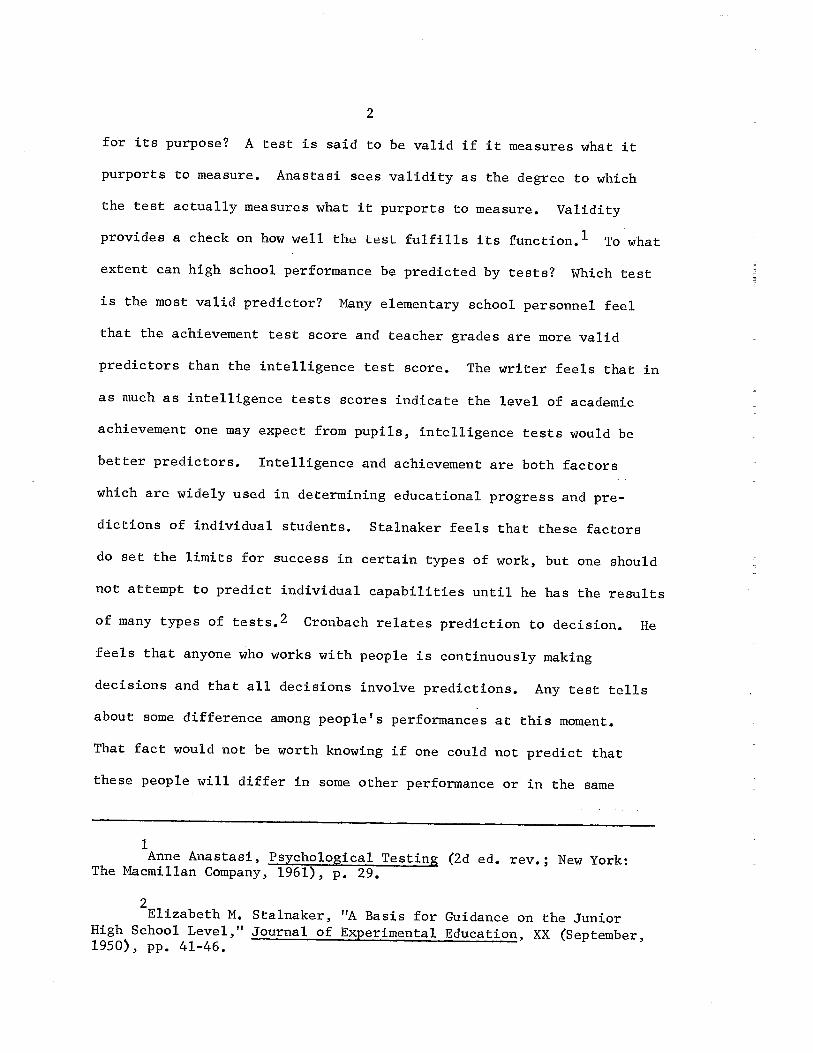
for its purpose? A test is said to be valid if it measures what it
purports to measure. Anastasi sees validity as the degree to which
the test actually measures what it purports to measure. Validity
provides a check on how well the test fulfills its function.’ To what
extent can high school performance be predicted by tests? Which test
is the most valid predictor? Many elementary school personnel feel
that the achievement test score and teacher grades are more valid
predictors than the intelligence test score. The writer feels that in
as much as intelligence tests scores indicate the level of academic
achievement one may expect from pupils, intelligence tests would be
better predictors. Intelligence and achievement are both factors
which are widely used in determining educational progress and pre
dictions of individual students. Stalnaker feels that these factors
do set the limits for success in certain types of work, but one should
not attempt to predict individual capabilities until he has the results
of many types of tests.2 Cronbach relates prediction to decision. He
feels that anyone who works with people is continuously making
decisions and that all decisions involve predictions. Any test tells
about some difference among people’s performances at this moment.
That fact would not be worth knowing if one could not predict that
these people will differ in some other performance or in the same
1Anne Anastasi, Psychological Testing (2d ed. rev.; New York:
The Macmillan Company, 1961), p. 29.
2Elizabeth N. Stalnaker, “A Basis for Guidance on the JuniorHigh School Level,” Journal of Experimental Education, XX (September,1950), pp. 41-46.
3
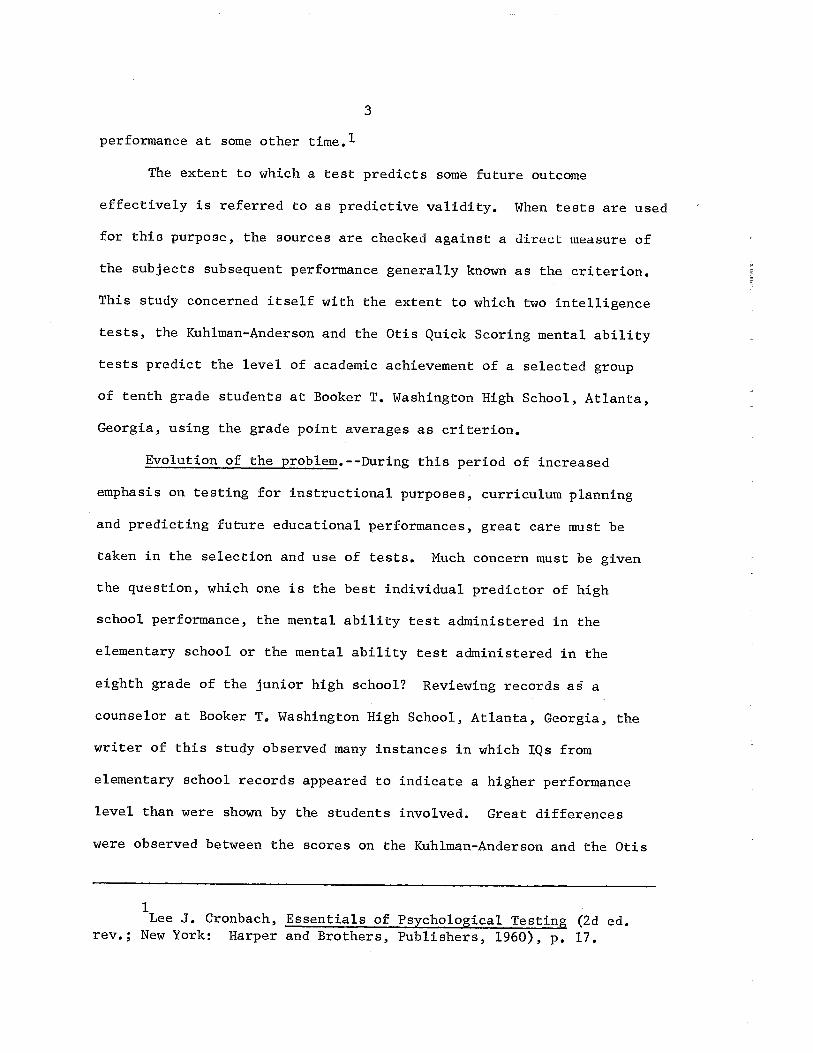
performance at some other time.1
The extent to which a test predicts some future outcome
effectively is referred to as predictive validity. When tests are used
for this purpose, the sources are checked against a direeL measure of
the subjects subsequent performance generally known as the criterion.
This study concerned itself with the extent to which two intelligence
tests, the Kuhlman-Anderson and the Otis Quick Scoring mental ability
tests predict the level of academic achievement of a selected group
of tenth grade students at Booker T. Washington High School, Atlanta,
Georgia, using the grade point averages as criterion.
Evolution of the problem.---During this period of increased
emphasis on testing for instructional purposes, curriculum planning
and predicting future educational performances, great care must be
taken in the selection and use of tests. Much concern must be given
the question, which one is the best individual predictor of high
school performance, the mental ability test administered in the
elementary school or the mental ability test administered in the
eighth grade of the junior high school? Reviewing records as a
counselor at Booker T. Washington High School, Atlanta, Georgia, the
writer of this study observed many instances in which IQs from
elementary school records appeared to indicate a higher performance
level than were shown by the students involved. Great differences
were observed between the scores on the Kuhlman-Anderson and the Otis
Lee J. Cronbach, Essentials of Psychological Testing (2d ed.rev.; New York: Harper and Brothers, Publishers, 1960), p. 17.

4
Quick Scoring Intelligence Tests. In most cases, the Kuhlman-Andersorj
IQ was higher. There is an awareness on the part of the writer that
such differences might have occurred for a number of reasons among
which are Lest climate, motivation ofthe students, rapport, test
anxiety, and adjustment of the students. It is felt that some effort
should be made to determine which of these two tests was more indica
tive of the future performance of the child.
Contribution to educational knowledge.--The Atlanta School System
has a uniform testing program wherein all elementary schools administer
the Kuhlman-Anderson Intelligence Test in the sixth or seventh grade
and all high schools administer the Otis (Beta) Quick Scoring Mental
Ability Test in the eighth grade.
The writer feels that if the results from this research warrant
a change in the testing program of the schools, the department of
testing will review and reconsider the selections of tests to see if
these tests measure and to what extent they measure what they are
thought to measure. It is further felt that the findings will be
helpful to the guidance department and the schedule committee in that
the data from these tests can be instrumental in guiding the students
into the program of studies that will assist each student to develop
his potentialities, abilities, aptitudes and talents to the maximum
degree. It is desirable that this study will motivate other
researchers, interested in testing, to question and study the validity
of the present testing program and the uses of the tests in their
respective schools and school systems.
5
Statement of the problem.--The problem in this study was to
ascertain which of the two mental ability tests, the Kuhlman-Anderson
or the Otis (Beta) Quick Scoring, was a better predictor of high
school performance for the group used in this study.
Purpose of the study.--The general purpose of the study was to
compare two well known mental ability tests as predictors of high
school performance in the subject areas of English, Mathematics,
Science and Social Studies; plus certain other factors as revealed in
the cumulative records.
More specifically, the research was designed to determine the
following:
1. Coefficients of correlation between the Otis QuickScoring Test of Mental Ability and the four subjectareas: English, Mathematics, Science and SocialStudies.
2. Coefficients of correlation between the KuhlmanAnderson Test of Mental Ability and the four subjectareas: English, Mathematics, Science and SocialStudies.
3. The significance of the difference between the correlations involving the Kuhlman-Anderson Test of MentalAbility and those involving the Otis Test of MentalAbility.
4. A description of subjects in terms of certain socioeconomic factors.
Definition of terms.--The significant terms used in this study
have the respective meanings attached to them as follows:
1. “Intelligence.” The ability to grasp the significantfactors of a complex problem or situation. Theseabilities are measured by the Otis Quick ScoringMental Ability Test and the Kuhiman-Anderson Intelligence Test.
6
2. “Intelligence Test.” A test given which yields anIQ that may indicate the level of academic attainment one may expect from pupils.
3. “Predictor.” An instrument, the results from whichindicate with a degree of accuracy some futureperformance.
4. “Predictive Validity.” A statistical term whichindicates the effectiveness of a test in predictingsome future outcome.
5. “Grade Point Average.” The arithmetic average ofthe grades earned by the subjects used in thisstudy.
Description of instruments. --The instruments that were used in
this study to collect data are described below:
1. Kuhlman-Anderson Test. --An American group test oftenreferred to as an omnibus test because it measures avariety of mental operations all combined into asingle sequence rather than being grouped togetherby types of operations. The authors of the test areF. Kuhiman and R. G. Anderson. The publisher isPersonnel Press, Inc., Princeton, New Jersey. According to the manual, the reliability coefficients forgroups of 100 pupils in a single grade are clusteredin the low nineties. Other evidences indicate thatthis test is reliable enough to be used for guidancepurposes. This test yields results comparable to thoseobtained from other similar mental ability tests. Itmeasures substantially the same thing as the StanfordBinet.
2. Otis Quick Scoring Mental Ability Test (Beta). A grouptest given to students in the eighth grade in order toobtain a quick measure of their general mentalabilities. The author of this test is A. S. Otis. Itis published by Science Research Associates, Inc.,Chicago, Illinois. This test combines verbal and nonverbal reasoning items. It yields a single overall IQ.There is evidence that IQ’s tend to be lower than forother tests. According to the manual for this test,predictive validities against school achievement comparefavorably with other tests.
3. Cumulative Record. An instrument used for the compilationand maintenance of personal data and school performances
7
of each pupil from his first experience throughout hisschool life.
Limitations of the study.--This study was limited to the
cumulative records of a selected group of thirty students in the tenth
grade at Booker T. Washington High School of Atlanta, the Kuhlman
Anderson Intelligence Test scores from elementary school records, the
Otis Quick Scoring Mental Ability Test scores, and the teacher grades
from grades eight through ten.
Subjects and materials. --The subjects used in this study were
thirty tenth grade students at Booker T. Washington High School of
Atlanta, Georgia. The materials used in this study were the cumula
tive records of each student selected in the study.
Locale and description of subjects.--Booker T. Washington High
School is located in the southwestern section of Atlanta, Georgia, and
is an integral part of the Atlanta School System. This school is one
of the largest high schools in the city with an enrollment of nearly
3,000 students. The staff includes a principal, a full time assistant
principal, 128 classroom teachers, 3.5 counselors, one nurse,
.5 specialist, four secretaries and twelve maintenance workers. The
subjects used in this study consisted of thirty tenth grade students
who showed differences of at least ten IQ points between the IQs as
measured by the Kuhlman-Anderson Intelligence Test and the IQs as
measured by the Otis Quick Scoring Mental Ability Test. A further
analysis of the subjects revealed that the group consisted of eleven
boys and nineteen girls. Twenty-one of the subjects lived with both
parents, eight lived with the mother alone. One lived with the father
alone. Nine of the subjects lived in homes where both parents were

8
employed. Three of the subjects lived in homes where neither parent
was employed. One of the subjects was a product of parents, both of
whom had attended college. Six of the subjects were products of
parents, both of whom had attended high school. Two of the subjects
were products of parents, both of whom terminated their formal educa
tion in elementary school. Seven of the subjects desired to terminate
their formal education at the completion of high school. The remaining
twenty-three subjects expressed intentions to attend schools of higher
learning. Concerning vocational objectives, ten were undecided, seven
desired to become teachers, five desired to become secretaries, three
desired to become engineers, two desired to become nurses, one each
desired to become technician, an airline stewardess, and a doctor.
Method of research.--The descriptive method of research was used
employing the elementary school cumulative folders and the high school
permanent record cards.
Procedural steps. --The procedural steps used in conducting this
study were as follows:
1. The writer obtained permission from the proper schoolofficials. The director of guidance and counselingservices at the school used in the study was consultedto see if this kind of a study would be of benefit tothe guidance program. The proposal was met with greatenthusiasm. The principal of the school was consulted.Permission was readily granted to use the records andthe school in general as frequently and as long asnecessary in order to obtain the data pertiment to thiskind of research. The director of guidance servicesand the assistant superintendent of the Atlanta SchoolSystem were consulted as to the feasibility of thestudy. Each gave his personal consent and urged thewriter to speedily conduct the study and obtain theMaster’s Degree for possible advancement within theschool system.

9
2. Pertinent literature related to the study wascarefully surveyed for presentation in a summarizedform.
3. The subjects were selected by the method of “purposivesampling.” The records of each student activelyenrolled in the tenth grade were carefully reviewed.The criteria for selection were that each selectedsubject must have had the Kuhiman-Anderson IntelligenceTest administered to him not more than two years priorto his enrollment into the eighth grade at the highschool, Each subject in order to be selected must havehad the Otis (Beta) Quick Scoring Mental Ability Testadministered to him in the eighth grade. Each subjectin order to be selected must have shown a difference often or more points between the recorded IQ measured bythe Kuhiman-Anderson Test and the recorded IQ asmeasured by the Otis Quick Scoring Test.
4. Test scores from the Kuhlman-Anderson and the Otis(Beta) Intelligence Tests, overall teacher grades inEnglish, Mathematics, Science and Social Studies wereextracted from the records of the students involved inthe study.
5. Data that may affect the socio-economic level of eachsubject were extracted from the cumulative records andanalyzed.
6. The mean and the standard deviation were determined bystatistical computations for the Otis IQs, the KuhimanAnderson IQs and the grade point averages in English,Mathematics, Social Studies and Science.
7, Pearson Product Moment coefficients of correlation werecomputed between Otis IQs and grade point averages inEnglish, Mathematics, Social Studies and Science.
8. Pearson Product Moment coefficients of correlation werecomputed between Kuhlman-Anderson IQs and grade pointaverages in English, Mathematics, Social Studies andScience.
9. The z ratio was used to test the significance ofdifference between the correlations involving theKuhlman-Anderson Intelligence Test and grade pointaverages and the correlations involving the Otis QuickScoring Mental Ability Test and grade point averages.
10. The findings, conclusions, implications and recommendations were derived and presented.
10
Review of related literature. --Many educators have long been
interested in helping students reach their maximum academic potential.
Much concern has been given to what extent one can determine when a
student is performing at his maximum, to what extent academic growth
and progress can be measured, to what extent the academically talented
and the potential drop-out can be recognized, to what extent future
performances at a higher level can be predicted. Many studies have
been conducted in an effort to answer, with a degree of adequacy, these
questions.
Scarvia B. Anderson and Milton H. Maier, who are currently
conducting a study of 34,000 pupils and their growth, state:
The primary aim of American schools is to foster thegrowth of the children given into their charge. Theliterature of educational research is, however, surprisinglyempty of information on the academic growth of boys andgirls at different times and under different circumstancesof schooling. The study of Academic Prediction and Growth,sponsored by Education Testing Service and the CollegeEntrance Examination1Board, represents an attempt at leastto fill this lacuna.
They feel that their study will provide data relevant to a number of
technical problems, such as: Can reliable measurements of growth be
made with instruments such as achievement tests, aptitude tests and
background questionnaires, over a period of time? What proportion of
the total variance in final test scores can be accounted for by
ability,by error, and by experiences contained in the intervals of
time between testings? What background factors seem to be related
1Scarvia B. Anderson and Milton H. Maier, “The Study of AcademicPrediction and Growth,” Journal of Teacher Education, XLV (June, 1963),pp. 212-216.
11
to growth and what experience variables, though judged to be important,
are unrelated to the measuring instruments of the study. They point
out that college admission officers, school administrators, teachers,
and counselors will be benefitted by their study.
There is general agreement that tests are frequently used in
studies of prediction. Cronbach feels that in working with people,
decisions are being continually made, that all decisions involve
prediction and that any test tells about some difference about people’s
performance at a given moment. This he feels would not be worth
knowing if one could not predict that these people will differ in some
other performance or in the same performance at a later time. The
selection of the test for prediction is the principal problem.1
There seems to be quite a bit of disagreement on the types of
tests, as well as the validity of these tests in predicting future
academic performance on a higher level. Studies of high school drop
outs, of job potentialities of the mentally retarded, and the like
show that the Stanford-Binet tells a great deal about a person’s
expected success. This, Cronbach feels is true because the stability
of the IQ gives information on predictive validity.2 Efforts by test
developers, beginning with Binet, were directed toward measuring
“mental ability” as distinct from achievement. In recent years, many
test developers have come to the conclusion that this is not a
1Lee J. Cronbach, Essentials of Psychologioal Testing (2d ed.rev.; New York: Harper and Brothers, Publishers, 1960), p. 17.
2lbid.

12
profitable endeavor when one’s aim is to predict school success. The
ACE test, for example, was for a long time the principal instrument
used by colleges for measuring scholastic aptitude of entering
freshmen. In 1955, its publishers, acting on the advice of specialists
in educational guidance, introduced in its place the School and College
Ability Tests3- Their conclusions were (1) that the best single
predictor of how well a student is likely to succeed in his school
work next year is “how well he is succeeding this year;” (2) that
certain school learned abilities appear to be prerequisites to next
steps in learning; (3) that school learned abilities usually can be
discussed with students and parents more objectively than such emotion
ally loaded characteristics as “intelligence” or mental ability.
Charles W. St. John said:
What the achievement test measures is measured muchmore reliably, and much more usefully for purposes ofcomparison and statistical study than possible by anyother existing means; but they fail to measure adequately,either directly or indirectly, many of the more obscureand very important educational products.2
The intelligence test is often regarded as an academicachievement test, especially the verbally oriented ones.
Intelligence tests do not measure the capacity tolearn, that is original innate potentiality, unaffectedby experience and training and the general native modifiability and adaptability of the organism.3
1lbid., p. 237.
2Charles W. St. John, Educational Achievement in Relation toIntelligence (Cambridge: Harvard University Press, 1930), p. 34.
3lbid., p. 27.
13
Andrew M. Doyle made a study of ability and achievement in high
school girls. “The purpose of this study was to discover what common
abilities are measured by certain general ability tests and how these
abilities enter into achievement in certain academic areas.”
Tests from the California Test of Mental Maturity, the Pintner
General Ability Series, the McManama’s Exercise in Cognitive Ability
and the Iowa High School Content Examinations were administered to
282 high school junior girls from 22 Catholic Schools in Iowa. Scores
from subtests were correlated and the Thurstone Centroid method of
factors emerged: mathematical, verbal, and cognitive ability. A brief
analysis of what each test appears to measure was made.
Wallen who studied “Development and Application of Tests of
General Mental Ability” stated:
Although tests which purport to provide an overallindex of intellectual skills appear to be becoming moreobjectionable to many researchers, on the grounds thatthey lack theoretical basis or that they fail to dojustice to all aspects of human intellect, they continueto demonstrate great usefulness in many applied and researchactivities.
During the last three years, the largest number ofstudies pertained to predictive validity and analysis oftest interoorrelations..... This trend is encouraging.According to Wallen’s study, when reliability is definedas the attenuation of measurement by short terni fluctuationin individual characteristics, tests discussed demonstratedhigh reliability.
One team reported on the follow-up of about 100subjects from the 1937 Stanford-Binet standardized sample.At initial testing, the subjects ranged from two to fiveand a half years of age. Correlations with the scores
1Andrew M. Doyle, “Some Aspects of Ability and Achievement inHigh School Girls,” Educational Research Monographs, VIII, No. 2(1952), p. 27.
14
obtained 10 years later was .65; 25 years later, .59.Correlations between scores in adolescence and 15 yearslater was .85.
A substantial number of studies reported relationships between academic performance in a variety ofcontent areas and group tests. In general the correlations reported are consistent with previous studies,range being approximately .30 to .~0, with predictionbest in the more academic studies.
Arvo E. Juola, Assistant Professor of Evaluation Services,
Michigan State University, studied the “Predictive Validity of Five
College-Level Academic Tests at one Institution.” The ACE, CQT, and
SCAT were administered to one group of freshmen entering MSU for the
first time, while the SAT and the OSP were administered to two other
groups. On the basis of correlations among the scores on these tests
five classifications of grade point average, an attempt was made to
compare the efficiency of these tests in predicting freshman GPA. The
following conclusions were subsequently proposed:
1. While differences were noted in the predictivevalidity of total scores on the ACE, CQT, SCAT, SAT,and OSP, the differences were generally small.
2. The total scores on all tests were superior to thetotal scores of the ACE in predicting GPA of malesbut not the GPA of females.
3. With the exception of relationships with the GPAin Communication Skills, the total scores on alltests were generally as good a single index of attainment as the most relevant part-score.
4. Because the patterns of prediction among the partscores exhibited a complete reversal when predictionswere made, CS or NS discrepancies in these scores
Norman E. Wallen, “Development and Application of Tests ofGeneral Mental Ability,” Review of Educational Research, XXXII(February, 1962), pp. 5-22.

15
seem to provide some basis for differential academiccounseling.
5. There was some evidence to suggest the greaterapplicability of the CQT for the ma]e population andthe SCAT for the female population.
Walter R. Borg of Utah State University made a study of “GRE
Aptitude Scores as predictors of CPA for Graduate Students in
,,2Education. The purpose of his study was to determine the predictive
validity of the scores in verbal ability and quantitative ability of
the Aptitude Tests of the GRE relative to the criterion of CPA of
graduate students in the Department of Education at Utah State
University. The low predictive validities of GRE aptitude scores seem
to indicate that this measurement used alone is of little value as a
predictor of success. The GRE Verbal validity coefficient is .36.
The GRE Quantitative validity coefficient is .37. The data suggests
the GRE has little predictive validity for a relatively unrestricted
sample of graduate students in Education.
Conway in 1955, found correlations of .27 with GRE Verbal and
.23 with GRE Quantitative. She used in her study a sample of 36,
including only students receiving the Master of Arts degree.3
1Arvo E. Juola, “Predictive Validity of Five College-LevelAcademic Aptitude Tests at One Institution,” The Personnel andGuidance Journal, XXXVIII (April, 1960), p. 637.
~alter R. Borg, “GRE Aptitude Scores as Predictors of CPAfor Graduate Students in Education,” Educational and PsychologicalMeasurement, XXXII, No. 2 (1963X, p. 379.
3Sister Madona Theresa Conway, “The Relationship of the GraduateRecord Examination Results to Achievement in the Graduate School atthe University of Detroit” (unpublished Master’s thesis, University ofDetroit, 1955).

16
Capps and Decosta in 1957 reported a correlation of .34 between
grades in four basic professional courses and the GRE Aptitude Test
for a sample of 41 graduate students in Education.’
Zachert and Levine studied “Education and Prediction of Military
School Success.” A table is presented showing validities obtained for
the first form of the Airman Classification Battery and comparative
validities obtained for years of education to the multiple of the
battery for predicting final grades in various air force technical
schools. Validation data of these 32 schools indicate that the ability
tests measure nearly all the valid variance to be found in the
educational level, variables not accounted for by years of education.
The average increase in the multiple correlation when education is
added is .012 and the most it adds is .06. Although in many cases
the validity for educational level is above .50, the multiple R for
the test is at least .15 higher.2
In 1960, Ohio State University required all studeüts entering
the university to take the American College Test (ACT). The primary
purpose of the study was to determine the possible effectiveness of
using the ACT tests to supplement or replace the Ohio State Psycholog
ical Examination and the OSU placement tests in the university
1Marion P. Capps and Frank A. Decosta, “Contributions of theGRE and the NTE to the Predictions of Graduate School Success,”Journal of Educational Research, L (1957), pp. 383-389.
2Virginia Zachert and Abraham Levine, “Education and Predictionof Military School Success,” Journal of Applied Psychology, XXXVI(1952), pp. 266-268.
17
placement program. With respect to predicting point-hour ratio, the
ACT total score was superior to the OSPE (r’s .56 and •54
respectively; P - .01). The next predictor was the OSU English test
(r ~ .53). Comparisons of the PI-ll~ distributions of approximately the
upper and lower ten percent on the ACT and the OSPE revealed that
either test could have been used with equal effectiveness to select
a small, highly promising group of students or a small group of
potentially low students.
In working Out the problem of determining the potential
effectiveness of the ACT tests for placement in English and mathematics,
a rather consistent picture of differences between the OSU and the ACT
test scores emerged. In both English and mathematics, the OSU tests
were more closely related to relevant course grades than were the ACT
tests. This was true in mathematics both with the screening test and
the second level tests. The same general pattern held true in
English. Almost half of the students who would have been placed in
remedial English if ACT alone were used were in fact placed in freshman
English on the basis of their essays, and the OSU objective English
test consistently correlated more highly with course grades than did
the ACT test.1-
Osburn and Melton made a study of ninth grade students in an
experimental modern algebra course and a group of ninth grade students
1Frank R. Peters and Eugenia L. Plog, “The Effectiveness of theACT for Selection and Placement at The Ohio State University,”Educational Research Bulletin, XL (1961), pp. 232-252.
18
in a traditional algebra course. A battery of aptitude tests was
administered to both groups. The results were as follows:
1. The aptitude tests were equally valid in predictingproficiency in either course.
2. The sum of the Verbal Reasoning and NumericalAbility Scales from the DAT predicted proficiencyin both courses with validity equal to that of theIOWA Algebra Aptitude Test and the Orleans AlgebraPrognosis Test. A test designed specifically forthis purpose.
3. There were no trends in the validities of theaptitude tests as a function of the time intervalbetween the administration of the aptitude andproficiency measures.
4. Spacial and Mechanical Reasoning Tests were morevalid for the experimental course than for thetraditional course.
Studies employing tests, comparisons and correlations often yield
data that can be very valuable to school personnel responsible for
assisting students in the educative process. The extent to which these
data are helpful depends largely upon one’s ability to understand,
interpret and describe the findings and results of these studies.
It is customary, according to Garrett, in mental measurements to
describe the correlation between two tests in a general way as high,
marked or substantial, low or negligible. While the descriptive label
applied will vary somewhat in meaning with the author using it, there
is fairly good agreement among workers with psychological and educa—
tional tests that:
an “r” from ~ .00 to ~ .20 denotes indifferent ornegligible relationship.
1H. G. Osburn and R. S. Melton, Educational and PsychologicalMeasurements, XXIII, No. 2 (1960), p. 277.
19
an “r” from .20 to ± .40 denotes low correlation;present but slight.
an “r” from ± .40 to ± .70 denotes substantial ormarked relationship.
an “r” from ± .70 to ± 1.00 denotes high to veryhigh relationship.
This classification is broad and somewhat tentative, and can only be
accepted as a general rule with certain reservations. Thus, a coeffi
cient of correlation must always be judged with regard to:
(1) the nature of variables with which we are dealing;
(2) the significance of the coefficients;
(3) the variability of the group;
(4) the reliability coefficients of the tests used;
(5) the purpose for which the “r” was computed.1
1Henry E. Garrett, Statistics in Psychology and Education(New York: Longmans, Green and Company, Inc., 1958), pp. 175-176.

CHAPTER II
ANALYSIS AND INTERPRETATION OF DATA
Introduction. --The following information includes the data
derived from the research conducted concerning two mental ability
tests as predictors of high school performance.
This study involved thirty tenth grade students at Booker T.
Washington High School, Atlanta, Georgia, IQ scores of the last
Kuhiman-Anderson Intelligence Test administered to these students in
elementary school, the mental ability test scores of the Otis Quick
Scoring Mental Ability Test (Beta) administered in the eighth grade
of the high school, and the grade point averages of the cumulative
grades; eighth, ninth and tenth, earned by each subject in the areas
of English, mathematics, social studies and science.
Some indices of socio-economic conditions of the subjects. --An
analysis was made of data indicating socio-economic conditions
extracted from the cumulative record cards of each subject. This
analysis revealed that of the thirty subjects studied, eleven were
male and nineteen were female. Eight of the subjects lived with the
mother, one lived with the father and twenty-one lived with both
parents. In three cases the father was recorded as unemployed, in
twelve cases the father was recorded as being employed in unskilled
occupations, in eight cases the father was recorded as being employed
20

21
in skilled occupations. The records revealed that twelve mothers were
unemployed, fourteen mothers were employed in unskilled occupations
and three mothers were employed in skilled occupations. A further
analysis revealed that in three cases neither parenc was employed, in
eighteen cases only one parent was employed, in nine cases both parents
were employed. Both parents of one of the subjects had attended
college. Both parents of six of the subjects had attended high school.
Both parents of two of the subjects terminated their formal education
in elementary school. According to the records of the eight subjects
who lived with only their mothers, one mother attended only elementary
school and seven mothers attended high school. According to the
record of the one subject who lived with only the father, there was no
record of the father’s educational level. Seven of the subjects
expressed intentions of finishing high school, twenty-three desired to
attend schools of higher learning after their completion of high school.
Ten of the subjects were undecided about their vocational objectives,
seven desired to become teachers, five desired to become secretaries,
three desired to become engineers, two desired to become nurses, one
each desired to become a technician, an air line stewardess, and a
doctor.
Relationships between the Kuhiman-Anderson Intelligence Test and
the Otis Quick Scoring Mental Ability Test. --The IQ scores derived
from the Kuhlman-Anderson Intelligence Test for the thirty subjects
in this study and IQ scores derived from the Otis Quick Scoring
Mental Ability Test for these subjects were tabulated and compared.
The range on the Kuhlman-Anderson Intelligence Test was represented

22
by a high score of 129 and a low score of 84. The range on the Otis
Quick Scoring Mental Ability Test was represented by a high score of
107 and a low score of 65. Thus, the range on the Kuhlman-Anderson
Test was 46 and the range on the Otis was 43. The mean score on the
Kuhiman-Anderson Test was 103.1 with a standard deviation of 10.14.
The mean score on the Otis Test was 85.8 with a standard deviation of
10.68. On the Kuhiman-Anderson Test, eleven of the subjects scored
above the mean while nineteen of the subjects scored below the mean.
Approximately 73-1/3 percent of the sample group scored between ±1
standard deviation from the mean score of 103.1 on the Kuhlman
Anderson Test. On the Otis Test, fourteen of the subjects scored
above the mean while sixteen of the subjects scored below the mean.
Sixty-six and two-thirds percent of the selected sample scored between
the limits of ±1 standard deviation from the mean. The Pearson Product
Moment Coefficient of Correlation was computed, yielding an “r” of .71.
Generally speaking, this indicated a high positive relationship between
the two tests of intelligence. See Table 1.
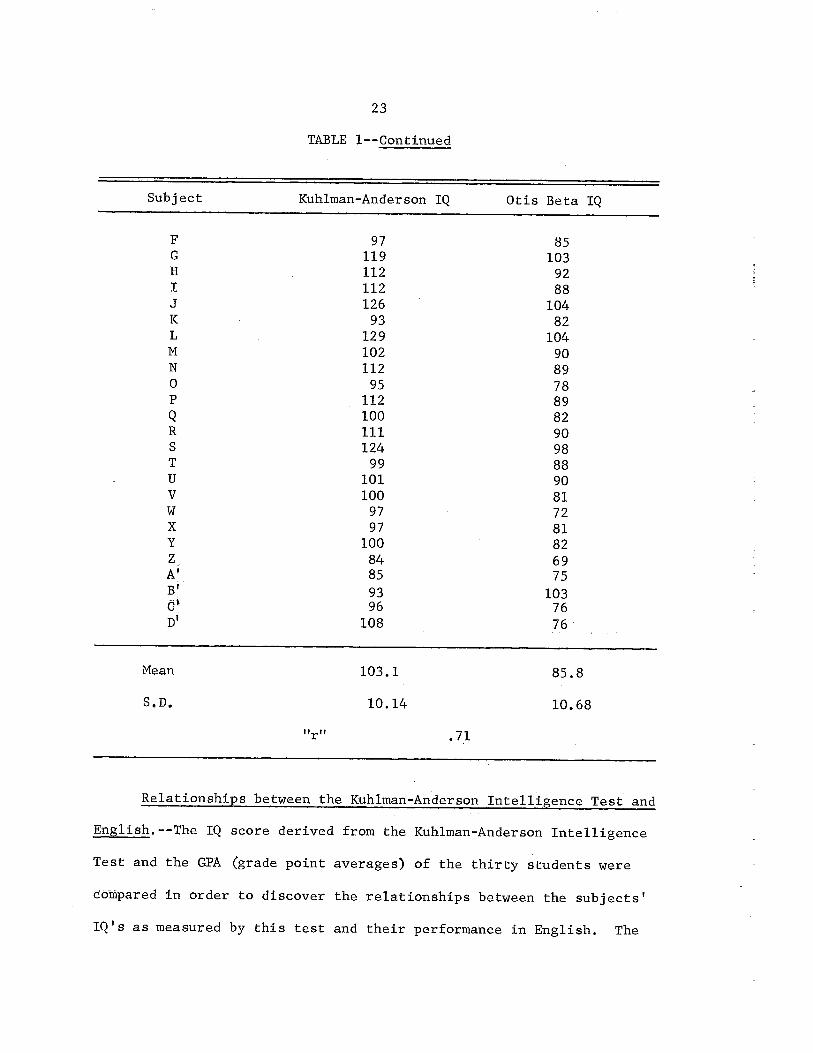
TABLE 1
INTELLIGENCE TEST SCORES FOR THIRTY TENTH GRADE STUDENTSON THE KUHLMAN-ANDERSON INTELLIGENCE TEST AND THE
OTIS QUICK SCORING MENTAL ABILITY TEST
Subjects Kuhlman-Anderson IQ Otis Beta IQ
A 102 83B 97 107C 88 65D 89 70E 105 82
23
TABLE 1--Continued
Subject Kuhiman-Anderson IQ Otis Beta IQ
F 97 85C 119 103H 112 92I 112 88J 126 104K 93 82L 129 104M 102 90N 112 890 95 78P 112 89Q 100 82R 111 90S 124 98T 99 88U 101 90V 100 81W 97 72X 97 81Y 100 82Z 84 69A’ 85 75B’ 93 103~ij~ 96 760’ 108 76
Mean 103.1 85.8
S.D. 10.14 10.68
“r” .71
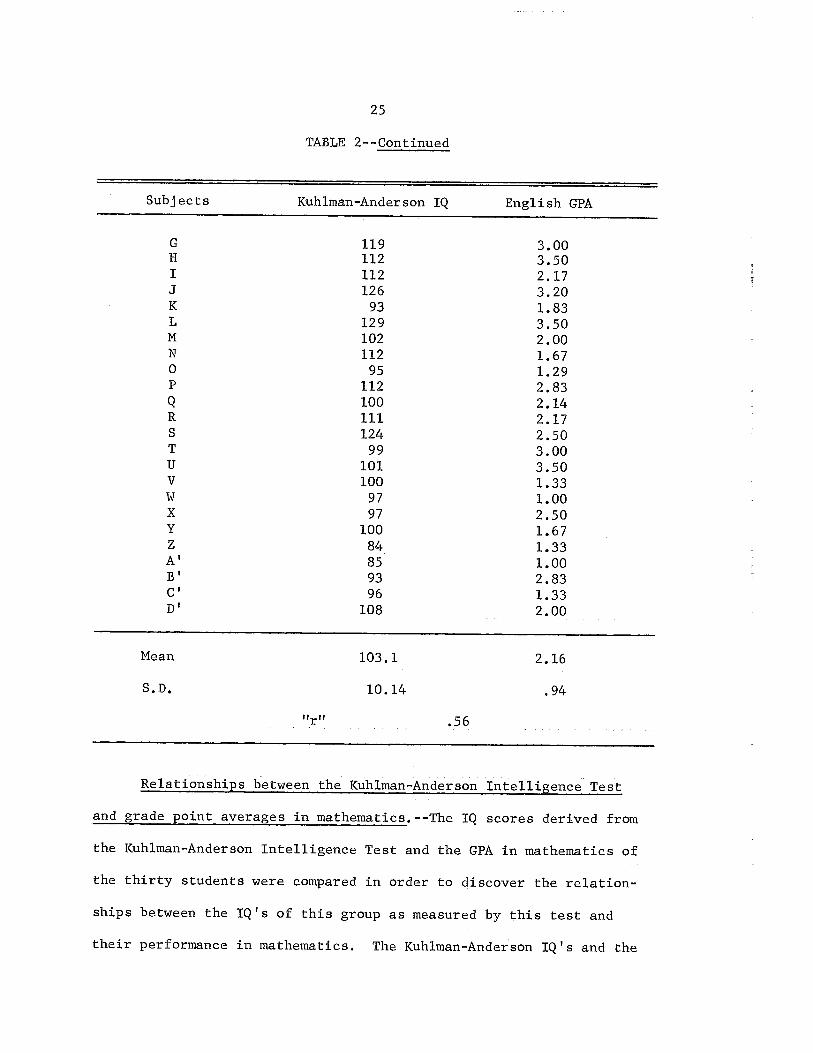
Relationships between the Kuhlman-Anderson Intelligence Test and
English. --The IQ score derived from the Kuhlman-Anderson Intelligence
Test and the GPA (grade point averages) of the thirty students were
dômpared in order to discover the relationships between the subjects’
IQ’s as measured by this test and their performance in English. The
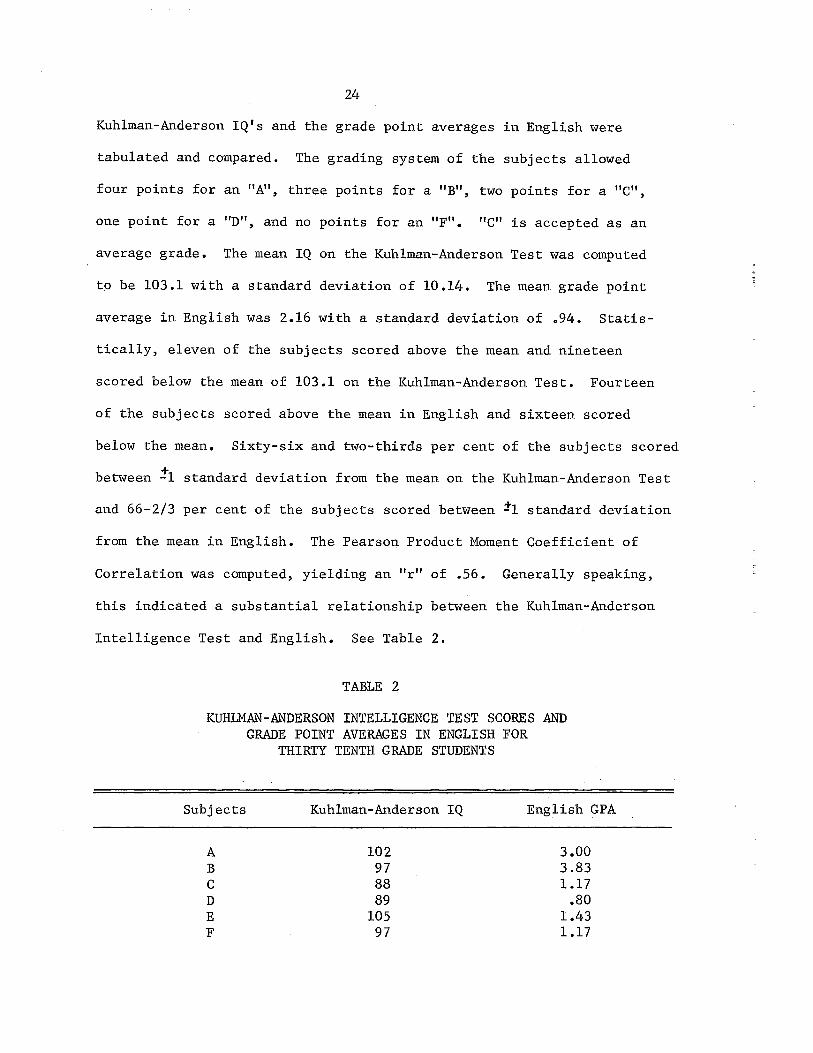
24
Kuhiman-Anderson IQ’s and the grade point averages in English were
tabulated and compared. The grading system of the subjects allowed
four points for an “A”, three points for a “B”, two points for a “C”,
one point for a “D”, and no points for an “F”. “C” is accepted as an
average grade. The mean IQ on the Kuhiman-Anderson Test was computed
to be 103.1 with a standard deviation of 10.14. The mean grade point
average in English was 2.16 with a standard deviation of .94. Statis
tically, eleven of the subjects scored above the mean and nineteen
scored below the mean of 103.1 on the Kuhiman-Anderson Test. Fourteen
of the subjects scored above the mean in English and sixteen scored
below the mean. Sixty-six and two-thirds per cent of the subjects scored
between ±1 standard deviation from the mean on the Kuhlman-Anderson Test
and 66-2/3 per cent of the subjects scored between ±1 standard deviation
from the mean in English. The Pearson Product Moment Coefficient of
Correlation was computed, yielding an “r” of .56. Generally speaking,
this indicated a substantial relationship between the Kuhlman-Anderson
Intelligence Test and English. See Table 2.
TABLE 2
KUHLMAN-ANDERSON INTELLIGENCE TEST SCORES AJ~DGRADE POINT AVERAGES IN ENGLISH FOR
THIRTY TENTH GRADE STUDENTS
Subjects Kuhlman-Anderson IQ English GPA
A 102 3.00B 97 3.83C 88 1.17D 89 .80E 105 1.43F 97 1.17
25
TABLE 2--Continued
Subjects Kuhiman-Anderson IQ English CPA
C 119 3.00H 112 3.50I 112 2.17J 126 3.20K 93 1.83L 129 3.50M 102 2.00N 112 1.670 95 1.29P 112 2.83Q 100 2.14R 111 2.17S 124 2.50T 99 3.00U 101 3.50V 100 1.33W 97 1.00X 97 2.50Y 100 1.67Z 84 1.33A’ 85 1.00B’ 93 2.83C’ 96 1.33D’ 108 2.00
Mean 103.1 2.16
S.D. 10.14 .94
“r” .56
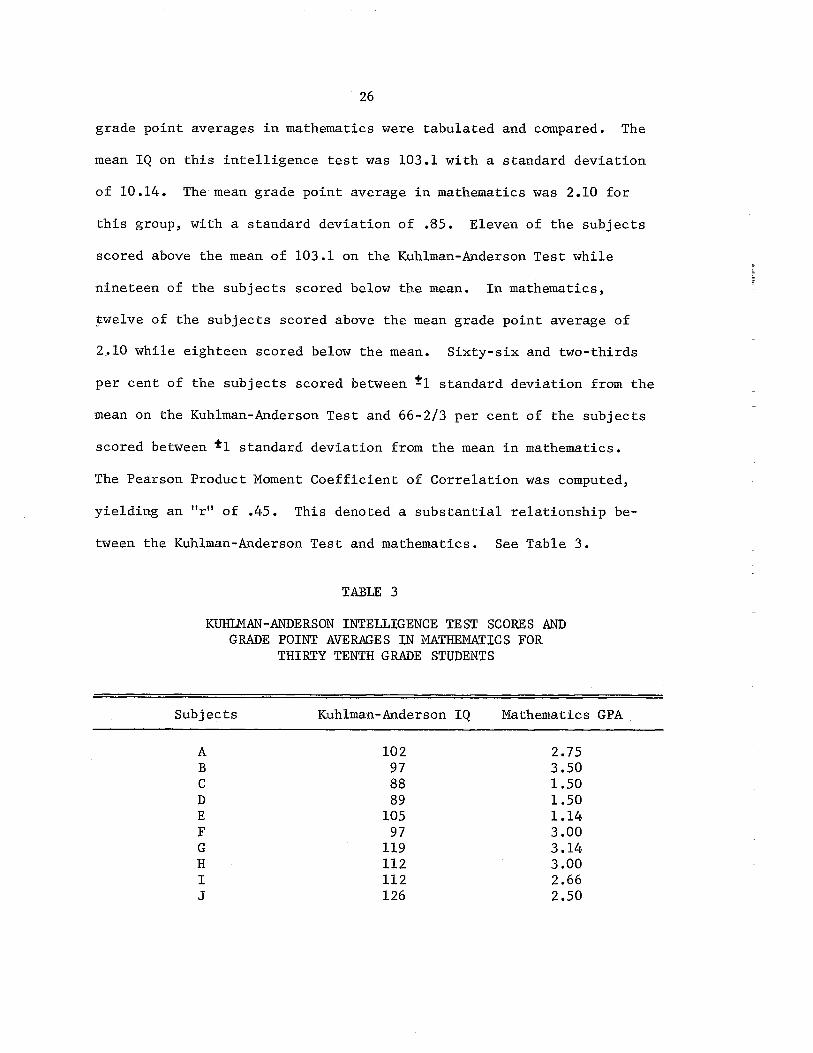
Relationships between the Kuhiman-Anderson Intelligence Test
and grade point averages in mathematics.--The IQ scores derived from
the Kuhiman-Anderson Intelligence Test and the CPA in mathematics of
the thirty students were compared in order to discover the relation
ships between the IQ’s of this group as measured by this test and
their performance in mathematics. The Kuhlman-Anderson IQ’s and the
26
grade point averages in mathematics were tabulated and compared. The
mean IQ on this intelligence test was 103.1 with a standard deviation
of 10.14. The mean grade point average in mathematics was 2.10 for
this group, with a standard deviation of .85. Eleven of the subjects
scored above the mean of 103.1 on the Kuhlman-Anderson Test while
nineteen of the subjects scored below the mean. In mathematics,
twelve of the subjects scored above the mean grade point average of
2.. 10 while eighteen scored below the mean. Sixty-six and two-thirds
per cent of the subjects scored between ±1 standard deviation from the
mean on the Kuhlman-Anderson Test and 66-2/3 per cent of the subjects
scored between *1 standard deviation from the mean in mathematics.
The Pearson Product Moment Coefficient of Correlation was computed,
yielding an “r” of .45. This denoted a substantial relationship be
tween the Kuhlman-Anderson Test and mathematics. See Table 3.
TABLE 3
KUHLMAN-ANDERSON INTELLIGENCE TEST SCOEES ANDGRADE POINT AVERAGES IN MATHEMATICS FOR
THIRTY TENTH GRADE STUDENTS
Subjects Kuhlman-Anderson IQ Mathematics GPA
A 102 2.75B 97 3.50C 88 1.50D 89 1.50E 105 1.14F 97 3.00G 119 3.14H 112 3.00I 112 2.66J 126 2.50
27
TABLE 3--Continued
Subjects Kuhiman-Anderson IQ Mathematics CPA
K 93 1.50L 129 3.83M 102 2.83N 112 1.500 95 1.67P 112 3.33Q 100 2.20R 111 2.00S 124 1.67T 99 2.00U 101 3.33V 100 1.29w 97 .67X 97 1.33Y 100 1.14Z 84 1.33A’ 85 2.00B’ 93 1.60C’ 96 1.67D’ 108 1.67
Mean 103.1 2.10
S.D. 10.14 .85
“r” .45
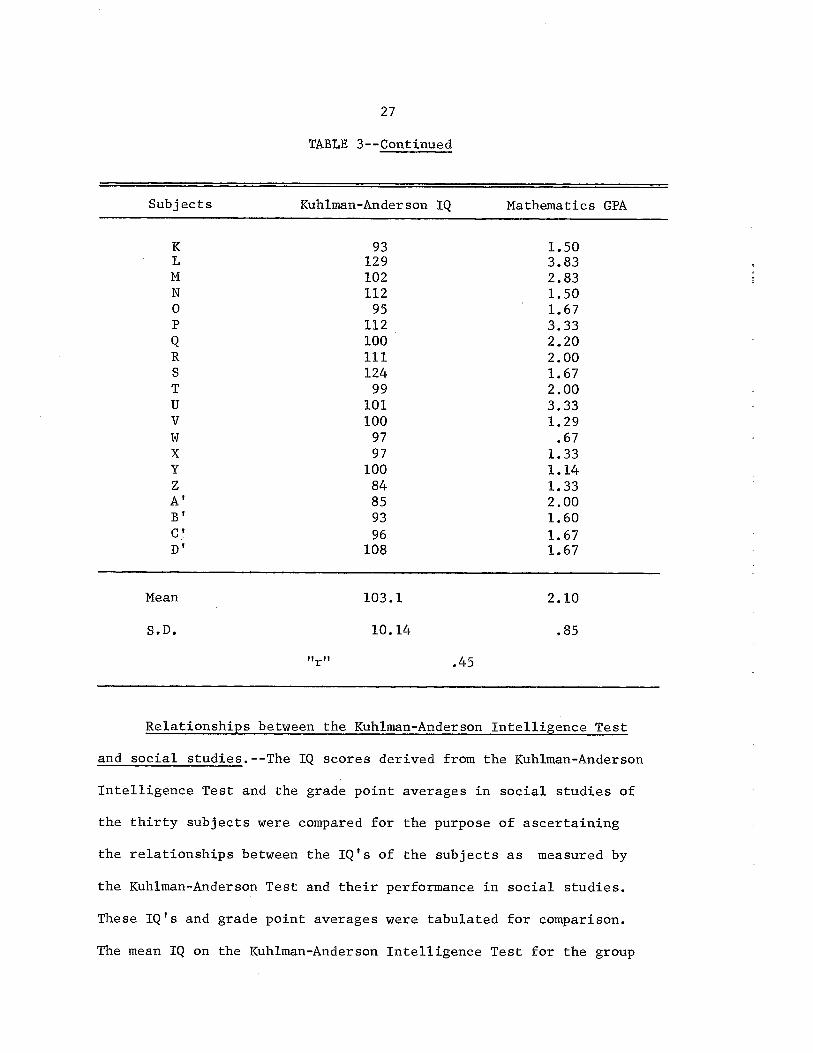
Relationships between the Kuhlman-Anderson Intelligence Test
and social studies.--The IQ scores derived from the Kuhlman-Anderson
Intelligence Test and the grade point averages in social studies of
the thirty subjects were compared for the purpose of ascertaining
the relationships between the IQ’s of the subjects as measured by
the Kuhlman-Anderson Test and their performance in social studies.
These IQ’s and grade point averages were tabulated for comparison.
The mean IQ on the Kuhlman-Anderson Intelligence Test for the group

28
was 103.1 with a standard deviation of 10.14. The mean grade point
average in social studies was 2.34 with a standard deviation of .94.
Eleven of the thirty students scored above the mean on the Kuhlman
Anderson Test and nineteen scored below the mean. In social studies,
fourteen of the students scored above the mean while sixteen scored
below the mean. Sixty-six and two-thirds per cent of the subjects
scored between ±1 standard deviation from the mean on the Kuhiman
Anderson Intelligence Test and sixty-six and two-thirds per cent scored
between +1 and -l standard deviation from the mean in the area of
social studies. The Pearson Product Moment Coefficient of Correlation
was computed, yielding an “r” of .52. This “r” indicated substantial
relationship. See Table 4.
TABLE 4
KUHLMAN-ANDERSON INTELLIGENCE TEST SCORES ANDGRADE POINT AVERAGES IN SOCIAL STUDIES
FOR THIRTY TENTH GRADE STUDENTS
Subjects Kuhlman-Anderson IQ Social Studies CPA
A 102 2.50B 97 4.00C 88 1.67D 89 .80E 105 .71F 97 2.00C 119 3.33H 112 3.33I 112 1.50J 126 3.20K 93 1.67L 129 4.00M 102 2.50N 112 3.250 95 2.17P 112 3.50
29
TABLE 4--Continued
Subjects Kuhiman-Anderson IQ Social Studies CPA
Q 100 2.00R 111 3.20S 124 2.25T 99 2.75U 101 3.33V 100 2.40W 97 .63X 97 2.33Y 100 1.67Z 84 1.50A’ 85 .89B’ 93 3.17C’ 96 2.00D’ 108 2.00
Mean 103.1 2.34
S.D. 10.14 .94
‘‘r” .52
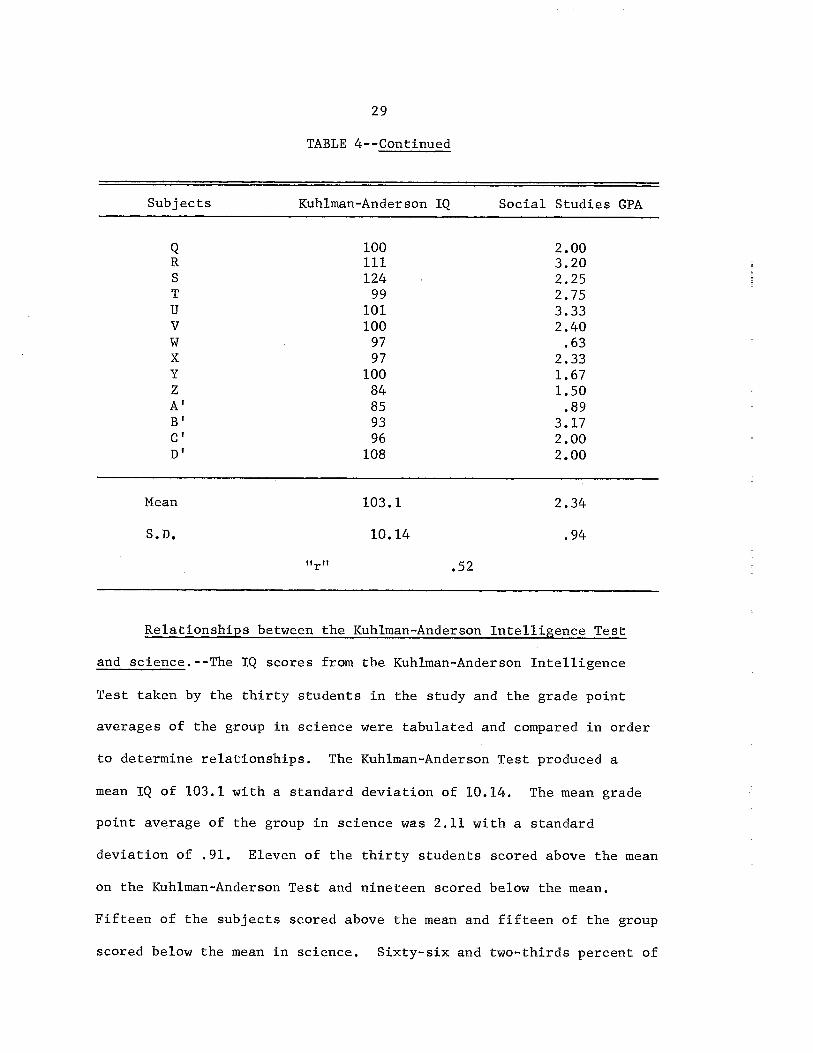
Relationships between the Kuhiman-Anderson Intelligence Test
and science. --The IQ scores from the Kuhiman-Anderson Intelligence
Test taken by the thirty students in the study and the grade point
averages of the group in science were tabulated and compared in order
to determine relationships. The Kuhlman-Anderson Test produced a
mean IQ of 103.1 with a standard deviation of 10.14. The mean grade
point average of the group in science was 2.11 with a standard
deviation of .91. Eleven of the thirty students scored above the mean
on the Kuhlman-Anderson Test and nineteen scored below the mean.
Fifteen of the subjects scored above the mean and fifteen of the group
scored below the mean in science. Sixty-six and two-thirds percent of
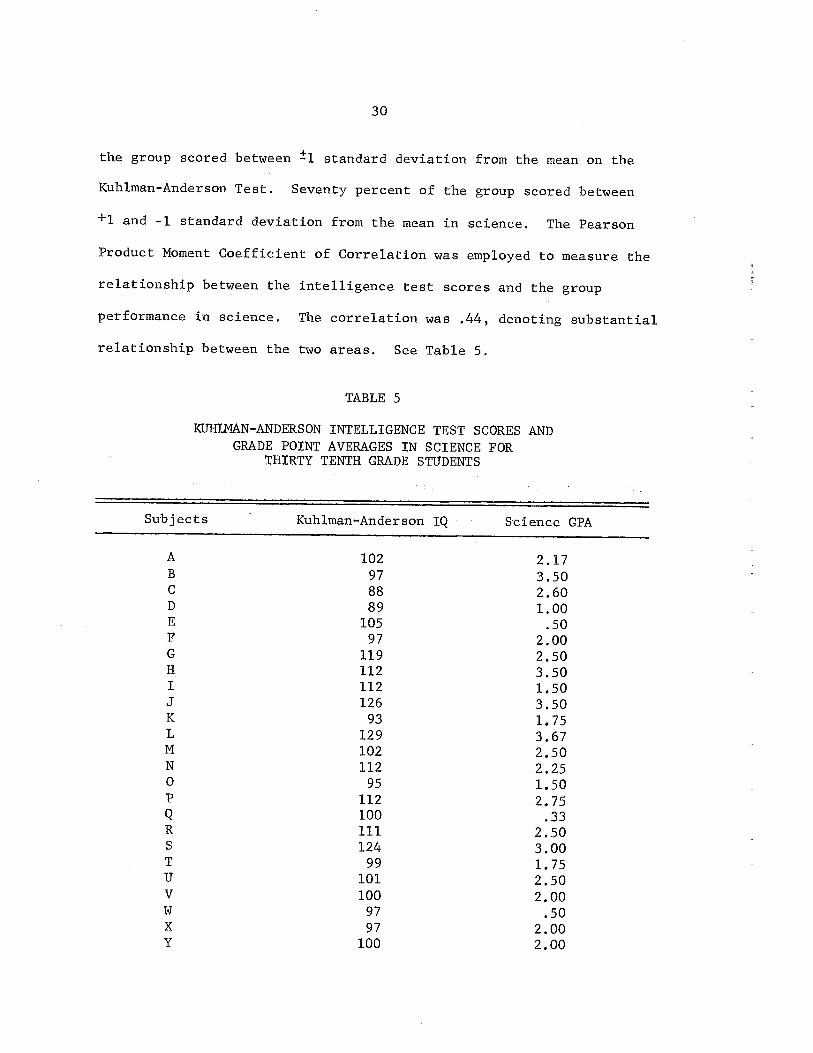
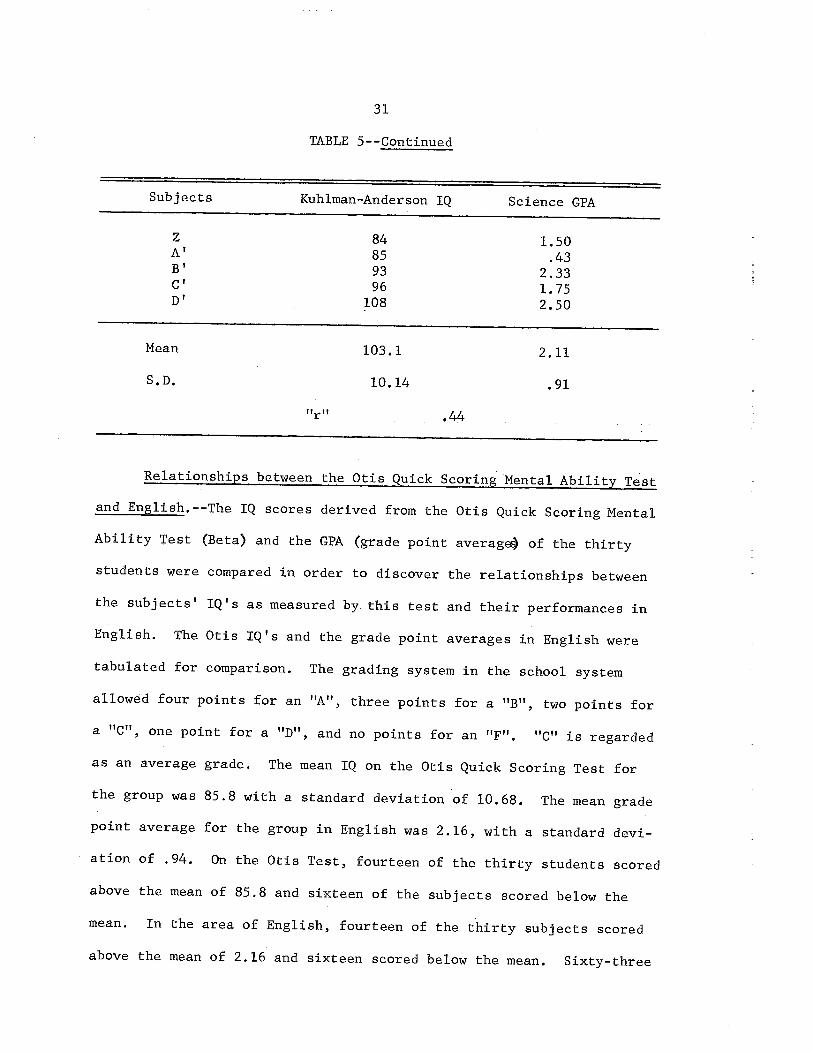
30
the group scored between ±1 standard deviation from the mean on the
Kuhlman-Anderson Test. Seventy percent of the group scored between
+1 and -l standard deviation from the mean in science. The Pearson
Product Moment Coefficient of Correlation was employed to measure the
relationship between the intelligence test scores and the group
performance in science. The correlation was .44, denoting substantial
relationship between the two areas. See Table 5.
TABLE 5
KLJHI2~1AN-ANDERS0N INTELLIGENCE TEST SCORES ANDGRADE POINT AVERAGES IN SCIENCE FOR
THIRTY TENTH GRADE STUDENTS
Subjects - Kuhlman-Anderson IQ Science GPA
A 102 2.17B 97 3.50C 88 2.60D 89 1.00E 105 .50F 97 2.00C 119 2.50H 112 3.50I 112 1.503 126 3.50K 93 1.75L 129 3.67N 102 2.50N 112 2.250 95 1.50P 112 2.75Q 100 .33R 111 2.50S 124 3.00T 99 1.75U 101 2.50V 100 2.00W 97 .50X 97 2.00Y 100 2.00
31
TABLE 5--Continued
Subjects Kuhiman-Anderson IQ Science CPA
Z 84 1.50A’ 85 .43B’ 93 2.33C’ 96 1.75D’ 108 2.50
Mean 103.1 2.11
S.D. 10.14 .91
~ .44
Relationships between the Otis Quick Scoring Mental Ability Test
and English.--The IQ scores derived from the Otis Quick Scoring Mental
Ability Test (Beta) and the CPA (grade point averag~ of the thirty
students were compared in order to discover the relationships between
the subjects’ IQ’s as measured by this test and their performances in
English. The Otis IQ’s and the grade point averages in English were
tabulated for comparison. The grading system in the school system
allowed four points for an “A”, three points for a “B”, two points for
a “C”, one point for a “D”, and no points for an “F”. “C” is regarded
as an average grade. The mean IQ on the Otis Quick Scoring Test for
the group was 85.8 with a standard deviation of 10.68. The mean grade
point average for the group in English was 2.16, with a standard devi
ation of .94. On the Otis Test, fourteen of the thirty students scored
above the mean of 85.8 and sixteen of the subjects scored below the
mean. In the area of English, fourteen of the thirty subjects scored
above the mean of 2.16 and sixteen scored below the mean. Sixty-three
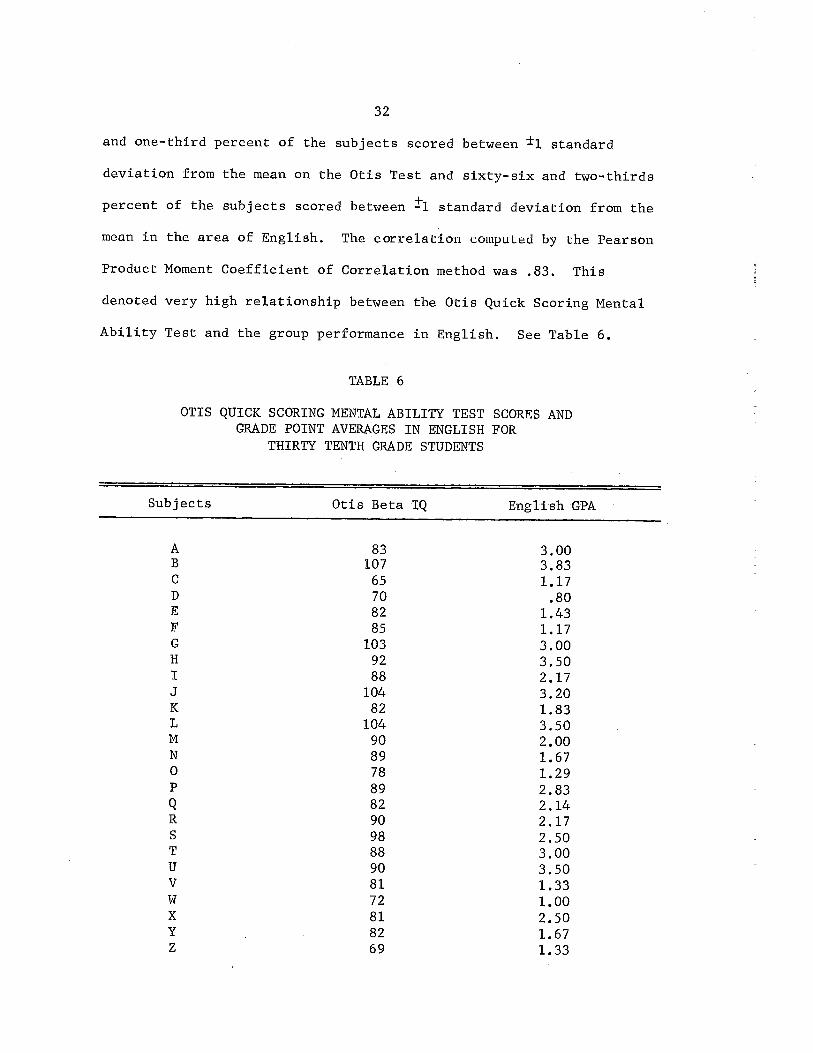
32
and one-third percent of the subjects scored between ±1 standard
deviation from the mean on the Otis Test and sixty-six and two-thirds
percent of the subjects scored between ±1 standard deviation from the
mean in the area of English. The correlation compuced by the Pearson
Product Moment Coefficient of Correlation method was .83. This
denoted very high relationship between the Otis Quick Scoring Mental
Ability Test and the group performance in English. See Table 6.
TABLE 6
OTIS QUICK SCORING MENTAL ABILITY TEST SCORES ANDGRADE POINT AVERAGES IN ENGLISH FOR
THIRTY TENTH GRADE STUDENTS
Subjects Otis Beta IQ English GPA
A 83 3.00B 107 3.83C 65 1.17D 70 .80E 82 1.43F 85 1.17G 103 3.00H 92 3.50I 88 2.17.1 104 3.20K 82 1.83L 104 3.50M 90 2.00N 89 1.670 78 1.29P 89 2.83Q 82 2.14R 90 2.17S 98 2.50T 88 3.00U 90 3.50V 81 1.33w 72 1.00X 81 2.50Y 82 1.67Z 69 1.33
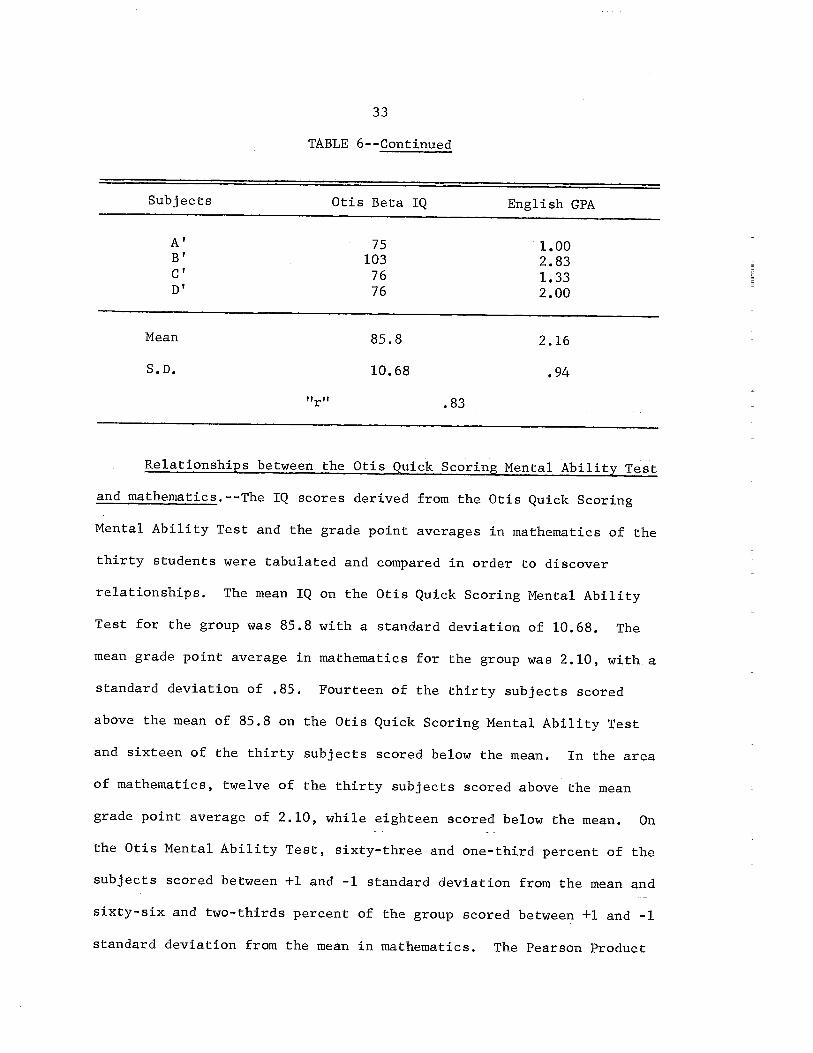
33
TABLE 6--Continued
Subjects Otis Beta IQ English CPA
A’ 75 1.00B’ 103 2.83C’ 76 1.33D’ 76 2.00
Mean 85.8 2.16
S.D. 10.68 .94
“r” .83
Relationships between the Otis Quick Scoring Mental Ability Test
and mathematics. --The IQ scores derived from the Otis Quick Scoring
Mental Ability Test and the grade point averages in mathematics of the
thirty students were tabulated and compared in order to discover
relationships. The mean IQ on the Otis Quick Scoring Mental Ability
Test for the group was 85.8 with a standard deviation of 10.68. The
mean grade point average in mathematics for the group was 2.10, with a
standard deviation of .85. Fourteen of the thirty subjects scored
above the mean of 85.8 on the Otis Quick Scoring Mental Ability Test
and sixteen of the thirty subjects scored below the mean. In the area
of mathematics, twelve of the thirty subjects scored above the mean
grade point average of 2.10, while eighteen scored below the mean. On
the Otis Mental Ability Test, sixty-three and one-third percent of the
subjects scored between +1 and -1 standard deviation from the mean and
sixty-six and two-thirds percent of the group scored between +1 and -l
standard deviation from the mean in mathematics. The Pearson Product
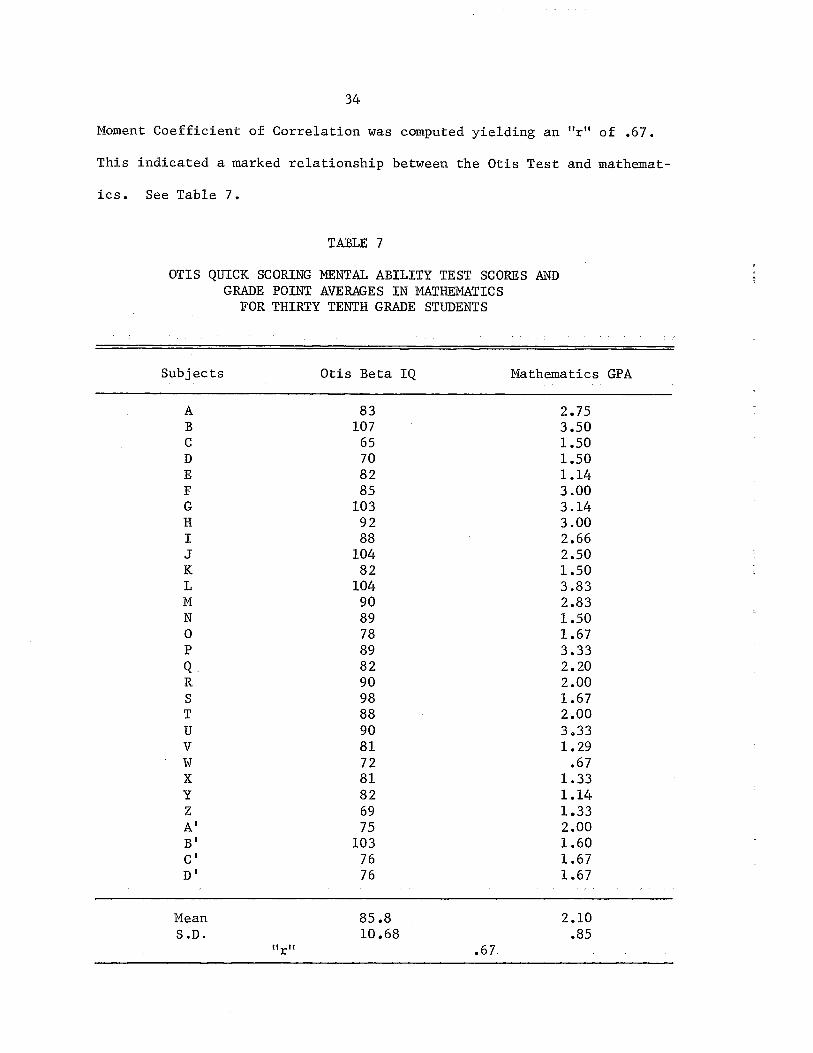
34
Moment Coefficient of Correlation was computed yielding an “r” of .67.
This indicated a marked relationship between the Otis Test and mathemat
ics. See Table 7
TABLE 7
OTIS QUICK SCORING MENTAL ABILITY TEST SCORES ANDGRADE POINT AVERAGES IN MATHEMATICS
FOR THIRTY TENTH GRADE STUDENTS
Subjects Otis Beta IQ Mathematics GPA
ABCDEFGHIJKLHN0PQ:RSTUVwxYzA’B’C’
83107
65708285
1039288
10482
104908978898290988890817281826975
1037676
2 • 753.501.501.501.143.003.143.002.662.501.503.832.831.501.673.332 • 202.001.672.003,331 .29
.671.331.141.332.001.601.671.67
Mean 85.8 2.10S.D. 10.68 .85
“r” .67
35
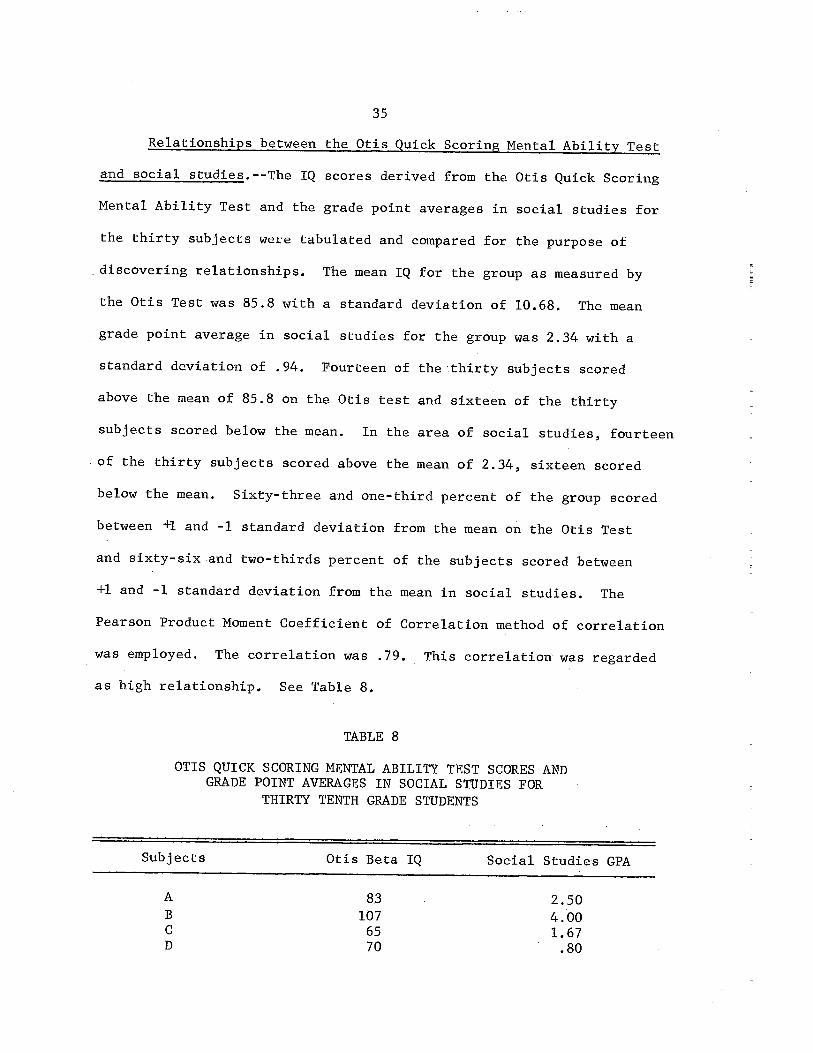
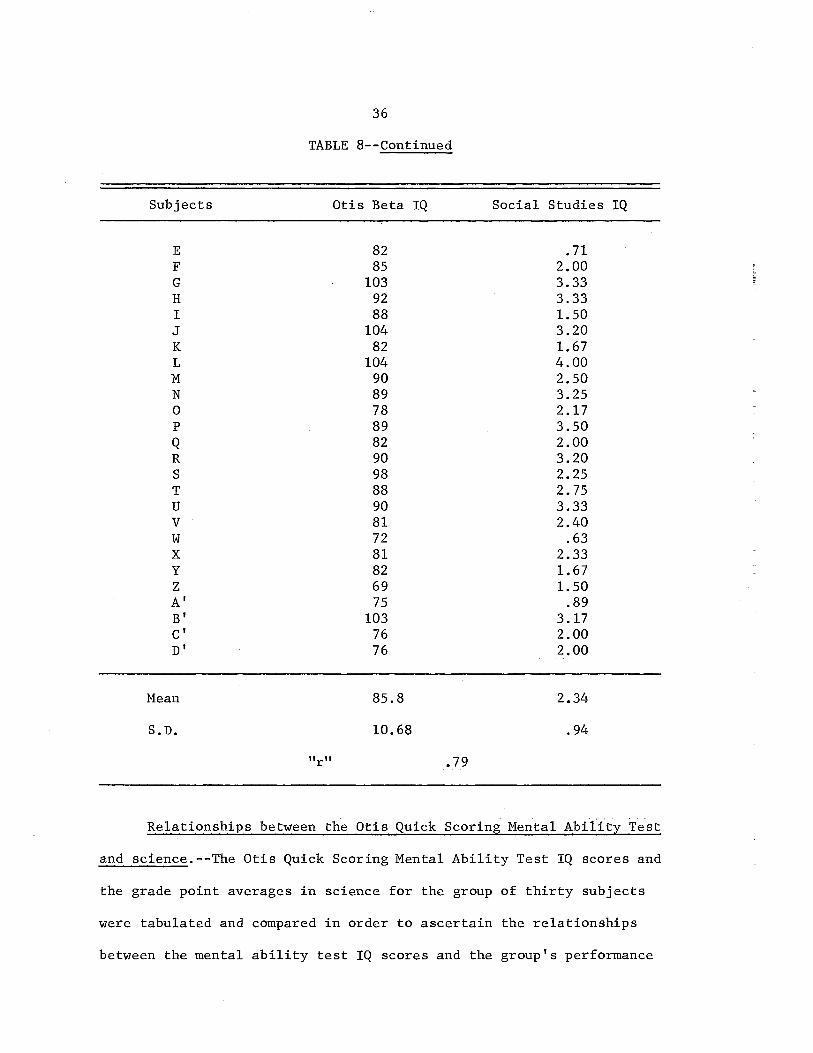
Relationships between the Otis Quick Scoring Mental Ability Test
and social studies. --The IQ scores derived from the Otis Quick Scoring
Mental Ability Test and the grade point averages in social studies for
the thirty subjects were (abulated and compared for the purpose of
discovering relationships. The mean IQ for the group as measured by
the Otis Test was 85.8 with a standard deviation of 10.68. The mean
grade point average in social studies for the group was 2.34 with a
standard deviation of .94. Fourteen of the thirty subjects scored
above the mean of 85.8 on the Otis test and sixteen of the thirty
subjects scored below the mean. In the area of social studies, fourteen
of the thirty subjects scored above the mean of 2.34, sixteen scored
below the mean. Sixty-three and one-third percent of the group scored
between +1 and -1 standard deviation from the mean on the Otis Test
and sixty-six and two-thirds percent of the subjects scored between
+1 and -1 standard deviation from the mean in social studies. The
Pearson Product Moment Coefficient of Correlation method of correlation
was employed. The correlation was .79. This correlation was regarded
as high relationship. See Table 8.
TABLE 8
OTIS QUICK SCORING MENTAL ABILITY TEST SCORES ANDGRADE POINT AVERAGES IN SOCIAL STUDIES FOR
THIRTY TENTH GRADE STUDENTS
Subjects Otis Beta IQ Social Studies GPA
A 83 2.50B 107 4.00C 65 1.67D 70 .80
36
TABLE 8--Continued
Subjects Otis Beta IQ Social Studies IQ
E 82 .71F 85 2.00G 103 3.33H 92 3.33I 88 1.50J 104 3.20K 82 1.67L 104 4.00M 90 2.50N 89 3.250 78 2.17P 89 3.50Q 82 2.00R 90 3.20S 98 2.25T 88 2.75U 90 3.33V 81 2.40W 72 .63X 81 2.33Y 82 1.67Z 69 1.50A’ 75 .89B’ 103 3.17C’ 76 2.00D’ 76 2.00
Mean 85.8 2.34
S.D. 10.68 .94
“r” .79
Relationships between the Otis Quick Scoring Mental Ability Test
and science. --The Otis Quick Scoring Mental Ability Test IQ scores and
the grade point averages in science for the group of thirty subjects
were tabulated and compared in order to ascertain the relationships
between the mental ability test IQ scores and the group’s performance
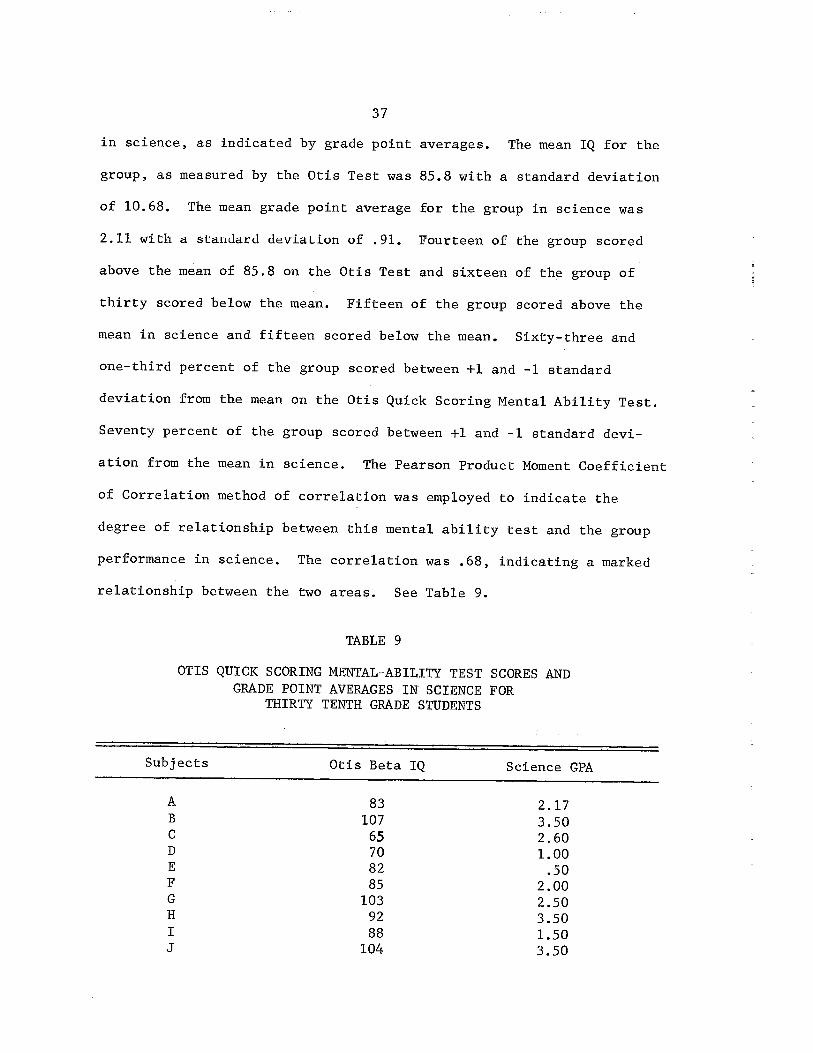
37
in science, as indicated by grade point averages. The mean IQ for the
group, as measured by the Otis Test was 85.8 with a standard deviation
of 10.68. The mean grade point average for the group in science was
2.11 with a standard deviation of .91. Fourteen of the group scored
above the mean of 85.8 on the Otis Test and sixteen of the group of
thirty scored below the mean. Fifteen of the group scored above the
mean in science and fifteen scored below the mean. Sixty-three and
one-third percent of the group scored between +1 and -l standard
deviation from the mean on the Otis Quick Scoring Mental Ability Test.
Seventy percent of the group scored between +1 and -l standard devi
ation from the mean in science. The Pearson Product Moment Coefficient
of Correlation method of correlation was employed to indicate the
degree of relationship between this mental ability test and the group
performance in science. The correlation was .68, indicating a marked
relationship between the two areas. See Table 9.
TABLE 9
OTIS QUICK SCORING MENTAL~ABIIjTy TEST SCORES ANDGRADE POINT AVERAGES IN SCIENCE FOR
THIRTY TENTH GRADE STUDENTS
Subjects Otis Beta IQ Science GPA
A 83 2.17B 107 3.50C 65 2.600 70 1.00E 82 .50F 85 2.00C 103 2.50H 92 3.50I 88 1.50J 104 3.50
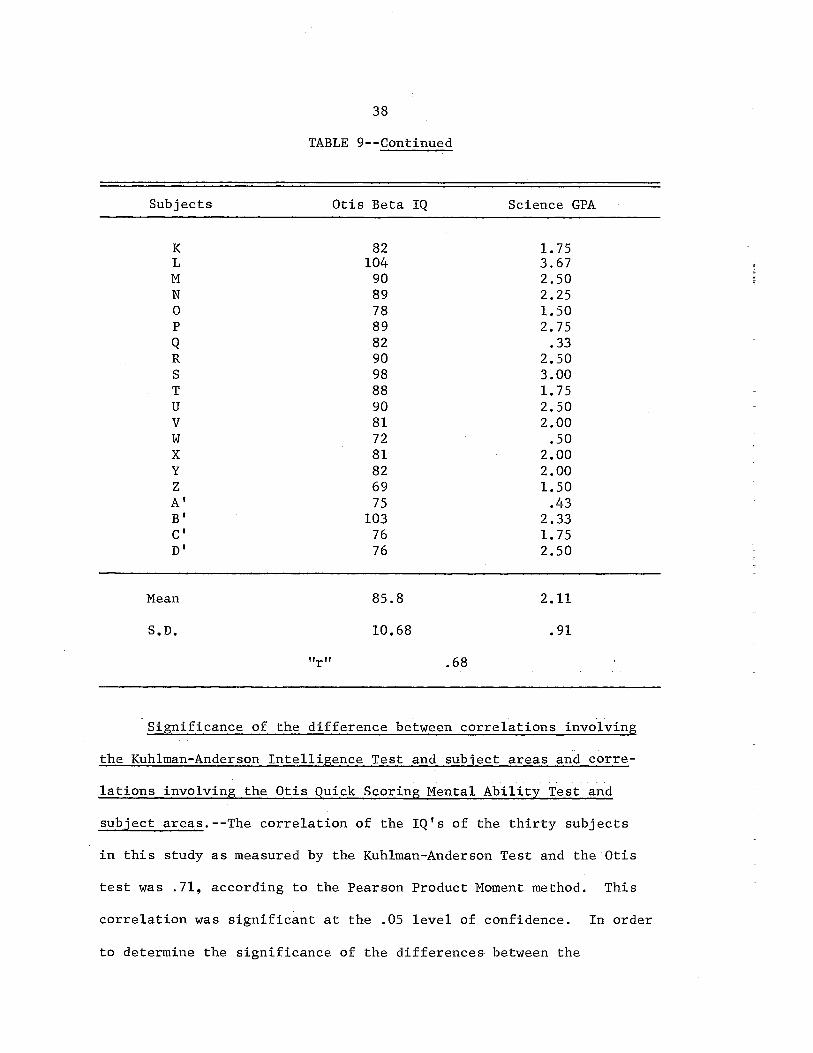
38
TABLE 9--Continued
Subjects Otis Beta IQ Science GPA
K 82 1.75L 104 3.67N 90 2.50N 89 2.250 78 1.50P 89 2.75Q 82 .33R 90 2.50S 98 3.00T 88 1.75U 90 2.50V 81 2.00W 72 .50X 81 2.00Y 82 2.00Z 69 1.50A’ 75 .43B’ 103 2.33C’ 76 1.75D’ 76 2.50
Mean 85.8 2.11
S.D. 10.68 .91
“r” .68
Significance of the difference between correlations involving
the Kuhiman-Anderson Intelligence Test and sublect areas and corre
lations involving the Otis Quick Scoring Mental Ability Test and
subject areas.--The correlation of the IQ’s of the thirty subjects
in this study as measured by the Kuhlman-Anderson Test and the Otis
test was .71, according to the Pearson Product Moment method. This
correlation was significant at the .05 level of confidence. In order
to determine the significance of the differences between the

39
correlations involving the Kuhlman-Anderson test and grade point
averages in the subject areas and the correlations involving the Otis
test and grade point averages in the areas, it was deemed necessary
to determine the SE (standard error). A useful and mathematically
exact method of determining the SE of the difference between the “r’s”
required thatthe “r’s” were first converted into the Fisher’s z
function. Through this method, the standard error of the difference
between the z’s was computed by dividing the difference by the standard
error which was .275 for this sample. This process yielded a CR
(critical ratio) for each subject area. Each CR was compared with
1.96 to determine the significance at the .05 level of confidence. The
Otis and English “r” was .83 (z = 1.19). The Kuhlman-Anderson and
English “r” was .56 (z = .63). The difference was .56 in favor of the
Otis. The CR was 2.04 which was significant at the .05 level of
confidence. The Otis and mathematics “r” was .67 (z .81). The
Kuhiman-Anderson and mathematics “r” was .45 (z .48). This resulted
in a difference of .33 in favor of the Otis. The CR was 1.20 which was
not significant at the .05 level of confidence. The Otis and social
studies “r” was .79 (z = 1.07). The Kuhlrnan-Anderson and social
studies “r” was .52 (z = .58). The difference was .49 favoring the
Otis. The CR of 1.78 was not quite enough to be significant at the
.05 level of confidence. The Otis and science “r” was .68 (z .83).
The Kuhlman-Anderson and science “r” was .44 (z = .47). The difference
between the z’s was .36. The CR was 1.31 which was not significant at
the .05 level of confidence. See Table 10.

40
TABLE 10
FISHER’S Z TEST OF SIGNIFICANCE OF THE DIFFERENCES BETWEENTHE OTIS (BETA) MENTAL ABILITY TEST AND CPA AND
THE K(JHLMAN-ANDERSON INTELLIGENCE TESTAND GRADE POINT AVERAGE
Social MatheEnglish Studies matics Science
Otis Beta .83 .79 .67 .68
Kuhiman-Anderson .56 .52 .45 .44
Z1 1.19 1.07 .81 .83
Z2 .63 .58 .48 .47
SD3 (standard errorof difference .275 .275 .275 .275between two zcoefficients)
Z - ratio 2.04* 1.78 1.20 1.31
*Significant at the 5 percent level of confidence.
CHAPTER III
SUMMARY AND CONCLUSIONS
Introduction. --For years, schools have made many uses of
standardized tests. Among these uses have been the use of tests to
predict performance. In order for tests to serve this purpose, a
high degree of knowledge and skill must be employed in the selection
of these tests. Selecting tests on the basis of validity, the extent
to which the tests measure what they purport to measure, is of utmost
importance.
During this period of increased marketing of tests, wherein
many claims are made as to what the tests do, much concern must be
given the question, which test measures best what it is intended to
measure. The Atlanta School System, in its uniform testing program,
uses two intelligence tests to measure the mental ability of the
children in the system. All of the elementary schools administer
the Kuhlman-Anderson Intelligence Test and the high schools administer
the Otis Quick Scoring Mental Ability Test in the eighth grade. The
following data includes the findings and conclusions derived from the
research conducted concerning the two mental ability tests as
predictors of high school performance.
Restatement of the problem.--This was a comparative study of the
Kuhlman-Anderson Intelligence Test and the Otis Quick Scoring Mental
Ability Test as predictors of high school performance. It involved
41
42
thirty tenth grade students at Booker T. Washington High School, Atlanta,
Georgia, IQ scores of the last Kuhiman-Anderson Intelligence Test admin
istered to these students in elementary school, the IQ scores of the
Otis (Beta) Quick Scoring Mental Ability Test administered to these
students in the eighth grade of the high school, the grade point averages
of the cumulative grades; eighth, ninth and tenth, earned by each
subject in the areas of English, mathematics, social studies and science.
An analysis was made of some of the indices of socio-economic conditions
of the subjects as recorded in the students’ permanent cumulative folders.
Description of procedures used.--The research was designed to
determine the coefficients of correlation between the Kuhlman-Anderson
Intelligence Test and the four subject areas, coefficients of corre
lation between the Otis Quick Scoring Mental Ability Test and the four
subject areas, the significance of the difference between the corre
lations involving the Kuhlman-Anderson Test and those involving the
Otis Test and to describe the subjects in terms of certain socio
economic factors.
The descriptive method of research was used. The cumulative
records, elementary and high school were examined. Subjects were
chosen by the method of purposive sampling. The criteria for selection
were that each subject must have had the Kuhlman-Anderson Intelligence
Test administered to him not more than two years prior to his enroll
ment into the eighth grade of the high school. Each subject in order
to be selected must have had the Otis (Beta) Quick Scoring Mental
Ability Test administered to him in the eighth grade. Each subject
in order to be selected must have shown a difference of ten or more
43
points between the IQ as measured by the Kuhiman—Anderson Test and the
IQ as measured by the Otis Quick Scoring Test.
Making use of the Pearson Product Moment Coefficient of
Correlation method, correlations were computed between the Kuhlman
Anderson IQ’s and the Otis Quick Scoring IQ’s, correlations were
computed between the Kuhiman-Anderson IQ’s and grade point averages
in English, mathematics, social studies and science and correlations
were computed between the Otis Quick Scoring IQ’s and grade point
averages in English, mathematics, social studies and science.
The correlation between the Kuhlman-Anderson Intelligence Test
and the Otis Quick Scoring Mental Ability Test was tested for
significance. The ~ ratio was used to test the significance of the
difference between the correlations involving the Kuhlman-Anderson
Test and grade point averages and correlations involving the Otis
Quick Scoring Test and grade point averages.
An analysis was made of data extracted from the cumulative
records of the subjects that may affect the socio-economic level of
the group.
Summary of related literature.--The primary aim of American
schools is to foster the growth of the children given into their
charge. The literature of educational research is, however, surpris
ingly empty of information on the academic growth of boys and girls
at different times and under different circumstances of schooling.
School personnel would be greatly benefitted by such research. In
working with people, decisions are continually made. All decisions
involve predictions. It would be worthless to know of people’s
44
performance at a given moment if predictions could not be made of
future performances. Predictions can be made from IQ tests because of
the relative stability of IQ’s. The ACE, a long time principal instru
ment used by colleges for measuring scholastic aptitude of entering
freshmen, was replaced by its publishers in 1955, when they introduced
in its place, the School and College Ability Test. The conclusions
were that the best single predictor of how well a student is likely to
succeed in his school work next year is how well he is succeeding this
year, that certain school learned abilities appear to be prerequisites
to the next steps in learning and that it is easier to discuss school
learned abilities with students and parents than characteristics such
as intelligence and mental ability. The intelligence test is often
regarded as an academic achievement test, especially the verbally
oriented ones. It does not measure adequately the original, innate
potential learning capacity of the individual. Some common abilities
are measured by certain general ability tests and these abilities
enter into achievement in certain academic areas. Even though intelli
gence tests appear to be becoming more objectionable on the basis that
they fail to do justice to all of the aspects of human intellect, their
usefulness continues to grow in many applied and research activities.
During the past several years, the largest number of studies pertained
to predictive validity and analysis of test intercorrelations. In an
attempt to predict freshman performance using the CQT and the SCAT,
there was evidence to suggest the greater applicability of the CQT for
the male population and the SCAT for the female population. The low
predictive validities of GRE aptitude scores seem to indicate that this
45
measurement alone is of little value as a predictor of success. The
GRE seemir~gly has little predictive validity for graduate students in
education. Validation data of 32 air force schools indicate that
ability tests measure nearly all the valid variance to be found in
the educational level, variables not accounted for by years of
education. A study to determine the possible effectiveness of using
the ACT tests to supplement or replace the Ohio State Psychological
Examination and the OSU placement tests in the university placement
program revealed that either test could be used with equal effective
ness to select a small, highly promising group of students or a small
group of potentially low students. A battery of aptitude tests was
administered to a group of ninth graders in an experimental modern
algebra course and a group of ninth graders in a traditional algebra
course. The aptitude tests were equally valid in predicting
proficiency in either course. Spacial and mechanical reasoning tests
were more valid for the experimental course than for the traditional
course. There is faii~1y good agreement among workers with psycho
logical and educational tests that:
an “r” from to ±20 denotes indifferent ornegligible relationship.
an “r” from ±20 to ±.4O denotes low correlation;present but slight.
an “r” from ±40 to ±70 denotes substantial or markedrelationship.
an “r” from ±.70 to ±1.00 denotes high to very highrelationship.
Findings.--The following information includes the findings
derived from the research conducted comparing the Kuhiman-Anderson
46
Intelligence Test and the Otis Quick Scoring Mental Ability Test with
grade point averages of thirty tenth grade students. Grade point
averages reported are based upon a four point grading system.
1. The subjects of the investigation were, for the mostpart: members of families where both parents werepresent, offspring of parents who had not completedhigh school, desirous of attending college, andrelatively uncertain about their vocationalaspirations.
2. The mean IQ for the group, as measured by the KuhlmanAnderson Test, was 103.1 with a standard deviation of10.14.
3. The mean IQ for the group, as measured by the OtisQuick Scoring Test, was 85.8 with a standard deviationof 10.68.
4. The correlation between the ICuhiman-Anderson Test IQ’sand the Otis Test IQ’s for the group was .71, computedby the Pearson Product Moment method. This denotedhigh relationship, significant at the .05 level ofconfidence.
5. The mean grade point average for the group in Englishwas 2.16 with a standard deviation of .94.
6. The mean grade point average for the group in mathematics was 2.10 with a standard deviation of .85.
7. The mean grade point average for the group in socialstudies was 2.34 with a standard deviation of .94.
8. The mean grade point average for the group in sciencewas 2.11 with a standard deviation of .91.
9. The “r” between the Kuhiman-Anderson Test and Englishwas .56, indicating marked relationship.
10. The “r” between the Otis Test and English was .83,denoting very high relationship.
11. The “r” between the Kuhlman-Anderson and mathematicswas .45, denoting substantial relationship.
12. The “r” between the Otis Test and mathematics was .67.This indicated marked relationship.

47
13. There was substantial relationship between the KuhimanAnderson Test and social studies, indicated by anof .52.
14. There was high relationship between the Otis Test andsocial studies, indicated by an “r” of .79.
15. An “r” of .44, denoting substantial relationshipbetween the Kuhlman-Anderson Test and science wasestablished.
16. Marked relationship indicated by an “r” of .68 wasdiscovered between the Otis Test and science.
17. The difference between the correlation of the KuhimanAnderson Test and English and the correlation of theOtis Test and English was .56 in favor of the Otis Test,yielding a ~ ratio of 2.04, significant at the .05 levelof confidence.
18. The difference between the correlation involving theKuhiman-Anderson Test and mathematics and the correlation involving the Otis Test and mathematics was .33in favor of the Otis Test, yielding a ~ ratio of 1.20,not significant at the .05 level of confidence.
19. The difference between the correlation involving theKuhlman-Anderson Test and social studies and thecorrelation involving the Otis Test and social studieswas .49 in favor of the Otis Test, yielding a ~ ratioof 1.78, not significant at the .05 level of confidence.
20. The difference between the correlation involving theKuhlman-Anderson Test and science and the correlationinvolving the Otis Test and science was .36 in favor ofthe Otis Test. This yielded a ~ ratio of 1.31 whichwas not significant at the .05 level of confidence.
Conclusions. --The analysis and interpretation of the data
collected for this research would appear to warrant the conclusions
formulated and presented below:
1. The socio-economic conditions in which the subjectsused in this study lived may be described ascharacteristic of the culturally disadvantaged.
2. The high relationship of .71 between the Kuhiman-AndersonIntelligence Test and the Otis Quick Scoring MentalAbility Test appear to indicate that the two testsprobably measure the same things.

48
3. Students generally tend to score higher on the KuhlmanAnderson Test than on the Otis Test.
4. Both tests correlated substantially with the foursubject areas. However, both tests seemed to correlatehigher to the more verbal subject areas such as Englishand social studies.
5. The differences between the correlations of the twotests and subject areas in favor of the Otis Testseemed to indicate that the Otis Test was a better predictor of performance in each of the four subject areas,even though the differences between the correlationsbetween the two tests and subject areas were notstatistically significant in any area except English.
Implications.--The analysis and interpretation of the data in
this research appear to suggest the following implications:
1. The difference between the mean IQ’s, as measured bythe Kuhlman-Anderson Intelligence Test and the OtisQuick Scoring Mental Ability Test, in favor of theKuhlman-Anderson Test probably relates more to theconstruction of the test than to mental ability.
2. School personnel would be justified in expectinghigher IQ’s from students having taken the KuhlmanAnder son Test in the elementary school than fromthose having taken the Otis Quick Scoring Test in thehigh school.
Recommendations. --The following recommendations are made as a
result of the findings, conclusions and implications of this study:
1. That more interaction be exercised between the testingprograms in the elementary schools and the high schools.
2. That there be more consideration given to intelligencetesting by school personnel.
3. That more extended studies are conducted in order tobetter ascertain what common abilities are measuredby the two intelligence tests used by the schools andwhat abilities are not measured by the two instruments.
BIBLIOGRAPHY
Books
Anastasi, Anne. Psychological Testing. New York: The MacmillanCompany, 1961.
Best, John W. Research in Education. Englewood Cliffs, New Jersey:Prentice-Hall, Inc., 1959.
Buros, Oscar Krisen. The Fifth Mental Measurements Yearbook. HighlandPark, New Jersey: The Gryphon Press, 1959.
Cronbach, Lee J. Essentials of Psychological Testing. 2d ed.revised. New York: Harper Brothers, 1960.
Frochlick, Clifford P., and Holt, Kenneth B. Guidance Testing.3rd ed. revised. Chicago: Science Research Associates, Inc.,1959.
Garrett, Henry B. Statistics in Psychology and Education. New York:Longmans, Green and Company, 1958.
Guilford, J. P. Fundamental Statistics in Psychology and Education.New York: McGraw-Hill Book Company, Inc., 1950.
Humphreys, J. Anthony, Traxier, Arthur B., and North, Robert D.Guidance Services. 2d ed. revised. Chicago: Science ResearchAssociates, Inc., 1960.
St. John, Charles W. Educational Achievement in Relation to Intelligence. Cambridge: Harvard University Press, 1930.
Thorndike, Robert L., Hagen, Elizabeth. Measurement and Evaluationin Psychology and Education. 2d ed. revised. New York:John Wiley and Sons, Inc., 1962.
Periodicals
Anderson, S. B., and Maier, N. H. “The Study of Academic Prediction andGrowth,” Journal of Teacher Education, XIV (June, 1963), pp. 212-216.
Borg, Walter R. “GRE Aptitude Scores as Predictors of GPA for GraduateStudents in Education,” Educational and Psychological Measurement,XXIII, No. 2 (1963), p. 379.
49

50
Capps, Marian P., and Decosta, Frank A. “Contributions of the GRE andthe NTE to the Predictions of Graduate School Success,” Journalof Educatioftal Research, L (1957), PP. 383-389.
Doyle, Andrew M. “Some Aspects of Ability and Achievement in High SchoolGirls,” Educational Research Monographs, VIII, No. 2 (1952), p.27.
Juola, Arvo E. “Predictive Validity of Five College-Level AcademicAptitude Tests at One Institution,” The Personnel and GuidanceJournal, XXXVIII (April, 1960), pp. 637-641.
Osburn, H. G. and Melton, R. S. “Prediction of Proficiency in a Modernand Traditional Course in Beginning Algebra,” Educational andPsychological Measurement, XXIII, No. 2 (1960), p. 277.
Peters, Frank R., Plog, Eugenia L. “The Effectiveness of the ACT forSelection and Placement at the Ohio State University,” EducationalResearch Bulletin, XL (1961), pp. 232-252.
Stalnaker, Elizabeth M. “A Basis for Guidance on the Junior High SchoolLevel,” Journal of Experimental Education, XX (September, 1950),pp. 41-46.
Wallen, Norman E. “Development and Application of Tests of General Mental Ability,” Review of Educational Research, XXXII (February,1962), pp. 5-22.
Zachert, Virginia, and Levine, Abraham. “Education and Prediction ofMilitary School Success,” Journal of Applied Psychology, XXXVI(1952), pp. 266-268.
Reports
Shearouse, H. S. “Introduction,” Guidance for Georgia Schools.State Department of Education, Atlanta (1963).
Unpublished Materials
Conway, Sister Madona Theresa. “The Relationship of the Graduate RecordExamination Results to Achievement in the Graduate School at theUniversity of Detroit.” Unpublished Master’s thesis, Departmentof Education, University of Detroit, 1955.
VITA
Eugene B. Wimby, Sr.
Education: Elementary and high school education, AtlantaPublic Schools, Atlanta, Georgia. ClarkCollege, 1945-49, B..A., (Business Administration and Secondary Education). NDEA Counselingand Guidance Institute, Atlanta University,1962-63.
Experience: Classroom teacher, Commercial subjects,B. T. Washington High School, Atlanta,Georgia, 1949-62. Counselor,B. T. WashingtonHigh School, Atlanta, Georgia, 1963-65.Project Counselor, Neighborhood Youth Corp,Atlanta-Fulton County Boards of Education, 1965.
Personal Information: Born December 27, 1927, Atlanta, Georgia.Married. Father of daughter 11 and son 3.Member of First Congregational Church, Atlanta,Georgia.
51