preface - bnm.gov.my · this financial stability review provides bank negara malaysia’s...
TRANSCRIPT

This Financial Stability Review provides Bank Negara Malaysia’s assessment on current and potential risks to financial stability and the resilience of the Malaysian financial system to sustain its financial intermediation role in the economy. It also reports on any actions that have been taken to manage risks to financial stability and contains box article(s) on topics of special interest.
This publication is intended to promote greater awareness on issues and developments affecting financial stability.
This document uses data available up to 30 June 2019, unless otherwise stated.
The Financial Stability Review is available in PDF format at www.bnm.gov.my
Preface


4 Key Highlights
7 Overview
Risk Developments and Assessment of Financial Stability
11 Credit Risk
23 Market Risk
24 Liquidity and Funding Risk
27 Contagion Risk
Financial Institution Soundness and Resilience
29 Resilience and Performance of the Banking Sector
31 Resilience and Performance of the Insurance and Takaful Sector
Box Articles
35 MalaysianBanks’Profitability–PastTrendsandFutureProspects
44 EnhancingtheFinancialSector’sCyberSecurityintheDigitalEconomy
47 Annex
51 Glossary, Acronyms and Abbreviations
Contents
Key Highlights onFinancial Stability Review – First Half 2019
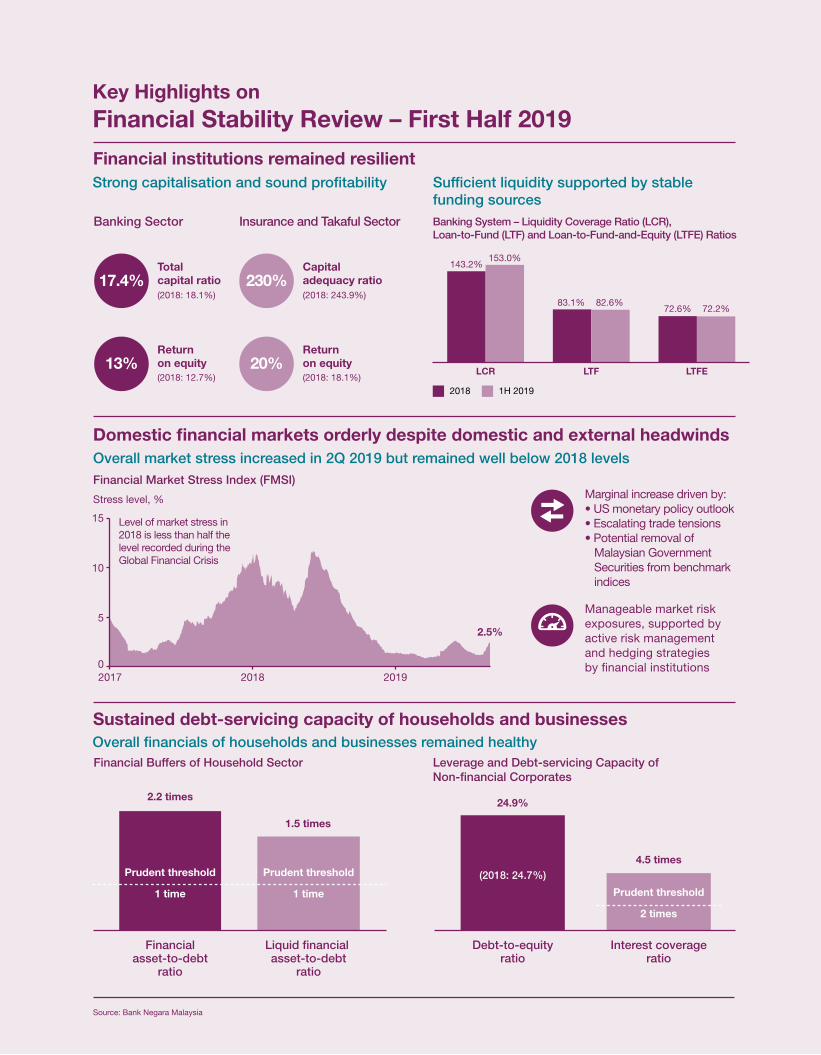
Financial institutions remained resilient
Domestic financial markets orderly despite domestic and external headwinds
Sustained debt-servicing capacity of households and businesses
Insurance and Takaful Sector
Return on equity(2018: 18.1%)
Return on equity (2018: 12.7%)
Banking Sector
LCR
143.2%153.0%
83.1% 82.6%72.6% 72.2%
LTF LTFE
Banking System – Liquidity Coverage Ratio (LCR), Loan-to-Fund (LTF) and Loan-to-Fund-and-Equity (LTFE) Ratios
Strong capitalisation and sound profitability Sufficient liquidity supported by stable funding sources
Overall market stress increased in 2Q 2019 but remained well below 2018 levels
Stress level, %
15
2017 2018 2019
2.5%
10
5
0
Financial Market Stress Index (FMSI)
Financial Buffers of Household Sector Leverage and Debt-servicing Capacity of Non-financial Corporates
Financialasset-to-debt
ratio
Debt-to-equityratio
2.2 times 24.9%
1.5 times
4.5 times
Liquid financial asset-to-debt
ratio
Interest coverageratio
Overall financials of households and businesses remained healthy
Source: Bank Negara Malaysia
Capital adequacy ratio(2018: 243.9%)
Total capital ratio(2018: 18.1%)
17.4% 230%
20% 13%
2018 1H 2019
Marginal increase driven by:• US monetary policy outlook• Escalating trade tensions• Potential removal of
Malaysian Government Securities from benchmark indices
Manageable market risk exposures, supported by active risk management and hedging strategies by �nancial institutions
Prudent threshold
1 time
Prudent threshold
1 time Prudent threshold
2 times
(2018: 24.7%)
Level of market stress in 2018 is less than half the level recorded during the Global Financial Crisis

Key Highlights onFinancial Stability Review – First Half 2019
Financial institutions remained resilient
Domestic financial markets orderly despite domestic and external headwinds
Sustained debt-servicing capacity of households and businesses
Insurance and Takaful Sector
Return on equity(2018: 18.1%)
Return on equity (2018: 12.7%)
Banking Sector
LCR
143.2%153.0%
83.1% 82.6%72.6% 72.2%
LTF LTFE
Banking System – Liquidity Coverage Ratio (LCR), Loan-to-Fund (LTF) and Loan-to-Fund-and-Equity (LTFE) Ratios
Strong capitalisation and sound profitability Sufficient liquidity supported by stable funding sources
Overall market stress increased in 2Q 2019 but remained well below 2018 levels
Stress level, %
15
2017 2018 2019
2.5%
10
5
0
Financial Market Stress Index (FMSI)
Financial Buffers of Household Sector Leverage and Debt-servicing Capacity of Non-financial Corporates
Financialasset-to-debt
ratio
Debt-to-equityratio
2.2 times 24.9%
1.5 times
4.5 times
Liquid financial asset-to-debt
ratio
Interest coverageratio
Overall financials of households and businesses remained healthy
Source: Bank Negara Malaysia
Capital adequacy ratio(2018: 243.9%)
Total capital ratio(2018: 18.1%)
17.4% 230%
20% 13%
2018 1H 2019
Marginal increase driven by:• US monetary policy outlook• Escalating trade tensions• Potential removal of
Malaysian Government Securities from benchmark indices
Manageable market risk exposures, supported by active risk management and hedging strategies by �nancial institutions
Prudent threshold
1 time
Prudent threshold
1 time Prudent threshold
2 times
(2018: 24.7%)
Level of market stress in 2018 is less than half the level recorded during the Global Financial Crisis
Asset quality in the banking system remained intactSound risk management practices havekept impairment levels low
Supported by strong buffers to absorbpotential future losses
Enhancing the Financial Sector’s Cyber Security in the Digital EconomyNational-level cyber security coordination is vital to manage cyber security in a cohesive,coherent and comprehensive manner
A confluence of cyclical and structural factors is expected to influence banks’ profitabilitymoving forward
Key Highlights onBox Articles
Source: Bank Negara Malaysia
0
1
2
3
4
1Q 2Q 3Q 4Q 1Q 2Q 3Q 4Q 1Q 2Q
Gross IL ratio: BusinessGross IL ratio: Household
Gross IL ratio: SMEsNet IL ratio
%
2017 2018 2019
126.9%Loan loss coverage ratio
RM103.3 billionExcess capital1
1 Excess capital refers to total capital above the regulatory minimum, which includes the capital conservation buffer requirement for 2019 (2.5%) and bank-speci�c higher minimum requirements
Moderate economic andcredit growth
Intensified competitionin funding and
lending activities
Disruptions to business model due totechnological advances
Disintermediation risk withgreater customer mobility
Banks are well-positioned to capitalise on these developments, supported by strong �nancial buffers,high level of public con�dence and investments to increase technological agility
Establish and strengthen existing guidancearound cyber security and risk management
Identify and reduce barriers toeffective information sharing on
cyber threats across sectors
Build a common understanding of cyber-relatedterminology at the national level
Strengthen the collective capabilities of institutionsand authorities to detect, respond to and recover fromcyber incidents
Sustained and strategic focus on deepeningthe pool of domestic talent
Effective engagements across agencies to supportinvestigation and enforcement action
Malaysian Banks’ Profitability – Past Trends and Future Prospects
Banking System – Impaired Loans (IL) Ratio by Sector


7Financial Stability Review - First Half 2019
Global financial vulnerabilities remained elevated in the first half of 2019, on concerns of slower global growth and rising geopolitical tensions which contributed to increased volatility in financial asset and commodity prices. Concerns on high corporate debt, particularly in advanced economies, have increased amid continued expansion in leveraged loans. On the back of these developments, major central banks have signalled a more dovish monetary policy stance. The US Federal Open Market Committee (FOMC) cut its policy rate for the first time since the global financial crisis citing concerns over the global economy, while the European Central Bank announced that it stands ready to deliver further monetary stimulus to the euro area. Central banks in emerging market economies, including those in the region, have also reduced policy rates as the effect of escalating trade tensions weighed on growth prospects.
Domestic financial stability continued to be supported by relatively resilient economic growth in the first half of 2019. Despite some volatility in financial markets due to both global and domestic developments, including concerns over the possible removal of Malaysian Government Securities (MGS)from the FTSE Russell World Government Bond Index (WGBI), orderly conditions were preserved. Strong domestic institutional investors, including financial institutions, have continued to be an important source of stability to the domestic markets during periods of heavy portfolio outflows. This in turn has supported stable domestic funding conditions for financial intermediation activities.
The Financial Stability Committee of the Bank remained vigilant over risks from rising private sector debt levels and imbalances in the property market. Aggregate household debt levels remain elevated. However, most households continue to be able to comfortably service their debt with aggregate households’ holdings of financial assets continuing to expand faster than that of debt. Although risks have somewhat increased among housing loan borrowers that are more exposed to income variability, these remain contained given the low exposures of banks to higher-risk borrowers as a result of sound lending practices.
Some signs of recovery have been observed in the property market, with higher transactions recorded in both the residential and non-residential segments. House prices continued to expand at a more moderate pace amid sustained demand for affordable properties. Ongoing adjustments to business strategies by property developers should help to reduce housing demand and supply mismatches, thereby mitigating risks of a broad-based decline in house prices. The oversupply of office space and shopping complexes (OSSC) has however continued to persist.
The financial performance of businesses weakened slightly on lower earnings in the plantation, transportation, and building and construction materials sectors. Notwithstanding this, the overall debt-servicing capacity of firms remains reasonably healthy with corporate leverage generally within prudent levels. Some positive signs were observed for firms in the oil and gas (O&G), construction and real estate
Overview

8 Financial Stability Review - First Half 2019
• Softpropertymarketconditions Unsold housing units are expected to remain
elevated, particularly in the high-rise and higher-priced segments. While risks of a large and broad-based decline in house prices are mitigated by firm demand for affordable housing, a prolonged weakness in the residential property market could reduce further investments in this sector. In the non-residential property segment, the large incoming supply of OSSC could continue to pose challenges for investors and developers. While direct exposures of financial institutions are contained, these risks could indirectly impact financial stability.
• Elevatedlevelofhouseholddebt Although growth in household debt has
moderated in recent years, some households could continue to face increasing stress, particularly if they are over-extended from easier lending conditions in the past. Overall household resilience continues to be firmly supported by stable labour market conditions. However, unexpected severe income shocks could erode household financial buffers and impact spending and future borrowings. This in turn could hurt the financial performance of banks and the economy more broadly.
• Exposuretocyberrisks The rapid digitalisation of the financial
sector inherently increases financial institutions’ exposure to cyber-attacks. Such attacks have the potential to cause material disruptions to financial services that can impact the stability and integrity of the financial system. The increasing sophistication of attacks calls for corresponding measures, both at an institution and system-wide levels, to support a financial sector that is both technologically innovative and resilient to cyber threats. These measures will continue to be a key focus of the Bank’s regulatory and supervisory priorities going forward.
sectors despite business conditions that continue to be challenging. While oil prices remained volatile, further deleveraging by firms in the O&G sector has improved their financial positions. Announcements on the resumption of major infrastructure projects and various Government incentives to lower housing costs have also improved the outlook for firms in the construction and real estate sectors. Greater flexibility provided under the Bank’s guidelines on regulatory reporting of rescheduled and restructured (R&R) loans to small and medium enterprises (SMEs) has further supported continued credit supply to viable businesses in a more challenging environment.
The financial sector remained resilient, underpinned by sustained profits and strong capitalisation of the banking, and insurance and takaful sectors. The weaker regional economic environment has put some downward pressure on performance in the overseas operations of domestic banking groups (DBGs). In the insurance and takaful sector, ongoing reforms are contributing to improvements in pricing and persistency. Based on stress tests conducted by the Bank, financial institutions continue to be well-positioned to withstand potential losses even under extreme conditions.
Going forward, several potential sources of risk warrant continued vigilance:
• Weakerglobalgrowthandvolatilecapitalflows Weaker growth prospects compounded by
unexpected changes in the US monetary policy stance, further escalation of trade tensions and a disorderly unfolding of Brexit could heighten global financial volatilities, with implications for the domestic economy and financial conditions. A tightening of market liquidity could increase market fragmentation and drive funding costs higher. Weaker global demand could also further weigh on corporate earnings and investment decisions, although most businesses appear well-placed to adjust to adverse developments given their prudent leverage and healthy buffers.
9Financial Stability Review - First Half 2019
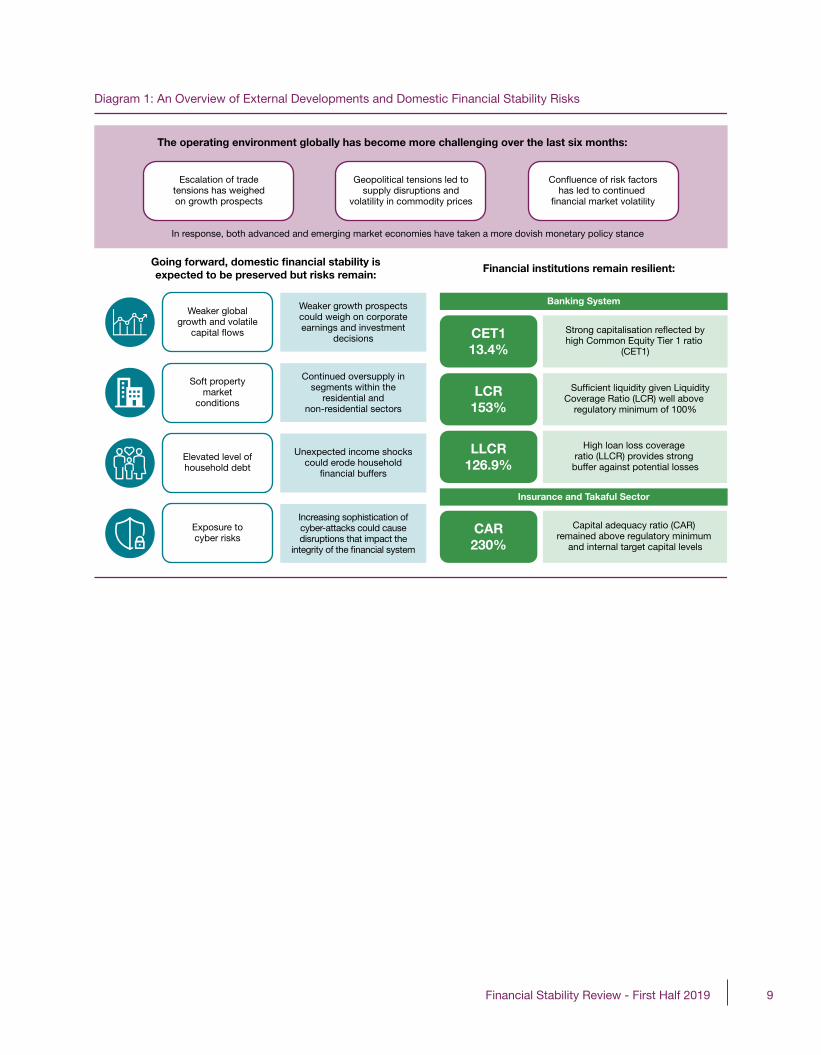
Diagram 1: An Overview of External Developments and Domestic Financial Stability Risks
Going forward, domestic financial stability isexpected to be preserved but risks remain:
Financial institutions remain resilient:
Banking System
Insurance and Takaful Sector
The operating environment globally has become more challenging over the last six months:
In response, both advanced and emerging market economies have taken a more dovish monetary policy stance
Escalation of trade tensions has weighed on growth prospects
Geopolitical tensions led to supply disruptions and
volatility in commodity priceshas led to continued
Weaker global growth and volatile
Weaker growth prospects could weigh on corporate earnings and investment
decisions CET113.4%
high Common Equity Tier 1 ratio (CET1)
LCR153%
Suf�cient liquidity given Liquidity Coverage Ratio (LCR) well above
regulatory minimum of 100%
LLCR126.9%
High loan loss coverage ratio (LLCR) provides strong
buffer against potential losses
CAR230%
Capital adequacy ratio (CAR) remained above regulatory minimum
and internal target capital levels
Soft property market
conditions
Continued oversupply in segments within the
residential and non-residential sectors
Elevated level of household debt
Unexpected income shocks could erode household
Exposure to cyber risks
Increasing sophistication of cyber-attacks could cause disruptions that impact the

10 Financial Stability Review - First Half 2019
11Financial Stability Review - First Half 2019
CREDITRISK
Risks from the Household Sector are Largely Contained, but Some Household Segments Remain Vulnerable to Income Shocks
The annual growth of household debt1 increased2 at a faster rate of 5.1% in the first half of 2019 (Chart 1). The ratio of overall household debt-to-gross domestic product (GDP) correspondingly edged higher to 82.2% as at end-June 2019 (2018: 82%) (Chart 2). Loans for the purchase of residential properties remained the key driver of growth. Household borrowings were also bolstered by strong demand for loans for the purchase of securities, primarily fixed-priced unit trust funds such as AmanahSahamBumiputera. In contrast, growth in household loans for consumption3 has remained modest, mainly driven by personal financing extended to civil servants by development financial institutions (DFIs).
The debt-servicing capacity of households generally remained intact, as reflected in the low and stable impairment and delinquency ratios. For several years now, households’ holdings of financial assets have expanded at a faster pace than that of debt (Chart 3). This continued into 2019 with household savings in deposits and deposit-like instruments increasing more than the decline in households’ equity investments following the weak equity market performance. At the aggregate level, total household assets exceeded debt by 4.1 times (2018: 4.1 times). Excluding housing wealth, household financial assets stood at 2.2 times of debt. Two-thirds of these financial assets are in the form of liquid financial assets (LFA) such as deposits and unit trust funds which can be drawn upon to meet households’ debt obligations and other financial commitments, if the need arises.
Risks to financial stability from the household sector continue to be largely contained, with debt-at-risk (DAR)4 sustained at a low level of 5.2% of total household debt. The share of newly-approved household loans with debt service ratios (DSR)5 exceeding 60% has increased (Chart 4) compared to levels in 2013, suggesting some easing of lending standards. However, this has been mainly evident among higher income households earning more than RM5,000 per month who are more likely to be able to adjust to adverse developments in their financial circumstances.
Exposures of banks and non-bank financial institutions (NBFIs) to the more vulnerable segment (borrowers earning less than RM3,000 per month) have continued to decline (Chart 5). Nonetheless, risks remain elevated among these borrowers. Despite greater constraints on their ability to borrow, the leverage6 of households earning less than RM3,000 per month has continued to rise (1H 2019: 8.9 times; 2018: 8.8 times; 2015: 7.7 times) due to housing loans which have been made more accessible under various loan assistance schemes introduced in recent years. This borrower group remains susceptible to financial distress given their limited financial buffers to weather potential shocks.
1 Extended by banks, development financial institutions and major non-bank financial institutions.
2 The increase was partly due to higher housing loans reported by LembagaPembiayaanPerumahanSektorAwam (LPPSA). Beginning January 2019, LPPSA moved from cash accounting to accrual accounting in line with the change in the Government’s accounting practice for fiscal accounts. This led to a one-off upward revision in the value of LPPSA housing loans reported in 2019.
3 Primarily motor vehicles, personal financing and credit cards.4 The proportion of debt of borrowers with negative financial margin to
total household debt, after taking into account the potential losses given default (refer to Information Box on ‘An Enhanced Financial Margin Framework for the Household Sector’ on page 14).
5 The ratio of total monthly bank and non-bank debt obligations to monthly disposable income (net of statutory deductions).
6 Measured as a ratio of outstanding debt to annual income.
Risk Developments and Assessment of Financial Stability
12 Financial Stability Review - First Half 2019
Default incidents by housing loan borrowers have also increased in recent periods, indicating that more households may be experiencing financial stress. This has been more prevalent among borrowers who (i) obtained housing loans for properties priced above RM500,000 and/or (ii) experience greater variability in their monthly income. Risks to the financial system however remain low as exposures at risk7 of these borrowers accounted for only 6.2% of total household lending with only 0.9% of such loans being classified by banks and DFIs as impaired as at end-June 2019. Based on enrolments into the Credit Counselling and Debt Management Agency’s (AgensiKaunselingdanPengurusanKredit, AKPK) Debt Management Programme, the number of individuals seeking help also increased at a slower pace. Strengthened underwriting and risk management practices of financial institutions further mitigate financial stability risks. Given the significance of household lending as a share of total lending by banks (58.1%), preserving responsible lending standards in the banking system remains important going forward to promote both household resilience and financial stability.
As part of continued efforts to strengthen household resilience, the Bank is also working
with its partners8 under the Financial Education Network (FE Network) to elevate financial literacy levels such that all Malaysians have the capability and confidence to make sound financial decisions. The National Strategy for Financial Literacy 2019 - 2023, which was launched in July 2019, outlines the priorities and actionable plans to equip Malaysians at all levels with the knowledge to manage their financial health in a prudent and responsible manner, in line with their financial goals and circumstances.
The proposed formulation of the Consumer Credit Act (CCA) will further support household resilience through consistent and proportionate standards of protection afforded to borrowers who obtain financing for personal, domestic or household purposes from both banks and non-bank credit providers. This includes requirements to comply with minimum standards relating to unsolicited financing, financing charges, credit assessments, debt collection practices and dispute settlements. Aside from promoting a healthy consumer credit market and ensuring the fair treatment of borrowers, the CCA will also provide for improved coordination arrangements among relevant authorities that are responsible for the oversight of consumer credit activities.
7 Taking into account the potential loss given default (LGD) for these borrowers.
8 FE Network members comprise Bank Negara Malaysia, Securities Commission Malaysia, Ministry of Education Malaysia, Employees Provident Fund, Malaysian Deposit Insurance Corporation, AKPK and Permodalan Nasional Berhad. For more information, refer to https://www.fenetwork.my/.

13Financial Stability Review - First Half 2019
* Residential properties, non-residential properties and securities ** Primarily motor vehicles, personal � nancing and credit cards
Source: Bank Negara Malaysia, Bloomberg, Securities Commission Malaysia and Department of Statistics, Malaysia
Chart 1: Household Sector – Annual Growth of Debt
Growth of household debt increased
Loans for wealth accumulation*
Loans for consumption purposes**
Total debt
Annual change (%)
7.4 5.6
4.9 4.7 5.1
9.8
7.7 6.8 6.9 7.3
3.7 2.1 1.7
0.6 1.0 0
5
10
15
2015 2016 2017 2018 1H 2019
Chart 2: Household Sector – Key Ratios
Higher debt- and financial asset-to-GDP ratios amid slower nominal GDP growth
86.9 86.582.7 82.0 82.2
180.1 178.6 176.5 175.8 177.6
69.7 69.1 66.2 68.0 67.8
0
50
100
150
200
Debt-to-GDP: Total
Financial asset-to-GDP
Debt-to-GDP: Banking system
2017 2018 1H 2019
% of GDP
20162015
Chart 3: Household Sector – Debt and Financial Assets
Household financial assets continued to expand faster than debt
Financial asset-to-debt (RHS) Liquid �nancial asset-to-debt (RHS)
Total debt
Annual change (%) Times
2.1 2.1 2.1 2.1 2.21.4 1.4 1.5 1.4 1.5
7.4
5.64.9
4.7 5.15.2 5.3
8.4
5.1
6.8
0
2
4
6
8
0
2
4
6
8
10
2015 2016 2017 2018 1H 2019
Financial assets
Chart 4: Household Sector – Borrowers with Newly-Approved Loans by DSR
Share of borrowers with DSR exceeding 60% has increased since 2013
78 76 73 71 70
22 24 27 29 30
0
20
40
60
80
100
% share of borrowers
2013 2015 2017 2018 1H 2019
DSR ≤60% DSR >60%
Chart 5: Household Sector – Debt by Monthly Income Group
Exposures to vulnerable borrowers continued to decline% of household debt
22.8 21.9 19.9 19.3 18.5
21.9 21.5 20.7 20.5 20.2
24.1 25.1 26.3 27.5 28.2
31.2 31.5 33.1 32.7 33.1
0
20
40
60
80
100
2015 2016 2017 2018 1H 2019
<RM3,000 RM3,000-5,000 RM5,000-10,000 >RM10,000

14 Financial Stability Review - First Half 2019
AnEnhancedFinancialMarginFrameworkfortheHouseholdSector
This info box summarises recent enhancements to the financial margin (FM) framework,9 which uses individual-level income and credit information to identify and assess risks to financial stability from the household sector. The motivation for these refinements is twofold – first, to ensure that the components of borrowers’ FM continue to be reflective of their monthly spending and financial obligations, and second, to derive a more plausible estimation of DAR and potential losses to banks.
As evidenced by the high internet penetration rate of 87%10 in 2018, expenditure by households in Malaysia on communication services has become much more of a necessity than a luxury. Therefore, in calculating the FM of an individual borrower, expenditure on communication services, which accounts for about 3% of monthly income, is now included under basic necessities (Diagram 2). Further, recognising the higher living costs in Kuala Lumpur, Selangor, Penang and Johor, the enhanced framework also incorporates higher relative expenditure levels for borrowers in these key states.
9 Financial Stability and Payment Systems Report (2016). ‘Looking Beyond Headline Household Debt Statistics’. Bank Negara Malaysia, page 41-46 and Financial Stability and Payment Systems Report (2017). ‘Indebted to Debt: An Assessment of Debt Levels and Financial Buffers of Households’. Bank Negara Malaysia, page 39-48.
10 Department of Statistics, Malaysia (2018). ‘ICT Use and Access by Individuals and Households Survey Report’, Putrajaya.
Diagram 2: Enhancement to the Financial Margin Framework
1 Residual monthly disposable income and liquid �nancial assets, after deducting debt repayments and expenditure on basic necessities2 For this study, basic necessities are de�ned as: (i) food and non-alcoholic beverages; (ii) housing rental and maintenance; (iii) water, electricity, gas and other fuels; (iv) transportation; (v) education; (vi) healthcare; and (vii) communication services3 The proportion of debt of borrowers with negative FM to total household debt after taking into account the potential LGD Source: Bank Negara Malaysia
1
Sensitivity Analysis on Individual Borrowers
Stress Scenarios
3
Enhancement
2
↑↑
↑
Assessment on Borrower’s Debt Repayment CapacityUsing Financial Margin1 Approach
FinancialMargin
(FM)
PersonalDisposable
Income
MonthlyDebt
Obligations
Expenditureon Basic
Necessities2
LiquidFinancialAssets
Baseline ScenarioDefault when FM<0
income(10%)
cost of living (20%)
borrowing cost (50 basis points)
Debt-at-Risk3
Potential Losses toFinancial Institutions
Inclusion of expenditure on communication services (mainly phone and internet services) as part of basic necessities.
Expenditures of borrowers who live in the key states adjusted to re�ect higher average expenditure.
Revision of loss given default (LGD), in line with past experience of banks in default loan recovery.
15Financial Stability Review - First Half 2019
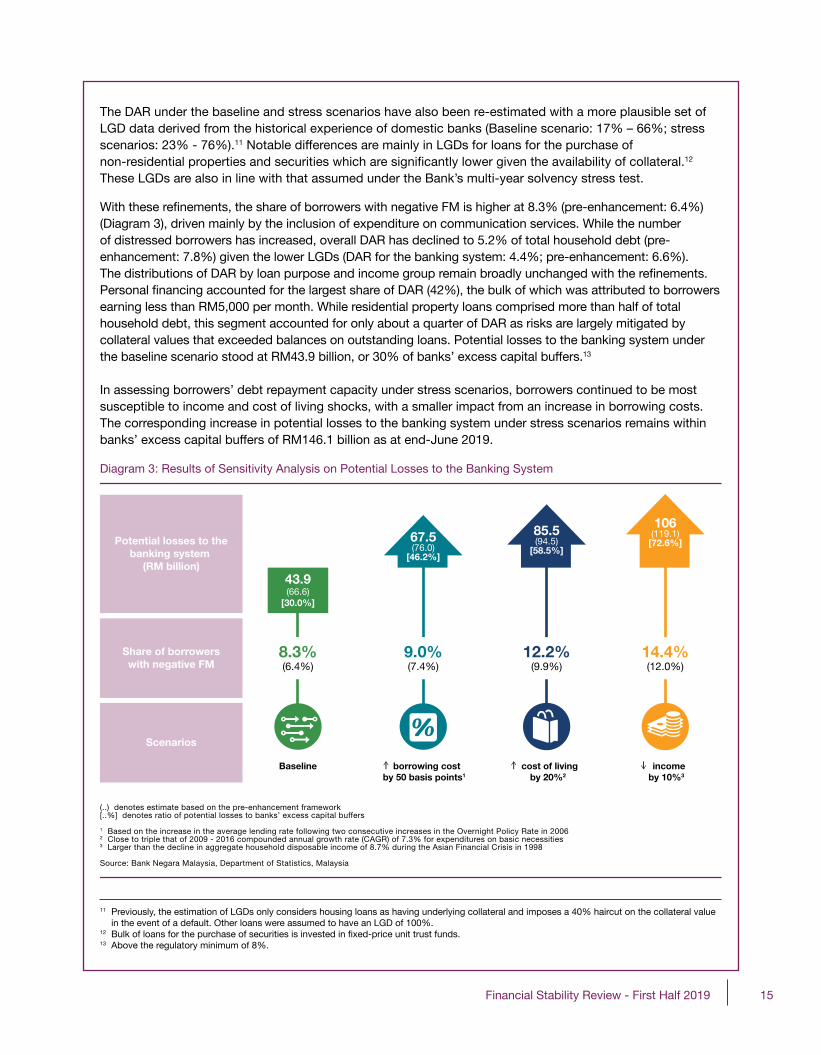
The DAR under the baseline and stress scenarios have also been re-estimated with a more plausible set of LGD data derived from the historical experience of domestic banks (Baseline scenario: 17% – 66%; stress scenarios: 23% - 76%).11 Notable differences are mainly in LGDs for loans for the purchase of non-residential properties and securities which are significantly lower given the availability of collateral.12 These LGDs are also in line with that assumed under the Bank’s multi-year solvency stress test.
With these refinements, the share of borrowers with negative FM is higher at 8.3% (pre-enhancement: 6.4%) (Diagram 3), driven mainly by the inclusion of expenditure on communication services. While the number of distressed borrowers has increased, overall DAR has declined to 5.2% of total household debt (pre-enhancement: 7.8%) given the lower LGDs (DAR for the banking system: 4.4%; pre-enhancement: 6.6%). The distributions of DAR by loan purpose and income group remain broadly unchanged with the refinements. Personal financing accounted for the largest share of DAR (42%), the bulk of which was attributed to borrowers earning less than RM5,000 per month. While residential property loans comprised more than half of total household debt, this segment accounted for only about a quarter of DAR as risks are largely mitigated by collateral values that exceeded balances on outstanding loans. Potential losses to the banking system under the baseline scenario stood at RM43.9 billion, or 30% of banks’ excess capital buffers.13
In assessing borrowers’ debt repayment capacity under stress scenarios, borrowers continued to be most susceptible to income and cost of living shocks, with a smaller impact from an increase in borrowing costs. The corresponding increase in potential losses to the banking system under stress scenarios remains within banks’ excess capital buffers of RM146.1 billion as at end-June 2019.
11 Previously, the estimation of LGDs only considers housing loans as having underlying collateral and imposes a 40% haircut on the collateral value in the event of a default. Other loans were assumed to have an LGD of 100%.
12 Bulk of loans for the purchase of securities is invested in fixed-price unit trust funds.13 Above the regulatory minimum of 8%.
Diagram 3: Results of Sensitivity Analysis on Potential Losses to the Banking System
8.3%(6.4%)
43.9(66.6)
[30.0%]
67.5(76.0)
[46.2%]
85.5(94.5)
[58.5%]
106(119.1)
[72.6%]
9.0%(7.4%)
12.2%(9.9%)
14.4%(12.0%)
Potential losses to thebanking system
(RM billion)
Share of borrowerswith negative FM
Scenarios
Baseline borrowing cost by 50 basis points1
cost of living by 20%2
income by 10%3
(..) denotes estimate based on the pre-enhancement framework[..%] denotes ratio of potential losses to banks’ excess capital buffers 1 Based on the increase in the average lending rate following two consecutive increases in the Overnight Policy Rate in 20062 Close to triple that of 2009 - 2016 compounded annual growth rate (CAGR) of 7.3% for expenditures on basic necessities3 Larger than the decline in aggregate household disposable income of 8.7% during the Asian Financial Crisis in 1998 Source: Bank Negara Malaysia, Department of Statistics, Malaysia
16 Financial Stability Review - First Half 2019
Demand for Affordable Housing Remains Strong, Amid Continued Imbalances in Some Segments of the Property Market
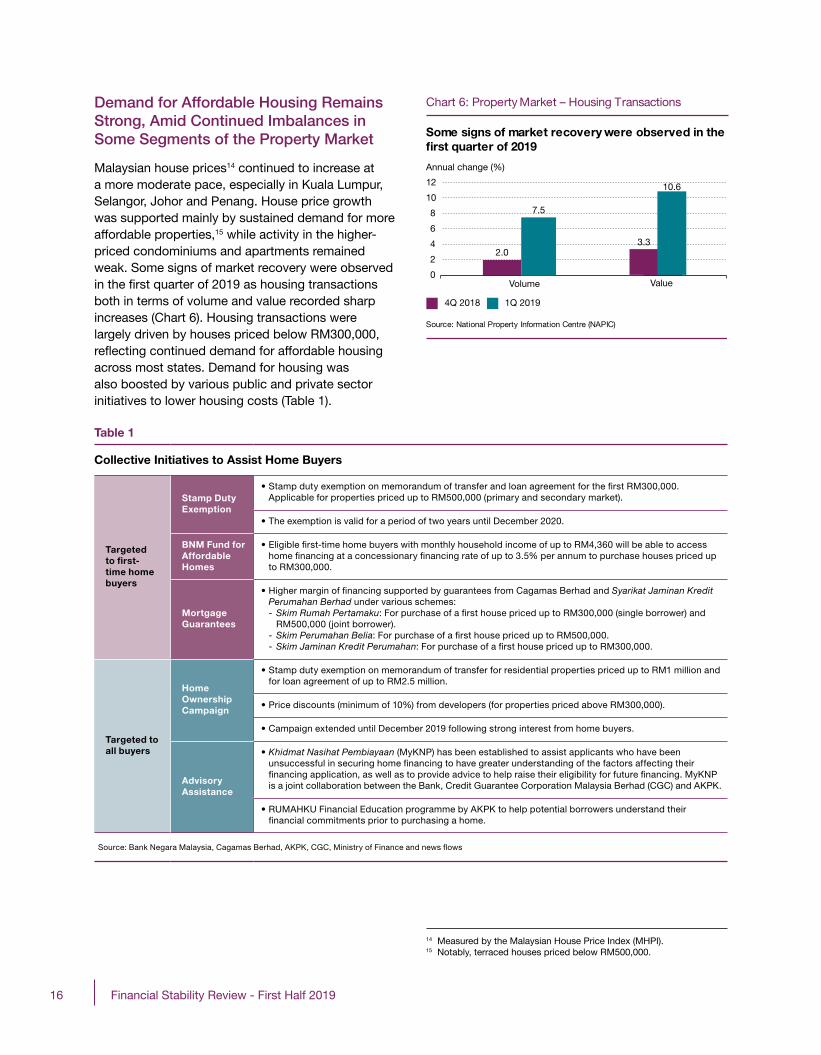
Malaysian house prices14 continued to increase at a more moderate pace, especially in Kuala Lumpur, Selangor, Johor and Penang. House price growth was supported mainly by sustained demand for more affordable properties,15 while activity in the higher-priced condominiums and apartments remained weak. Some signs of market recovery were observed in the first quarter of 2019 as housing transactions both in terms of volume and value recorded sharp increases (Chart 6). Housing transactions were largely driven by houses priced below RM300,000, reflecting continued demand for affordable housing across most states. Demand for housing was also boosted by various public and private sector initiatives to lower housing costs (Table 1).
14 Measured by the Malaysian House Price Index (MHPI). 15 Notably, terraced houses priced below RM500,000.
Table 1
Collective Initiatives to Assist Home Buyers
Targeted to fi rst-time home buyers
Stamp Duty Exemption
• Stamp duty exemption on memorandum of transfer and loan agreement for the � rst RM300,000. Applicable for properties priced up to RM500,000 (primary and secondary market).
• The exemption is valid for a period of two years until December 2020.
BNM Fund for Affordable Homes
• Eligible � rst-time home buyers with monthly household income of up to RM4,360 will be able to access home � nancing at a concessionary � nancing rate of up to 3.5% per annum to purchase houses priced up to RM300,000.
Mortgage Guarantees
• Higher margin of � nancing supported by guarantees from Cagamas Berhad and Syarikat Jaminan Kredit Perumahan Berhad under various schemes:- Skim Rumah Pertamaku: For purchase of a � rst house priced up to RM300,000 (single borrower) and RM500,000 (joint borrower).- Skim Perumahan Belia: For purchase of a � rst house priced up to RM500,000.- Skim Jaminan Kredit Perumahan: For purchase of a � rst house priced up to RM300,000.
Targeted to all buyers
Home Ownership Campaign
• Stamp duty exemption on memorandum of transfer for residential properties priced up to RM1 million and for loan agreement of up to RM2.5 million.
• Price discounts (minimum of 10%) from developers (for properties priced above RM300,000).
• Campaign extended until December 2019 following strong interest from home buyers.
Advisory Assistance
• Khidmat Nasihat Pembiayaan (MyKNP) has been established to assist applicants who have been unsuccessful in securing home � nancing to have greater understanding of the factors affecting their � nancing application, as well as to provide advice to help raise their eligibility for future � nancing. MyKNP is a joint collaboration between the Bank, Credit Guarantee Corporation Malaysia Berhad (CGC) and AKPK.
• RUMAHKU Financial Education programme by AKPK to help potential borrowers understand their � nancial commitments prior to purchasing a home.
Source: Bank Negara Malaysia, Cagamas Berhad, AKPK, CGC, Ministry of Finance and news � ows
Some signs of market recovery were observed in thefirst quarter of 2019
Chart 6: Property Market – Housing Transactions
Source: National Property Information Centre (NAPIC)
2.0 3.3
7.5
0
2
4
6
8
10
12
Volume
4Q 2018
3.3
10.6
Value
1Q 2019
Annual change (%)
17Financial Stability Review - First Half 2019
Importantly, prospective homebuyers are receiving financial advice and assistance through AKPK’s RUMAHKU online financial education programme. The aim is to help them evaluate their financial commitments and ability to undertake new financial obligations prior to purchasing their first home. In the first six months of 2019, more than 12,000 participants have completed the programme. One in seven participants who completed the programme decided not to proceed with immediate plans to buy a house after considering their capacity to afford the long-term financial commitment. Home purchasing decisions that are better informed, in turn, will provide stronger underpinnings for a sustainable housing market.
Despite evidence of genuine demand, official data and engagements with industry players suggest a continued mismatch between supply and demand for housing. This is expected to persist at least in the near- to medium-term given generally inelastic housing supply conditions, especially in urban centres. As at end-March 2019, total unsold housing units16 rose further to 177,200 units (2018: 168,261 units), with 73% of the unsold properties priced above the maximum affordable house price.17 Housing units priced above RM300,000 continued to form the bulk of new launches, adding to the supply and demand mismatch. Continued strong demand for properties in the affordable segment and the gradual rebalancing of new launches by property developers towards properties priced below RM500,000 should however mitigate risks of a sharp and broad-based decline in house prices. Banks’ exposures to property developers with unsold housing units remained small at 2.0% of total banking system loans and 2.9% of holdings of corporate bonds and sukuk. Of this, exposures to loans classified as underperforming or impaired18 remain insignificant at 0.1% of total banking system loans.
In the non-residential segment, market activity picked up further in the first quarter. The number of commercial properties transacted increased by 25.1% (4Q 2018: 16.3%), attributed to higher transactions for shops especially in non-key
states. Overall transaction value, however, declined by 25.9% (4Q 2018: 6.7%), reflecting lower average transacted prices for leisure and other commercial properties.19
Oversupply conditions in the OSSC segment have continued to persist
Oversupply conditions in the OSSC segment have continued to persist. The incoming supply of office space in the Klang Valley remained sizeable at 36.3 million square feet. On average, 4.4 million square feet per annum is expected to be added to the market between 2019 and 2021. This is significantly higher than the average annual demand of 2.3 million square feet per annum over the past three years. Generous incentives, including longer rent holidays and rental discounts, remained a prominent feature of tenancy negotiations and will likely depress effective rental rates further. Meanwhile, the number of incoming shopping complexes in key states stood at 140 units, amounting to 67.8 million square feet of new retail space. With vacancy rates for OSSC and retail space per capita in major cities in Malaysia already much higher than regional peers (Chart 7), the risk of a downward adjustment to prices of retail and office space remains elevated despite observations of higher transacted prices in the first quarter. Banks’ exposures to the OSSC segment account for only 3.4% of total outstanding loans and 4.6% of holdings of corporate bonds and sukuk, and continue to be largely performing. However, broader spillovers to the economy from a prolonged weakness in the commercial property market could transmit higher risks to the financial system.
16 Refers to unsold properties that have been completed (overhang) and unsold properties currently under construction. These properties encompass all residential properties as well as serviced apartments and small office home office (SOHO).
17 Derived using the Housing Cost Burden Approach, in which a house is deemed affordable if the monthly housing repayment cost does not exceed 30% of household income. Estimates are based on unsold units considered not affordable to households of the respective states given their prevailing household income. Excludes Putrajaya and Labuan.
18 Based on Malaysian Financial Reporting Standards (MFRS) 9 classification.
19 Other commercial properties include land.

18 Financial Stability Review - First Half 2019
As at end-June 2019, financial institutions’ total exposures to property expanded at a slower rate of 5.7% (2018: 6.6%), in line with softer conditions in the property market (Chart 8). Demand for home financing continued to support overall credit growth, with significantly stronger growth recorded in financing applications for residential properties priced below RM1 million (1H 2019: 12.7%; 2018: 1.3%). In the first six months of 2019, a total of RM78.5 billion of new housing loans were approved to more than 180,000 borrowers. Of this, 44% were to first-time home buyers. The growth of bank financing in the non-residential property segment meanwhile increased by 2.7% as at end-June 2019 (2018: 2.3%), driven largely by end-financing for the purchase of shops and shopping complexes. Banks however have continued to remain cautious in lending to the OSSC segment, as reflected in declining loan approval rates.
Chart 8: Property Market – Financial Institutions' Exposures to the Property Market
Source: Bank Negara Malaysia
%
65%75%
23%
50%
25%
0
20
40
60
80
100
Banks Development �nancialinstitutions
Insurers and takafuloperators
RM902.1 billion RM16.0 billion RM12.9 billion
End-financing for residential properties
Working capital for constructionand development of properties
Corporate bonds / sukuk issuedby property developers, held byfinancial institutions
End-financing for non-residentialproperties
Bridging financing for construction anddevelopment of properties
Investment in properties
Financial institutions’ exposures are mostly related to end-financing for the purchase of residential and non-residential properties
Chart 7: Property Market – Vacancy Rates for Prime Of�ce and Retail Space, and Prime Retail Space per Capita in Key States
Higher vacancy rates and prime retail space per capita for key states compared to regional cities
Source: Colliers, Cushman and Wake�eld, Jones Lang LaSalle, Jones Lang Wootton, Knight Frank, Savills, United Nations, Department of Statistics, Malaysia and Bank Negara Malaysia estimates
Johor Johor
Prime retail space
Vacancy Rate (%)
KlangValley
KlangValley
KlangValley
Prime retail space
PulauPinang
Regionalcities
Regionalcities
PulauPinang
Regionalcities
Retail Space per Capita(Square Feet)
Prime office space
Notes:i. Data are as at 1Q 2019ii. Retail space refers to shopping complexesiii. Regional cities for prime of�ce space data refer to Bangkok, Beijing, Hong Kong, Manila, Seoul, Shanghai and Singaporeiv. Regional cities for prime retail space data refer to Bangkok, Hanoi, Ho Chi Minh, Jakarta, New Delhi, Shanghai and Singaporev. Regional cities’ and Malaysia’s key cities’ population estimates are as of 2018
25.3
7.2
11.5
29.4
18.0
8.5
3.9
6.0 5.9
3.1

19Financial Stability Review - First Half 2019
20 Refers to 50% earnings shock on large corporate borrowers in the property sector and 50% decline in property prices.
Risks from property sector remain contained, underpinned by sound lending practices
Sound lending practices of banks continue to mitigate risks from potential adverse developments in the property market. Overall, the loan impairment ratio for the purchase of residential and non-residential properties remained low (Chart 9). Of note, a significant share (83%) of residential property loans is extended to owner-occupiers who have a stronger incentive to maintain loan repayments compared to investors. This further reduces financial stability risks in the unlikely event of a generalised downward correction in house prices. Furthermore, 69% of outstanding housing loans have a loan-to-value ratio of less than 80%, thus providing a buffer against potential losses from defaults in the event of an adverse price correction. While risks remain elevated in the non-residential property segment, banks have similarly strengthened credit risk management standards which include, among others, more robust assessments on the viability of property development projects and the financial strength of property developers. Based on the Bank’s sensitivity analysis, banks continue to maintain sufficient capital buffers to absorb 1.5 times the potential losses under severe stress scenarios20 which also incorporate potential spillovers to other economic sectors that are highly dependent on the performance of the property sector.
Risks from Corporate Sector Contained, Despite More Challenging Business Conditions
As at end-June 2019, aggregate non-financial corporate (NFC) debt expanded at a more moderate annual growth rate of 3.6% to RM1,508.8 billion or 102% of GDP (Chart 10). This reflected higher business loan repayments amid more uncertain economic conditions and lower bond issuances following the rationalisation of public infrastructure projects by the Government. Financing growth was largely underpinned by sustained business activity in the construction, manufacturing, and wholesale and retail trade sectors.
Total loan repayments by businesses grew by 2.6% year-on-year to RM393.6 billion in the first half of 2019 (1H 2018: 3.9%; RM383.7 billion), outpacing overall loans disbursed which increased by 0.3% year-on-year to RM391.1 billion (1H 2018: 5.4%; RM390 billion). The slower growth in loans disbursed also reflected
Quality of residential and non-residential propertyloans remained sound
Chart 9: Property Market – Loan Impairment Ratios for End-Financing by Segment
%
1.1 1.11.4 1.4
2.0
0.0
0.5
1.0
1.5
2.0
Residentialproperty
Non-residentialproperty
OSSC
2018 Jun’19
Source: Bank Negara Malaysia
2.1
Chart 10: Business Sector – Non-Financial Corporate Debt-to-GDP Ratio
Debt growth was sustained by domestic borrowings
Domestic loans/�nancing Domestic corporate bonds/sukuk
External debt
Note: Re�ects a higher nominal GDP, following the rebasing of GDP from 2010=100 to 2015=100; NFC debt-to-GDP ratio for December 2018 was 103.7% as reported in the FSPSR 2018
Source: Bank Negara Malaysia
020406080
100120140
Dec 1998 Dec 2018 Jun 2019
% of GDP
131.7
103.0 102.0
lower demand for financing corroborated by the lower applications received, including from SMEs. Looking ahead, banks remain reasonably optimistic on their growth in business loans for 2019, although they are expecting growth to be slightly slower than initially projected. The overall business loan approval rate has remained stable at around 83%, trending close to its five-year average. A modest tightening of credit conditions has been observed in recent quarters, but this has been mostly limited to sectors with relatively weak credit risk outlook, such as the real estate and O&G sectors.

20 Financial Stability Review - First Half 2019
NFC external debt, which accounted for a quarter of total NFC debt and GDP, respectively grew at a slower pace of 2.9% in the first half of the year (2018: 7.5%) primarily driven by intercompany loans taken by multinational corporations in the services and O&G-related sectors. Risks from NFC external debt remained largely contained, given
that three-quarters of external borrowings are of medium- to longer-term tenures and largely hedged against currency exposures. In addition, about half of the exposures are in the form of intercompany loans which are typically accorded flexible or concessionary terms, and trade credit facilities which are backed by export receivables, further mitigating repayment and rollover risks.
ExpansionofFinancialPerformanceDataCoverageofNFCs
The Bank’s coverage of the financial performance of NFCs has been expanded in this update to include all listed firms on Bursa Malaysia (Bursa). Previously, the coverage only encompassed the top 120 companies (excluding financial institutions) which accounted for about 85% of Bursa’s market capitalisation. The inclusion of smaller firms in the dataset has resulted in a lower aggregate debt-servicing capacity of businesses as these smaller firms typically have lower earnings, although they are also less leveraged. The aggregate liquidity position of businesses (as measured by the median cash-to-short-term debt ratio, CASTD) was also lower under the expanded dataset, reflecting the higher dependency of smaller firms on shorter-term financing (Chart 11). The median CASTD of firms under the expanded dataset has however remained in line with its five-year average.
Chart 11: Business Sector – Comparison of Leverage, Debt-Servicing Capacity and Liquidity Indicators with Expanded Dataset
Larger publicly listed firms typically have relatively higher leverage but stronger debt-servicing capacity and liquidity positions
7.4
4.5
1.30.9
51.4
24.9
0
2
4
6
8
10
12
0
10
20
30
40
50
60
Top 120 publicly listed �rms Overall publicly listed �rms
Interest coverage ratio (RHS) Cash-to-short-term debt ratio (RHS)
Debt-to-equity ratio
Times%
Note: Prudent thresholds for ICR and CASTD are two times and one time, respectively
Source: S&P Capital IQ and Bank Negara Malaysia estimates

21Financial Stability Review - First Half 2019
On aggregate, the financial position of NFCs weakened slightly during the first half of 2019 (Chart 12) amid more challenging business conditions. Financial indicators of business health saw some deterioration, partly due to adjustments under new financial reporting standards.21 This largely affected firms in the telecommunication, aviation and utilities sectors. Although overall operating margin improved slightly, lower earnings were observed in a few sectors. Firms in the plantation sector were affected by the decline in crude palm oil prices. Meanwhile, those in the transportation, and building and construction materials sectors reported lower earnings due to higher operating costs and weaker demand for raw materials amid soft property market conditions, respectively.
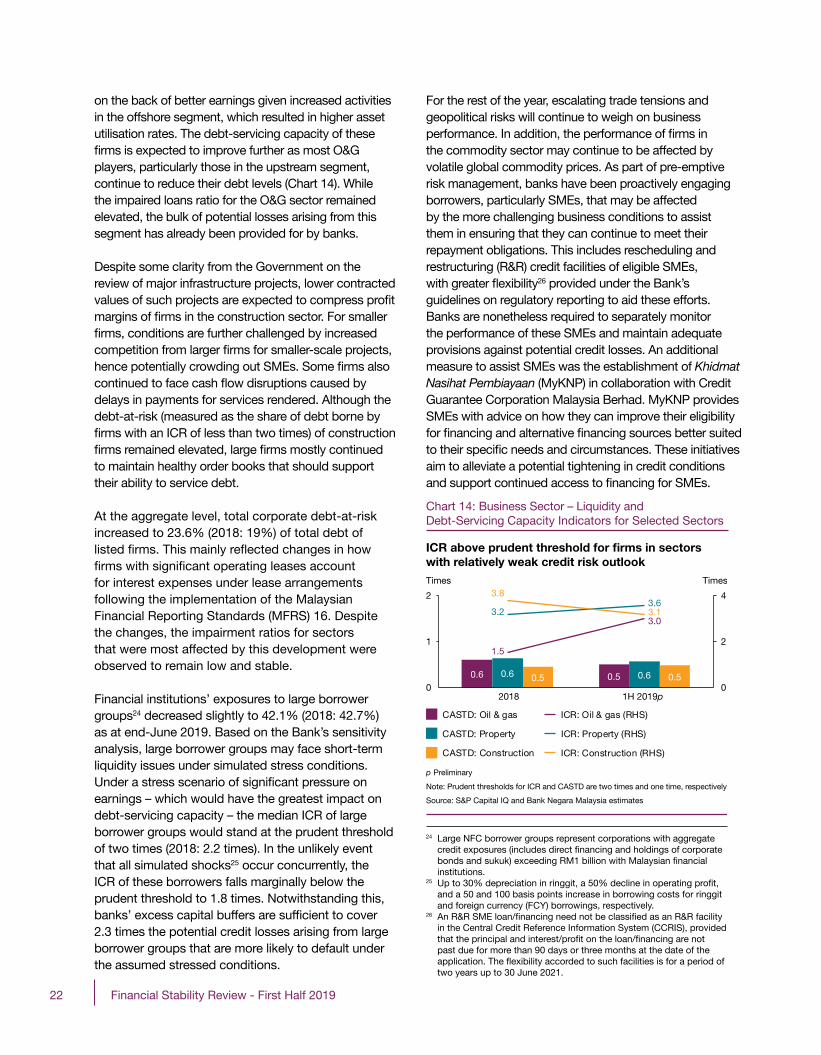
The debt-servicing capacity of most firms remained intact, supported by prudent leverage and interest coverage ratios (ICR).22 The median CASTD remained at its five-year average of 0.9 times, largely reflecting the shorter-term debt profile of smaller firms. The majority of the small firms recorded ICR levels comfortably above the prudent threshold, with the median ICR at four times. Nevertheless, the Bank’s research23 shows that changes in liquidity ratios are a predictive indicator of future business loan quality and hence, warrant continued monitoring of firm-level developments going forward. Excluding the smaller firms, the median CASTD of the top 120 firms stood at 1.3 times.
Sustained overall quality of business borrowings, despite vulnerabilities in certain sectors
In the first half of 2019, the impaired loans ratio of the overall business sector increased marginally but remained in line with its five-year average (Chart 13). The increase largely reflected operational and financial challenges faced by specific firms in the manufacturing and palm oil sectors and was not broad-based. Firms in the O&G-related, construction and real estate sectors continued to face headwinds but some signs of improvement have recently emerged.
In the O&G sector, volatility in global oil prices continued to exert pressure on firms. However, potential risks to the financial system are expected to recede going forward given that these firms have been deleveraging or successfully restructured their debt. This is reflected in the notably lower median leverage ratio of 37.7% as at end-June 2019 (2018: 51.4%). The median ICR of the sector has also risen above the prudent threshold
Chart 13: Business Sector – Gross Impaired Loans
Overall quality of lending remained sound
Source: Bank Negara Malaysia
Ratio (%)
2.6
2.7
0
1
2
3
4
M J S D M J S D M J S D M J2016 2017 2018 2019
Overall Business: Gross impaired loans
SME: Gross impaired loans
Overall business: 2.6% (5-year average: 2.6%)O&G-related: 11.2% (5-year average: 6.6%)Construction: 2.6% (5-year average: 2.7%)Property: 1.9% (5-year average: 1.6%)
21 MFRS 16 requires firms to recognise their longer-term (i.e. more than 12 months) off-balance sheet operating leases under an on-balance sheet accounting model. This typically increases the gearing ratio and interest expense, as firms would now need to recognise lease payments as an on-balance sheet liability.
22 Prudent threshold for ICR is two times.23 The Bank recently conducted a study to establish the relationship
between macroeconomic conditions, financial performance and loan impairments of businesses using multivariate ordinary least squares regressions modelling. The study suggests that movements in three statistically-significant financial ratios (leverage, solvency and liquidity) could predict future impairment ratios.
Sustained debt-servicing capacity despite a marginalweakening in NFC financial standing
Chart 12: Business Sector – Leverage, Debt-Servicing Capacity and Liquidity Indicators
Source: S&P Capital IQ and Bank Negara Malaysia estimates
Note: Prudent thresholds for ICR and CASTD are two times and one time, respectively
p Preliminary
24.7 24.9
4.84.5
0.8 0.9
0
3
6
0
15
30
2018 1H 2019p
Debt-to-equity ratio
Interest coverage ratio (RHS)
Cash-to-short-term debt ratio (RHS)
Times%
22 Financial Stability Review - First Half 2019
24 Large NFC borrower groups represent corporations with aggregate credit exposures (includes direct financing and holdings of corporate bonds and sukuk) exceeding RM1 billion with Malaysian financial institutions.
25 Up to 30% depreciation in ringgit, a 50% decline in operating profit, and a 50 and 100 basis points increase in borrowing costs for ringgit and foreign currency (FCY) borrowings, respectively.
26 An R&R SME loan/financing need not be classified as an R&R facility in the Central Credit Reference Information System (CCRIS), provided that the principal and interest/profit on the loan/financing are not past due for more than 90 days or three months at the date of the application. The flexibility accorded to such facilities is for a period of two years up to 30 June 2021.
on the back of better earnings given increased activities in the offshore segment, which resulted in higher asset utilisation rates. The debt-servicing capacity of these firms is expected to improve further as most O&G players, particularly those in the upstream segment, continue to reduce their debt levels (Chart 14). While the impaired loans ratio for the O&G sector remained elevated, the bulk of potential losses arising from this segment has already been provided for by banks.
Despite some clarity from the Government on the review of major infrastructure projects, lower contracted values of such projects are expected to compress profit margins of firms in the construction sector. For smaller firms, conditions are further challenged by increased competition from larger firms for smaller-scale projects, hence potentially crowding out SMEs. Some firms also continued to face cash flow disruptions caused by delays in payments for services rendered. Although the debt-at-risk (measured as the share of debt borne by firms with an ICR of less than two times) of construction firms remained elevated, large firms mostly continued to maintain healthy order books that should support their ability to service debt.
At the aggregate level, total corporate debt-at-risk increased to 23.6% (2018: 19%) of total debt of listed firms. This mainly reflected changes in how firms with significant operating leases account for interest expenses under lease arrangements following the implementation of the Malaysian Financial Reporting Standards (MFRS) 16. Despite the changes, the impairment ratios for sectors that were most affected by this development were observed to remain low and stable.
Financial institutions’ exposures to large borrower groups24 decreased slightly to 42.1% (2018: 42.7%) as at end-June 2019. Based on the Bank’s sensitivity analysis, large borrower groups may face short-term liquidity issues under simulated stress conditions. Under a stress scenario of significant pressure on earnings – which would have the greatest impact on debt-servicing capacity – the median ICR of large borrower groups would stand at the prudent threshold of two times (2018: 2.2 times). In the unlikely event that all simulated shocks25 occur concurrently, the ICR of these borrowers falls marginally below the prudent threshold to 1.8 times. Notwithstanding this, banks’ excess capital buffers are sufficient to cover 2.3 times the potential credit losses arising from large borrower groups that are more likely to default under the assumed stressed conditions.
For the rest of the year, escalating trade tensions and geopolitical risks will continue to weigh on business performance. In addition, the performance of firms in the commodity sector may continue to be affected by volatile global commodity prices. As part of pre-emptive risk management, banks have been proactively engaging borrowers, particularly SMEs, that may be affected by the more challenging business conditions to assist them in ensuring that they can continue to meet their repayment obligations. This includes rescheduling and restructuring (R&R) credit facilities of eligible SMEs, with greater flexibility26 provided under the Bank’s guidelines on regulatory reporting to aid these efforts. Banks are nonetheless required to separately monitor the performance of these SMEs and maintain adequate provisions against potential credit losses. An additional measure to assist SMEs was the establishment of KhidmatNasihatPembiayaan(MyKNP) in collaboration with Credit Guarantee Corporation Malaysia Berhad. MyKNP provides SMEs with advice on how they can improve their eligibility for financing and alternative financing sources better suited to their specific needs and circumstances. These initiatives aim to alleviate a potential tightening in credit conditions and support continued access to financing for SMEs.
ICR above prudent threshold for firms in sectorswith relatively weak credit risk outlook
Chart 14: Business Sector – Liquidity and Debt-Servicing Capacity Indicators for Selected Sectors
Source: S&P Capital IQ and Bank Negara Malaysia estimates
0.6 0.50.6 0.60.5 0.5
1.5
3.03.2 3.1
3.83.6
0
2
4
0
1
2
2018 1H 2019p
CASTD: Oil & gas
CASTD: Property
CASTD: Construction
ICR: Oil & gas (RHS)
ICR: Property (RHS)
ICR: Construction (RHS)
Times Times
Note: Prudent thresholds for ICR and CASTD are two times and one time, respectively
p Preliminary

23Financial Stability Review - First Half 2019
MARKETRISK
Domestic Financial Markets Remained Orderly Despite Domestic and External Headwinds
Domestic financial markets continued to experience bouts of volatility in 2019 due to both domestic and external developments. On the external front, the US FOMC cut its policy rate for the first time in more than a decade in July. Although the July rate cut was broadly anticipated by the market, the unexpected escalation of trade tensions between the US and People’s Republic of China (PR China) in August led to heightened uncertainty in the prospective path of monetary policy globally. Domestically, from mid-April to end-May, idiosyncratic factors following the news on Norges Bank’s removal of emerging market bonds from the benchmark index it tracks and the possible removal of Malaysian Government Securities (MGS) from the FTSE Russell WGBI triggered non-resident (NR) outflows from both the bond and equity markets. NR holdings of Malaysian government bonds fell to 20.9% of total outstanding government bonds as at end-May, the lowest level observed since 2010 (peak in November 2016: 34%). As at end-August, NR holdings stood at 22% of total outstanding government bonds. Despite these developments, market conditions remained orderly as strong demand from domestic institutional investors (DII), including financial institutions, continued to support valuations.
Overall market stress as measured by the Financial Market Stress Index (FMSI) increased since the second quarter of 2019, but remained well below levels observed in 2018 (Chart 15). For the period January to August 2019, NR investors recorded a net inflow of RM7 billion into the government bond market following expectations of a US rate cut and resumption of the US-PR China trade talks in June which reversed earlier outflows (Chart 16). However, the equity market continued to record a net outflow position of RM7.4 billion on the back of growing concerns over weaker corporate earnings and the vacillation of trade developments during the year.
Chart 15: Financial Market – Financial Market Stress Index (FMSI)
Escalating trade tensions and unexpected monetary policy shifts will continue to drive market stress forthe remainder of 2019
Source: Bloomberg, Reuters and Bank Negara Malaysia estimates
-4-202468
101214
2017 2018 2019
Stress level, % (Stacked; Minimum=0, Maximum=100)
Bonds Money
Equity Foreign exchange
Financial institutions Systemic stress
FMSI
Chart 16: Financial Market – Cumulative Non-resident Portfolio Flows
Net non-resident inflows observed in the government bond market but persistent outflows from the equity market
Bond �ows Equity �ows
A: - News on potential removal of MGS from benchmark indices - US increases tariffs on Chinese goodsB: - Resumption of trade talks and relaxation of ban on HuaweiC: - US rate cut amid vacillation of trade developments
Source: Bloomberg and Bank Negara Malaysia
2019
RM billion
A B C
J F M A M J J A-10
-8-6-4-202468
10

24 Financial Stability Review - First Half 2019
Financial institutions continued to actively manage their market risk exposures while maintaining prudent risk-taking behaviour
Banks
Banks’ treasury portfolios expanded during the year, mainly attributed to higher holdings of government bonds in the banking book following the sell-off by NR investors in April and May. Interest rate risk in the banking book correspondingly increased slightly to 4.5% of total capital in the second quarter from 4.3% at the start of the year. Although the size of banks’ trading book has also increased, it continued to remain relatively small at 18.5% of total securities (2018: 17.4%). Banks’ foreign exchange (FX) net open position (NOP) declined to 4.9% of total capital (2018: 5.8%), reflecting greater caution among banks given the uncertain market conditions that prevailed during the first half of the year. FX NOP exposures continued to be dominated by exposures to the US dollar. The contribution of net trading and investment gains to banks’ profit before tax rose to 20.2% (2018: 17.8%) on improved bond valuations due to lower interest rates. Active risk management and hedging strategies by banks continued to contain market risk exposures at manageable levels, well within prudent value-at-risk and loss limits set by individual banks.
Insurers and takaful operators
Holdings of financial assets by insurers and takaful operators expanded in the first six months of 2019 in tandem with the growth of insurance funds. For life insurers and family takaful operators, a significant portion of their investment holdings remained in medium- to long-term corporate bonds and sukuk in order to match their longer-term liability structure. In contrast, general insurers and takaful operators continued to hold largely cash, deposits and liquid structured products given the shorter-term liability structure.
Equity holdings increased in the first half of 2019 as insurers and takaful operators took advantage of attractive valuations. Correspondingly, capital held against equity risk increased slightly to 7.8% (2018: 7.7%) of total capital available. Equity holdings continued to be mostly in blue-chip stocks and well-diversified across different economic sectors. Interest rate risk exposures increased to 4.4% (2018: 2.9%) of total capital available as bond yields decreased during the period. Overall, insurers and takaful operators delivered a stronger investment performance compared to the corresponding period in 2018. This was largely driven by improved valuations in the domestic bond market.
LIQUIDITYANDFUNDINGRISK
Banks Maintained Sufficient Liquid Assets Amid Stable Funding Conditions
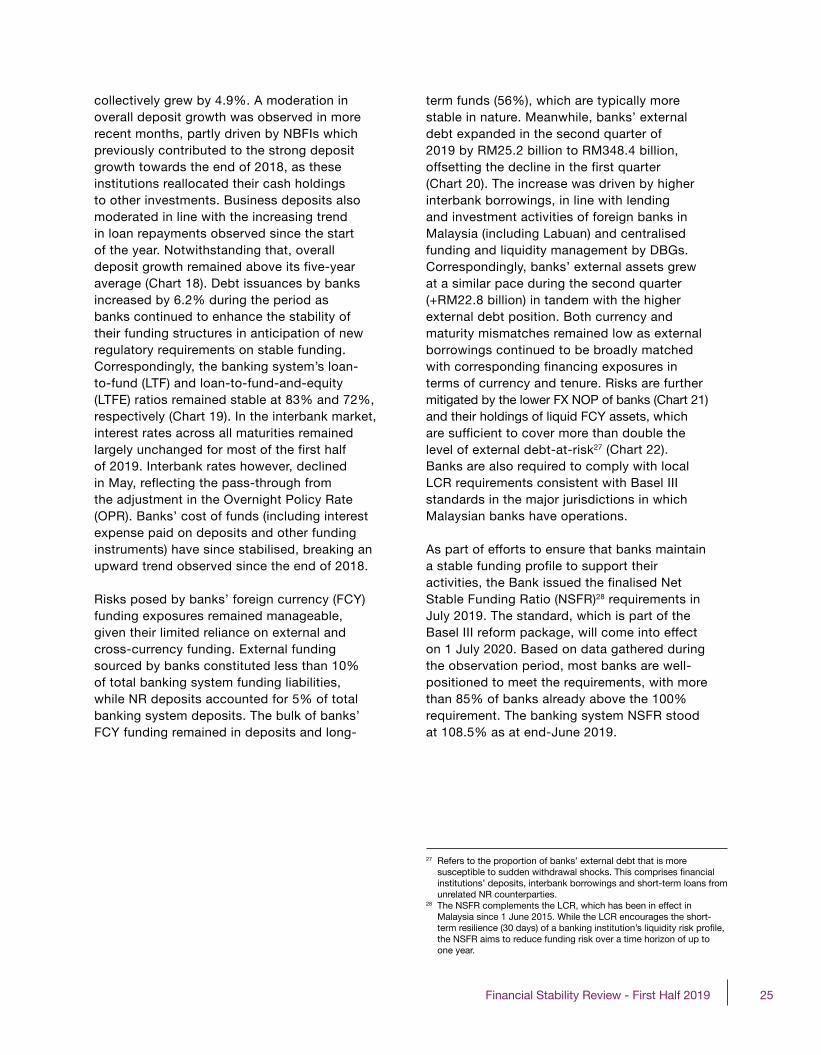
During the first half of 2019, banks continued to actively manage their liquidity positions in anticipation of maturing business deposits and opportunities to shore up liquid assets. Liquidity in the banking system remained sufficient to support domestic financial intermediation. The Liquidity Coverage Ratio (LCR) of the banking system, which measures the amount of high quality liquid assets (HQLA) held by banks to meet liquidity needs over a 30-day stress period (Chart 17), strengthened further over the past six months indicating greater resilience against potential shocks. All banks continued to record LCR levels above the regulatory minimum requirement of 100%, which came into full effect on 1 January 2019. Given the position of strength, banks also continued to provide support to the market during the period of heavy NR portfolio outflows, particularly in April and May.
Domestic funding conditions remained broadly stable. Banks’ credit intermediation activities continued to be funded primarily by deposits and long-term funding, which
25Financial Stability Review - First Half 2019
collectively grew by 4.9%. A moderation in overall deposit growth was observed in more recent months, partly driven by NBFIs which previously contributed to the strong deposit growth towards the end of 2018, as these institutions reallocated their cash holdings to other investments. Business deposits also moderated in line with the increasing trend in loan repayments observed since the start of the year. Notwithstanding that, overall deposit growth remained above its five-year average (Chart 18). Debt issuances by banks increased by 6.2% during the period as banks continued to enhance the stability of their funding structures in anticipation of new regulatory requirements on stable funding. Correspondingly, the banking system’s loan-to-fund (LTF) and loan-to-fund-and-equity (LTFE) ratios remained stable at 83% and 72%, respectively (Chart 19). In the interbank market, interest rates across all maturities remained largely unchanged for most of the first half of 2019. Interbank rates however, declined in May, reflecting the pass-through from the adjustment in the Overnight Policy Rate (OPR). Banks’ cost of funds (including interest expense paid on deposits and other funding instruments) have since stabilised, breaking an upward trend observed since the end of 2018.
Risks posed by banks’ foreign currency (FCY) funding exposures remained manageable, given their limited reliance on external and cross-currency funding. External funding sourced by banks constituted less than 10% of total banking system funding liabilities, while NR deposits accounted for 5% of total banking system deposits. The bulk of banks’ FCY funding remained in deposits and long-
term funds (56%), which are typically more stable in nature. Meanwhile, banks’ external debt expanded in the second quarter of 2019 by RM25.2 billion to RM348.4 billion, offsetting the decline in the first quarter (Chart 20). The increase was driven by higher interbank borrowings, in line with lending and investment activities of foreign banks in Malaysia (including Labuan) and centralised funding and liquidity management by DBGs. Correspondingly, banks’ external assets grew at a similar pace during the second quarter (+RM22.8 billion) in tandem with the higher external debt position. Both currency and maturity mismatches remained low as external borrowings continued to be broadly matched with corresponding financing exposures in terms of currency and tenure. Risks are further mitigated by the lower FX NOP of banks (Chart 21) and their holdings of liquid FCY assets, which are sufficient to cover more than double the level of external debt-at-risk27 (Chart 22). Banks are also required to comply with local LCR requirements consistent with Basel III standards in the major jurisdictions in which Malaysian banks have operations.
As part of efforts to ensure that banks maintain a stable funding profile to support their activities, the Bank issued the finalised Net Stable Funding Ratio (NSFR)28 requirements in July 2019. The standard, which is part of the Basel III reform package, will come into effect on 1 July 2020. Based on data gathered during the observation period, most banks are well-positioned to meet the requirements, with more than 85% of banks already above the 100% requirement. The banking system NSFR stood at 108.5% as at end-June 2019.
27 Refers to the proportion of banks’ external debt that is more susceptible to sudden withdrawal shocks. This comprises financial institutions’ deposits, interbank borrowings and short-term loans from unrelated NR counterparties.
28 The NSFR complements the LCR, which has been in effect in Malaysia since 1 June 2015. While the LCR encourages the short-term resilience (30 days) of a banking institution’s liquidity risk profile, the NSFR aims to reduce funding risk over a time horizon of up to one year.
26 Financial Stability Review - First Half 2019
Note: 1 Banks’ external debt in this context refers to external debt of DBGs, LIFBs and LIBFC banks2 Banking system or onshore banks refer to only DBGs and LIFBs3 Liquid assets comprise cash and cash equivalents, unencumbered debt securities held and interbank placements
Source: Bank Negara Malaysia
Banks' intermediation activities continued to besupported by growth in deposits and long-term funds
Chart 19: Banking System – Loan-to-Fund Ratio and Loan-to-Fund-and-Equity Ratio
82.6
72.2
60
65
70
75
80
85
90
J F M A M J J A S O N D J F M A M J
2018 2019
Loan-to-fund ratio Loan-to-fund-and-equity ratio
%
Banks maintained sufficient liquidity
Chart 17: Banking System – Liquidity Coverage Ratio and High Quality Liquid Assets
153
0
100
200
300
400
500
600
700
800
020406080
100120140160180
J F M A M J J A S O N D J F M A M J2018 2019
High quality liquid assets (RHS) Liquidity Coverage Ratio
% RM billion
Growth in deposits remained above long-term average
Chart 18: Banking System – Contribution to Growth in Deposits Accepted
-202468
10
J F M A M J J A S O N D J F M A M J2018 2019
Individuals Businesses
Non-bank �nancial institutions Federal government
Non-residents Others
Annual change (%): Total deposits
5-year average: 4.9%Percentage point
5.1
External funding remained small relative to totalbanking system funding
Chart 20: Banks' External Debt – by Instrument
359.4 357.5 353.3 323.2 348.4
7.9% 7.9% 7.7% 6.9% 7.5%
0
100
200
300
400
500
2Q 3Q 4Q 1Q 2Q20192018
Others
Debt securities
Deposits accepted from non-FIs
FI placement & vostro
Interbank borrowings
Onshore banks' external debt(% of total funding)
RM billion
FX and USD net open positions remained low
Chart 21: Banking System – FX and USD Net Open Position as Percentage of Capital
4.9
3.3
0
2
4
6
8
J F M A M J J A S O N D J F M A M J2018 2019
FX USD
% of total capital
Banks maintained FCY liquid assets of more thantwo times the FCY external ‘debt-at-risk’
Chart 22: Banking System – FCY External ‘Debt-at-Risk’ and Liquid Assets
57.2
143.8
0
100
200
300
FCY short-term external debt FCY liquid assets
FCY external 'debt-at-risk'
RM billion
241.0

27Financial Stability Review - First Half 2019
CONTAGIONRISK
Contagion Risk Remained Contained
In the first half of the year, contagion risk arising from the financial activities of NBFIs to the financial system remained broadly contained. The provident and pension funds, and fund management industry continued to form the largest share of NBFI assets. NBFIs’ participation in the financial markets remained significant, with investments in equities and debt securities accounting for 28.3% of total market capitalisation and 42.4% of total outstanding debt issuances, respectively (Chart 23). NBFIs’ holdings of financial assets in common with financial institutions as well as their equity interests in several domestic banks remained the key risk transmission channel to the financial system. NBFIs increased their investment in equities in the first half of 2019, including shareholdings in domestic banks, as they took advantage of attractive valuations to augment their investment portfolios. Risks from rapid disposals of these financial assets resulting in sharp price adjustments remain limited, given NBFIs’ medium- to long-term investment horizon, and the largely strategic nature of their investments. On the contrary, large NBFIs have continued to provide liquidity support to the domestic financial markets, particularly during periods of outflows in the first half of the year.
Direct credit exposures to NBFIs and the subscription of NBFI-issued debt securities by banks, insurance companies (including takaful operators) and DFIs29 increased by 5.2% and 5.4%, respectively. These exposures remained small, accounting for less than 3.5% of total loans and 7.7% of debt securities held by financial institutions. NBFIs continued to hold more than half of households’ financial assets, mainly in the form of long-term savings in provident and pension funds. The withdrawals of such savings are subject to strict requirements to ensure that households have sufficient buffers for retirement. This, in effect, mitigates the liquidity risk faced by NBFIs. Nevertheless, a few NBFIs remain exposed to relatively higher withdrawal risk due to demand deposit-like liabilities. These NBFIs generally continue to hold sufficient liquid assets in the form of cash, deposit placements as well as government and government-guaranteed securities to meet liquidity needs, including from sustained heavy withdrawals.
Heightened public expectations for NBFIs to adopt good governance and sound risk management practices have been a positive development for the sector. Renewed efforts by NBFIs to increase transparency and strengthen risk management capabilities have been observed and will contribute towards promoting the long-term sustainability of NBFIs. This in turn will serve to mitigate contagion risk to the financial system.
29 DFIs that are regulated by the Bank under the Development Financial Institutions Act 2002.
Chart 23: Interlinkages of NBFIs with the Financial System
Higher magnitude of NBFIs' interlinkages with the financial system mainly due to NBFIs' participation in the financial market
2018 1H 2019p
p Preliminary
Source: Bank Negara Malaysia, Securities Commission Malaysia, Malaysia Co-operative Societies Commission and published �nancial statements
0 10 20 30 40 50 60%
Derivatives transactions with banks(% of banking system capital)
Deposits with banks(% of banking system deposit base)
Financing to households(% of household debt)
NBFIs’ debt securities held by banks, insurers and DFIs(% of capital for banking system, insurance sector and DFIs)
Borrowings from banks(% of banking system capital)
Investment in equities(% of equity market capitalisation)
Shareholding in banks(% of equities of listed banks)
Investment in debt securities(% of debt securities outstanding)
Deposits and contributions from households(% of household �nancial assets)

28 Financial Stability Review - First Half 2019

29Financial Stability Review - First Half 2019
Financial Institution Soundnessand Resilience
RESILIENCEANDPERFORMANCEOFTHEBANKINGSECTOR
Banks’ Capitalisation and Profitability Remained Strong
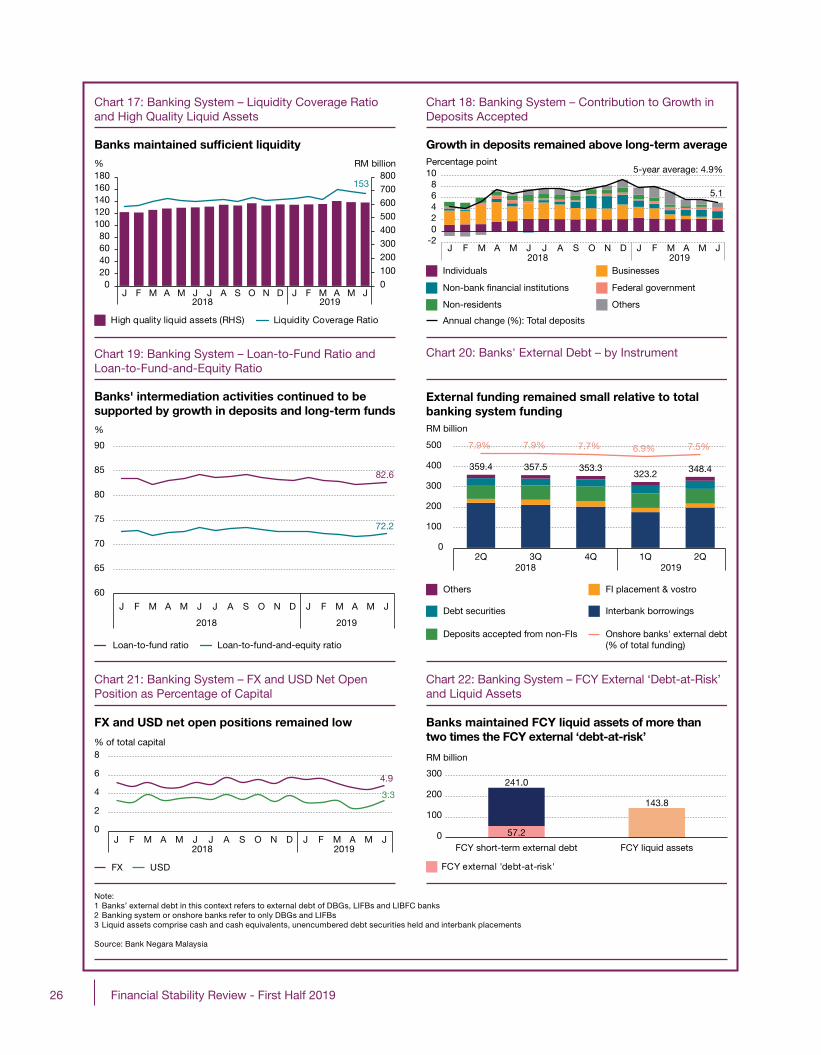
Banks maintained strong capitalisation levels throughout the first half of 2019 (Chart 24). During this period, redemptions of Additional Tier 1 and Tier 2 capital instruments that are being phased-out from qualifying as regulatory capital under the Basel III transitional arrangements resulted in marginally lower capital ratios. Notwithstanding this, 77% of banks’ capital continued to be held in the form of high-quality loss-absorbing capital comprising paid up capital, retained earnings and reserves. Banking system profitability remained healthy (Chart 25), supported by financing activities which continue to account for the bulk of banks’ gross income. Pre-tax profits which recorded an annual growth of 5.2% (1H 2019: RM20.4 billion; 1H 2018: RM19.4 billion) were also bolstered by dividend income from subsidiaries and lower loan loss provisions as banks continued to refine their credit risk estimations under MFRS 9. Despite a narrowing of interest margins following the 25 basis points reduction in the OPR in May, sustained improvements in cost-efficiency over the past few years have supported relatively stable bank profits (refer to Box Article on ‘Malaysian Banks’ Profitability – Past Trends and Future Prospects’ on page 35).
The resilience of banks’ capital and profits continued to be underpinned by sound asset quality (Chart 26). This is supported by the sustained debt-servicing capacity of the household sector. Despite slightly higher impairments from business loans given challenges faced by specific firms in selected sectors, banks continued to maintain strong buffers against potential future losses. In addition to loan loss provisions,
regulatory reserves held by banks further mitigate the impact of any potential deterioration in asset quality (Chart 27). Furthermore, most banks remained resilient to extreme macroeconomic and financial shocks under multi-year stress tests30 conducted by the Bank, with sufficient capital and earnings buffers to absorb potential losses (Chart 28).
Risks from DBGs’ overseas operations to the Malaysian banking system remain contained despite weaker economic conditions
In the first half of 2019, growth in the total assets of DBGs’ overseas operations was broadly sustained (1H 2019: 9%; 2018: 8%) (Chart 29). The performance of overseas operations deteriorated slightly, reflecting weaker economic conditions in the region. Notwithstanding this, overall capitalisation of DBGs’ overseas operations remained strong (Chart 30), with earnings continuing to be well supported by contributions from interest income and enhanced operational efficiency. DBGs have also increased their vigilance over the more vulnerable segments in their lending portfolios, with a particular focus on the manufacturing, O&G, real estate and construction sectors.
The Bank monitors developments in the overseas operations of individual DBGs as part of its consolidated supervision framework. This is supported by regular engagements with host regulators through supervisory colleges and periodic bilateral meetings. Such engagements continue to provide an important platform for the timely exchange of information and identification of emerging risks, as well as coordination of supervisory responses where relevant.
30 Please refer to the information box in the Financial Stability and Payment Systems Report 2018 titled ‘Solvency Stress Test Scenarios, Key Assumptions and Shock Parameters’ for details of the multi-year solvency stress test.
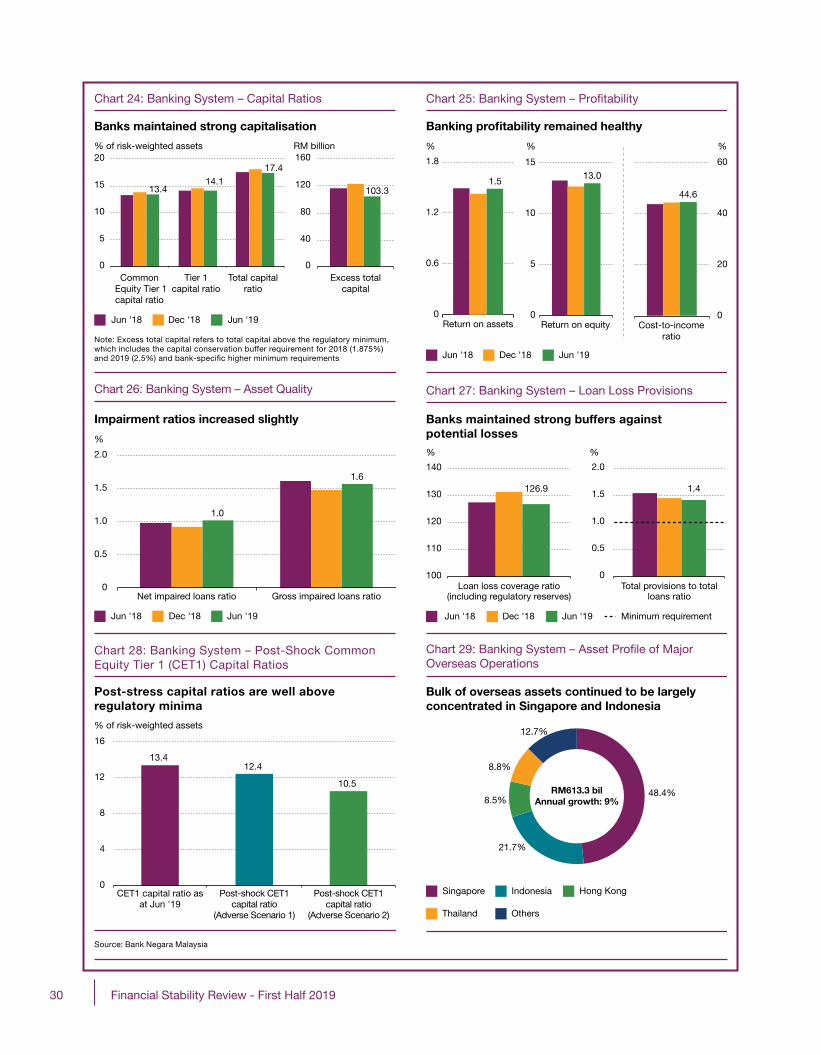
30 Financial Stability Review - First Half 2019
Chart 24: Banking System – Capital Ratios
Banks maintained strong capitalisation
Jun '18 Dec '18 Jun '19
CommonEquity Tier 1capital ratio
Tier 1capital ratio
Total capitalratio
Excess totalcapital
RM billion% of risk-weighted assets
Note: Excess total capital refers to total capital above the regulatory minimum, which includes the capital conservation buffer requirement for 2018 (1.875%) and 2019 (2.5%) and bank-speci�c higher minimum requirements
13.4 14.1
17.4
0
5
10
15
20
103.3
0
40
80
120
160
Chart 25: Banking System – Pro�tability
Banking profitability remained healthy
Jun '18 Dec '18 Jun '19
44.6
Cost-to-incomeratio
0
20
40
60
%
1.5
0
0.6
1.2
1.8
Return on assets
%
13.0
0
5
10
15
Return on equity
%
Impairment ratios increased slightly
Chart 26: Banking System – Asset Quality
1.0
1.6
0
0.5
1.0
1.5
2.0
Jun '18 Dec '18 Jun '19
Net impaired loans ratio Gross impaired loans ratio
%
Bulk of overseas assets continued to be largelyconcentrated in Singapore and Indonesia
Chart 29: Banking System – Asset Pro�le of Major Overseas Operations
Indonesia
Thailand
Singapore Hong Kong
Others
RM613.3 bilAnnual growth: 9%
12.7%
8.8%
8.5%
21.7%
48.4%
Chart 27: Banking System – Loan Loss Provisions
Banks maintained strong buffers against potential losses
Jun '18 Dec '18 Jun '19 Minimum requirement
%
Loan loss coverage ratio(including regulatory reserves)
Total provisions to totalloans ratio
%
126.9
100
110
120
130
140
1.4
0
0.5
1.0
1.5
2.0
Source: Bank Negara Malaysia
Chart 28: Banking System – Post-Shock Common Equity Tier 1 (CET1) Capital Ratios
Post-stress capital ratios are well above regulatory minima
CET1 capital ratio asat Jun '19
Post-shock CET1capital ratio
(Adverse Scenario 1)
Post-shock CET1capital ratio
(Adverse Scenario 2)
% of risk-weighted assets
13.4 12.4
10.5
0
4
8
12
16

31Financial Stability Review - First Half 2019
RESILIENCEANDPERFORMANCEOFTHEINSURANCEANDTAKAFULSECTOR
Insurance and Takaful Sector Remained Resilient
The insurance and takaful sector recorded an aggregate capital adequacy ratio (CAR) of 230% as at end-June 2019 (Chart 31), well above the regulatory minimum and higher than insurers and takaful operators’ (ITOs) internal target capital levels. Capital held against insurance and takaful risk – which continued to form the largest component (43%) of total capital required – remained broadly unchanged, reflecting the relatively stable overall product mix.
Chart 31: Insurance and Takaful Sector — Capital Adequacy Ratio
Source: Bank Negara Malaysia
Aggregate capital adequacy ratio (CAR) remained well above the regulatory minimum of 130%
100
130
160
190
220
250
280
0
20
40
60
80
100
2015 2016 2017 2018 2Q19
%RM billion
Total capital available Total capital required
Excess capital above regulatory minimum CAR of 130%
Capital adequacy ratio(RHS)
Insurance and takaful sector recorded higher profitability amidst better investment performance
Overall profitability for the insurance and takaful sector in the first half of 2019 improved compared to the corresponding period last year. This was largely supported by the life insurance and family takaful segment on the back of unrealised gains from bond holdings and higher growth in net premiums (Chart 32). Chart 32: Life Insurance and Family Takaful Sector –Composition of Income and Outgo
* Excess of net premium after deducting bene�t payouts, agency remuneration and management expenses
Source: Bank Negara Malaysia
Higher excess income over outgo driven by net unrealised gainsRM billion
-10
-5
0
5
10
15
20
1H 2017 2H 2017 1H 2018 2H 2018 1H 2019
Net investment income
Net pro�t/(loss) from disposalof assets
Balance of transaction*
Net unrealised gain/(loss)
Net other income/(loss) Excess income over outgo
31 The BSC framework aims to align sales incentives with better quality sales and policy servicing by insurance and takaful intermediaries.
New business premiums in the life insurance and family takaful sector recorded significantly stronger growth due to improved sales of non-participating endowment policies via bancassurance arrangements, and higher contributions from medical and health takaful products for the lower income segment (Chart 33). The implementation of the Balanced Scorecard (BSC) framework,31 which entered its second year of implementation, has seen measurable improvements in the quality of advice provided by agents as reflected in the markedly higher number of agents meeting the 90% first-year and 80% second-year persistency rates. This is expected to further support the sustainability of premium growth going forward.
Financial performance of overseas operationsremained sound
Chart 30: Banking System – Key Financial Indicators of Overseas Operations
Source: Bank Negara Malaysia
Note: Refers to median key �nancial soundness indicators of selected overseas operations
18.7
10.9
2.3
19.3
10.7
2.0
19.1
8.8
2.3
0
5
10
15
20
25
Total capital ratio Return on equity Gross impairedloans ratio
Jun '18 Dec '18 Jun '19
%

32 Financial Stability Review - First Half 2019
Despite sustained renewals, growth in new premiums for investment-linked policies on the other hand was largely flat amid weaker equity markets and the diversification of some ITOs into other product lines. In response to revised regulatory requirements on investment-linked products, including the Minimum Allocation Rate (MAR)32 which came into effect on 1 July 2019, ITOs are in the process of implementing changes to their product designs and business strategies. While delivering better value to policyholders, these adjustments could potentially affect new business growth and profitability of investment-linked products in the near term.
Operating profits in the general insurance and takaful sector were similarly bolstered by better investment performance (Chart 34). Underwriting profits however declined, largely due to several large claims from fire and explosion incidents. In the motor segment, underwriting performance remains under pressure amid greater competition and rising claims costs. Nonetheless, the improved pricing flexibility under the phased liberalisation
of the Motor Tariff33 has sustained positive overall operating results. Out of the 8.2 million in-force private car policies as at end-June 2019, premium rates were either lower or maintained for 43% of policies, while 57% were subject to higher rates. The quantum of the rate changes was however modest, with changes mostly falling within 10% of tariff rates. Consistent with pricing that is more aligned with risks, larger rate increases were observed for higher risk vehicles or risk owners, while certain covers and risk segments which were previously overpriced under the tariff saw significant reductions.
32 MAR specifies minimum proportion of premiums or takaful contributions for investment-linked policies or takaful certificates to be allocated to a unit fund(s). MAR is being implemented in a phased manner over the period from 1 July 2019 to 1 July 2020.
33 The liberalisation of the Motor Tariff for ‘Comprehensive’ and ‘Third Party, Fire and Theft’ products commenced on 1 July 2017 as part of Phase II of the overall pricing reform. The Bank is currently developing proposals for the next phase of liberalisation.
Chart 34: General Insurance and Takaful Sector – Composition of Operating Pro�ts
Slight improvement in operating profits supported by better investment performance
-1
0
1
2
3
RM billion
Source: Bank Negara Malaysia
1H 2017 2H 2017 1H 2018 2H 2018 1H 2019
Underwriting pro�t Net investment income
Net capital gain/(loss) Net pro�t/(loss) from disposal of assets
Net other income/(loss) Operating pro�t/(loss)
Chart 33: Life Insurance and Family Takaful Sector – New Business Premium Growth and Product Composition
Source: Bank Negara Malaysia
New business recorded stronger growth
RM billion %
Investment-linked Ordinary Takaful Non-participating
Participating Total new business premium growth (RHS)
02468101214161820
0123456789
10
1H 2017 2H 2017 1H 2018 2H 2018 1H 2019
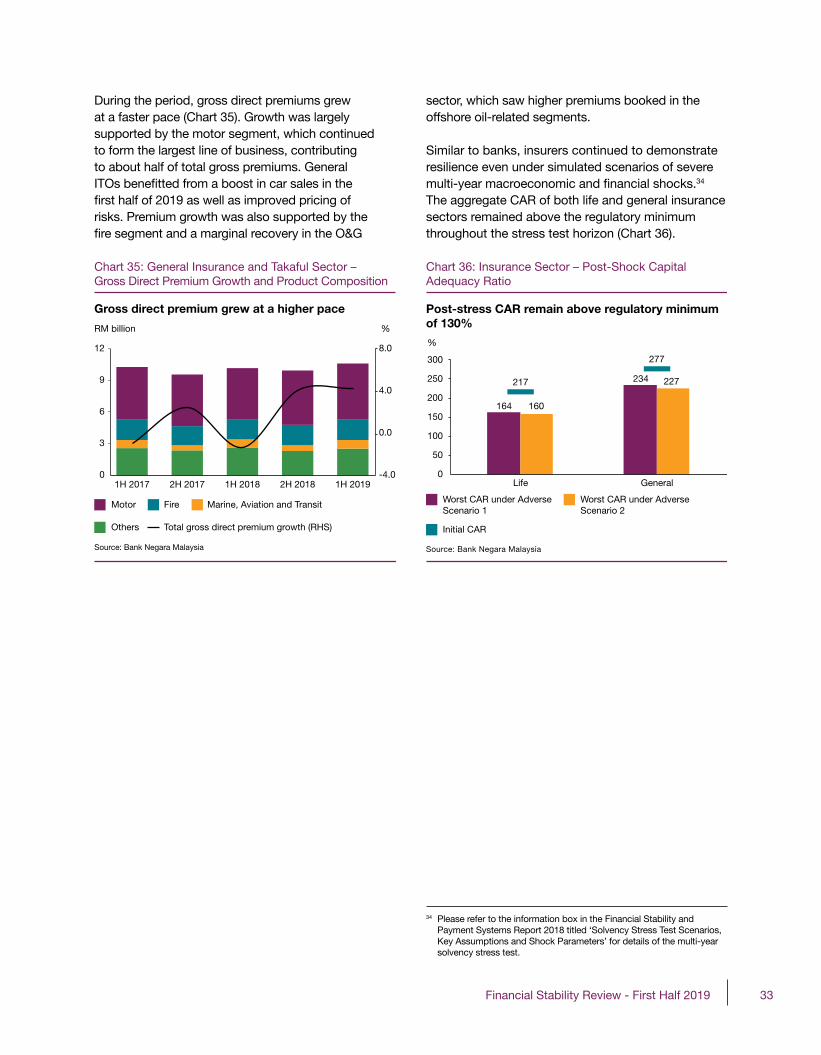
33Financial Stability Review - First Half 2019
Chart 35: General Insurance and Takaful Sector – Gross Direct Premium Growth and Product Composition
Gross direct premium grew at a higher pace
RM billion %
Source: Bank Negara Malaysia
Motor Fire Marine, Aviation and Transit
Others Total gross direct premium growth (RHS)
1H 2017 2H 2017 1H 2018 2H 2018 1H 2019-4.0
0.0
4.0
8.0
0
3
6
9
12
Chart 36: Insurance Sector – Post-Shock Capital Adequacy Ratio
Post-stress CAR remain above regulatory minimumof 130%
Life General
Source: Bank Negara Malaysia
Worst CAR under AdverseScenario 1
Worst CAR under AdverseScenario 2
Initial CAR
%
0
50
100
150
200
250
300
217
164 160
234 227
277
During the period, gross direct premiums grew at a faster pace (Chart 35). Growth was largely supported by the motor segment, which continued to form the largest line of business, contributing to about half of total gross premiums. General ITOs benefitted from a boost in car sales in the first half of 2019 as well as improved pricing of risks. Premium growth was also supported by the fire segment and a marginal recovery in the O&G
sector, which saw higher premiums booked in the offshore oil-related segments.
Similar to banks, insurers continued to demonstrate resilience even under simulated scenarios of severe multi-year macroeconomic and financial shocks.34 The aggregate CAR of both life and general insurance sectors remained above the regulatory minimum throughout the stress test horizon (Chart 36).
34 Please refer to the information box in the Financial Stability and Payment Systems Report 2018 titled ‘Solvency Stress Test Scenarios, Key Assumptions and Shock Parameters’ for details of the multi-year solvency stress test.

34 Financial Stability Review - First Half 2019

35Financial Stability Review - First Half 2019
Malaysian Banks’ Profi tability – Past Trends and Future Prospects
By Harikumara Sababathy and Syairah Hanin Shaharuddin
Introduction
Bank profi tability matters for fi nancial stability and sustainable economic growthHealthy profitability levels among banks is fundamentally important to ensure the financial system remains resilient and can support effective credit intermediation in the economy. Stable profits support the accumulation of capital buffers1 which enable banks to continue providing financial services to consumers even during periods of stress, thus acting to dampen the impact of adverse developments in the real economy. Attracting new capital to support bank lending activity is also much easier when banks are profitable. Existing shareholders and new investors are more likely to provide additional financial support for banks that have sustainable profitability levels given greater certainty on investment returns. Conversely, low profitability could impinge on banks’ willingness and capacity to lend, thereby constraining the availability of financing to the economy. Sustainable levels of bank profitability also have effects in mitigating potential threats to financial stability. Banks that persistently record low profits may be incentivised to take undue risks to improve their profitability. For example, in order to generate higher returns, banks may be more willing to take outsized bets on riskier unproductive exposures which can lead to increased financial fragility moving forward.
Given the importance of sustainable banking system profitability to financial sector resilience and the wider economy, this article reviews the trends in, and key drivers of bank profitability in Malaysia. It further considers how a moderation in economic and credit growth, as well as changes in the operating environment could affect bank profitability moving forward.
Bank profi tability trends and drivers
Malaysian banks’ profitability has been on a moderating trend in the current decade. While the pre-tax profits of the banking system have grown steadily over the years, banks’ returns on equity (ROE) and assets (ROA) have largely trended below the current decade average since 2014 (Chart 1). Market valuations of publicly listed banks, as reflected by the median price-to-book and price-to-earnings ratios, have also been trending lower in line with market expectations on banks’ future profitability (Chart 2). An empirical study2 on the determinants of Malaysian banks’ profitability over the period between 2010 and 2018 identified cyclical patterns in credit and economic conditions, and structural changes in the domestic banking industry, specifically increasing competition and improvements in cost efficiency, as having important effects in driving bank profitability.
Cyclical patterns in credit and economic conditions The bulk (68.5%) of Malaysian banks’ gross income is contributed by interest income from lending activities, reflecting the dominant role played by banks in financing the economy (Chart 3). As such, banking system income and profitability typically moves in tandem with cyclical patterns in financial intermediation and economic activities (Chart 4). From 2010 to 2014, banks’ pre-tax profits grew strongly at a compounded annual growth rate (CAGR) of 8.9% as banks went through a period of rapid balance sheet expansion driven by strong growth in lending activities, both to households and businesses. At its peak, credit to households grew by an annual rate of 14.2% in 2010. Bank profitability was further underpinned by improvements in asset quality during this period as stable economic conditions supported borrowers’ repayment capacity and led to lower credit losses for banks (Chart 5).
1 Retained earnings, which re� ects the net pro� ts accumulated over time after dividends are paid out to shareholders, is one of the largest components (49%) of banks’ capital. Retained earnings is an element of Common Equity Tier 1 (CET1) capital which is regarded as the highest quality component of bank capital under Basel III capital requirements in terms of going-concern loss absorption capacity (BCBS, 2010).
2 The study identi� ed credit growth and bank-speci� c variables such as cost ef� ciency (measured as cost-to-income ratio), funding costs, degree of income diversi� cation or lack thereof (measured as proportion of non-interest income to gross income) and capitalisation as important determinants of Malaysian banks’ pro� tability during this period.
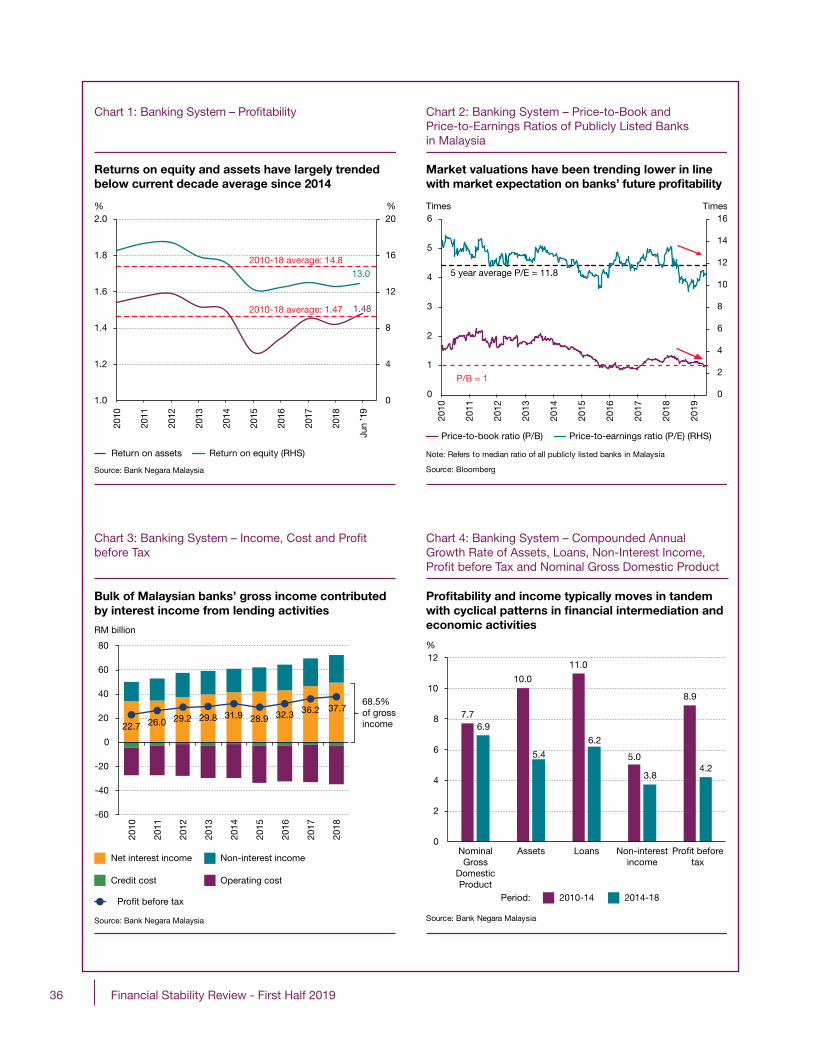
36 Financial Stability Review - First Half 2019
Source: Bank Negara Malaysia
22.7 26.0 29.2 29.8 31.9 28.9 32.3 36.2 37.7
-60
-40
-20
0
20
40
60
80
2010
2011
2012
2013
2014
2015
2016
2017
2018
Net interest income Non-interest income
Credit cost Operating cost
Pro�t before tax
Bulk of Malaysian banks’ gross income contributedby interest income from lending activities
Chart 3: Banking System – Income, Cost and Pro�t before Tax
RM billion
68.5%of grossincome
Profitability and income typically moves in tandemwith cyclical patterns in financial intermediation andeconomic activities
Chart 4: Banking System – Compounded Annual Growth Rate of Assets, Loans, Non-Interest Income, Pro�t before Tax and Nominal Gross Domestic Product
Source: Bank Negara Malaysia
7.7
10.0
11.0
5.0
8.9
6.9
5.4
6.2
3.84.2
0
2
4
6
8
10
12
NominalGross
DomesticProduct
Assets Loans Non-interestincome
Pro�t beforetax
2010-14 2014-18
%
Period:
Returns on equity and assets have largely trendedbelow current decade average since 2014
Chart 1: Banking System – Pro�tability
Source: Bank Negara Malaysia
2010
2011
2012
2013
2014
2015
2016
2017
2018
Jun
’19
Return on assets Return on equity (RHS)
% %
1.48
13.0
0
4
8
12
16
20
1.0
1.2
1.4
1.6
1.8
2.0
2010-18 average: 14.8
2010-18 average: 1.47
Market valuations have been trending lower in linewith market expectation on banks’ future profitability
Chart 2: Banking System – Price-to-Book and Price-to-Earnings Ratios of Publicly Listed Banksin Malaysia
Source: Bloomberg
Note: Refers to median ratio of all publicly listed banks in Malaysia
2010
2011
2012
2013
2014
2015
2016
2017
2018
2019
Price-to-book ratio (P/B) Price-to-earnings ratio (P/E) (RHS)
Times Times
0
2
4
6
8
10
12
14
16
0
1
2
3
4
5
6
P/B = 1
5 year average P/E = 11.8
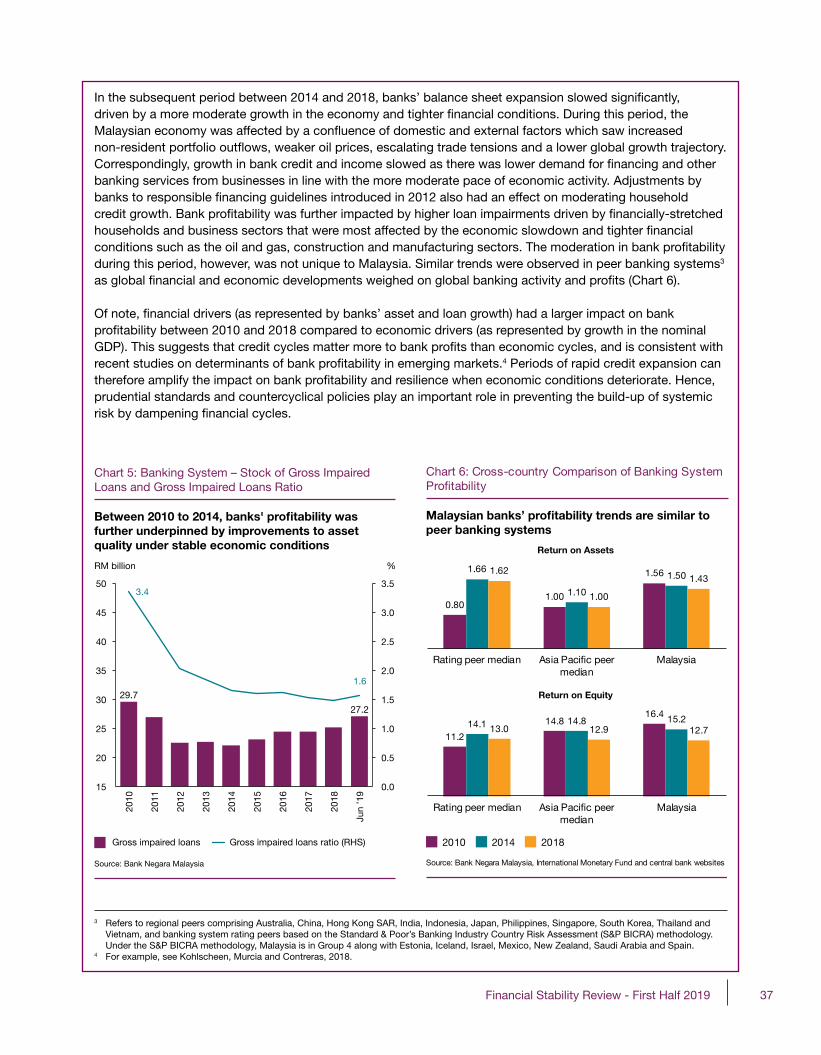
37Financial Stability Review - First Half 2019
In the subsequent period between 2014 and 2018, banks’ balance sheet expansion slowed signi� cantly, driven by a more moderate growth in the economy and tighter � nancial conditions. During this period, the Malaysian economy was affected by a con� uence of domestic and external factors which saw increased non-resident portfolio out� ows, weaker oil prices, escalating trade tensions and a lower global growth trajectory. Correspondingly, growth in bank credit and income slowed as there was lower demand for � nancing and other banking services from businesses in line with the more moderate pace of economic activity. Adjustments by banks to responsible � nancing guidelines introduced in 2012 also had an effect on moderating household credit growth. Bank pro� tability was further impacted by higher loan impairments driven by � nancially-stretched households and business sectors that were most affected by the economic slowdown and tighter � nancial conditions such as the oil and gas, construction and manufacturing sectors. The moderation in bank pro� tability during this period, however, was not unique to Malaysia. Similar trends were observed in peer banking systems3 as global � nancial and economic developments weighed on global banking activity and pro� ts (Chart 6).
Of note, � nancial drivers (as represented by banks’ asset and loan growth) had a larger impact on bank pro� tability between 2010 and 2018 compared to economic drivers (as represented by growth in the nominal GDP). This suggests that credit cycles matter more to bank pro� ts than economic cycles, and is consistent with recent studies on determinants of bank pro� tability in emerging markets.4 Periods of rapid credit expansion can therefore amplify the impact on bank pro� tability and resilience when economic conditions deteriorate. Hence, prudential standards and countercyclical policies play an important role in preventing the build-up of systemic risk by dampening � nancial cycles.
3 Refers to regional peers comprising Australia, China, Hong Kong SAR, India, Indonesia, Japan, Philippines, Singapore, South Korea, Thailand and Vietnam, and banking system rating peers based on the Standard & Poor’s Banking Industry Country Risk Assessment (S&P BICRA) methodology. Under the S&P BICRA methodology, Malaysia is in Group 4 along with Estonia, Iceland, Israel, Mexico, New Zealand, Saudi Arabia and Spain.
4 For example, see Kohlscheen, Murcia and Contreras, 2018.
Between 2010 to 2014, banks' profitability wasfurther underpinned by improvements to assetquality under stable economic conditions
Chart 5: Banking System – Stock of Gross Impaired Loans and Gross Impaired Loans Ratio
29.7
27.2
3.4
1.6
0.0
0.5
1.0
1.5
2.0
2.5
3.0
3.5
15
20
25
30
35
40
45
50
2010
2011
2012
2013
2014
2015
2016
2017
2018
Jun
’19
Source: Bank Negara Malaysia
Gross impaired loans Gross impaired loans ratio (RHS)
RM billion %
Malaysian banks’ profitability trends are similar topeer banking systems
Chart 6: Cross-country Comparison of Banking System Pro�tability
0.80 1.00
1.56 1.66
1.10
1.50 1.62
1.00
1.43
Rating peer median Asia Paci�c peermedian
Malaysia
Return on Assets
Source: Bank Negara Malaysia, International Monetary Fund and central bank websites
Asia Paci�c peermedian
2010 2014 2018
11.2
14.8 16.4
14.1 14.8 15.2 13.0 12.9 12.7
Rating peer median Malaysia
Return on Equity
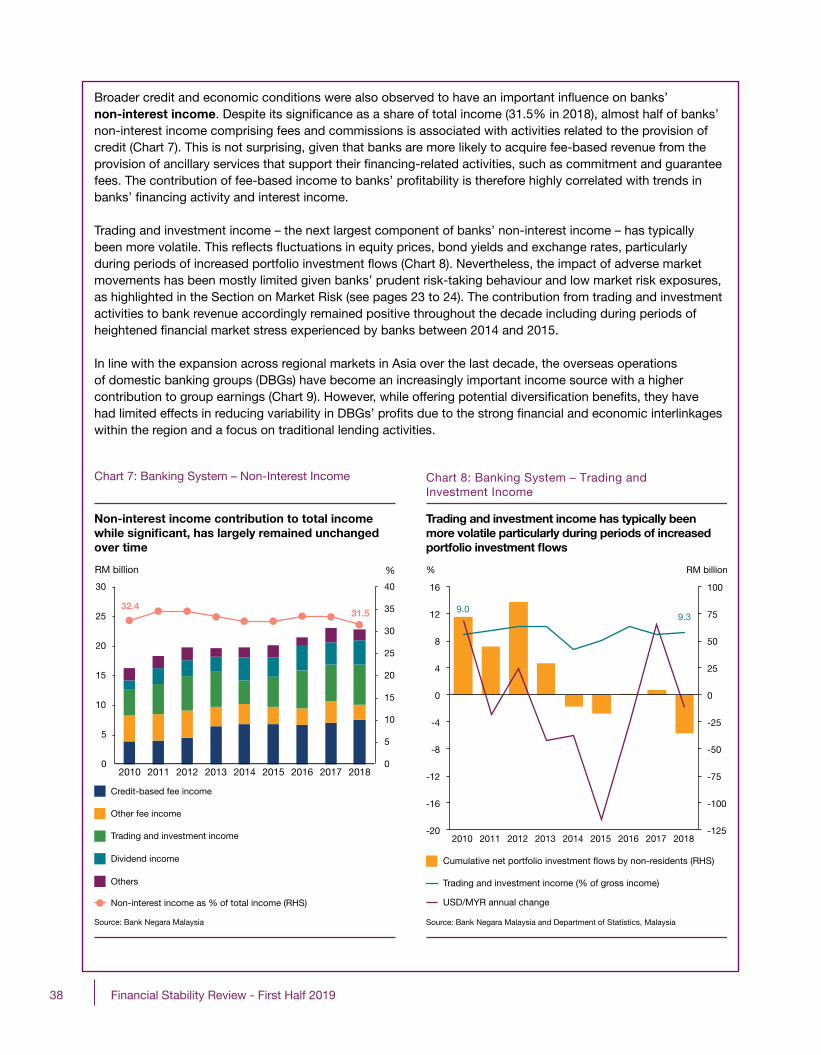
38 Financial Stability Review - First Half 2019
Broader credit and economic conditions were also observed to have an important in� uence on banks’ non-interest income. Despite its signi� cance as a share of total income (31.5% in 2018), almost half of banks’ non-interest income comprising fees and commissions is associated with activities related to the provision of credit (Chart 7). This is not surprising, given that banks are more likely to acquire fee-based revenue from the provision of ancillary services that support their � nancing-related activities, such as commitment and guarantee fees. The contribution of fee-based income to banks’ pro� tability is therefore highly correlated with trends in banks’ � nancing activity and interest income.
Trading and investment income – the next largest component of banks’ non-interest income – has typically been more volatile. This re� ects � uctuations in equity prices, bond yields and exchange rates, particularly during periods of increased portfolio investment � ows (Chart 8). Nevertheless, the impact of adverse market movements has been mostly limited given banks’ prudent risk-taking behaviour and low market risk exposures, as highlighted in the Section on Market Risk (see pages 23 to 24). The contribution from trading and investment activities to bank revenue accordingly remained positive throughout the decade including during periods of heightened � nancial market stress experienced by banks between 2014 and 2015.
In line with the expansion across regional markets in Asia over the last decade, the overseas operations of domestic banking groups (DBGs) have become an increasingly important income source with a higher contribution to group earnings (Chart 9). However, while offering potential diversi� cation bene� ts, they have had limited effects in reducing variability in DBGs’ pro� ts due to the strong � nancial and economic interlinkages within the region and a focus on traditional lending activities.
Non-interest income contribution to total incomewhile significant, has largely remained unchangedover time
Chart 7: Banking System – Non-Interest Income
32.431.5
0
5
10
15
20
25
30
35
40
0
5
10
15
20
25
30
Source: Bank Negara Malaysia
2010 2011 2012 2013 2014 2015 2016 2017 2018
Others
Dividend income
Trading and investment income
Other fee income
Credit-based fee income
Non-interest income as % of total income (RHS)
RM billion %
Chart 8: Banking System – Trading and Investment Income
Trading and investment income has typically been more volatile particularly during periods of increased portfolio investment flows
Source: Bank Negara Malaysia and Department of Statistics, Malaysia
Cumulative net portfolio investment �ows by non-residents (RHS)
Trading and investment income (% of gross income)
USD/MYR annual change
9.09.3
-125
-100
-75
-50
-25
0
25
50
75
100
-20
-16
-12
-8
-4
0
4
8
12
16
2010 2011 2012 2013 2014 2015 2016 2017 2018
RM billion%

39Financial Stability Review - First Half 2019
Chart 9: Domestic Banking Groups – Overseas Operations Contribution to Group
Overseas operations have become an increasingly important income source for domestic banking groups
Note: Refers to median ratio for domestic banking groups
Source: Bank Negara Malaysia and banks' �nancial statements
2010 2018
18.6
14.3
21.520.0
0
5
10
15
20
25
Total assets Pro�t before tax
% contribution to group
Growing competitive pressures on both sides of the balance sheet for banksThe moderating trend in bank pro� tability also re� ects an intensi� cation of competition among banks over the years on both sides of their balance sheets. On the funding-side, an increase in the share of more stable and longer-term � xed deposits in recent years has been accompanied by greater competition for stable funding as banks geared up to comply with new liquidity regulations5 under Basel III (Chart 10). This has driven up overall costs of funding (Chart 11). Intense competition for funds has further constrained banks’ ability to pass through downward adjustments in the Overnight Policy Rate to deposit rates. On the asset-side, banks’ ability to pass on higher funding costs to customers has been similarly constrained by strong price competition in the retail segments, in particular housing loans (which forms 32% of banking system loans) as banks continued to compete to maintain market share. Correspondingly, banks’ lending rates have been slower to adjust to changes in overall funding costs, leading to narrower margins. In this environment, banks have increasingly sought to leverage their market positions more effectively to generate additional revenue through targeted cross-selling to existing clients and strategic partnerships to expand and deepen their commercial lending activities.
Improvements in cost effi ciencyMalaysian banks’ cost ef� ciency, measured by total cost-to-income ratio, has improved in recent years and compares favourably with peer banking systems (Chart 12). This re� ects a strong focus by banks on cost optimisation, particularly over the last few years amid declining interest margins.6 Notably, banks have actively pursued initiatives to rationalise headcount for selected business functions, increase automation and investments in information technology (IT) systems and infrastructure to improve operational ef� ciency, and optimise branch networks. These improvements to cost ef� ciency have shored up bank pro� ts in an environment where banks are experiencing margin compressions. While interest margin declined by 53 basis points between 2010 and 2018, banks’ interest margin net of total operating and credit costs has improved (Chart 13).
5 Refers to Basel III Liquidity Coverage Ratio (LCR) and Net Stable Funding Ratio (NSFR) requirements which strengthen the resilience of the banking system against liquidity and funding shocks.
6 The difference between interest rates at which banks extend � nancing and interest rates banks pay for funding, including deposits.

40 Financial Stability Review - First Half 2019
Chart 10: Banking System – Fixed Deposits
Note: Fixed deposits include Commodity Murabahah accepted (Islamic term deposits) by Islamic banks. Composition of �xed deposits by original maturity refers to commercial banks only
Source: Bank Negara Malaysia
Share of �xed deposits
Share of �xed deposits with original maturity > 6 months (RHS)
Banks have shifted towards more stable and longer-term fixed deposits in recent years to comply with new liquidity regulations
% total deposits % total �xed deposits
0
20
40
60
45
50
55
60
M J S D M J S D M J S D M J S D M J S D M J
2014 2015 2016 2017 2018 2019
Chart 12: Cross-country Comparison of Banking System Cost Ef�ciency
Malaysian banks' cost efficiency notably better than most regional and rating peer banking systems
Note: Based on data as at end-2018. Banking system rating peers are based on S&P BICRA methodology
Source: Bank Negara Malaysia and International Monetary Fund
4436
4148
5151
576565
3145454547484849
546264
91
MalaysiaSaudi ArabiaNew Zealand
EstoniaMexico
Peer medianSpainIsrael
IcelandPR China
Hong Kong SARAustralia
SingaporeVietnam
Peer medianIndonesiaThailand
IndiaPhilippines
JapanSouth Korea
Asi
a P
aci�
c p
eers
Ban
king
sys
tem
ra
ting
pee
rs
Cost-to-income ratio (%)
Chart 13: Banking System – Interest Margin
Strong focus on cost optimisation has enabled banks to better withstand interest margin compression
Note: Total costs refer to impairment provisions and operating costs
Source: Bank Negara Malaysia
Interest margin Interest margin net of total costs (RHS)
2.66
2.06
0.62
0.72
0
0.2
0.4
0.6
0.8
1.8
2.0
2.2
2.4
2.6
2.8
3.0
2010
2011
2012
2013
2014
2015
2016
2017
2018
Jun
‘19
Percentage point Percentage point
Chart 11: Banking System – Average Cost of Deposits, Average Cost of Funds and Average Lending Rate on New Housing Loans
Intense competition has constrained banks’ ability to pass through downward adjustments in the Overnight Policy Rate to deposit rates
Note: Average cost of deposits and average cost of funds refer to median of major banks in Malaysia. Average lending rate on new housing loans refers to weighted lending rate on new housing loans approved by commercial banks
Source: Bank Negara Malaysia
Average cost of deposits Average cost of funds
Average lending rate on new housing loans
%
Overnight Policy Rate
2.25
2.50
2.75
3.00
3.25
3.50
3.75
4.00
4.25
4.50
4.75
M J S D M J S D M J S D M J S D M J S D M J
2014 2015 2016 2017 2018 2019

41Financial Stability Review - First Half 2019
Factors infl uencing future bank profi tability
Moderate economic and credit growth amid external uncertainties Moving forward, softer economic and market conditions amid uncertainties in the external environment will continue to weigh on demand for bank financing and financing-related services, which could place a drag on bank profits. Higher impairments from vulnerable household segments and business sectors that continue to experience challenging conditions could further weigh on profits. However, the potential impact of weaker asset quality is likely to be muted given the more forward-looking approach to provisioning already adopted by banks following the implementation of Malaysian Financial Reporting Standards 9: Financial Instruments (MFRS 9) in 2018. In addition, as highlighted in the Section on Resilience and Performance of the Banking Sector (see pages 29 to 30) banks continue to maintain ample buffers against potential credit losses. This is expected to place banks in a better position to support continued financing growth which is a key driver of bank profitability.
Business model challenges arising from technological innovation in fi nancial services Banks’ profitability will also be impacted by disruptions to current business models driven by continued technological innovation in financial services, evolving customer preferences and developments in open banking.7 Globally, these trends have contributed to a decoupling of services traditionally performed by banks such as deposit-taking and the provision of credit, potentially ceding a key source of bank profits to more diverse competitors including Fintech8 companies, Bigtech9 companies and digital banks. A survey conducted by PwC in 2018 covering financial industry participants from 71 countries estimates that 24% of existing banks’ revenue is at risk due to the entry of new players in the financial industry. Other estimates have placed up to 20% of banking business at risk of being disintermediated as a result of open banking.10 The squeeze on profitability is more likely to be apparent across non-capital intensive business lines such as payment and settlement services and retail banking where more agile new entrants are able to exploit frontier technologies for competitive advantage and superior cost efficiency. The impact on bank profitability can also arise from competitive pricing strategies by banks to maintain their market share, resulting in lower revenue and interest margins. In addition, increased risk-taking to maintain profitability could further negatively impact future profits.
Banks remain well-positioned to capitalise on these developmentsDespite the potential challenges posed by economic uncertainties and increased competitive pressures, a number of factors are expected to support the ability of banks to take advantage of current and future trends and sustain healthy pro� ts moving forward.
Public confidence in banks remains high,11 giving banks a key advantage over new entrants. Malaysian banks have demonstrated resilience in past periods of heightened uncertainties and continue to strengthen the underpinnings of this resilience, notably by preserving strong financial buffers and prudent risk-taking. Malaysian banks continue to sustain healthy profits, with the major publicly listed banks expected to maintain profitability levels above the average cost of capital12 as implied by the ROE market consensus estimates for the next three years (Chart 14). Bank resilience is further reinforced by the Bank’s long-standing approach to supervision that is forward-looking and risk-focused.
7 Open banking generally refers to the sharing of data in an ecosystem of consumers, � nancial institutions and third-party service providers such as Fintech companies. This allows third-party service providers to build their own applications and offer services to � nancial institutions’ clients.
8 Refers to technology-enabled innovation in the provision of � nancial services. Fintech companies refer to companies that utilise Fintech and operate primarily in the � nancial services industry.
9 Refers to major technology companies whose core business are not in � nancial services. Bigtech companies typically offer � nancial services as part of a much wider set of activities (BIS, 2019).
10 Study by Swinton and Roma (2018) covering the UK market.11 Results from a recent survey published in the Financial Services Reputation Index 2019 report for Malaysia by MHP Communications indicated that
88% of respondents view banks positively. Many of the survey respondents attribute the trustworthiness of the sector in the past decade to increased regulation and competition.
12 The average cost of capital for Malaysian banks refers to the average expected annual stock returns for all listed banks estimated using a Capital Asset Pricing Model for the period between 2014 and 2018. The yield on 10-year Malaysian Government Securities is used as the risk-free rate while returns on the FBM KLCI is used to derive the market risk premium. The estimated average cost of capital of 9% for Malaysian banks is largely in line with global estimates of average cost of capital for banks (ECB, 2015).
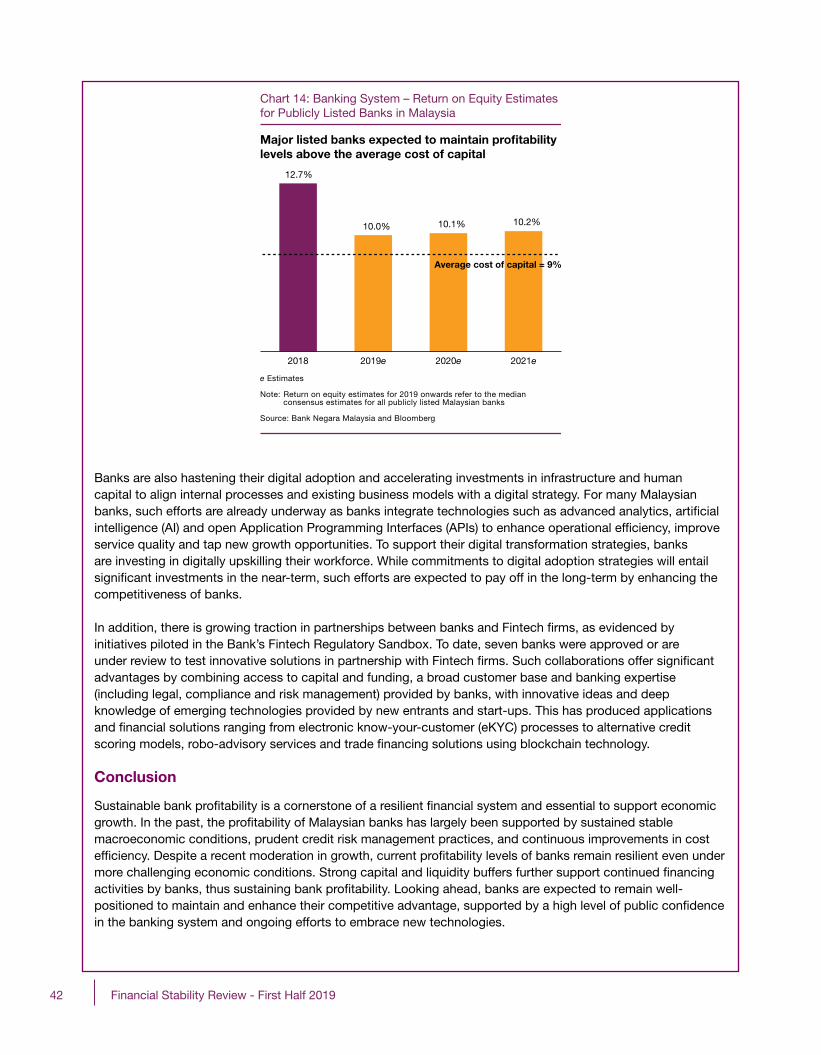
42 Financial Stability Review - First Half 2019
Banks are also hastening their digital adoption and accelerating investments in infrastructure and human capital to align internal processes and existing business models with a digital strategy. For many Malaysian banks, such efforts are already underway as banks integrate technologies such as advanced analytics, arti� cial intelligence (AI) and open Application Programming Interfaces (APIs) to enhance operational ef� ciency, improve service quality and tap new growth opportunities. To support their digital transformation strategies, banks are investing in digitally upskilling their workforce. While commitments to digital adoption strategies will entail signi� cant investments in the near-term, such efforts are expected to pay off in the long-term by enhancing the competitiveness of banks.
In addition, there is growing traction in partnerships between banks and Fintech � rms, as evidenced by initiatives piloted in the Bank’s Fintech Regulatory Sandbox. To date, seven banks were approved or are under review to test innovative solutions in partnership with Fintech � rms. Such collaborations offer signi� cant advantages by combining access to capital and funding, a broad customer base and banking expertise (including legal, compliance and risk management) provided by banks, with innovative ideas and deep knowledge of emerging technologies provided by new entrants and start-ups. This has produced applications and � nancial solutions ranging from electronic know-your-customer (eKYC) processes to alternative credit scoring models, robo-advisory services and trade � nancing solutions using blockchain technology.
Conclusion
Sustainable bank pro� tability is a cornerstone of a resilient � nancial system and essential to support economic growth. In the past, the pro� tability of Malaysian banks has largely been supported by sustained stable macroeconomic conditions, prudent credit risk management practices, and continuous improvements in cost ef� ciency. Despite a recent moderation in growth, current pro� tability levels of banks remain resilient even under more challenging economic conditions. Strong capital and liquidity buffers further support continued � nancing activities by banks, thus sustaining bank pro� tability. Looking ahead, banks are expected to remain well-positioned to maintain and enhance their competitive advantage, supported by a high level of public con� dence in the banking system and ongoing efforts to embrace new technologies.
Chart 14: Banking System – Return on Equity Estimates for Publicly Listed Banks in Malaysia
Major listed banks expected to maintain profitability levels above the average cost of capital
e Estimates
Note: Return on equity estimates for 2019 onwards refer to the median consensus estimates for all publicly listed Malaysian banks
Source: Bank Negara Malaysia and Bloomberg
12.7%
10.0% 10.1% 10.2%
2018 2019e 2020e 2021e
Average cost of capital = 9%
43Financial Stability Review - First Half 2019
References
Basel Committee on Banking Supervision (2010). ‘Basel III: A Global Regulatory Framework for More Resilient Banks and Banking Systems’. Bank for International Settlements. Available at https://www.bis.org/publ/bcbs189.htm.
Bank for International Settlements (2019). ‘Big Tech in Finance: Opportunities and Risks’. BIS Annual Economic Report 2019, page 55-79. Available at https://www.bis.org/about/areport/areport2019.htm.
Brackert, T., Dab, S. and Alexander Kok, S. (2019). ‘Retail Banks Must Embrace Open Banking or Be Sidelined’. [online] BCG. Available at: https://www.bcg.com/publications/2018/retail-banks-must-embrace-open-banking-sidelined.aspx.
European Central Bank (May 2015). Financial Stability Review. ECB, page 61-63. Available at https://www.ecb.europa.eu/pub/� nancial-stability/fsr/html/index.en.html.
European Banking Authority (2018). ‘The Impact of Fintech on Incumbent Credit Institutions Business Models’. European Banking Authority.
Kohlscheen, E., Murcia, A. and Contreras, J. (2018). ‘Determinants of Bank Pro� tability in Emerging Markets’. BIS Working Papers, (No. 686).
PricewaterhouseCoopers (2018). Global FinTech Report 2017.
Swinton, S. and Roma, E. (2019). ‘Coping with the Challenge of Open Banking’. [online] Bain & Company. Available at https://www.bain.com/insights/coping-with-the-challenge-of-open-banking/.

44 Financial Stability Review - First Half 2019
Enhancing the Financial Sector’s Cyber Security in the Digital Economy
By Cambell Benjamine and Sivanathan Subramaniam
In an increasingly digital economy, a necessary condition for � nancial stability is an enabling and effective cyber security framework and effective practices that are both technologically innovative and resilient to cyber threats. While enabling greater connectivity between individuals and organisations with signi� cant bene� ts to consumers and other users of � nancial services, disruptive technologies also have the potential to increase vulnerabilities to cyber-attacks which can lead to � nancial losses and disruptions to essential � nancial services.
The domestic � nancial services industry sees an average of one million cyber-attack attempts a day. Most of these attacks are successfully blocked, with no breaches resulting in signi� cant impact or monetary losses experienced to date. However, � nancial institutions face increasingly sophisticated cyber threats where breaches may remain undetected for several months or even years. Vigilant of the need to stay one step ahead, � nancial institutions continue to invest heavily in the latest security technology and top talent, to increase their resilience to cyber risks. In July, the Bank also issued speci� c regulatory requirements for the management of risks in technology, including cyber risks, by � nancial institutions.
Merely securing or ring-fencing individual � nancial institutions is however insuf� cient. New cyber risks are emerging at the fringes of the � nancial ecosystem which is continually expanding as the adoption of digital technologies becomes more ubiquitous. These new vulnerabilities can emerge from systems that are outside the immediate in� uence or control of � nancial institutions. This can include telecommunication, utilities and third party service providers. For instance, a telecommunications outage in July 2019 took down the digital services of the four large Australian banks1. In another case, a modern cyber-attack on Metro Bank in the United Kingdom intercepted2 codes sent via Short Message Service (SMS) from telecommunications companies.
Increasingly, attackers have also directed their focus on retail consumers typically regarded as the weakest link in cyber security. In most cases, vulnerabilities in an individual’s digital touchpoints are exploited to obtain their online banking credentials to facilitate unauthorised fund transfers, or otherwise affect the integrity of customer data. The expanding scope and sophistication of these attacks underscore the need for a national level response to complement efforts by � nancial institutions and � nancial regulators in strengthening cyber resilience. This should aim to deliver a cohesive, coherent and comprehensive national strategy on cyber security.
The need for a national coordinated response was already recognised sometime back. In 2006, the National Cyber Security Policy (NCSP) was established. It identi� ed ten Critical National Information Infrastructure (CNII) sectors including � nancial services that need to be safeguarded to a level commensurate with the risks. Following this, a National Cyber Crisis Management Plan (NCCMP) was developed in 2011 which sets out the processes and procedures to be observed by the CNII sectors for detection, response, communication and coordination in the event of a cyber-attack. An updated NCSP is expected to be launched later this year, incorporating among others, enhanced cyber security incident response and digital forensic capabilities.
Building on these important foundations, the focus of ongoing and future initiatives to strengthen Malaysia’s cyber security capabilities should consider several imperatives. First is a need to establish and strengthen existing guidance around cyber security and risk management. This should also aim to promote greater consistency in such guidance to reduce vulnerabilities in the weakest link of the digital ecosystem. Within the � nancial sector, the Risk Management in Technology (RMiT) policy document issued by the Bank addresses expectations for banks, insurers, eligible e-money providers and payment operators to signi� cantly strengthen cyber risk management practices in the areas of governance, cyber security control measures, proactive
1 Automated teller machines (ATMs) and several branch services were affected by a telecommunications outage. Available at https://www.theguardian.com/business/2019/jul/11/telstra-outage-brings-down-eftpos-and-atms-across-australia.
2 Hackers exploited � aws in SS7, a protocol used by telecommunications service providers to coordinate how they route calls and SMS messages around the world. Available at https://www.telegraph.co.uk/technology/2019/02/01/metro-bank-hit-cyber-attack-used-empty-customer-accounts/.
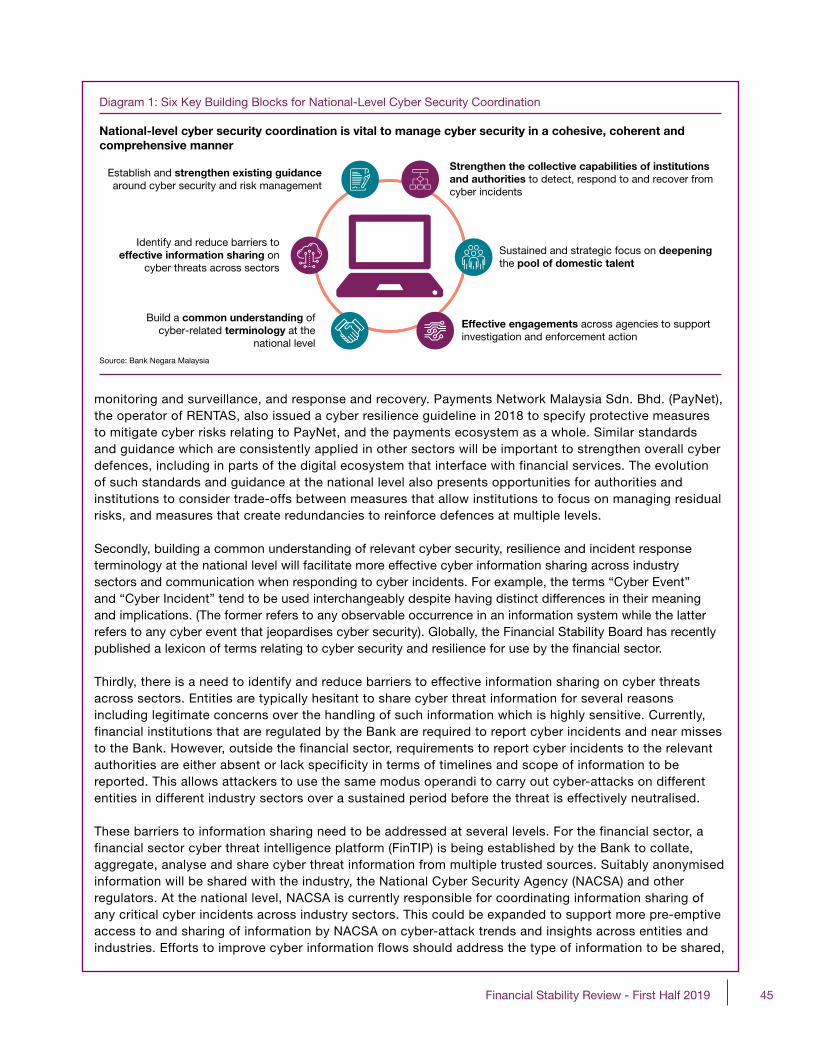
45Financial Stability Review - First Half 2019
monitoring and surveillance, and response and recovery. Payments Network Malaysia Sdn. Bhd. (PayNet), the operator of RENTAS, also issued a cyber resilience guideline in 2018 to specify protective measures to mitigate cyber risks relating to PayNet, and the payments ecosystem as a whole. Similar standards and guidance which are consistently applied in other sectors will be important to strengthen overall cyber defences, including in parts of the digital ecosystem that interface with financial services. The evolution of such standards and guidance at the national level also presents opportunities for authorities and institutions to consider trade-offs between measures that allow institutions to focus on managing residual risks, and measures that create redundancies to reinforce defences at multiple levels.
Secondly, building a common understanding of relevant cyber security, resilience and incident response terminology at the national level will facilitate more effective cyber information sharing across industry sectors and communication when responding to cyber incidents. For example, the terms “Cyber Event” and “Cyber Incident” tend to be used interchangeably despite having distinct differences in their meaning and implications. (The former refers to any observable occurrence in an information system while the latter refers to any cyber event that jeopardises cyber security). Globally, the Financial Stability Board has recently published a lexicon of terms relating to cyber security and resilience for use by the � nancial sector.
Thirdly, there is a need to identify and reduce barriers to effective information sharing on cyber threats across sectors. Entities are typically hesitant to share cyber threat information for several reasons including legitimate concerns over the handling of such information which is highly sensitive. Currently, financial institutions that are regulated by the Bank are required to report cyber incidents and near misses to the Bank. However, outside the financial sector, requirements to report cyber incidents to the relevant authorities are either absent or lack specificity in terms of timelines and scope of information to be reported. This allows attackers to use the same modus operandi to carry out cyber-attacks on different entities in different industry sectors over a sustained period before the threat is effectively neutralised.
These barriers to information sharing need to be addressed at several levels. For the financial sector, a financial sector cyber threat intelligence platform (FinTIP) is being established by the Bank to collate, aggregate, analyse and share cyber threat information from multiple trusted sources. Suitably anonymised information will be shared with the industry, the National Cyber Security Agency (NACSA) and other regulators. At the national level, NACSA is currently responsible for coordinating information sharing of any critical cyber incidents across industry sectors. This could be expanded to support more pre-emptive access to and sharing of information by NACSA on cyber-attack trends and insights across entities and industries. Efforts to improve cyber information flows should address the type of information to be shared,
National-level cyber security coordination is vital to manage cyber security in a cohesive, coherent andcomprehensive manner
Establish and strengthen existing guidancearound cyber security and risk management
Identify and reduce barriers toeffective information sharing on
cyber threats across sectors
Build a common understanding ofcyber-related terminology at the
national level
Strengthen the collective capabilities of institutionsand authorities to detect, respond to and recover fromcyber incidents
Sustained and strategic focus on deepeningthe pool of domestic talent
Effective engagements across agencies to supportinvestigation and enforcement action
Diagram 1: Six Key Building Blocks for National-Level Cyber Security Coordination
Source: Bank Negara Malaysia
46 Financial Stability Review - First Half 2019
clear expectations around responsibilities of the entities within the CNII sectors to share and properly handle cyber-related information, well-de� ned procedures for transmitting and receiving information, and the development of relevant infrastructure to improve the ef� ciency and speed of information sharing.
Fourth is a focus on strengthening the collective capabilities of institutions and authorities to respond to and recover from a cyber incident. The traditional focus for cyber security has been to identify and prevent a cyber-attack. Increasingly, � nancial institutions are adopting an ‘assumed breach’ posture in their risk management approaches. This assumes that a breach has already occurred, thus shifting the focus to the institution’s ability to detect, respond to and recover quickly from an attack across institutions and industries. A good way to strengthen cyber defence collaboration and enhance cyber incident handling is by conducting cyber crisis simulations. This is designed to test coordinated response and communication protocols, while identifying gaps that may otherwise remain undetected. The National Security Council organises national cyber security drills known as x-Maya to test the readiness of entities within the CNII sectors in responding to cyber threats once every two years. It is important that the frequency and scope of such simulations be continuously reviewed to take into account changes in the scale, scope and nature of cyber threats. This may entail expanding crisis scenarios to include a broader spectrum of entities, locations extending beyond national borders and different time zones.
Fifth, it is critical to ensure a sustained, strategic focus on deepening the pool of domestic talent to meet the increasing demand for professional cyber security roles. Such talent strategies could include collaborative partnerships between the � nancial sector and academia, private entities and government agencies. In Malaysia, the Asia Paci� c University of Technology and Innovation (APU)’s Cyber Security Talent Zone established in collaboration with the Malaysia Digital Economy Corporation (MDEC) and other industry partners is an example of public-private sector collaboration to develop competent cyber security professionals. Outside Malaysia, another example is Hong Kong Monetary Authority (HKMA)’s collaboration with the Hong Kong Institute of Banks and the Hong Kong Applied Science and Technology Research Institute (ASTRI) to develop a localised certi� cation scheme and training programme for cyber security professionals3. Similar collaborative efforts were pursued by the Bank and security professionals of the penetration testing industry to set up the Persatuan Penguji Keselamatan Siber (PPKS) in 2017. PPKS administers a certi� cation programme for penetration testing activities in Malaysia and publishes related best practices and guidance for the � nancial sector. The coordination of certi� cation and professionalisation schemes at the national level can help promote and elevate common standards across different industries.
Finally, effective engagement to support investigations and enforcement actions against perpetrators of � nancial cyber-crimes will increase the likelihood that cyber criminals are caught and punished, thus acting as an effective deterrent. Due to the nature of cyber-crimes which are transnational, anonymous and often perpetrated on the dark web, investigative and enforcement actions are often arduous and notoriously dif� cult. For actions to be effective, a signi� cantly higher level of cooperation and coordination across both domestic and international regulatory and law enforcement agencies, particularly in cyber security intelligence sharing, are required.
As cyber criminals become more sophisticated and coordinated in their attacks, the imperatives outlined above will be increasingly critical to preserve strong cyber security defences in the � nancial sector and provide the necessary agility to respond to the changing cyber threat landscape.
3 https://www.bis.org/fsi/publ/insights2.pdf.

Annex
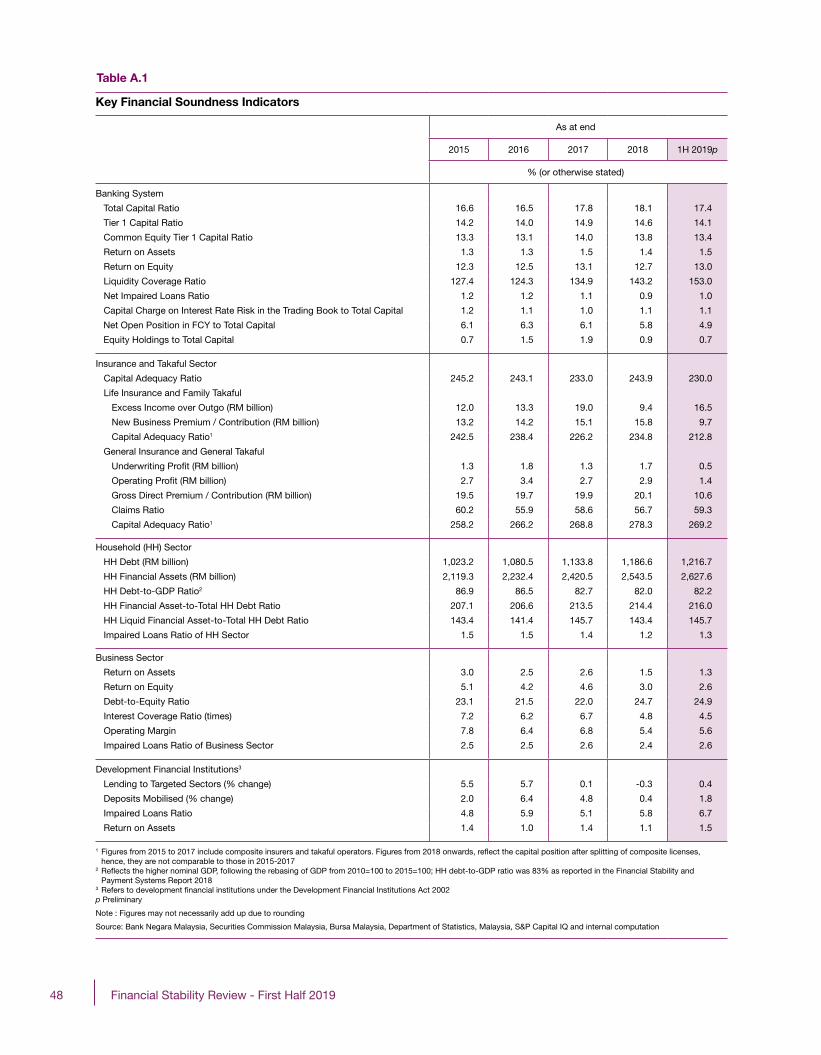
48 Financial Stability Review - First Half 2019
Key Financial Soundness Indicators
As at end
2015 2016 2017 2018 1H 2019p
% (or otherwise stated)
Banking System
Total Capital Ratio 16.6 16.5 17.8 18.1 17.4
Tier 1 Capital Ratio 14.2 14.0 14.9 14.6 14.1
Common Equity Tier 1 Capital Ratio 13.3 13.1 14.0 13.8 13.4
Return on Assets 1.3 1.3 1.5 1.4 1.5
Return on Equity 12.3 12.5 13.1 12.7 13.0
Liquidity Coverage Ratio 127.4 124.3 134.9 143.2 153.0
Net Impaired Loans Ratio 1.2 1.2 1.1 0.9 1.0
Capital Charge on Interest Rate Risk in the Trading Book to Total Capital 1.2 1.1 1.0 1.1 1.1
Net Open Position in FCY to Total Capital 6.1 6.3 6.1 5.8 4.9
Equity Holdings to Total Capital 0.7 1.5 1.9 0.9 0.7
Insurance and Takaful Sector
Capital Adequacy Ratio 245.2 243.1 233.0 243.9 230.0
Life Insurance and Family Takaful
Excess Income over Outgo (RM billion) 12.0 13.3 19.0 9.4 16.5
New Business Premium / Contribution (RM billion) 13.2 14.2 15.1 15.8 9.7
Capital Adequacy Ratio1 242.5 238.4 226.2 234.8 212.8
General Insurance and General Takaful
Underwriting Pro� t (RM billion) 1.3 1.8 1.3 1.7 0.5
Operating Pro� t (RM billion) 2.7 3.4 2.7 2.9 1.4
Gross Direct Premium / Contribution (RM billion) 19.5 19.7 19.9 20.1 10.6
Claims Ratio 60.2 55.9 58.6 56.7 59.3
Capital Adequacy Ratio1 258.2 266.2 268.8 278.3 269.2
Household (HH) Sector
HH Debt (RM billion) 1,023.2 1,080.5 1,133.8 1,186.6 1,216.7
HH Financial Assets (RM billion) 2,119.3 2,232.4 2,420.5 2,543.5 2,627.6
HH Debt-to-GDP Ratio2 86.9 86.5 82.7 82.0 82.2
HH Financial Asset-to-Total HH Debt Ratio 207.1 206.6 213.5 214.4 216.0
HH Liquid Financial Asset-to-Total HH Debt Ratio 143.4 141.4 145.7 143.4 145.7
Impaired Loans Ratio of HH Sector 1.5 1.5 1.4 1.2 1.3
Business Sector
Return on Assets 3.0 2.5 2.6 1.5 1.3
Return on Equity 5.1 4.2 4.6 3.0 2.6
Debt-to-Equity Ratio 23.1 21.5 22.0 24.7 24.9
Interest Coverage Ratio (times) 7.2 6.2 6.7 4.8 4.5
Operating Margin 7.8 6.4 6.8 5.4 5.6
Impaired Loans Ratio of Business Sector 2.5 2.5 2.6 2.4 2.6
Development Financial Institutions3
Lending to Targeted Sectors (% change) 5.5 5.7 0.1 -0.3 0.4
Deposits Mobilised (% change) 2.0 6.4 4.8 0.4 1.8
Impaired Loans Ratio 4.8 5.9 5.1 5.8 6.7
Return on Assets 1.4 1.0 1.4 1.1 1.5
1 Figures from 2015 to 2017 include composite insurers and takaful operators. Figures from 2018 onwards, re� ect the capital position after splitting of composite licenses, hence, they are not comparable to those in 2015-20172 Re� ects the higher nominal GDP, following the rebasing of GDP from 2010=100 to 2015=100; HH debt-to-GDP ratio was 83% as reported in the Financial Stability and Payment Systems Report 2018 3 Refers to development � nancial institutions under the Development Financial Institutions Act 2002 p Preliminary
Note : Figures may not necessarily add up due to rounding
Source: Bank Negara Malaysia, Securities Commission Malaysia, Bursa Malaysia, Department of Statistics, Malaysia, S&P Capital IQ and internal computation
Table A.1
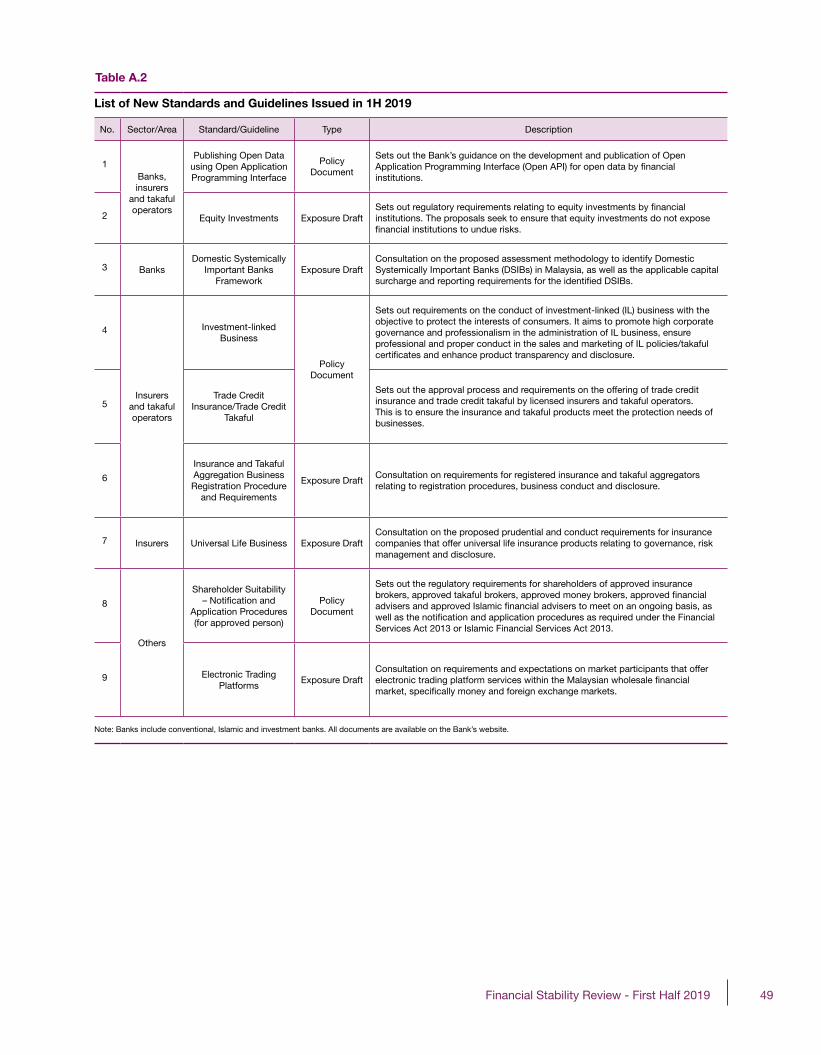
49Financial Stability Review - First Half 2019
List of New Standards and Guidelines Issued in 1H 2019
No. Sector/Area Standard/Guideline Type Description
1Banks, insurers
and takaful operators
Publishing Open Data using Open Application Programming Interface
PolicyDocument
Sets out the Bank’s guidance on the development and publication of Open Application Programming Interface (Open API) for open data by � nancial institutions.
2 Equity Investments Exposure DraftSets out regulatory requirements relating to equity investments by � nancial institutions. The proposals seek to ensure that equity investments do not expose � nancial institutions to undue risks.
3 BanksDomestic Systemically
Important Banks Framework
Exposure DraftConsultation on the proposed assessment methodology to identify Domestic Systemically Important Banks (DSIBs) in Malaysia, as well as the applicable capital surcharge and reporting requirements for the identi� ed DSIBs.
4
Insurers and takaful operators
Investment-linked Business
Policy Document
Sets out requirements on the conduct of investment-linked (IL) business with the objective to protect the interests of consumers. It aims to promote high corporate governance and professionalism in the administration of IL business, ensure professional and proper conduct in the sales and marketing of IL policies/takaful certi� cates and enhance product transparency and disclosure.
5Trade Credit
Insurance/Trade Credit Takaful
Sets out the approval process and requirements on the offering of trade credit insurance and trade credit takaful by licensed insurers and takaful operators. This is to ensure the insurance and takaful products meet the protection needs of businesses.
6
Insurance and Takaful Aggregation Business Registration Procedure
and Requirements
Exposure DraftConsultation on requirements for registered insurance and takaful aggregators relating to registration procedures, business conduct and disclosure.
7 Insurers Universal Life Business Exposure DraftConsultation on the proposed prudential and conduct requirements for insurance companies that offer universal life insurance products relating to governance, risk management and disclosure.
8
Others
Shareholder Suitability – Noti� cation and
Application Procedures (for approved person)
Policy Document
Sets out the regulatory requirements for shareholders of approved insurance brokers, approved takaful brokers, approved money brokers, approved � nancial advisers and approved Islamic � nancial advisers to meet on an ongoing basis, as well as the noti� cation and application procedures as required under the Financial Services Act 2013 or Islamic Financial Services Act 2013.
9 Electronic Trading Platforms
Exposure DraftConsultation on requirements and expectations on market participants that offer electronic trading platform services within the Malaysian wholesale � nancial market, speci� cally money and foreign exchange markets.
Note: Banks include conventional, Islamic and investment banks. All documents are available on the Bank’s website.
Table A.2
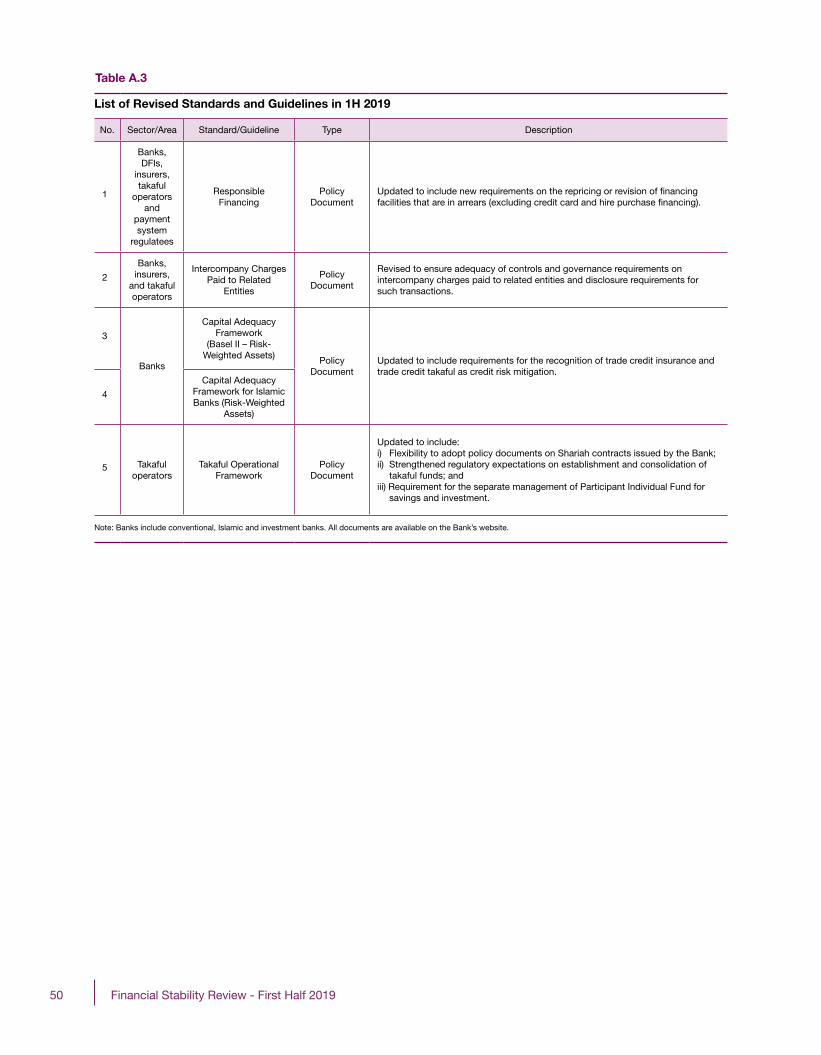
50 Financial Stability Review - First Half 2019
List of Revised Standards and Guidelines in 1H 2019
No. Sector/Area Standard/Guideline Type Description
1
Banks, DFIs,
insurers,takaful
operators and
paymentsystem
regulatees
ResponsibleFinancing
PolicyDocument
Updated to include new requirements on the repricing or revision of � nancing facilities that are in arrears (excluding credit card and hire purchase � nancing).
2
Banks,insurers,
and takafuloperators
Intercompany Charges Paid to Related
Entities
PolicyDocument
Revised to ensure adequacy of controls and governance requirements on intercompany charges paid to related entities and disclosure requirements for such transactions.
3
Banks
Capital Adequacy Framework
(Basel II – Risk-Weighted Assets) Policy
DocumentUpdated to include requirements for the recognition of trade credit insurance and trade credit takaful as credit risk mitigation.
4
Capital Adequacy Framework for Islamic Banks (Risk-Weighted
Assets)
5 Takaful operators
Takaful Operational Framework
PolicyDocument
Updated to include:i) Flexibility to adopt policy documents on Shariah contracts issued by the Bank;ii) Strengthened regulatory expectations on establishment and consolidation of takaful funds; andiii) Requirement for the separate management of Participant Individual Fund for savings and investment.
Note: Banks include conventional, Islamic and investment banks. All documents are available on the Bank’s website.
Table A.3

51Financial Stability Review - First Half 2019
Glossary, Acronymsand Abbreviations

52 Financial Stability Review - First Half 2019
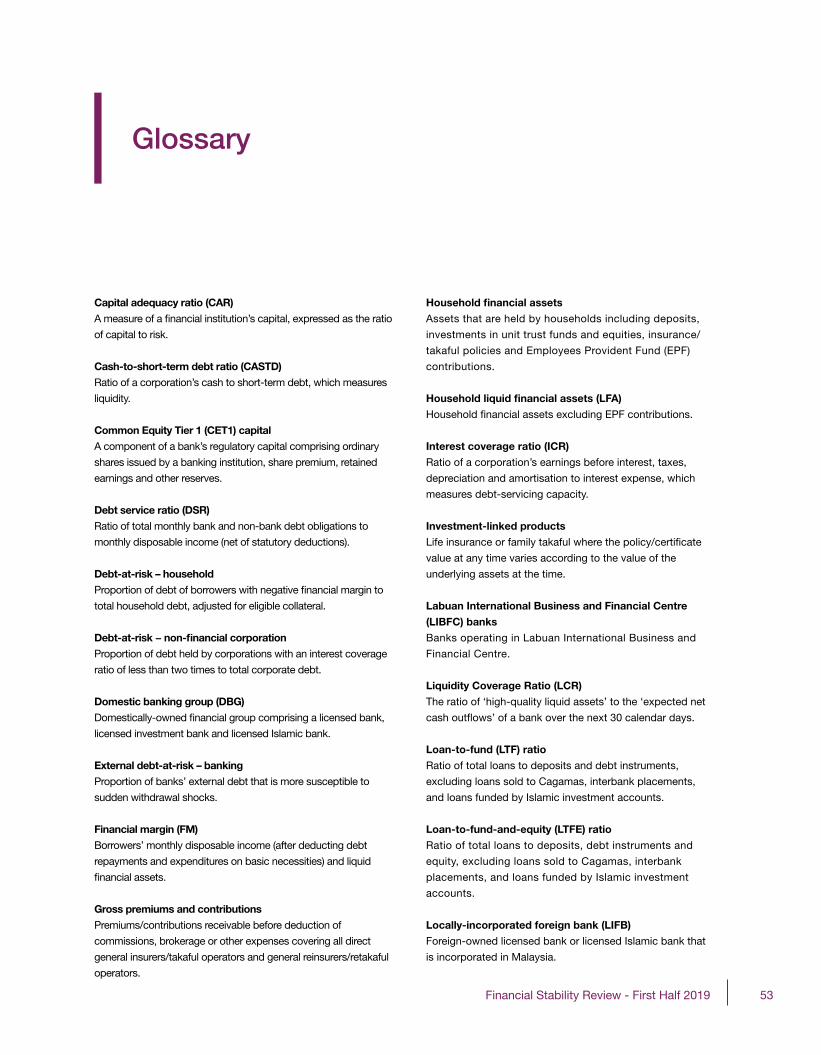
53Financial Stability Review - First Half 2019
Glossary
Capital adequacy ratio (CAR)
A measure of a � nancial institution’s capital, expressed as the ratio
of capital to risk.
Cash-to-short-term debt ratio (CASTD)
Ratio of a corporation’s cash to short-term debt, which measures
liquidity.
Common Equity Tier 1 (CET1) capital
A component of a bank’s regulatory capital comprising ordinary
shares issued by a banking institution, share premium, retained
earnings and other reserves.
Debt service ratio (DSR)
Ratio of total monthly bank and non-bank debt obligations to
monthly disposable income (net of statutory deductions).
Debt-at-risk – household
Proportion of debt of borrowers with negative � nancial margin to
total household debt, adjusted for eligible collateral.
Debt-at-risk − non-fi nancial corporation
Proportion of debt held by corporations with an interest coverage
ratio of less than two times to total corporate debt.
Domestic banking group (DBG)
Domestically-owned � nancial group comprising a licensed bank,
licensed investment bank and licensed Islamic bank.
External debt-at-risk – banking
Proportion of banks’ external debt that is more susceptible to
sudden withdrawal shocks.
Financial margin (FM)
Borrowers’ monthly disposable income (after deducting debt
repayments and expenditures on basic necessities) and liquid
� nancial assets.
Gross premiums and contributions
Premiums/contributions receivable before deduction of
commissions, brokerage or other expenses covering all direct
general insurers/takaful operators and general reinsurers/retakaful
operators.
Household fi nancial assets
Assets that are held by households including deposits,
investments in unit trust funds and equities, insurance/
takaful policies and Employees Provident Fund (EPF)
contributions.
Household liquid fi nancial assets (LFA)
Household � nancial assets excluding EPF contributions.
Interest coverage ratio (ICR)
Ratio of a corporation’s earnings before interest, taxes,
depreciation and amortisation to interest expense, which
measures debt-servicing capacity.
Investment-linked products
Life insurance or family takaful where the policy/certi� cate
value at any time varies according to the value of the
underlying assets at the time.
Labuan International Business and Financial Centre
(LIBFC) banks
Banks operating in Labuan International Business and
Financial Centre.
Liquidity Coverage Ratio (LCR)
The ratio of ‘high-quality liquid assets’ to the ‘expected net
cash out� ows’ of a bank over the next 30 calendar days.
Loan-to-fund (LTF) ratio
Ratio of total loans to deposits and debt instruments,
excluding loans sold to Cagamas, interbank placements,
and loans funded by Islamic investment accounts.
Loan-to-fund-and-equity (LTFE) ratio
Ratio of total loans to deposits, debt instruments and
equity, excluding loans sold to Cagamas, interbank
placements, and loans funded by Islamic investment
accounts.
Locally-incorporated foreign bank (LIFB)
Foreign-owned licensed bank or licensed Islamic bank that
is incorporated in Malaysia.
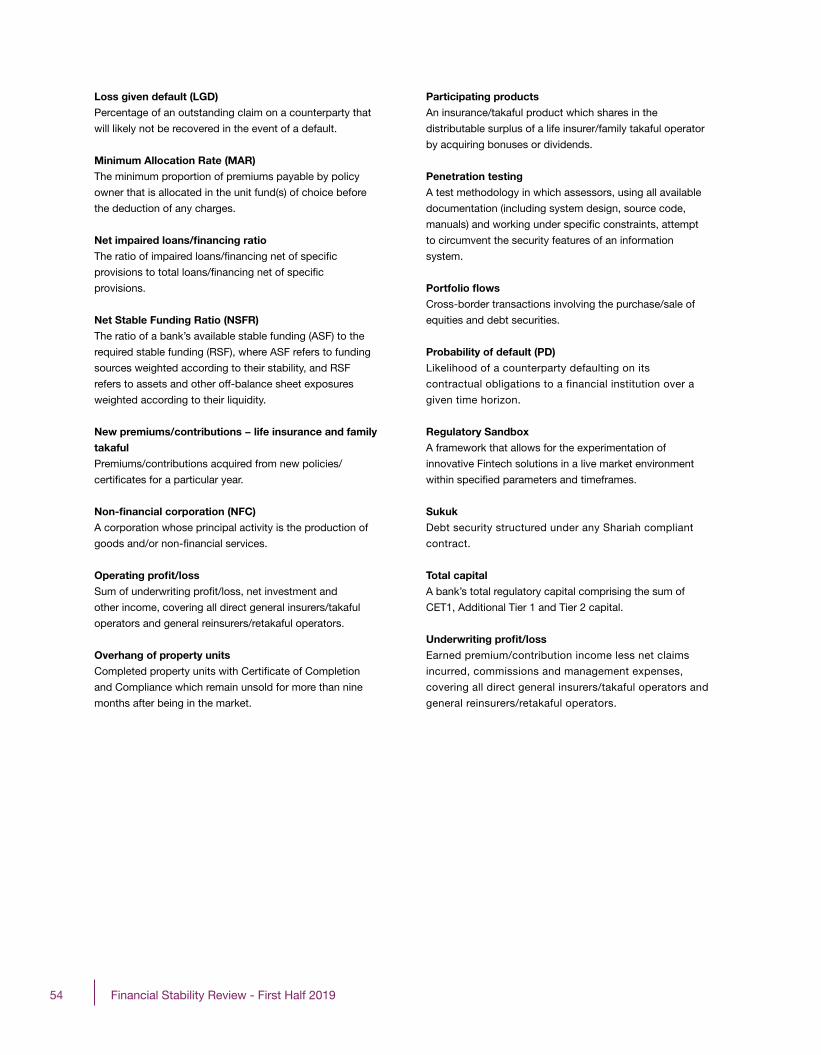
54 Financial Stability Review - First Half 2019
Loss given default (LGD)
Percentage of an outstanding claim on a counterparty that
will likely not be recovered in the event of a default.
Minimum Allocation Rate (MAR)
The minimum proportion of premiums payable by policy
owner that is allocated in the unit fund(s) of choice before
the deduction of any charges.
Net impaired loans/fi nancing ratio
The ratio of impaired loans/� nancing net of speci� c
provisions to total loans/� nancing net of speci� c
provisions.
Net Stable Funding Ratio (NSFR)
The ratio of a bank’s available stable funding (ASF) to the
required stable funding (RSF), where ASF refers to funding
sources weighted according to their stability, and RSF
refers to assets and other off-balance sheet exposures
weighted according to their liquidity.
New premiums/contributions − life insurance and family
takaful
Premiums/contributions acquired from new policies/
certi� cates for a particular year.
Non-fi nancial corporation (NFC)
A corporation whose principal activity is the production of
goods and/or non-� nancial services.
Operating profi t/loss
Sum of underwriting pro� t/loss, net investment and
other income, covering all direct general insurers/takaful
operators and general reinsurers/retakaful operators.
Overhang of property units
Completed property units with Certi� cate of Completion
and Compliance which remain unsold for more than nine
months after being in the market.
Participating products
An insurance/takaful product which shares in the
distributable surplus of a life insurer/family takaful operator
by acquiring bonuses or dividends.
Penetration testing
A test methodology in which assessors, using all available
documentation (including system design, source code,
manuals) and working under speci� c constraints, attempt
to circumvent the security features of an information
system.
Portfolio fl ows
Cross-border transactions involving the purchase/sale of
equities and debt securities.
Probability of default (PD)
Likelihood of a counterparty defaulting on its
contractual obligations to a financial institution over a
given time horizon.
Regulatory Sandbox
A framework that allows for the experimentation of
innovative Fintech solutions in a live market environment
within speci� ed parameters and timeframes.
Sukuk
Debt security structured under any Shariah compliant
contract.
Total capital
A bank’s total regulatory capital comprising the sum of
CET1, Additional Tier 1 and Tier 2 capital.
Underwriting profi t/loss
Earned premium/contribution income less net claims
incurred, commissions and management expenses,
covering all direct general insurers/takaful operators and
general reinsurers/retakaful operators.
55Financial Stability Review - First Half 2019
Acronyms and Abbreviations
AKPK Credit Counselling and Debt Management Agency (Agensi Kaunseling dan Pengurusan Kredit)
BSC Balanced Scorecard
CAGR compounded annual growth rate
CAR capital adequacy ratio
CASTD cash-to-short-term debt ratio
CCA Consumer Credit Act
CCRIS Central Credit Reference Information System
CNII Critical National Information Infrastructure
DBG domestic banking group
DFI development � nancial institution
DII domestic institutional investor
DSR debt service ratio
EPF Employees Provident Fund
FCY foreign currency
FE Network Financial Education Network
FI � nancial institution
Fintech � nancial technology
FM � nancial margin
FMSI Financial Market Stress Index
FOMC Federal Open Market Committee
FSC Financial Stability Committee
FTSE Financial Times Stock Exchange
FX foreign exchange
GDP gross domestic product
HQLA high quality liquid assets
ICR interest coverage ratio
IL investment-linked
IT information technology
ITO insurers and takaful operators
KLIBOR Kuala Lumpur Interbank Offered Rate
LCR Liquidity Coverage Ratio
LFA liquid � nancial assets
LGD loss given default
LIBFC Labuan International Business and Financial Centre
LIFB locally-incorporated foreign bank
LPPSA Public Sector Home Financing Board (Lembaga Pembiayaan Perumahan Sektor Awam)
LTF loan-to-fund
LTFE loan-to-fund-and-equity
MAR Minimum Allocation Rate
MDEC Malaysia Digital Economy Corporation
MFRS Malaysian Financial Reporting Standards
MGS Malaysian Government Securities
MHPI Malaysian House Price Index
MyKNP Financing Advisory Services (Khidmat Nasihat Pembiayaan)
NACSA National Cyber Security Agency
NBFI non-bank � nancial institution
NCCMP National Cyber Crisis Management Plan
NCSP National Cyber Security Policy
NFC non-� nancial corporation
NOP net open position
NR non-resident
NSFR Net Stable Funding Ratio
O&G oil and gas
OPR Overnight Policy Rate
OSSC of� ce space and shopping complexes

56 Financial Stability Review - First Half 2019
PD probability of default
PF personal � nancing
PPKS Association of Cyber Security Testers (Persatuan Penguji Keselamatan Siber)
PR China People’s Republic of China
R&R rescheduled and restructured
RENTAS Real-time Electronic Transfer of Funds and Securities System
RMiT Risk Management in Technology
SME small and medium enterprise
SOHO small of� ce home of� ce
US United States of America
WGBI World Government Bond Index