preferences for coral reef and fishery management in
TRANSCRIPT

Journal of Environmental and Resource Economics at Journal of Environmental and Resource Economics at
Colby Colby
Volume 2 Issue 1 Spring 2015 Article 8
2015
Preferences for Coral Reef and Fishery Management in Okinawa, Preferences for Coral Reef and Fishery Management in Okinawa,
Japan Japan
Nils Carlson Colby College, [email protected]
Follow this and additional works at: https://digitalcommons.colby.edu/jerec
Part of the Agricultural and Resource Economics Commons, Agricultural Economics Commons,
Biodiversity Commons, Economics Commons, Environmental Health Commons, Forest Management
Commons, Natural Resource Economics Commons, Natural Resources and Conservation Commons, Oil,
Gas, and Energy Commons, Sustainability Commons, and the Water Resource Management Commons
Recommended Citation Recommended Citation Carlson, Nils (2015) "Preferences for Coral Reef and Fishery Management in Okinawa, Japan," Journal of Environmental and Resource Economics at Colby: Vol. 2 : Iss. 1 , Article 8. Available at: https://digitalcommons.colby.edu/jerec/vol2/iss1/8
This Article is brought to you for free and open access by Digital Commons @ Colby. It has been accepted for inclusion in Journal of Environmental and Resource Economics at Colby by an authorized editor of Digital Commons @ Colby.

Preferences for Coral Reef and Fishery Management in Okinawa, Japan Preferences for Coral Reef and Fishery Management in Okinawa, Japan
Cover Page Footnote Cover Page Footnote The author expresses his gratitude to Sahan T.M. Dissanayake from Colby College, Payal Shah from the Okinawa Institute of Science and Technology and the Colby College Department of Economics
This article is available in Journal of Environmental and Resource Economics at Colby: https://digitalcommons.colby.edu/jerec/vol2/iss1/8

I. Introduction Economists have developed nonmarket valuation techniques in order to
estimate the value that society places on goods that are not sold in the market. Examples of these non-market goods can be as specific as the abundance of trees in Acadia national park to as broad as the quality of air in a given town. In 2008, The Economics of Ecosystems and Biodiversity (TEEB) report was released in order to draw international attention to the global economic benefits of biodiversity. Within the TEEB report is an environmental-economics valuation toolkit that outlines the different methods one can use to place a dollar value on an ecosystem service. This paper uses one method from that toolkit – a choice experiment survey (CE) – to estimate consumer preferences over various attributes of a coral reef ecosystem in Okinawa, Japan. Coral reefs and coral cover have been widely studied in the economic valuation literature and those studies have placed large valuations on both coral reef protection and the coral reefs themselves.
Choice experiments are valuable beyond having the capability of providing value estimates for changes in specific attributes of an ecosystem service in that the results from them guide complex decisions about how to best carry out and manage ecosystem restoration projects. These experiments can even influence policy decision-making. The United States has historically been the biggest advocate of the environmental protection movement as environmental studies and even environmental economics are being taught in schools. Due to this, awareness of environmental issues such as climate change and degradation, while not overwhelmingly high, is high relative to countries throughout the world. In turn, quantifying preferences for restoration and ecosystem services in countries like Japan are quite useful in order to see how valuable large-scale conservation may be to different countries and cultures throughout the world.
The marine environment of Okinawa provides many services that are not bought and sold in the market. These services include free recreational opportunities, coastal protection and habitats for fish and other marine species. On top of this, humans in many areas of the world rely heavily on coral reefs and residents of Okinawa depend of the reefs in their region for protein intake as well as a livelihood for some individuals. In turn, the environmental, economic and social well being of Okinawa depends on the marine environment’s ability to provide a full range of these services. Okinawa marine ecosystems face a number of threats due to both climate change and human activity. To secure the capacity of coral reefs to supply humanity with ecological goods and services, the resilience of reefs must be conserved
1
Carlson: Preferences for Coral Reef and Fishery Management in Okinawa, Japan
Published by Digital Commons @ Colby, 2015

(Moberg and Folke 1999). One solution to avoid threats to coral reefs is to establish protected areas. The coral reefs and marine environments within protected areas enjoy a higher degree of protection relative to the surrounding areas. Protected areas have a dual benefit outcome in that they not only mitigate potential future damage to the reef, but they also allow the marine environment to recover from any previous damage. The value that Okinawan residents and tourists place on key characteristics provided by the marine environment will be a factor into future policy decision making regarding the protection and conservation of the coral reefs and marine ecosystem services within Okinawa.
II. Literature Review Why do we want to value the environment, and more specifically, the
ecological goods and services of coral reef ecosystems? Coral reefs are among the most productive and biologically diverse ecosystems on Earth. Reefs supply vast number of individuals with goods and services such as recreational possibilities, costal protection, goods and services and cultural and aesthetic benefits (Moberg and Folke, 1999). Coral reef cover ranges from 0.1-0.5% of the ocean floor (Copper, 1994), but reefs hold close to 33% of the world’s marine fish species. More than 100 countries have shorelines and coastlines with coral reefs and in these countries humans depend on the ecological goods and services that these reefs supply. Tens of millions of individuals depend on coral reefs as part of their livelihood or as part of their protein intake. According to Jennings and Polunin [1996], one square kilometer of actively growing reef can support over three hundred people if there were no other protein sources available.
Internalizing the above information, the fact that many coral reefs are in serious decline (Bryant et al., 1998, Moberg and Folke, 1999) is quite alarming. This is especially true for reefs in embayments and near shallow shelves in densely populated areas. Reefs can also be affected by deforestation, intensive agriculture, urbanization and consequent increases of nutrient and sediment loads. Moberg and Folke [1999] conclude that to secure the capacity of coral reefs to supply humanity with ecological goods and services, the resilience of reefs must be conserved. They assert that the loss of resilience is caused by unsustainable uses of the reef itself, unwise and inefficient fisheries management and impacts on the marine environment from many uncoordinated human activities in costal zone and on the land. Human impacts on coral reefs also can have far reaching consequences on adjacent ecosystems, which implies that the conservation and management of coral reefs cannot be done in isolation.
2
Journal of Environmental and Resource Economics at Colby, Vol. 2 [2015], Iss. 1, Art. 8
https://digitalcommons.colby.edu/jerec/vol2/iss1/8

The natural environment provides a variety of uses or benefits to humanity. According to Barbier [1989], these can be broken down into three main types, and the consequent valuation of each type together yields the Total Economic Value (TEV). These three main types are direct uses, which includes both harvesting natural resources for goods as well as tourism; indirect uses in which the benefit to society is gained indirectly from natural habitats through support and protection of other economic activities and are often referred to as natural functions or environmental services; and non-uses, which can be broken down into option value – the benefit received by retaining the option of using a resource in the future by preserving it today – and existence value – the utility gained simply from knowing that something exists (Spurgeon, 1992). In order to form policies that are designed to safeguard the environment, its is necessary to have an understanding of the full value of the environment.
Spurgeon [1992] breaks down the different values of coral reefs and how they are measured. This is a thorough examination of coral reefs and this study only uses one small subset of the valuation techniques – a CE method. Spurgeon [1992] breaks down the direct use values of coral reefs into extractive and non-extractive. Some examples of extractive uses are fisheries – this can be valued using a contingent valuation (CV) in order to account for consumer surplus – pharmaceutical and other industrial uses and construction – coral is used extensively as building blocks and for production of lime. Examples of non-extractive uses are tourism – Spurgeon [1992] used a CE to calculate preferences and WTP for certain reef activities and attributes and the travel cost method, which values an environmental good based on the amount of money individuals spend to travel, sleep and use the resource for recreation – research and education and social values such a the local communities living nearby and utilizing coral reefs. There are also indirect use values associated with coral reefs. Some examples of these are biological support, costal zone extensions, physical protection – the protection that coral reefs afford to the coastline is one of the most significant benefits that the ecosystem provides – and lastly global life support. Finally the last subset of values are the non-use values such as the existence and option values outlined above as well as the argument that there is an intrinsic value for all reefs and their organisms. There are very few costs to consider when analyzing coral reefs and these are usually insignificant when compared to the economic benefits of the same reef (Spurgeon, 1992). These costs include the navigational hazards such as the causation of shipwrecks and preventing access to lands and islands. There seem to be few ways to measure these costs
3
Carlson: Preferences for Coral Reef and Fishery Management in Okinawa, Japan
Published by Digital Commons @ Colby, 2015

other than the excess fuel used to go around the reef and potentially the opportunity costs of forfeited economic activity.
There is extensive literature on the valuation of coral reefs across the world. Van Beukering and Cesar [2004] established the Simple Coral Reef Ecological Economic Model (SCREEM) which incorporates the relevant ecological economic relations by following pathways linking the type of coral reef ecosystem and its uses with the physical goods and services provided by the reef type. The authors used this model to calculate the WTP for conservation of a coral reef in Hanauma Bay in Hawaii. They found that visitors are willing to pay much more for their experience ($10) than they are currently doing. Moreover, they found that the consumer surplus is even larger if the visitors know that the payment is going towards conservation ($12.50). They found that divers are less willing to contribute to conservation than are snorkelers. This potentially could be due to the fact that divers have higher expenditures on equipment or because they are simply more skeptical of the conservations success. An interesting aspect of this study was the valuation of an education program. Some visitors to Hanauma Bay watched a compulsory short film that describes the coral reefs in Hawaii and explains how the visitors can minimize their impacts on the coral reefs. The rest of the visitors do not watch the videos and, in turn, are not exposed to the knowledge within the video. The study found that the net benefit of this education program ($100 million) over time greatly exceeds the cost of the program ($23 million) over time. They also find that values are positively related to the quality and uniqueness of the coral reef on both national and global scales. Van Beukering and Cesar also attempt to tackle the valuation of all of Hawaii’s coral reef ecosystems using the SCREEM model. The authors used a fifty-year time period and a 3% discount rate to find the average annual value of the coral reef ecosystem in Hawaii. They found that this value was $364 million, and when discounted to find the net present value, this valuation totaled $10 billion. This significantly large figure exemplifies the fact that it is worthwhile to conserve, protect and restore this valuable resource.
Another study that reveals that conservation policies that protect the resources that coral reefs hold are warranted is Carr and Mendelsohn’s [2003] valuation of the Great Barrier Reef. To do this, the authors used the travel cost method and found that, on average, the Great Barrier Reef receives over two million visitors a year – making the reef one of the world’s most popular ecotourism sites. They found that the recreational value ranges from $700 million to $1.6 billion per year. Moreover, if you factor in the amount of visitors, this yields an average value between $350 and $800 per visit, per visitor. The study used a 4% discount rate to obtain the recreational net
4
Journal of Environmental and Resource Economics at Colby, Vol. 2 [2015], Iss. 1, Art. 8
https://digitalcommons.colby.edu/jerec/vol2/iss1/8

present value of the Great Barrier Reef. Carr and Mendelsohn found that the net present value of the recreational value of the reef ranges from $18 billion on the low end and reaches as high as $40 billion. This large valuation exemplifies the fact that conservation policies that are aimed at protecting the resources of coral reefs are warranted and should be supported. The two valuations outlined above along with many others tell us that it is highly likely that coral reefs in other parts of the world are also quite valuable. This study is attempting to further that claim.
III. Methodology Economists use CE surveys to elicit preferences for environmental goods
and policies that are generally not sold, or are related to, existing markets (Boxall et al. 1996). Moreover, according to a Lancaster’s consumer theory [1996], consumers obtain utility not from the good itself, but rather from the characteristics of that good. Choice experiments allow the researcher to gain a detailed understanding of the preferences for the good, policy or scenario being analyzed from the respondents. A typical CE survey has the respondents repeatedly choose the best option from several hypothetical choices that have differentiating values in that under each scenario there is a question regarding the amount of payment for each scenario and the respondent must choose how much they are willing to pay for a certain outcome. The first section of this survey asked respondents questions in order to gauge that responder’s level of involvement with the marine environment in Okinawa. The second section presents respondents with opportunities to express preferences for various hypothetical policy scenarios for protecting the coral reefs and marine environment in Okinawa. For each choice, the respondent could choose between three scenarios of possible benefits from marine resources. The first attribute is leisure fish catch, which the survey states that the attribute is the average amount of fish catch available during a recreational fishing trip after 10 years. The second coral coverage and marine biodiversity. The survey defines this attribute as the extent and health of the coral reefs and the number of marine biodiversity found in the Okinawan waters after 10 years. The last attribute in the choice question section is titled as shoreline and costal conditions. The survey defines this attribute as is the extent of coastal development that includes beachfront construction of homes, hotels, restaurants and roads near or on coastal areas and the condition of the beach and shoreline after 10 years. The attributes and levels for the survey instrument are given in Table 1. Lastly, the third section asked demographic questions in order to better understand what factors may or may not affect choices for specific attribute.
5
Carlson: Preferences for Coral Reef and Fishery Management in Okinawa, Japan
Published by Digital Commons @ Colby, 2015

Attribute Description Future Possible Levels in 10 Years Leisure Fish Catch
The average amount of fish catch available during a recreational fishing trip after 10 years.
With protected areas: 20-30% more fish catch 10-20% more fish catch Current conditions remain Without protected areas: 20-30% less fish catch
Coral Coverage and Marine Biodiversity
The extent and health of the coral reefs and the number of marine biodiversity found in the Okinawan waters after 10 years.
With protected areas: 20-30% more coral coverage and biodiversity 10-20% more coral coverage and biodiversity Current conditions remain Without protected areas: 20-30% less coral coverage and biodiversity
Shoreline and Costal Conditions
The extent of coastal development that includes beachfront construction of homes, hotels, restaurants and roads near or on coastal areas and the condition of the beach and shoreline after 10 years.
With protected areas: 20-30% less development with more intact coastal shorelines 10-20% less development and moderately intact coastal shoreline Current conditions remain Without protected areas: 20-30% more development with degraded shoreline
Contribution A monthly contribution will be collected from all Okinawan residents to support the management of these protected areas.
With protected areas: 100 yen per month 200 yen per month 400 yen per month 600 yen per month 800 yen per month 1000 yen per month Without protected areas: Zero
TABLE 1 Attributes and Levels for the Survey
6
Journal of Environmental and Resource Economics at Colby, Vol. 2 [2015], Iss. 1, Art. 8
https://digitalcommons.colby.edu/jerec/vol2/iss1/8

Unique to this survey is the fact that there were two different versions of the survey. The two different versions were differentiated very slightly but are still different enough that the survey version could potentially affect or alter the choices that respondents make. There is a top-down version and a bottom-up version of the survey. The small aspect of variation is in the hypothetical protected areas. In the top-down survey, the survey reads that several protected areas are established by the Central Government to protect the marine ecosystem on the prefecture. The bottom-up survey reads that several protected areas are established by the local communities to protect the marine ecosystem on the prefecture. The difference in the establishment of marine protected areas can alter the respondents’ views on the quality of protected areas and their willingness-to-pay for the protected area. It was assumed that tourists would be somewhat indifferent towards the establishment of these marine protected areas so, in turn; only residents were given the two different versions of the survey. Tourists only received the top-down version. Given the fact that locals are more connected to the marine environment and have a greater understanding as to what aspects of the marine environment need to be either protected or restored than is the central government, it can be hypothesized that residents would be willing to pay more for protected areas that are established by the local communities rather than protected areas established by the central government. In regards to the model and estimation, this study utilized both the standard multinomial (conditional) logit model and the mixed multinomial logit (MMNL) model. The conditional logit model has been used in many valuation studies for environmental goods, however, it assumes that respondents are homogenous with regards to their preferences. In other words, the 𝛽𝑠 (coefficients) are identical across all respondents. Given that the study of preferences does have its place within the field of economics, the conditional logit’s assumption that preferences are homogenous is an often invalid assumption. The MMNL model on the other hand does incorporate heterogeneity of preferences. The main effects specification is as follows: 𝑉𝑞𝑖 = 𝛽1𝑋𝑓𝑖𝑠ℎ𝑐𝑎𝑡𝑐ℎ
+ 𝛽2𝑋𝑐𝑜𝑟𝑎𝑙𝑐𝑜𝑣𝑒𝑟𝑎𝑔𝑒+ 𝛽3𝑋𝑐𝑜𝑠𝑡𝑎𝑙𝑐𝑜𝑛𝑑𝑖𝑡𝑖𝑜𝑛
+ 𝛽4𝑋𝑝𝑎𝑦𝑚𝑒𝑛𝑡 + 𝜀𝑖 (1)
where: 𝑉𝑞𝑖 = the utility gained by person q from alternative i.
7
Carlson: Preferences for Coral Reef and Fishery Management in Okinawa, Japan
Published by Digital Commons @ Colby, 2015
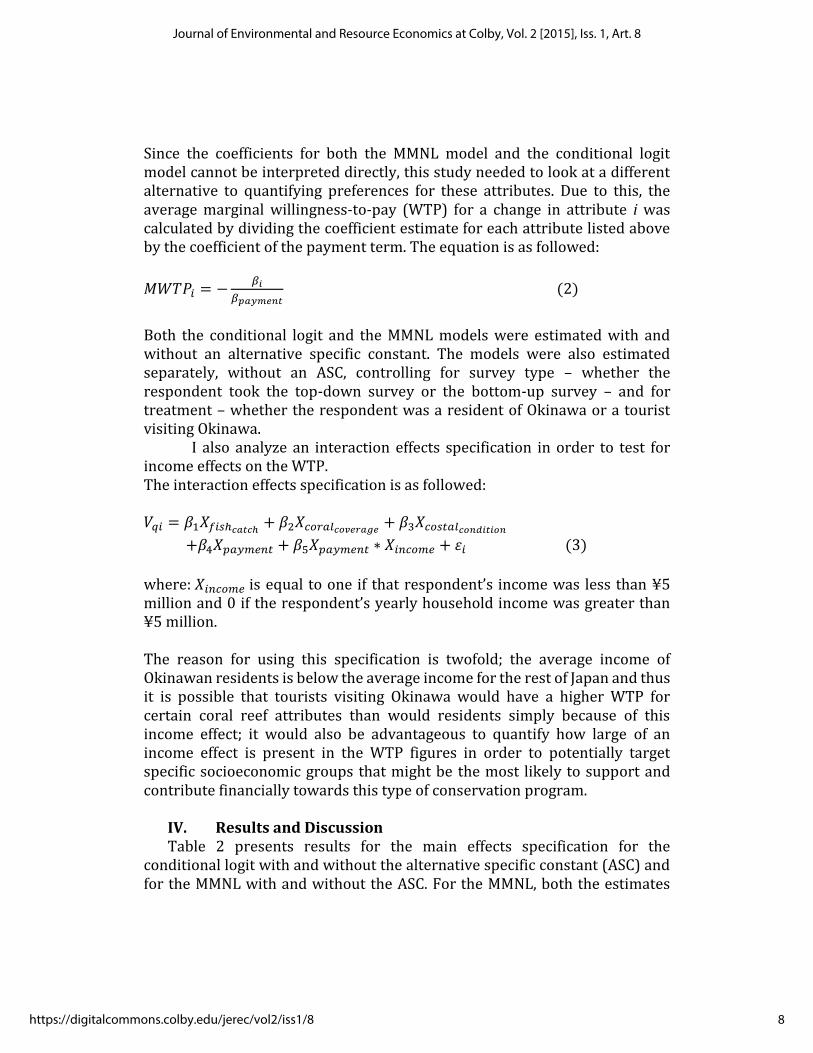
Since the coefficients for both the MMNL model and the conditional logit model cannot be interpreted directly, this study needed to look at a different alternative to quantifying preferences for these attributes. Due to this, the average marginal willingness-to-pay (WTP) for a change in attribute i was calculated by dividing the coefficient estimate for each attribute listed above by the coefficient of the payment term. The equation is as followed:
𝑀𝑊𝑇𝑃𝑖 = −𝛽𝑖
𝛽𝑝𝑎𝑦𝑚𝑒𝑛𝑡 (2)
Both the conditional logit and the MMNL models were estimated with and without an alternative specific constant. The models were also estimated separately, without an ASC, controlling for survey type – whether the respondent took the top-down survey or the bottom-up survey – and for treatment – whether the respondent was a resident of Okinawa or a tourist visiting Okinawa. I also analyze an interaction effects specification in order to test for income effects on the WTP. The interaction effects specification is as followed: 𝑉𝑞𝑖 = 𝛽1𝑋𝑓𝑖𝑠ℎ𝑐𝑎𝑡𝑐ℎ
+ 𝛽2𝑋𝑐𝑜𝑟𝑎𝑙𝑐𝑜𝑣𝑒𝑟𝑎𝑔𝑒+ 𝛽3𝑋𝑐𝑜𝑠𝑡𝑎𝑙𝑐𝑜𝑛𝑑𝑖𝑡𝑖𝑜𝑛
+𝛽4𝑋𝑝𝑎𝑦𝑚𝑒𝑛𝑡 + 𝛽5𝑋𝑝𝑎𝑦𝑚𝑒𝑛𝑡 ∗ 𝑋𝑖𝑛𝑐𝑜𝑚𝑒 + 𝜀𝑖 (3)
where: 𝑋𝑖𝑛𝑐𝑜𝑚𝑒 is equal to one if that respondent’s income was less than ¥5 million and 0 if the respondent’s yearly household income was greater than ¥5 million. The reason for using this specification is twofold; the average income of Okinawan residents is below the average income for the rest of Japan and thus it is possible that tourists visiting Okinawa would have a higher WTP for certain coral reef attributes than would residents simply because of this income effect; it would also be advantageous to quantify how large of an income effect is present in the WTP figures in order to potentially target specific socioeconomic groups that might be the most likely to support and contribute financially towards this type of conservation program.
IV. Results and Discussion Table 2 presents results for the main effects specification for the
conditional logit with and without the alternative specific constant (ASC) and for the MMNL with and without the ASC. For the MMNL, both the estimates
8
Journal of Environmental and Resource Economics at Colby, Vol. 2 [2015], Iss. 1, Art. 8
https://digitalcommons.colby.edu/jerec/vol2/iss1/8

with and without the ASC are all significant at any given level of reasonable significance. This tells us that individual heterogeneity is significant in the MMNL setting for each attribute.
Standard errors in parenthese * p < 0.05, ** p < 0.01, *** p < 0.001
CL w/out
ASC
MMNL w/out
ASC CL w/ ASC MMNL w/ ASC
Choice Choice Choice Choice
main
fish_catch 0.0192*** 0.0381*** 0.00443** 0.00701**
(0.00134) (0.00308) (0.00143) (0.00261)
coral_covera
ge 0.0395*** 0.0668*** 0.0233*** 0.0479***
(0.00137) (0.00340) (0.00148) (0.00320)
costal_condit
ion -0.0280*** -0.0590*** -0.0126*** -0.0152***
(0.00134) (0.00293) (0.00143) (0.00277)
payment -0.00140*** -0.00304*** -0.00197*** -0.00553***
(0.0000494) (0.000151) (0.0000555) (0.000255)
ASC 1.290*** 8.301***
(0.0518) (0.477)
SD
fish_catch 0.0733*** 0.0341***
(0.00414) (0.00554)
coral_covera
ge 0.0840*** 0.0577***
(0.00393) (0.00482)
costal_condit
ion 0.0611*** 0.0469***
(0.00352) (0.00410)
payment 0.00378*** -0.00601***
(0.000165) (0.000296)
ASC -7.741***
(0.403)
Observations 25473 25473 25473 25473
TABLE 2 Regression Results for the Main Effects Specification
9
Carlson: Preferences for Coral Reef and Fishery Management in Okinawa, Japan
Published by Digital Commons @ Colby, 2015

For each model, the conservation attributes fish-catch and coral_coverage have positive and significant coefficients; both of these attributes increase individual utility and should be considered in conservation planning and research. The attributes costal_condition and payment are both significant and negative; individuals prefer the coast to be less developed and more intact and they also prefer inexpensive restoration projects.
Table 3 presents the conditional logit and MMNL results of the main effects specification, but controlling for survey type. Table 4 presents the conditional logit and MMNL results of the main effects specification, but controlling for the treatment – whether the respondent was a resident of Okinawa or a tourist visiting Okinawa. When controlling for survey type, all of the estimate traits from above remained the same. Both fish-catch and coral_coverage have positive and significant coefficients and costal_condition and payment have both significant and negative coefficients. 824 or approximately 68% of the respondents are residents in Okinawa while 389, or 32% of respondents are tourists visiting Okinawa. In continuation with the model controlling for survey type, the model controlling for treatment has no significant changes. The biggest discrepancy between any of the models outlined above is going to be seen in the calculations for marginal willingness to pay in that certain groups may be more sensitive to the amount of money that they would choose to pay each month.
Tables 5, 6 and 7 present the results for the calculations of the marginal willingness to pay. Table. 5 uses the estimates from the results from Table 2 to calculate the MWTP, Table. 6 corresponds to the results from Table 3 and uses those to calculate MWTP and Table 7 corresponds to the estimates from Table. 4 in order to calculate MWTP. We see that in all 3 models, and within each using both the conditional logit and the MMNL that the conservation success measures – fish-catch and coral_coverage – both have significant household values.
Without controlling for any specific aspect of the study, consumers are willing to pay between ¥12.54 and ¥13.72 per month for a one percent increase in the amount of fish available for catch in ten years. A different way of viewing this is that respondents are willing to pay, on the high end, ¥137.2 per month for a 10% increase in the amount of fish available for catch in ten years. Respondents are willing to pay between ¥220.1 and ¥282.6 per month for a 10% increase in the extent and health of marine biodiversity in the Okinawan waters. While respondents do value the ability to fish, they seem to value the health of the coral reef the greatest.
10
Journal of Environmental and Resource Economics at Colby, Vol. 2 [2015], Iss. 1, Art. 8
https://digitalcommons.colby.edu/jerec/vol2/iss1/8

Standard errors in parentheses * p < 0.10, ** p < 0.05, *** p < 0.01
CL Top-Down
Resident
CL Bottom-Up
Resident
MMNL Top-
Down Resident
MMNL
Bottom-Up
Resident
Choice Choice Choice Choice
main
fish_catch 0.00362** 0.00811*** 0.00403** 0.0122**
(0.00270) (0.00268) (0.00441) (0.00483)
coral_coverage 0.0192*** 0.0260*** 0.0381*** 0.0535***
(0.00270) (0.00277) (0.00536) (0.00599)
costal_condition -0.00613*** -0.0134*** -0.00568 -0.0178***
(0.00263) (0.00269) (0.00476) (0.00521)
payment -0.00213*** -0.00191*** -0.00553*** -0.00549***
(0.000102) (0.000103) (0.000417) (0.000474)
ASC 1.369*** 1.153*** 7.513*** 7.522***
(0.0925) (0.0949) (0.623) (0.689)
SD
fish_catch 0.0231*** 0.0366***
(0.00882) (0.00966)
coral_coverage 0.0550*** 0.0559***
(0.00827) (0.00931)
costal_condition -0.0457*** 0.0534***
(0.00714) (0.00774)
payment 0.00519*** 0.00542***
(0.000449) (0.000458)
ASC 8.539*** 6.981***
(0.841) (0.587)
Observations 7596 7236 7596 7236
TABLE 3 Regression Results for the Main Effects Specification, Controlling for Survey Type
11
Carlson: Preferences for Coral Reef and Fishery Management in Okinawa, Japan
Published by Digital Commons @ Colby, 2015

Standard errors in parentheses * p < 0.10, ** p < 0.05, *** p < 0.01
CL Top-Down
Resident
CL Top-Down
Tourist
MMNL Top-
Down Resident
MMNL Top-
Down Tourist
Choice Choice Choice Choice
main
fish_catch 0.00362** 0.00545*** 0.00403** 0.00799**
(0.00270) (0.00273) (0.00441) (0.00478)
coral_coverage 0.0192*** 0.0214*** 0.0381*** 0.0449***
(0.00270) (0.00276) (0.00536) (0.00560)
costal_condition -0.00613*** -0.0147*** -0.00568 -0.0229***
(0.00263) (0.00275) (0.00476) (0.00524)
payment -0.00213*** -0.00194*** -0.00553*** -0.00572***
(0.000102) (0.000105) (0.000417) (0.000518)
ASC 1.369*** 1.413*** 7.513*** 9.579***
(0.0925) (0.0990) (0.623) (0.941)
SD
fish_catch 0.0231*** 0.0306***
(0.00882) (0.00977)
coral_coverage 0.0550*** 0.0437***
(0.00827) (0.00824)
costal_condition -0.0457*** 0.0401***
(0.00714) (0.00917)
payment 0.00519*** 0.00724***
(0.000449) (0.000705)
ASC 8.539*** -8.452***
(0.841) (0.838)
Observations 7596 7002 7596 7002
TABLE 4 Regression Results for the Main Effects Specification, Controlling for Treatment
12
Journal of Environmental and Resource Economics at Colby, Vol. 2 [2015], Iss. 1, Art. 8
https://digitalcommons.colby.edu/jerec/vol2/iss1/8

Standard errors in parentheses * p < 0.05, ** p < 0.01, *** p < 0.00
Standard errors in parentheses * p < 0.10, ** p < 0.05, *** p < 0.01
CL w/out ASC MMNL w/out
ASC CL w/ ASC
MMNL w/
ASC
Choice Choice Choice Choice
fish 13.72*** 12.54*** 2.246** 1.268**
(0.973) (1.113) (0.731) (0.474)
coral 28.26*** 22.01*** 11.83*** 8.657***
(1.158) (1.347) (0.797) (0.629)
coast -20.04*** -19.45*** -6.376*** -2.749***
(0.947) (1.160) (0.730) (0.509)
Observations 25473 25473 25473 25473
CL Top-Down
Resident
CL Bottom-
Up Resident
MMNL Top-
Down
Resident
MMNL
Bottom-Up
Resident
Choice Choice Choice Choice
fish 1.697* 4.238*** 0.730* 2.214**
(1.272) (1.422) (0.800) (0.895)
coral 8.994*** 13.57*** 6.896*** 9.750***
(1.298) (1.535) (0.992) (1.145)
coast -2.871* -7.016*** -1.027 -3.241***
(1.233) (1.427) (0.866) (0.974)
Observations 7596 7236 7596 7236
TABLE 5 Marginal Willingness to Pay
TABLE 6 Marginal Willingness to Pay Controlling for Survey Type
13
Carlson: Preferences for Coral Reef and Fishery Management in Okinawa, Japan
Published by Digital Commons @ Colby, 2015

Standard errors in parentheses * p < 0.10, ** p < 0.05, *** p < 0.01
The WTP calculations controlling for both survey type and treatment
internalize the presence of the ASC, which, as we see from Table. 5, lowers the magnitude of the WTP estimates. We can see from Table. 6 and Figure. 1, which is found below and depicts the discrepancies between the WTP by the survey types, that residents have a higher WTP for a one percent increase in the amount of fish available for catch in ten years and a one percent increase in the extent and health of marine biodiversity in the Okinawan waters if the marine protected areas are established by the local communities of Okinawa rather than by the central government. Residents are, on average, willing to pay about ¥30 more per month for a 10% increase in in the amount of fish available for catch in ten years if the local community establishes the marine protected areas. Moreover, residents are, on average, willing to pay around ¥50 more per month for a 10% increase in the extent and health of marine biodiversity in the Okinawan waters if the local community establishes the marine protected areas. There is a statistically significant difference in the WTP estimates for fish-catch, coral_coverage as well as for costal_condition. If we combine this knowledge with the information from Table. 7, that shows that residents have a lower WTP for the fish-catch attribute than do tourists, we can conclude that residents of Okinawa are more concerned with the health and extent of marine biodiversity and the shoreline rather than having
CL Top-
Down
Resident
CL Top-
Down Tourist
MMNL Top-
Down Resident
MMNL Top-
Down
Tourist
Choice Choice Choice Choice
fish 1.697* 2.803** 0.730* 1.397*
(1.272) (1.422) (0.800) (0.844)
coral 8.994*** 11.04*** 6.896*** 7.843***
(1.298) (1.481) (0.992) (1.048)
coast -2.871** -7.547*** -1.027* -3.993***
(1.233) (1.443) (0.866) (0.951)
Observations 7596 7002 7596 7002
TABLE 7 Marginal Willingness to Pay Controlling for Treatment
14
Journal of Environmental and Resource Economics at Colby, Vol. 2 [2015], Iss. 1, Art. 8
https://digitalcommons.colby.edu/jerec/vol2/iss1/8

the ability to be able to fish the waters of Okinawa. Thus, residents prefer a program in which the local communities establish the marine protected areas and that focus on the conservation and restoration of the health of the coral reefs and the number of marine biodiversity in the Okinawan waters.
The information from Table. 7 exemplifies the fact residents have a lower WTP on average for the different attributes than do tourists visiting Okinawa. This information is further solidified by Figure. 2 below, which depicts the differences in the WTP when controlling for treatment. On average, tourists are willing to pay ¥10 more per month for a 10% increase in in the amount of fish available for catch in ten years than are residents of Okinawa. Moreover, tourists are, on average, willing to pay ¥20 more per month for a 10% increase in the extent and health of marine biodiversity in the Okinawan waters than are residents of Okinawa. Unlike the WTP estimates when controlling for survey type, none of these estimates are
FIGURE 1 Willingness-to-Pay by Survey Type
15
Carlson: Preferences for Coral Reef and Fishery Management in Okinawa, Japan
Published by Digital Commons @ Colby, 2015

significantly different from one another. One potential hypothesis to describe the lower willingness to pay of residents for fish-catch when compared to tourists builds off of the discussion at the end of the prior paragraph. Okinawa is a large marine tourist destination, so generally those that come to visit Okinawa are there to either fish, swim, snorkel or pursue some other form of water activity. On the other hand, residents of Okinawa tend not to use the water recreationally as much as tourists do. Many of the residents pray to the water and view it as something spiritual. These two facts could factor in to the lower WTP for the fish-catch attribute when comparing residents and tourists. As is described earlier, another potential reason for the lower WTP estimates for residents of Okinawa could be simply that tourists visiting Okinawa have a higher yearly income, and thus more disposable income, than do residents.
Figure. 3 and Figure. 4 present the distribution of income by treatment type.
FIGURE 2 Willingness-to-Pay by Treatment
16
Journal of Environmental and Resource Economics at Colby, Vol. 2 [2015], Iss. 1, Art. 8
https://digitalcommons.colby.edu/jerec/vol2/iss1/8

Income group one in the above graph corresponds to a household income of less than ¥1 million. Group two is a household income of between ¥1 million and ¥2 million. Group three corresponds to a household income between ¥2 million and ¥5 million. Group four is a household income of between ¥5 million and ¥7 million and group 5 is a household income of more than ¥7 million. Group 6 corresponded to a response, “I don’t know / don’t want to answer.” We can see from these distribution plots that the average resident of Okinawa resides in group three while the average tourist resides in group five. This tells us that, among respondents, tourists visiting Okinawa do indeed have a higher household income, on average, than do residents of Okinawa. Moreover, the average gross income for Japan is approximately ¥3.8 million, which reveals that amongst respondents, tourists had a tendency to have an above average income.
FIGURE 3 Resident Income Distribution
FIGURE 2 Tourist Income Distribution
17
Carlson: Preferences for Coral Reef and Fishery Management in Okinawa, Japan
Published by Digital Commons @ Colby, 2015

Table. 8 presents the estimation results for the interaction effects specification. The signs and significance of the attributes remains the same, however fish-catch is now only significant at the 10% level of significance. The negative and significant nature of the coefficient of the interaction term highlights the fact that there is a significant income effect within this survey and that those with lower incomes tend to receive a lower utility to a more expensive program than do those with a higher income. Table. 9 presents the WTP estimates for those residents that took the bottom-up version of the survey and separates those estimates into a high-income group and a low-income group. Table. 10 presents the WTP estimates for those residents that took the top-down version of the survey and separates into two groups in the same manor that Table. 9 does. We still see the presence of a higher WTP for those respondents taking the bottom-up survey and we also see an income effect. Higher income residents were willing to pay on average ¥10 higher per month for a 10% increase in the amount of fish available for catch in ten years than were low income residents. Higher income residents were also
FIGURE 4 Tourist Income Distribution
18
Journal of Environmental and Resource Economics at Colby, Vol. 2 [2015], Iss. 1, Art. 8
https://digitalcommons.colby.edu/jerec/vol2/iss1/8

Standard errors in parentheses * p < 0.10, ** p < 0.05, *** p < 0.01
CL Top-Down
Resident
CL Top-Down
Tourist
MMNL Top-
Down Resident
MMNL Top-
Down Tourist
Choice Choice Choice Choice
main
fish_catch 0.00430* 0.00416* 0.00484* 0.00615*
(0.00298) (0.00485) (0.00298) (0.00507)
coral_coverage 0.0199*** 0.0400*** 0.0214*** 0.0427***
(0.00297) (0.00535) (0.00301) (0.00583)
costal_conditio
n -0.00789*** -0.00997 -0.0124*** -0.0202***
(0.00289) (0.00512) (0.00299) (0.00575)
payment -0.00205*** -0.00456*** -0.00180*** -0.00539***
(0.000170) (0.000634) (0.000128) (0.000670)
cost_timesinco
me -0.000219* -0.00175** -0.000468** -0.00154*
(0.000181) (0.000792) (0.000188) (0.000892)
ASC 1.410*** 8.406*** 1.585*** 9.233***
(0.102) (0.891) (0.110) (0.966)
SD
fish_catch -0.0253*** -0.0264***
(0.00890) (0.00988)
coral_coverage 0.0370*** -0.0405***
(0.00990) (0.00939)
costal_conditio
n -0.0437*** -0.0422***
(0.00805) (0.00946)
payment -0.00434*** -0.00724***
(0.000571) (0.000731)
cost_timesinco
me 0.00328*** 0.00207
(0.000570) (0.00121)
ASC 9.299*** -7.760***
(0.967) (0.875)
Observations 6300 6300 5868 5868
TABLE 8 Regression Results for Interaction Effects Specification
19
Carlson: Preferences for Coral Reef and Fishery Management in Okinawa, Japan
Published by Digital Commons @ Colby, 2015

Standard errors in parentheses * p < 0.05, ** p < 0.01, *** p < 0.001
Standard errors in parentheses * p < 0.05, ** p < 0.01, *** p < 0.001
willing to pay, on average, around ¥25 per month more for a 10% increase in the extent and health of marine biodiversity in the Okinawan waters in the next ten years. Table. 11 presents the WTP for those respondents that were tourists and also splits the estimates into a high-income and a low-income group. Similar to the above analysis, higher income tourists had a higher WTP for
BU – Resident – High Income BU – Resident – Low Income
CL MMNL CL MMNL
fish 5.310** 2.204* 4.104** 2.026*
(1.920) (1.063) (1.452) (0.947)
coral 16.79*** 10.34*** 12.98*** 9.503***
(2.461) (1.597) (1.595) (1.279)
coast -8.247*** -3.172** -6.374*** -2.916**
(1.988) (1.145) (1.460) (1.008)
Observations 5940 5940 5940 5940
TD – Resident – High Income TD – Resident – Low Income
CL MMNL CL MMNL
fish 2.093 0.890 1.891 0.612
(1.463) (1.108) (1.317) (0.759)
coral 9.672*** 9.527*** 8.740*** 6.552***
(1.607) (1.722) (1.352) (0.938)
coast -3.841** -2.366 -3.471** -1.627*
(1.432) (1.218) (1.274) (0.805)
Observations 6300 6300 6300 6300
TABLE 9 Marginal Willingness to Pay for Residents: Bottom-Up / Income
/
TABLE 10 Marginal Willingness to Pay for Residents: Top-Down / Income
20
Journal of Environmental and Resource Economics at Colby, Vol. 2 [2015], Iss. 1, Art. 8
https://digitalcommons.colby.edu/jerec/vol2/iss1/8

Standard errors in parentheses * p < 0.05, ** p < 0.01, *** p < 0.001
conservation than did low income tourists. An interesting result when looking at the WTP for residents and tourists and controlling for income is that even the low-income tourists have a higher WTP for these conservation attributes than do low-income residents. On average, low income tourists are willing to pay ¥10 more per month for a 10% increase in both the amount of fish available for catch in ten years and the extent and health of marine biodiversity in the Okinawan waters than are low income residents.. This then, tells us that it is not simply an issue of income as to why the residents have a lower willingness to contribute financially for the conservation and preservation of these conservation attributes.
V. Conclusion This study is an example of how a nonmarket valuation method – a choice
experiment – can be used to influence and guide ecosystem conservation efforts. Using a choice experiment survey, this study estimates the willingness to pay (WTP) for certain hypothetical attributes of a restored and conserved coral reef in Okinawa, Japan. This study finds that an increase in the amount of fish available to catch in ten years as well as an increase in the extent and health of the coral reefs and the number of marine biodiversity found in the Okinawan waters after ten years, both positively affect respondents’ utility. This implies that these conservation success measures should be taken into account in conservation planning in research in the future. Diving into the data in a more focused manor reveals that residents are, on average, willing to pay about ¥30 more per month for a 10% increase in in the amount of fish
TD – Tourist – High Income TD – Tourist – Low Income
CL MMNL CL MMNL
fish 2.694 1.140 2.137 0.887
(1.675) (0.954) (1.333) (0.734)
coral 11.93*** 7.927*** 9.461*** 6.169***
(1.807) (1.321) (1.459) (0.982)
coast -6.897*** -3.750** -5.470*** -2.919***
(1.708) (1.145) (1.373) (0.858)
Observations 5868 5868 5868 5868
TABLE 11 Marginal Willingness to Pay for Tourists: Top-Down / Income
21
Carlson: Preferences for Coral Reef and Fishery Management in Okinawa, Japan
Published by Digital Commons @ Colby, 2015

available for catch in ten years if the local community establishes the marine protected areas rather than the central government and the same residents are, on average, willing to pay around ¥50 more per month for a 10% increase in the extent and health of marine biodiversity in the Okinawan waters if the local community establishes the marine protected areas. This implies that residents do have a preference as to the establishment of the marine protected areas and the Okinawan residents would like the local communities to establish these. Looking at the survey in a different way reveals that on average, tourists are willing to pay ¥10 more per month for a 10% increase in in the amount of fish available for catch in ten years than are residents of Okinawa. Tourists are also, on average, willing to pay ¥20 more per month for a 10% increase in the extent and health of marine biodiversity in the Okinawan waters than are residents of Okinawa. Given that respondents participating in this survey that were tourists visiting Okinawa have an above average income, this can partly explain this strange outcome. However, we then see that even when controlling for income, that low income tourists are willing to pay ¥10 more per month for a 10% increase in both the amount of fish available for catch in ten years and the extent and health of marine biodiversity in the Okinawan waters than are low income residents. While income is a factor, the fact that tourists come to Okinawa in order to interact with marine life also must inevitably be a factor in the tourists’ higher willingness to contribute to these different conservation success attributes. References: Cesar, H. S. J. (Herman S. J. ., & Beukering, P. Van. (2004). Economic valuation of the
coral reefs of Hawaii. Pacific Science, 58(2), 231–242. http://doi.org/10.1353/psc.2004.0014
Dissanayake, S. T. M., & Ando, A. W. (2014). Valuing Grassland Restoration: Proximity to Substitutes and Trade-offs among Conservation Attributes. Land Economics, 90(2), 237–259. Retrieved from http://le.uwpress.org/content/90/2/237.abstract?etoc
Haven, N. (1995). Valuing coral reef protection.pdf, 26(2), 119–131. Moberg, F., & Folke, C. (1999). Ecological goods and services of coral reef ecosystems.
Ecological Economics, 29(2), 215–233. http://doi.org/10.1016/S0921-8009(99)00009-9
Spurgeon, J. P. G. (1992). The economic valuation of coral reefs. Marine Pollution Bulletin, 24(11), 529–536. http://doi.org/10.1016/0025-326X(92)90704-A
Wielgus, J., Cooper, E., Torres, R., & Burke, L. (2010). Coastal Capital : Dominican Republic: Case studies on the economic value of coastal ecosystems in the Dominican Republic. World, (April), 42.
22
Journal of Environmental and Resource Economics at Colby, Vol. 2 [2015], Iss. 1, Art. 8
https://digitalcommons.colby.edu/jerec/vol2/iss1/8