preferred orientation patterns of phyllosilicates in ... 65/65_5_329.pdf · preferred orientation...
TRANSCRIPT

PREFERRED ORIENTATION PATTERNS OF PHYLLOSILICATES
IN SURFACE CLAYS
H.-R. WENK1
AND R. VASIN1 , 2
1 Department of Earth and Planetary Science, University of California, Berkeley, California, USA2 Joint Institute for Nuclear Research, Dubna, Moscow Region, Russia
Abstract—The alignment of phyllosilicates in clays has received a lot of attention because it is a majorcause of seismic anisotropy in the Earth’s crust. Thus far, all attention has been on shales where theorientation pattern has been attributed to compaction and observed to increase with burial depth anddiagenetic processes. Here, for the first time, the same methods that were developed to quantify shalepreferred orientation were applied to clays forming in surface environments, a seasonal streambed in DeathValley, California; a mudpool from mud volcanoes in Imperial Valley, California, close to the Salton Sea;and a glacial lake from Val Albigna in the Swiss Alps. Preferred orientation was analyzed quantitativelywith high-energy synchrotron X-ray diffraction. All three samples showed strong alignment ofphyllosilicates with (001) pole figure maxima 2�4 multiples of a random distribution, comparable toshales, and indicating that significant preferred orientation can be produced at surface conditions. Theoriginal alignment during sedimentation may be an important factor for the final microstructure in manyshales.
Key Words—Albigna Glacial Lake, Clay Fabric, Death Valley, Preferred Orientation, Salton Sea MudVolcanoes, Surface Clays, Synchrotron X-rays.
INTRODUCTION
Phyllosilicate-rich sediments and sedimentary rocks
are generally highly anisotropic. Much attention has
been given to them as capstones of oil and gas reservoirs
and as seals in the context of nuclear waste repositories
and carbon dioxide storage (e.g. Chadwick et al., 2004;
Aplin and Larter, 2005; Bossart and Thury, 2007;
Almquist and Mainprice, 2017). The anisotropy of
physical properties, such as acoustic wave velocities, is
due to the alignment of platelet-shaped phyllosilicate
crystals and pores. This preferred orientation (also
referred to as fabric or texture) in shales is thought to
increase with burial depth and compaction (e.g. Aplin et
al., 2006), diagenesis (e.g. Ho et al., 1999), and
phyllosilicate content (e.g. Curtis et al., 1980) and is
used in rock-physics models to predict elastic anisotropy
(e.g. Ruud et al., 2003; Dræge et al., 2006). Orientation
patterns are moderate in shales, with platelets aligning in
the bedding plane and concentrating 2�10 times
compared to a random pattern (multiples of random
distribution or m.r.d.). In recrystallized metamorphic
slates, schists, and gneisses, orientations can be stronger
with concentrations reaching 20�50 m.r.d. (e.g. Wenk et
al., 2010; Haerinck et al., 2015).
The purpose of the present study was to quantify for
the first time the phyllosilicate orientation patterns in
clays forming at surface conditions by investigating
three different types of clay-rich environments, namely,
dried surface-mud deposits from a seasonal stream in
Death Valley, California, clay from mud volcanoes in
Imperial Valley, California, and mud from a glacial lake
deposit in the Swiss Alps, using hard synchrotron X-rays
to record diffraction images and to quantify preferred
orientation patterns with a modified Rietveld method
(Lutterotti et al., 2014).
SAMPLES AND EXPERIMENTS
The first sample, DV1, was collected in a dry
seasonal stream bed East of Stovepipe Wells, Death
Valley National Park, California, between highway 190
and the Mesquite Flat sand dunes (Figure 1a, coord.
36º36’21’’N/117º6’58’’W). On the outcrop, the clay
formation is dry and exhibits typical hexagonal desicca-
tion cracks. The second sample, SS2, is a brownish clay
from an outcrop near the Davis and Schrimpf road
intersection in Niland, Imperial Valley, California, near
the Salton Sea (coord. 33º11’55’’N/115º 34’46’’W) and is
part of mud volcanoes that are currently active (e.g.
Helgeson, 1968; Sturz, 1989; Rudolph and Manga, 2010)
(Figure 1b). The sample used in the present study was
collected from a dry site, again characterized by mud
cracks. The third sample, Brg1644, is from a small
glacial lake in Val Albigna, southeastern Switzerland
(coord. 46º19’31’’N/9º38’57’’E), between the end of the
glacier and a large reservoir used for hydroelectric
power (Figure 1c).
The microstructure was first explored with scanning
electron microscopy (SEM), using a Zeiss Evo MA10
SEM instrument (Oberkochen, Germany), equipped with
* E-mail address of corresponding author:
DOI: 10.1346/CCMN.2017.064069
Clays and Clay Minerals, Vol. 65, No. 5, 329–341, 2017.

an EDAX energy-dispersive spectroscopy (EDS) system
at UC Berkeley, and a JEOL SEM (JEOL IT 300,
Akishima, Japan), at the Engineering Faculty of the
University of Trento in Mesiano, Italy. For the SEM
study, broken fragments of the clay samples were coated
with carbon to prevent charging. At both facilities,
samples were analyzed in high-vacuum mode. In
electron backscatter images (Figure 2), bright shades
are indicative of high atomic numbers. Elemental
compositions of Death Valley clay and Salton Sea clay
were established by EDS spectroscopy, averaging over
an area 1 mm61 mm (Figure 3).
The hard X-ray synchrotron diffraction measurements
were performed at beamline BESSRC 11-ID-C of the
Advanced Photon Source at Argonne National
Laboratory (see Wenk et al., 2010 for details of the
Figure 1. Outcrop pictures. (a) Death Valley, California, USA,
near Mesquite Flat sand dunes. Notice hexagonal pattern of
drying cracks (courtesy of Instagram@ExtremeNature). (b)
Mud volcano in Imperial Valley, California, USA, near Salton
Sea. (c) Val Albigna, Swiss Alps with a mud pond in the
foreground and the glacier in the back.
Figure 2. SEM backscattered images of microstructures:
(a) Death Valley, (b) Salton Sea mud volcano, and (c) Val
Albigna glacial pond. For mineral abbreviations see Table 1.
The white line indicates the bedding plane.
330 Wenk and Vasin Clays and Clay Minerals

texture measurements). A monochromatic X-ray beam
with a wavelength l = 0.10798 A and a beam diameter
of 1 mm was used for the investigation of samples DV1
and SS2, while a wavelength of 0.117418 A was used to
record diffraction patterns of the Brg1644 sample. To
ensure a uniform system for graphic representations of
diffraction patterns, a scattering vector magnitude
q = 2p/d = (4p siny/l) was used for the horizontal axis
rather than the scattering angle 2y. Diffraction images
were recorded with a Perkin Elmer 1621 amorphous
silicon detector (2048 pixels62048 pixels) (Perkin
Elmer, Waltham, Massachussetts, USA), at a distance
of ~200 cm from the sample. For DV1 and SS2, the
samples were slabs 2 mm thick and analyzed dry, as
collected in the field. Sample Brg1644 was formed into a
cylinder, ~3 mm in diameter, extracting it with a kapton
tube, and was analyzed wet. The samples were mounted
on a goniometer with the axis perpendicular to the
incident beam and aligned with the rotation axis
centered on the beam and perpendicular to it
Figure 3. SEM-EDS spectra of (a) Death Valley and (b) Salton Sea clays and normalized estimated atomic composition of major
elements, excluding O. Scale is energy (keV).
Vol. 65, No. 5, 2017 Alignment of phyllosilicates in clays 331

(�0.1 mm) and then rotated in 15º increments around the
normal to the bedding plane from �45º to +45º (slabs of
DV1 and SS2), and from �90º to +75º (cylinder of
Brg1644). The rotations were necessary to obtain
adequate pole figure coverage to determine preferred
orientation. At each rotation position, diffraction images
(Figure 4) were recorded while the sample was
translated 2 mm parallel to the rotation axis to obtain a
representative volume average over ~6 mm3.
Mineralogical compositions and preferred orienta-
tions were obtained by applying a modified Rietveld
refinement (Rietveld, 1969) implemented in the software
MAUD (for details and a step-by-step tutorial see
Lutterotti et al., 2014, and Wenk et al., 2014). The
Rietveld method obtains a best fit between measured
diffraction patterns and a model based on a number of
refined parameters, such as instrument geometry and
resolution, background approximated by a polynomial
Figure 4. Synchrotron diffraction images comparing three surface clays: (a) Death Valley DV1; (b) Salton Seamud volcano SS2; and
(c) Val Albigna glacial lake Brg1644; with (d) Kimmeridge shale (Vasin et al., 2013). Some Debye rings of phyllosilicates showing
intensity variations along azimuthal angle expressing crystallite preferred orientation are marked: I-M (illite-mica), Mm
(montmorillonite), Kao (kaolinite), Chl (chlorite), Bio (biotite), Vm (vermiculite), I-S (illite-smectite). Intensive peaks of several
randomly oriented minerals, such as quartz (Q), calcite (Cc), and albite (Ab) are also indicated. Inserts show enlarged low-angle
regions of corresponding diffraction images with overlapped phyllosilicate peaks. All images are rotated so that the bedding plane is
horizontal. Note that image (c) was measured with a slightly different wavelength.
332 Wenk and Vasin Clays and Clay Minerals
function, phase volume fractions, unit-cell parameters,
crystal structure, preferred orientations, grain size, etc.
First, instrument geometry was established by refining a
diffraction image from a LaB6 standard. Then diffraction
images, measured at different sample tilts, were used to
refine structure and microstructure parameters and
determine preferred orientation of the phyllosilicates in
the clay samples. Images were integrated over 10º
azimuthal sectors in the ImageJ (Schneider et al.,
2012) MAUD plugin to obtain 36 conventional diffrac-
tion patterns at different azimuthal angles (a stack is
shown in Figure 5, lower). This produced a total of
7636 = 252 diffraction patterns for DV1 and SS2 and
12636 = 432 patterns for Brg1644, and all patterns of
each sample were refined simultaneously. For the
Rietveld analysis, a scattering angle range from 0.28º
to 3.5º2y was applied (corresponding to q values of
0.3�3.2 A�1).
After the examination of SEM and diffraction images,
seven mineral phases were considered for the DV1
refinement: montmorillonite, illite-muscovite, kaolinite,
albite, orthoclase, quartz, and analcime; for the SS2
sample, ten components were used (montmorillonite,
illite-muscovite, kaolinite, albite, chlorite, orthoclase,
quartz, calcite, dolomite and pyrite); for Brg1644, seven
components were used (biotite, vermiculite, chlorite,
oligoclase, orthoclase, quartz, and hornblende).
The crystallographic information entered into MAUD
as .cif files was from the literature: montmorillonite
(Gournis et al., 2008; amcsd #0009126), kaolinite (Bish
and Von Dreele, 1989; amcsd #0012232), clinochlore/
chlorite (Zanazzi et al., 2009; amcsd #0007298), illite-
muscovite (Gualtieri, 2000; amcsd #0012865), biotite
(Brigatti and Davoli, 1990; amcsd #0001298), vermicu-
lite (de la Calle et al., 1977; amcsd # 0012759), quartz
(Antao et al., 2008; amcsd #0006212), albite (Downs et
al., 1994; amcsd #0001683), oligoclase An28 (Phillips et
al., 1971; amcsd #0010722), orthoclase (Tseng et al.,
1995; amcsd #0007928), calcite (Markgraf and Reeder,
1985; amcsd #0000984), dolomite (Ross and Reeder,
1992; amcsd #0001453), hornblende (Mancini et al.,
1996; amcsd #0005506). pyrite (Rieder et al., 2007;
amcsd #0012728), and analcime (Gatta et al., 2006;
amcsd #0004134).
In addition to mineral-volume fractions, relevant
unit-cell and microstructure parameters of minerals
were also refined, while atomic position coordinates
and occupancies were kept fixed. Due to the complexity
of diffraction patterns, no attempt was made to refine all
crystallographic parameters, nor to impose anisotropic
crystallite shapes for phyllosilicates.
The montmorillonite structure in DV1 and SS2
showed characteristic diffraction-peak broadening
caused by stacking disorder. This factor was taken into
account with the Ufer et al. (2004) method implemented
in MAUD as the ‘‘Ufer single layer’’ model (Lutterotti et
al., 2010).
Intensity variations along some Debye rings
(Figure 4) indicated immediately preferred orientation
of clay minerals, e.g. montmorillonite (Mm) and illite-
mica (I-M); by contrast, rings, e.g. for quartz (Q) and
calcite (Cc), had uniform intensity. For comparison, a
diffraction image (Figure 4d) of a typical sedimentary
shale was added: Kimmeridge shale (Hornby, 1998;
Vasin et al., 2013). In Kimmeridge shale from consider-
able depth (>3000 m) the montmorillonite (peak at low
angles, most notable in Death Valley clay) is missing.
Qualitatively, intensity variations of phyllosilicate
Debye rings of Kimmeridge shale are comparable to
Death Valley clay.
Only phyllosilicates display significant preferred
orientation and feldspars, quartz, and other minerals
were considered to be randomly oriented. The E-WIMV
model (Matthies and Vinel, 1982; Matthies, 2002), with
a 10º resolution in orientation space, was used to refine
phyllosilicate orientation distribution functions (ODF),
without imposing axial symmetry around the bedding-
plane normal. The 3D ODFs were exported from MAUD
in a standard 5º65º65º grid, and smoothed with a 7.5º
Gaussian filter in the BEARTEX software (Wenk et al.,
1998). The ODF was rotated to bring the bedding plane
normal into the center of pole figures and corresponding
pole figures were plotted in equal area projection. In all
the texture-related calculations, the first setting for
monoclinic crystals was used, as prescribed by
E-WIMV algorithm rules, i.e. (100) is the cleavage
plane of illite-muscovite, instead of the more familiar
second setting with (001) as the cleavage plane
(Matthies and Wenk, 2009). For labels of Miller indices
(hkl) throughout this paper, the conventional second
setting is used for monoclinic crystals, with (001) as the
cleavage plane.
A polynomial function with five coefficients was
applied to refine the background of each diffraction
pattern. Broad intense peaks are visible on patterns of
DV1 and SS2 samples at scattering angles 2y < 0.5º
(d >12.5 A) (Figures 4, 5) that are partially blocked by
the beamstop. They can be interpreted as small-angle
scattering from thin oriented montmorillonite and illite-
mica platelets. In the refinement they were considered as
additional background peaks in the same manner as for
Kimmeridge shale (Wenk et al., 2014).
The complexities of the diffraction pattern are most
clearly visible in an average diffraction pattern over 36
individual patterns with different azimuths (Figure 6).
Many diffraction peaks were contributed by the con-
stituent phases (ticks below). The dot pattern is the
measurement and the line is the Rietveld fit. The quality
of the refinement can be assessed by comparing
measured and calcula ted di f f rac t ion pat terns
(Figures 5, lower and upper, and 6). The similarity in
peak positions and intensity distributions give confi-
dence in the quality of the refinement and agreement for
rather fine-grained Death Valley and Salton Sea clays is
Vol. 65, No. 5, 2017 Alignment of phyllosilicates in clays 333

Figure 5. Unrolled diffraction images of: (a) Death Valley DV1; (b) Salton sea mud volcano SS2; and (c) Val Albigna glacial lake
Brg1644 samples displaying intensity (gray shade) as a function of scattering vector magnitude q = 2p/d and azimuthal angle in
diffraction image (corresponding to Figure 4), now made up of 36 diffraction patterns (numbered 0 through 35 on the left axis). For
every image, the lowermost patterns show experimental intensities and uppermost patterns are the corresponding Rietveld
refinement. For mineral abbreviations see Table 1.
334 Wenk and Vasin Clays and Clay Minerals
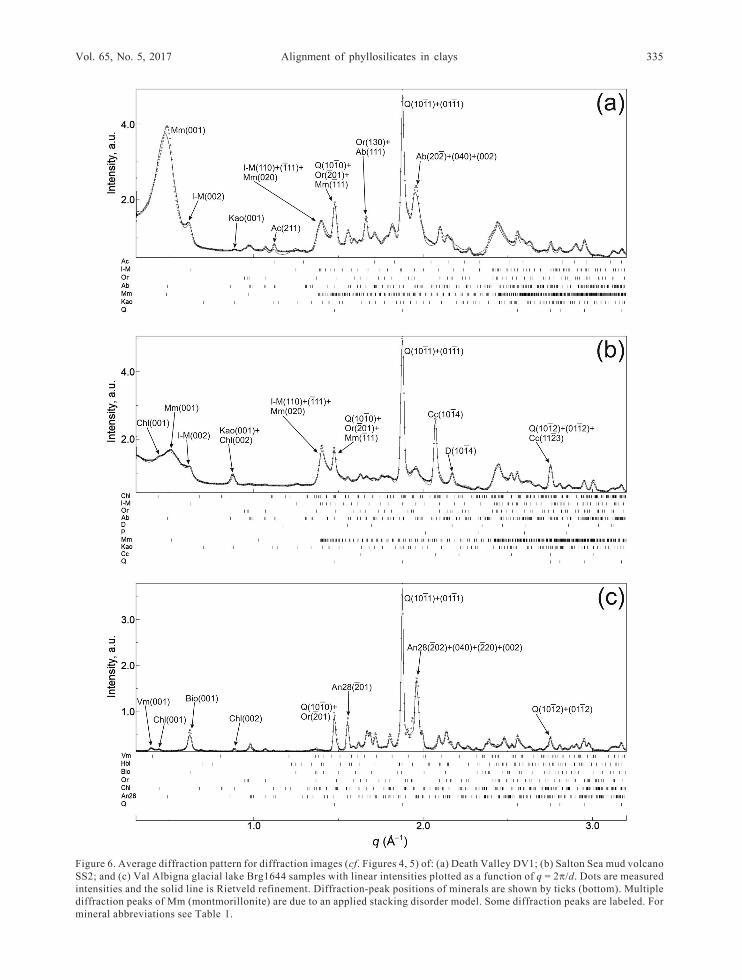
Figure 6. Average diffraction pattern for diffraction images (cf. Figures 4, 5) of: (a) Death Valley DV1; (b) Salton Sea mud volcano
SS2; and (c) Val Albigna glacial lake Brg1644 samples with linear intensities plotted as a function of q = 2p/d. Dots are measured
intensities and the solid line is Rietveld refinement. Diffraction-peak positions of minerals are shown by ticks (bottom). Multiple
diffraction peaks of Mm (montmorillonite) are due to an applied stacking disorder model. Some diffraction peaks are labeled. For
mineral abbreviations see Table 1.
Vol. 65, No. 5, 2017 Alignment of phyllosilicates in clays 335

excellent (Figure 5). In the case of Val Albigna, the
model was not able to refine the spotty reflections from
individual quartz and feldspar crystallites but provided a
satisfactory fit for textures of phyllosilicates.
RESULTS
The microstructures of all three samples are complex,
as easily seen in SEM backscatter images (Figure 2).
Within clusters of angular fragments, mainly quartz and
feldspar, grains of phyllosilicates are observed. Some
larger platelets, of illite-muscovite, are obviously
oriented and define the bedding plane, indicated on the
figures with white lines.
In the Death Valley clay (Figure 2a), a wide range of
grain sizes is found. Large quartz fragments are ~10 mmin diameter, illite-mica platelets have lengths of
10�20 mm. In addition, a fine-grained matrix composed
of montmorillonite and kaolinite is also present. Debye
rings of quartz and feldspars in DV1 (Figure 4a) show
occasional spots, characteristic of scattering by larger
grains.
For the Salton Sea sample (Figure 2b), grain size is
intermediate with granular quartz, feldspar, and calcite
5�10 mm long, detrital illite-mica 10�20 mm long, and
fine-grained montmorillonite and kaolinite 1�5 mmlong. Fine montmorillonite is also layered but the
alignment is less regular than for coarser illite-mica.
The simplest microstructure is observed in Val
Albigna clay with oriented phyllosilicates in a granular
matrix, with no secondary clay minerals (Figure 2c).
This clay, when dried, loses its coherency, contrary to
the other two. Mica platelets are ~1 mm thick and
100 mm wide, quartz and feldspar range from 10 to
100 mm in width. The large grain size of quartz and
feldspar produces a spotty diffraction image (Figure 4c).
EDS analyses of Death Valley and Salton Sea clay,
averaging over a large surface area (1 mm61 mm),
indicate that Si is the dominant component, followed by
Fe and Al (Figure 3). Death Valley clay has a significant
amount of Mg (~11 wt.%) and K (~10 wt.%). Salton Sea
clay is enriched in calcium (~12%) and contains halite
(~3% Cl, Figure 3b). The differences in chemical
composition reflect the variations of the host rocks in
the vicinity.
The Rietveld refinement provides volume fractions of
constituent minerals (Table 1). Phyllosilicates make up
about half of the volume for Death Valley and Salton
Sea clay, while they are a small fraction in Val Albigna
clay. The mineral composition reveals considerable
diagenetic activity with growth of montmorillonite and
kaolinite in the Death Valley and Salton Sea samples.
These components are missing from Val Albigna clay,
the composition of which reflects the composition of the
granodioritic host rock in the valley.
The focus of the present study was the preferred
orientation in surface clays represented as (001) pole
figures (Figure 7) and a summary of quantitative data
(Table 2).
The ODFs of montmorillonite and illite-mica in DV1
are sharp. Their minimum values (Table 2) indicate that
only 17 vol.% of montmorillonite and 11 vol.% of illite-
mica grains are randomly oriented (ODF minimum),
while the ODF maximum of montmorillonite is
5.7 m.r.d. and of illite-mica 6.0 m.r.d., expressed in
(001) pole figure maxima 3.1 m.r.d. and 4.0 m.r.d.,
respectively. (001) lattice planes are aligned preferen-
tially in the bedding plane. In addition, a small fraction
(~0.01) of kaolinite is present with a refined (001) lattice
spacing of 7.09 A. This diffraction peak demonstrates
strong intensity variations along the Debye rings
(Figures 4a, 5a), consistent with the preferred orientation
of (001) poles normal to the bedding plane. Indeed, the
kaolinite ODF shows the largest maximum and lowest
minimum values (Table 2), but the (001) pole figure is
somewhat distorted (Figure 7a), deviating from the
Table 1. Volume fractions of component minerals with the same abbreviations as used in the figures and figure captions.
Mineral Abbreviation Death Valley DV1 Salton Sea SS2 Val Albigna Brg1644
Montmorillonite Mm 0.211 0.253Illite-mica I-M 0.325 0.199Biotite Bio 0.089Chlorite Chl 0.036 0.022Kaolinite Kao 0.010 0.076Vermiculite Vm 0.003Quartz Q 0.107 0.167 0.212Calcite Cc 0.112Dolomite D 0.023Plagioclase Ab/An28 0.184 0.056 0.436Orthoclase Or 0.146 0.076 0.229Pyrite P 0.002Hornblende Hbl 0.009Analcime Ac 0.017
336 Wenk and Vasin Clays and Clay Minerals

orientation in the bedding plane. This may be caused
partially by lower reliability because of the small
volume fraction, because the texture strength is strongly
affected by local background variations, and peak
overlaps with the disordered montmorillonite. Quartz,
feldspars, and analcime appear to be randomly oriented.
To refine diffraction images of Salton Sea mud
volcano sample SS2, ten minerals were considered
(Table 1). Of those, montmorillonite, illite-mica, kaolin-
ite, and chlorite were considered for texture analysis.
Overall, preferred orientations of phyllosilicates were
weaker than in Death Valley clay. ODF maxima are
2.1 m.r.d. for montmorillonite, 3.0 m.r.d. for illite-mica,
and 2.9 m.r.d. for kaolinite (Table 2). The ODF minima
are relatively high: 30�50 vol.% of illite-mica, kaolin-
ite, and montmorillonite crystallites are randomly
oriented as indicated by corresponding minimum ODF
values (Table 2). Maximum values on (001) pole figures
are ~2 m.r.d., all with a fairly symmetrical maximum
perpendicular to the bedding plane (Figure 7b).
Compared with montmorillonite from Death Valley
clay with a (001) diffraction peak position at d &12.92 A, the position for Salton Sea mud volcano clay is
at d & 12.22 A. These interlayer distances correspond to
montmorillonites with a single water layer between clay
layers in their crystal structure (e.g. Mazo et al., 2008;
Ebrahimi et al., 2012); although, due to large disorder-
related peak broadening, Salton Sea clay may contain
partially dehydrated montmorillonite.
For Val Albigna clay, biotite, chlorite, and vermicu-
lite display textures with very regular (001) maxima
perpendicular to bedding (Figure 7c). Biotite and
vermiculite which are present in minor amounts ((001)
Figure 7. (001) Pole figures of phyllosilicates for: (a) Death Valley DV1; (b) Salton Sea mud volcano SS2; and (c) Val Albigna
glacial lake Brg1644 samples. The linear-scale contours are given in multiples of a random distribution (m.r.d.). Equal area
projection on the bedding plane.
Table 2. Preferred orientation characterization of phyllosili-cates with ODF maximum and minimum values and (001)pole figure maximum and minimum (in multiples of arandom distribution).
ODFmax
ODFmin
(001)max
(001)min
Death Valley DV1Montmorillonite 4.73 0.17 3.12 0.37Illite-muscovite 5.95 0.11 4.03 0.27Kaolinite 19.27 0.02 4.16 0.39
Salton Sea SS2Montmorillonite 2.14 0.50 1.85 0.59Illite-muscovite 2.95 0.28 2.33 0.47Kaolinite 2.88 0.32 1.90 0.55Chlorite 3.43 0.09 2.05 0.51
Val Albigna Brg1644Biotite 5.22 0.31 3.45 0.58Chlorite 2.56 0.59 2.15 0.80Vermiculite 4.41 0.55 3.74 0.72
Vol. 65, No. 5, 2017 Alignment of phyllosilicates in clays 337

lattice spacing is ~15.59 A) have ODF maxima of 5.2
and 4.4 m.r.d. respectively; for chlorite, the maximum is
weaker (2.6 m.r.d.). All three phyllosilicates occur as
fairly large platy particles. Montmorillonite and kaolin-
ite are absent. Consequently, compared to Death Valley
and Salton Sea, diffraction at very low angles
(Figure 4 a,b) is also absent, indicating that it is indeed
attributed to small-angle scattering on nanocrystalline
montmorillonite.
All (001) pole figures show a maximum perpendi-
cular to the bedding plane (Figure 7) but the strength of
this maximum varies for different samples as well as
different clay minerals. The girdle distribution for Death
Valley and Salton Sea clay may be an artifact of
incomplete pole figure coverage (�45º to 45º) compared
with full coverage for Val Albigna (�90º to 75º) and
sample heterogeneities, keeping in mind that information
was extracted from small volumes (~10 mm3).
DISCUSSION
The present report shows that three clay samples
which formed in very different aqueous, non-marine,
surface environments display significant preferred
orientation of phyllosilicates. This is the first study
documenting and quantifying alignment in such samples.
All mineral components for which preferred orientation
could be documented are phyllosilicates with a platy
morphology parallel to the (001) crystal planes produ-
cing a close relation between crystal-preferred orienta-
tion (CPO) and shape-preferred orientation (SPO).
Death Valley clay displays the strongest alignment
and the Mesquite Flat occurrence probably formed in a
lake-like environment, most likely during a period of
significant precipitation. A systematic investigation of
clays in ancient desert lake/pool/stream environments
would be illuminating. This obviously does not imply
that all surface clays display orientation patterns.
Specific conditions are required such as water pools
with suspended phyllosilicates and minimal turbulence.
In Salton Sea mud volcanoes a high clay:liquid ratio
with turbulent eruptions was found (Figure 1b), followed
by slow settling and solidification. Of the three samples,
the Salton Sea clay displayed the weakest preferred
orientation. High preferred orientation develops during
sedimentation in stable environments and is local. The
high temperatures of the extruding mud favored altera-
tions to clay minerals such as montmorillonite and
kaolinite. In Death Valley and Salton Sea, clay phyllo-
silicates constitute about half of the volume.
The simplest evolution is that of the Val Albigna clay
in an Arctic environment with glacial erosion of
granodiorite and deposition in streams near the foot of
the glacier and no precipitation of authigenic clays such
as montmorillonite, though some biotite is altered to
vermiculite (e.g. Acker and Bricker, 1992) but keeping
the original morphology. Biotite and chlorite fragments
align in ponds. Significant alignment of crystallites is
also observed here, even though phyllosilicates make up
only a minor fraction (~11 vol.%).
How do these sedimentary surface clays compare
with other phyllosilicate-bearing rocks, such as shales,
slates, schists, gneisses, and serpentinites? Much atten-
tion has been paid to such rocks because phyllosilicate
alignment is a major cause of seismic anisotropy in the
crust. Some phyllosilicate-bearing rocks such as slates
(e.g. Haerinck et al., 2015) and schists (e.g. Wenk et al.,
2010) display very strong preferred orientation attained
during recrystallization under stress. Others, such as
fault gouge, generally show fairly random orientation
patterns because of simple shear rotations of platelets
(e.g. Buatier et al., 2012; Janssen et al., 2012, 2014), or
only very local alignment (e.g. Janssen et al., 2016).
Most attention has been dedicated to preferred
orientation and anisotropy of shales, mainly because of
the significance for hydrocarbon exploration (e.g.
Johnston and Christensen, 1995). Some qualitative
studies of the clay fabric used electron microscopy
(e.g. O’Brien, 1970; Moon and Hurst, 1984). Later, the
alignment of phyllosilicate crystallites was quantified
with X-ray diffraction methods. The strength of pre-
ferred orientation in shales has been attributed to the
phyllosilicate content (e.g. Curtis et al., 1980), quartz
grain size (e.g. Blatt and Schulz, 1976), and processes of
mechanical compaction (e.g. Gipson, 1966) and diage-
netic recrystallization (e.g. Ho et al., 1999; Aplin et al.,
2006, Day-Stirrat et al., 2008).
How do oceanic shales compare with surface water
clays? A comparison of composition and phyllosilicate
alignment of some natural shales displays a wide range
of fabric strengths (3�10 m.r.d. in (001) pole figures)
(Table 3) compared with somewhat lower strengths
(1.9�4.2 m.r.d.) for the three surface clays investigated
in this study (Table 2). The greatest strengths
(~10 m.r.d.) were reported for old compacted shales
such as Carboniferous mudrock from Yorkshire (Curtis
et al., 1980) and Cambrian shale from Silver Hill,
Montana (Wenk et al., 2007). These are quite excep-
tional and most shales have strengths of 4�5 m.r.d.
Experimentally, the alignment of phyllosilicates is
well known to increase with compaction and phyllo-
silicate content (e.g. Voltolini et al., 2009). At 50 MPa
axial compaction, texture strength is 7�8 m.r.d. for
100% illite and 3 m.r.d. for a 50% illite-50% quartz
mixture. Such experiments are normally carried out,
however, on homogeneous samples and ideal conditions
that do not appear to apply to most natural shale
conditions with many phases and significant local
heterogeneity. Yet the compacted illite-quartz mixture
has a similar texture strength to those of Death Valley
and Val Albigna surface clays. Thus, mechanical
compaction is not required to produce a high degree of
preferred orientation, and the alignment of phyllosilicate
platelets depends on many factors that vary for each
338 Wenk and Vasin Clays and Clay Minerals

geological setting. Much of the phyllosilicate alignment
of deeply buried mudrocks may occur at surface
conditions in lake-like stable environments of lagoons,
the continental shelf, and deep ocean settings.
Numerical simulations suggest that settling of iso-
lated platy clay particles in an aqueous environment
should lead to formation of significant preferred
orientation because particles tend to reorient subnormal
to the deposition direction and to be attracted to each
other by torques of the opposite sign (e.g. Ardekani et
al., 2016). This can be compared with the procedure of
settling clay powders in aqueous solutions to prepare
oriented samples for X-ray powder diffraction to
emphasize diffraction from basal planes that are
diagnostic in terms of identification (e.g. Cody and
Thompson, 1976; Moore and Reynolds, 1997, p. 214).
Phyllosilicate platelets simply settle in a solution with
particle shape and size causing some layering.
In natural conditions, such settling could be
obstructed, or preferred orientation created by it could
be, to some degree, altered by electrochemical, thermo-
mechanical, and biogenic mechanisms (Bennett et al.,
1991). Flocculation of fine clay particles also leads to
complex microstructures and may be responsible for the
formation of weaker preferred orientation in settled
phyllosilicates (e.g. O’Brien, 1971), though at least in
some cases settling from flocculated suspensions may
also create strong texture (e.g. Williamson, 1980).
In the glacial pool such as that at Val Albigna,
settling of phyllosilicate particles occurs very locally
with not much separation of phases. In Death Valley
clay, the sedimentation occurred more homogeneously,
probably in a large lake over considerable time, with
significant alteration causing nanoscale formation of
authigenic montmorillonite. The stable environment
produced strong alignment. In Salton Sea mud, settling
of crystals is constantly disturbed and old microstruc-
tural patterns are reworked, resulting in weaker align-
ment. Note, however, that these observations on three
samples cannot be generalized to all surface mud
deposits. Clearly, not all surface clays display orienta-
tion patterns and specific conditions are required such as
water pools with suspended phyllosilicates and minimal
turbulence. The conditions have to be right; water with a
high degree of phyllosilicate suspensions in an anoxic
environment with not much organic material to avoid
flocculation (e.g. Moon and Hurst, 1984).
CONCLUSIONS
Mudstones in surface-lake environments can have
strong preferred orientation of phyllosilicates, compar-
able to patterns observed in deep shales. This suggests
that a significant portion of the alignment of phyllo-
silicates in deeply buried mudrocks may have occurred
at an early stage, before modification by compaction and
diagenesis. A systematic investigation of surface clays
from various environments, including clays from ocea-
nic basins, would be of interest in order to obtain a better
understanding of the requirements for an early develop-
ment of crystal preferred orientation. New experimental
methods such as hard synchrotron X-ray diffraction have
made available a quantitative approach to determine
fabric patterns of complex polyphase mudrocks.
ACKNOWLEDGMENTS
Diffraction experiments were conducted at the Ad-vanced Light Source, Argonne National Laboratory, beam-line 11-ID-C and the authors acknowledge the assistanceoffered by Yang Ren. SEM measurements were done atEPS-Berkeley and the University of Trento, Mesiano,Italy, and the authors are grateful for access and the helpof Lorena Maines. Tim Teague helped with samplepreparation. The authors are grateful to Mike Theiss(Instagram@ExtremeNature) for the picture of the Mes-quite sand dunes. HRW acknowledges support from theNational Science Foundation (Grant No. EAR-1343908)and the Department of Energy (Grant No. DE-FG02-05ER15637). Constructive reviews by Andreas Kronenbergand two anonymous reviewers, as well as the editors, werevery helpful in improving the manuscript. Comments bySvetlana Vasina were also appreciated.
Table 3. Compilation of phyllosilicate and quartz (and calcite) content (in volume fractions) and preferred orientation(maximum pole density on (001) pole figures of phyllosilicates in m.r.d.) in several shales. Samples studied with similarmethods as in this report are emphasized. They are listed in alphabetical order of authors.
Locality Clay QuartzCalcite
(001) max Reference
Barnett clay, Texas, USA 0.5 0.4 6 Allan et al. (2016)Yorkshire, UK 0.15�0.30 7�10 Curtis et al. (1980)Posidonia, Hils syncline, Germany 0.3 0.15/0.4 4�5 Kanitpanyacharoen et al. (2012)Qusaiba, South Africa 0.7 0.2 5 Kanitpanyacharoen et al. (2011)Muderong, Australia 0.72 0.28 4�5 Kanitpanyacharoen et al. (2015)Nigeria 0.8 0.15 3�5 Lonardelli et al. (2007)Campine Basin, Belgium 0.75 0.1�0.2 4�7 Sintubin (1994)Kimmeridge, UK 0.67 0.25 5 Vasin et al. (2013)Mt. Terri, Switzerland 0.7 0.2/0.06 3�7 Wenk et al. (2008)Silver Hill, Montana, USA 0.95 0.05 10 Wenk et al. (2007)
Vol. 65, No. 5, 2017 Alignment of phyllosilicates in clays 339

REFERENCES
Acker, J.G. and Bricker, O.P. (1992). The influence of PH onbiotite dissolution and alteration kinetics at low tempera-ture. Geochimica and Cosmochimica Acta, 56, 3073�3092.
Allan, A.M., Clark, A.C., Vanorio, T., Kanitpanyacharoen, W.,and Wenk, H.-R. (2016) On the evolution of the elasticproperties of organic-rich shale upon pyrolysis-induced
thermal maturation. Geophysics, 81, D271�D289.Almquist, B.S.G. and Mainprice, D. (2017) Seismic properties
and anisotropy of the continental crust: predictions based onmineral texture and rock microstructure. Reviews of
Geophysics, 55, 367�433.Antao, S.M., Hassan, I., Wang, J., Lee, P.L., and Toby, B.H.
(2008) State-of-the-art high-resolution powder X-ray dif-
fraction (HRPXRD) illustrated with Rietveld structurerefinement of quartz, sodalite, tremolite, and meionite. TheCanadian Mineralogist, 46, 1501�1509.
Aplin, A.C. and Larter, S.R. (2005) Fluid flow, pore pressure,wettability and leakage in mudstone cap rocks. Pp. 1�12 in:Evaluating Fault and Cap Rock Seals. American
Association of Petroleum Geologists Hedberg Series No. 2(P. Boult and J. Kaldi, editors). American Association ofPetroleum Geologists, Tulsa, Oklahoma, USA.
Aplin, A.C., Matenaar, I.F., McCarty, D.K., and van derPluijm, B.A. (2006) Influence of mechanical compactionand clay mineral diagenesis on the microfabric and pore-
scale properties of deep-water Gulf of Mexico mudstones.Clays and Clay Minerals, 54, 500�514.
Ardekani, M.N., Costa, P., Breugem, W.P., and Brandt, L.(2016) Numerical study of the sedimentation of spheroidalparticles. International Journal of Multiphase Flow, 87,
16�34.Bennett, R.H., O’Brien, N.R., and Hulbert, H. (1991)
Determinants of clay and shale microfabric signatures:Processes and mechanisms. Pp. 5�33 in: Microstructure of
Fine-Grained Sediments (R.H. Bennett, W.R. Bryant, andM.H. Hulbert, editors). Springer Verlag, Berlin.
Bish, D.L. and Von Dreele, R.B. (1989) Rietveld refinement ofnon-hydrogen atomic positions in kaolinite. Clays and Clay
Minerals, 37, 289�296.Blatt, H. and Schultz, D.J. (1976) Size distribution of quartz in
mudrocks. Sedimentology, 23, 857�66.Bossart, P. and Thury, M. (2007) Research in the Mont Terri
Rock Laboratory: Quo vadis? Physics and Chemistry of the
Earth, 32, 19�31.Brigatti, M.F. and Davoli, P. (1990) Crystal-structure refine-
ment of 1M plutonic biotites. American Mineralogist, 75,305�313.
Buatier, M.D., Chauvet, A., Kanitpanyacharoen, W., Wenk, R.,Ritz, J.F., and Jolivet, M. (2012) Origin and behavior of clay
minerals in the Bogd fault gouge, Mongolia. Journal of
Structural Geology, 34, 77�90.Chadwick, R.A., Zweigel, P., Gregersen, U., Kirby, G.A.,
Holloway, S., and Johannessen, P.N. (2004) Geologicalreservoir characterization of a CO2 storage site: The Utsira
Sand, Sleipner, northern North Sea. Energy, 29, 1371�1381.Cody, R.D. and Thompson, G.L. (1976) Quantitative X-ray
powder diffraction analyses of clays using an orientinginternal standard and pressed disks of bulk shale samples.Clays and Clay Minerals, 24, 224�231.
Curtis, C.D., Lipshie, S.R., Oertel, G., and Pearson, M.J.(1980) Clay orientation in some Upper Carboniferousmudrocks, its relationship to quartz content and some
inferences about fissility, porosity and compactional his-tory. Sedimentology, 27, 333�339.
Day-Stirrat, R.J., Aplin, A.C., Srodon, J., and van der Pluijm,B.A. (2008) Diagenetic reorientation of phyllosilicateminerals in Paleogene mudstones of the Podhale Basin,
southern Poland. Clays and Clay Minerals, 56, 100�111.De la Calle, C., Pezerat, H., and Gasperin, M. (1977)
Problemes d’ordre-desordre dans les vermiculites structuredu mineral calcique hydrate a 2 couches. Journal de
Physique, 38 (C7), 128�133.Downs, R.T., Hazen, R.M., and Finger, L.W. (1994) The high-
pressure crystal chemistry of low albite and the origin of thepressure dependency of Al-Si ordering, American
Mineralogist, 79, 1042�1052.Dræge, A., Jakobsen, M., and Johansen, T.A. (2006) Rock
physics modelling of shale diagenesis. Petroleum
Geoscience, 12, 49�57.Ebrahimi, D., Pellenq, R.J.-M., and Whittle, A.J. (2012)
Nanoscale elastic properties of montmorillonite upon wateradsorption. Langmuir, 28, 16855�16863.
Gatta, G.D., Nestola, F., and Ballaran, T.B. (2006) Elasticbehavior, phase transition, and pressure induced structuralevolution of analcime. American Mineralogist, 91 ,568�578.
Gipson, M. (1966) A study of the relations with depth, porosityand clay-mineral orientation in Pennsylvanian Shales.Journal of Sedimentary Petrology, 36, 888�903.
Gournis, D., Lappas, A., Karakassides, M.A., Tobbens, D., andMoukarika, A. (2008) A neutron diffraction study of alkalication migration in montmorillonites. Physics and
Chemistry of Minerals, 35, 49�58.Gualtieri, A.F. (2000) Accuracy of XRPD QPA using the
combined Rietveld-RIR method. Journal of Applied
Crystallography, 33, 267�278.Haerinck, T., Wenk, H.-R., Debacker, T.N., and Sintubin, M.
(2015) Preferred mineral orientation of a chloritoid-bearingslate in relation to its magnetic fabric. Journal of StructuralGeology, 71, 125�135.
Helgeson, H.C. (1968) Geological and thermodynamic char-acteristics of the Salton Sea geothermal system. AmericanJournal of Science, 266, 129�166.
Ho, N.-C., Peacor, D.R., and van der Pluijm, B.A. (1999)Preferred orientation of phyllosilicates in Gulf Coastmudstones and relation to the smectite�illite transition.Clays and Clay Minerals, 47, 495�504.
Hornby, B.E. (1998) Experimental laboratory determination ofthe dynamic elastic properties of wet, drained shales.Journal of Geophysical Research, 103, 29945�29964.
Janssen, C., Kanitpanyacharoen, W., Wenk, H.-R., Wirth, R.,Morales, L., Rybacki, E., Kienast, M., and Dresen, G. (2012)Clay fabrics in SAFOD core samples. Journal of StructuralGeology, 43, 118�127.
Janssen, C., Wirth, R., Wenk, H.-R., Morales, L., Naumann,R., Kienast, M., Song, S.R., and Dresen, G. (2014) Faultingprocesses in active faults � evidence from TCDP andSAFOD drill core samples. Journal of Structural Geology,65, 100�116.
Janssen, C., Wenk, H.-R., Wirth, R., Morales, L., Kemnitz, H.,Sulem, J., and Dresen, G. (2016) Microstructures and theirimplications for faulting processes � insights from DGLabcore samples from the Gulf of Corinth. Journal of StructuralGeology, 86, 62�74.
Johnston, J.E. and Christensen, N.I. (1995) Seismic anisotropyof shales. Journal of Geophysical Research B, 100,5991�6003.
Kanitpanyacharoen, W., Wenk, H.-R., Kets, F., Lehr, B.C., andWirth, R. (2011) Texture and anisotropy analysis of Qusaibashales. Geophysical Prospecting, 59, 536�556.
Kanitpanyacharoen, W., Kets, F.B., Wenk, H.-R., and Wirth,R. (2012) Preferred orientation, microstructures and poros-ity analyses of Posidonia shales. Clays and Clay Minerals,60, 315�329.
Kanitpanyacharoen, W., Vasin, R., Dewhurst, D., and Wenk,H.-R. (2015) Linking preferred orientations to elastic
340 Wenk and Vasin Clays and Clay Minerals

anisotropy in Muderong Shale, Australia. Geophysics, 80,C1�C19.
Lonardelli, I., Wenk, H.-R., and Ren, Y. (2007) Preferredorientation and elastic anisotropy in shales. Geophysics, 72,D33�D40.
Lutterotti, L., Voltolini, M., Wenk, H.-R., Bandyopadhyay, K.,and Vanorio, T. (2010) Texture analysis of turbostraticallydisordered Ca-montmorillonite. American Mineralogist, 95,98�103.
Lutterotti, L., Vasin, R., and Wenk, H.-R. (2014) Rietveldtexture analysis from synchrotron diffraction images. I.Calibration and basic analysis. Powder Diffraction, 29,76�84.
Mancini, F., Sillanpaa, R., Marshall, B., and Papunen, H.(1996) Magnesian hornblende from a metamorphosedultramafic body in southwestern Finland: crystal chemistryand petrological implications. The Canadian Mineralogist,34, 835�844.
Markgraf, S.A. and Reeder, R.J. (1985) High-temperaturestructure refinements of calcite and magnesite. American
Mineralogist, 70, 590�600.Matthies, S. (2002) 20 years WIMV, history, experience and
contemporary developments. Materials Science Forum, 408-412, 95�100.
Matthies, S. and Vinel, G.W. (1982) On the reproduction of theorientation distribution function of textured samples fromreduced pole figures using the concept of conditional ghostcorrection. Physica Status Solidi, B 112, K111�K114.
Matthies, S. and Wenk, H.-R. (2009) Transformations formonoclinic crystal symmetry in texture analysis. Journal ofApplied Crystallography, 42, 564�571.
Mazo, M.A., Manevitch, L.I., Gusarova, E.B., Shamaev, M.Y.,Berlin, A.A., Balabaev, N.K., and Rutledge, G.C. (2008)Molecular dynamics simulation of thermomechanical prop-erties of montmorillonite crystal. II. Hydrated mont-morillonite crystal. Journal of Physical Chemistry C, 112,17056�17062.
Moon, C.F. and Hurst, C.W. (1984) Fabric of muds and shales:an overview. Pp. 579�594 in: Fine-Grained Sediments:
Deep-Water Processes and Facies (D.A.V. Stow and D.J.W.Piper, editors). Special Publication, 15, Geological Societyof London.
Moore, D.M. and Reynolds Jr., R.C. (1997) X-ray Diffraction
and the Identification and Analysis of Clay Minerals, 2ndedition. Oxford University Press, Oxford, UK, 378 pp.
O’Brien, N.R. (1970) The fabric of shale � an electronmicroscope study. Sedimentology, 15, 229�246.
O’Brien, N.R. (1971) Fabric of kaolinite and illite floccules.Clays and Clay Minerals, 19, 353�359.
Phillips, M.W., Colville, A.A., and Ribbe, P.H. (1971) Thecrystal structures of two oligoclases: a comparison with lowand high albite. Zeitschrift fur Kristallographie, 133,43�65.
Rieder, M., Crelling, J.C., Sustai, O., Drabek, M., Weiss, Z.,and Klementova, M. (2007) Arsenic in iron disulfides in abrown coal from the North Bohemian Basin, CzechRepublic. International Journal of Coal Geology, 71,115�121.
Rietveld, H.M. (1969) A profile refinement method for nucleara n d magn e t i c s t r u c t u r e s . J o u r n a l o f Ap p l i e d
Crystallography, 2, 65�71.Ross, N.L. and Reeder, R.J. (1992) High-pressure structural
study of dolomite and ankerite. American Mineralogist, 77,
412�421.Rudolph, M.L. and Manga, M. (2010) Mud volcano response to
the 4 April 2010 El Mayor-Cucapah earthquake. Journal of
Geophysical Research: Solid Earth, 115, B12211, 1�14.Ruud, B.O., Jakobsen, M., and Johansen, T.A. (2003) Seismic
properties of shales during compaction. 73rd SEG Meeting,
Expanded abstracts, Dallas, Texas, 1294�1297.Schneider, C.A., Rasband, W.S., and Eliceiri, K. W. (2012)
NIH Image to ImageJ: 25 years of image analysis. Nature
Methods, 9(7), 671�675.Sintubin, M. (1994) Clay fabrics in relation to the burial
history of shales. Sedimentology, 41, 1161�1169.Sturz, A. (1989) Low-temperature hydrothermal alteration in
near-surface sediments, Salton Sea geothermal area. Journal
of Geophysical Research: Solid Earth, 94, B4, 4015�4024.Tseng, H.-Y., Heanet, P.J., and Onstott, T.C. (1995)
Characterization of lattice strain induced by neutron
irradiation. Physics and Chemistry of Minerals, 22,
399�405.Ufer, K., Roth, G., Kleeberg, R., Stanjek, H., Dohrmann, R.,
and Bergmann, J. (2004) Description of X-ray powder
pattern of turbostratically disordered layer structures with a
R i e t v e l d c ompa t i b l e a pp r o a ch . Ze i t s c h r i f t f u r
Kristallographie, 219, 519�527.Vasin, R., Wenk, H.-R., Kanitpanyacharoen, W., Matthies, S.,
and Wirth, R. (2013) Elastic anisotropy modeling of
Kimmeridge Shale. Journal of Geophysical Research, 118,
3931�3956.Voltolini, M., Wenk, H.-R., Mondol, N.H., Bjørlykke, K., and
Jahren, J. (2009) Anisotropy of experimentally compressed
kaolinite-illite-quartz mixtures. Geophysics, 74, D13�D23.Wenk, H.-R., Matthies, S., Donovan, J., and Chateigner, D.
(1998) BEARTEX: a Windows-based program system for
quanti tat ive texture analysis . Journal of Applied
Crystallography, 31, 262�269.Wenk, H.-R., Lonardelli, I., Franz, H., Nihei, K., and
Nakagawa, S. (2007) Texture analysis and elastic anisotropy
of illite clay. Geophysics, 72, E69�75.Wenk, H.-R., Voltolini, M., Kern, H., Popp, H., and Mazurek,
M. (2008) Anisotropy of Mont Terri Opalinus Clay. The
Leading Edge, 27, 742�748.Wenk, H.-R., Kanitpanyacharoen, W., and Voltolini, M. (2010)
Preferred orientation of phyllosilicates: comparison of fault
gouge, shale and schist. Journal of Structural Geology, 32,
478�489.Wenk, H.-R., Lutterotti, L., Kaercher, P., Kanitpanyacharoen,
W., Miyagi, L., and Vasin, R.N. (2014) Rietveld texture
analysis from synchrotron diffraction images: II. Complex
multiphase materials and diamond anvil cell experiments.
Powder Diffraction, 29, 172�192.Williamson, W.O. (1980) Experiments relevant to the genesis
of clay mineral orientation in natural sediments. Clay
Minerals, 15, 95�97.Zanazzi, P.F., Comodi, P., Nazzareni, S., and Andreozzi, G.B.
(2009) Thermal behaviour of chlorite: an in situ single-
crystal and powder diffraction study. European Journal of
Mineralogy, 21, 581�589.
(Received 19 April 2017; revised 28 September 2017;
Ms. 1175; AE: J. Kim)
Vol. 65, No. 5, 2017 Alignment of phyllosilicates in clays 341