pregnancy nutrition surveillance system - missourihealth.mo.gov/data/pnss/pdf/07pnss.pdfthe...
TRANSCRIPT

Missouri Department of Health and Senior Services
Pregnancy Nutrition
Surveillance System
2007 Summary Report

2007 Missouri PNSS Summary Report
1
PREFACE
This document summarizes selected key maternal health indicators of women participating in the Missouri WIC Program in 2007, which contributed to the Missouri Pregnancy Nutrition Surveillance System in 2007.
Missouri Department of Health and Senior Services
In accordance with Federal law and U.S. Department of Agriculture policy, this institution is prohibited from discriminating on the basis of race, color, national origin, sex, age, or disability. To file a complaint of discrimination, write USDA, Director, Office of Adjudication and Compliance, 1400 Independence Avenue, SW, Washington, D.C. 20250-9410 or call (202) 260-1026, (866) 632-9992 (toll free), or (202) 401-0216 (TDD). USDA is an equal opportunity provider and employer.

2007 Missouri PNSS Summary Report
2
TABLE OF CONTENTS
EXECUTIVE SUMMARY .............................................................................................................3 INTRODUCTION ...........................................................................................................................5 MATERNAL DEMOGRAPHIC CHARACTERISTICS ...............................................................7
Race/Ethnicity ......................................................................................................................7 Age .......................................................................................................................................8 Education .............................................................................................................................9 Poverty Level/Migrant Status ............................................................................................10
MATERNAL HEALTH AND BEHAVIORAL HEALTH INDICATORS .................................11
Prepregnancy Weight Status ..............................................................................................11 Maternal Weight Gain........................................................................................................14 Maternal Anemia (Low Hemoglobin/Hematocrit) ............................................................18 Medical Care ......................................................................................................................20 WIC Enrollment .................................................................................................................21 Smoking During Pregnancy ...............................................................................................22 Secondary Smoke from Other Household Members .........................................................25
INFANT HEALTH INDICATORS ...............................................................................................27
Low and High Birthweight ................................................................................................27 Preterm Delivery ................................................................................................................29 Breastfeeding Initiation ......................................................................................................31
CONCLUSIONS AND RECOMMENDATIONS ........................................................................34 REFERENCES ..............................................................................................................................37 APPENDICES ...............................................................................................................................40
Appendix 1. Prevalence of Prepregnancy Underweight by County ...............................40 Appendix 2. Prevalence of Prepregnancy Overweight by County .................................41 Appendix 3. Prevalence of Less than Ideal Maternal Weight Gain by County ..............42 Appendix 4. Prevalence of Greater than Ideal Maternal Weight Gain by County .........43 Appendix 5. Percentage of Women Who Had Medical Care in the First Trimester of Pregnancy by County.............................................................................44 Appendix 6. Percentage of WIC Women Who Had No Medical Care During Pregnancy by County .................................................................................45 Appendix 7. Percentage of Women Enrolled in WIC During the First Trimester of
Pregnancy by County .................................................................................46 Appendix 8. Percentage of WIC Women Who Smoked During the Last Three Months of Pregnancy by County ...............................................................47 Appendix 9. Prevalence of Low Birthweight by County ................................................48 Appendix 10. Prevalence of High Birthweight by County ...............................................49 Appendix 11. Prevalence of Preterm Delivery by County ...............................................50 Appendix 12. Percentage of Breastfeeding Initiation by County .....................................51

2007 Missouri PNSS Summary Report
3
EXECUTIVE SUMMARY
Maternal health risk factors that affect the mother and her birth outcomes include maternal prepregnancy weight, weight gain during pregnancy, and anemia (low hemoglobin/hematocrit) status. Behavioral factors such as tobacco use and exposure and time of enrollment in prenatal care can also influence the mother’s health and her birth outcomes. The Centers for Disease Control and Prevention (CDC) Pregnancy Nutrition Surveillance System (PNSS) has monitored health and behavioral risk factors among low-income, pregnant, prenatal, and postpartum women enrolled in federally funded public health programs in participating states since 1979. The Missouri 2007 PNSS includes data from only one source, the Special Supplemental Nutrition Program for Women, Infants and Children (WIC). The data included complete information on prenatal and postpartum records with demographics, health and behavior risk factors, and infant birth outcomes. In the 2007 Missouri PNSS, the most common demographic groups were Non-Hispanic White women and women 20-29 year of age. However, the Hispanic portion of the population has been increasing over the past 10 years. Approximately 67% of PNSS participants had a high school or higher education, and nearly three-fourths were at income levels 0-100% of the federal poverty level. Additionally, only 10 participants reported being migrants. Prepregnacy weight status is a determinant of weight gain during pregnancy and birthweight. Approximately 46% of the 2007 Missouri PNSS participants reported being overweight or obese during the prepregnancy period. Non-Hispanic Black women and those who were 40 years or older were more likely to be overweight before pregnancy. Asian/Pacific Islander women and those who were 17 years or younger were more likely to be underweight before pregnancy. Adequate maternal weight gain, based on prepregnancy weight status, is considered to be a major determinant of birthweight, as well as infant morbidity and mortality. Even with improved access to nutritious foods and nutrition education, approximately two-thirds of women participating in the 2007 Missouri PNSS had inadequate (greater than ideal or less than ideal) gestational weight gain. American Indian/Alaskan Native and Non-Hispanic White women were more likely to gain greater than ideal weight during pregnancy, while Asian/Pacific Islander and Hispanic women were more likely to gain the ideal weight during pregnancy. Of all racial and ethnic groups, Asian/Pacific Islander women were most likely to gain less than ideal weight. Nearly all age groups (<15, 15-17, 18-19, 20-29, 30-39) were most likely to gain more than ideal weight during pregnancy, compared to less than ideal weight or ideal weight. However, women aged ≥40 were most likely to gain ideal weight during pregnancy, while approximately one-third of PNSS participants in all other age groups gained ideal gestational weight. Pregnant women are at higher risk for iron deficiency anemia because of the increased iron requirements of pregnancy. The prevalence of anemia (low hemoglobin/hematocrit) among PNSS participants in Missouri in the third trimester of pregnancy and postpartum has increased over the last 10 years. Non-Hispanic Black women and 15-17 year old participants were more likely to have low hemoglobin/hematocrit during the third trimester and postpartum.
2007 Missouri PNSS Summary Report
4
Pregnancy outcomes are better if prenatal care begins in the first trimester of pregnancy. From 1998-2007, the majority of women in the Missouri PNSS received medical care during the first trimester of pregnancy. In 2007, a higher percentage of PNSS women were enrolled in WIC during the first trimester of pregnancy, than in the second and third trimesters and postpartum. Smoking during pregnancy is associated with an increased risk of several poor birth outcomes including low birthweight. From 1998-2007, more than one-third of women in the Missouri PNSS smoked 3 months prior to pregnancy and about one-fourth smoked in the last 3 months of pregnancy. Race/ethnicity and educational level had strong impacts on participants’ smoking behavior. Non-Hispanic White participants had the highest rates of smoking, while Hispanic participants had the lowest rates for smoking both 3 months prior to and the last 3 months of pregnancy. The prevalence of women who smoked 3 months prior to pregnancy and during the last 3 months of pregnancy was the highest among participants with less than a high school education. In the Missouri PNSS population, low birthweight infants were more likely to be delivered by women who were underweight before pregnancy, who gained less than ideal gestational weight, and who smoked during pregnancy. Older women (≥ 40 years) and Non-Hispanic Black women had the highest percentages of low birthweight infants. American Indian/Alaskan Native women, as well as women 30 to 39 years of age, were at higher risk of having a high birthweight infant. The 10-year trend in high birthweight demonstrates a decline in the percentage of babies born overweight. Risk factors for preterm delivery, according to 2007 Missouri PNSS data, include being underweight before pregnancy, gaining less than ideal weight during pregnancy, and being in the age groups of 30 to 39 years of age and 40 years or older. Non-Hispanic Black women were more likely to have a preterm baby, compared to all other racial and ethnic groups. In 2007 Missouri PNSS, the proportion of women who initiated breastfeeding increased by about ten percentage points from 1998. Nearly three-fourths of Hispanic women, more than two-thirds of women with greater than high school education, and more than half of women in the 18 to 19 year age group and all older age groups initiated breastfeeding in 2007. Breastfeeding initiation was lowest among women who were in the Non-Hispanic Black racial and ethnic group, who were less than 17 years of age, and who had less than a high school education.

2007 Missouri PNSS Summary Report
5
INTRODUCTION The Pregnancy Nutrition Surveillance System (PNSS) is a program-based surveillance system that monitors maternal health and behavioral indicators associated with birth outcomes among low-income pregnant women participating in federally funded maternal and child health programs. In 2007, Missouri PNSS used data exclusively from the Special Supplemental Nutrition Program for Women, Infants and Children (WIC). The number of records accepted for the Missouri PNSS in 2007 was 48,644, which was higher than in 2006 (45,403). Records analyzed by the Centers for Disease Control and Prevention (CDC) consisted of 7.4% prenatal records, 22.4% postpartum records, and 70.3% complete (prenatal through postpartum) records. Data were contributed by approximately 209 WIC clinic sites, which collected data on demographic, health, and behavioral indicators from women during prenatal and postpartum clinic visits. Demographic data collected included maternal race/ethnicity, age, educational level, poverty level and migrant status. Data on participation in food and financial assistance programs (e.g., Supplemental Nutrition Assistance Program (Food Stamp Program) or Temporary Assistance for Needy Families) were collected as well. Indicators, on which data were collected, include maternal health and behavioral indicators and infant health indicators. Maternal health indicators consisted of prepregnancy weight, gestational weight gain and anemia status. The behavioral indicators assessed were smoking, WIC enrollment, and start date of medical care. Infant health indicator data included birthweight, preterm birth, full term low birthweight, and breastfeeding initiation. CDC provided states participating in PNSS with a summary of trends on specific indicators. In addition, CDC generated combined 3-year tables by WIC clinics, counties, local agencies, metro areas, and regions that had more than 100 records available for analysis after exclusions. The combined 3-year tables contain 3-year average prevalence on maternal demographic indicators, maternal health and behavioral indicators, and infant health indicators. Information from the combined 3-year tables was used to create maps showing prevalence on the most important indicators (Appendices 1-12). Limitations of the Pregnancy Nutrition Surveillance System In Missouri, only the WIC program contributed to the PNSS. This means that the Missouri PNSS population does not represent all low-income women in the state (applicants must meet specific income guidelines and must be at nutritional risk to participate in WIC). Since not all states in the country participate in the PNSS, the “national” data do not reflect all such women in the United States. In addition, large demographic and other differences can exist between or within states that participate in PNSS. Other limitations relate to continuity of service and information tracking and reporting. Some women served by WIC in Missouri during pregnancy did not participate in WIC after delivery. Other women moved into or out of a service area while pregnant. Since women came to clinics at different times during and after their pregnancies, some women’s records were not complete when they were compiled and sent to CDC. Yet

2007 Missouri PNSS Summary Report
6
another limitation is that CDC did not analyze data for any clinic site, county, local agency, metro area, or region reporting less than 100 cases. Nevertheless, PNSS is a unique data set. It is the largest, most diverse (racially, ethnically, and geographically) data set available on low-income pregnant women in the nation. The contribution of only WIC data to the PNSS in Missouri allows easier application of the conclusions and recommendations to WIC participants. Thus, it helps determine risk factors and is used to enhance planning interventions that have the potential to decrease infant mortality and poor birth outcomes among the state’s low-income populations at health risk.

2007 Missouri PNSS Summary Report
7
MATERNAL DEMOGRAPHIC CHARACTERISTICS Race/Ethnicity Race/Ethnicity data were analyzed because differences observed in racial and ethnic groups may reflect differences in their susceptibility or exposure to a disease or health problem, or the persistence of that disease or health problem. The majority of the 2007 Missouri PNSS population included 66.4% Non-Hispanic White, 22.8% Non-Hispanic Black, and 8.1% Hispanic women. During the past 10 years, the percentage of Hispanic women in Missouri PNSS has increased from 3.4% to 8.1%. In the 2007 National PNSS, 41.7% of the participants were Non-Hispanic White, 23.3% were Non-Hispanic Black, and 27.9% were Hispanic. The major difference between the National and the Missouri PNSS was that Missouri had a greater proportion of Non-Hispanic White women, while the Nation had a greater proportion of Hispanic women (Figure 1).
72.0 70.0 68.3 67.9 66.7 66.0 65.9 68.3 67.2 66.4
41.7
23.6 23.6 23.4 22.7 21.9 21.5 21.2 21.6 22.1 22.8
23.3
3.4 3.7 3.5 4.1 4.7 5.1 6.1 7.9 8.1 8.1
27.9
0%
25%
50%
75%
100%
1998 1999 2000 2001 2002 2003 2004 2005 2006 2007 Nation 2007
Perc
enta
ge
Year
Figure 1. Racial and Ethnic Distribution Among PNSS Participants,Missouri, 1998-2007 and Nation, 2007
Asian / Pacific Islander
American Indian / Alaskan Native
Hispanic
Black, Non-Hispanic
White, Non-Hispanic
The racial and ethnic disparities among metropolitan and relatively rural regions in the Missouri PNSS were large. For example, in the Northwestern/Cameron region, the proportion of Non-Hispanic White women was 86.3%, while in the Eastern region it was 39.5%. The region with the highest percentage of Hispanic women was Northwestern/Metro (16.4%). In the Eastern region, more than half of all PNSS participants were Non-Hispanic Black women, while in the Southwestern region, only 1.8% were Non-Hispanic Black women (Figure 2).

2007 Missouri PNSS Summary Report
8
86.3
88.6
83.7
86.2
86.6
48.8
39.5
66.4
4.0
4.3
9.0
9.8
1.8
30.5
52.0
22.8
7.5
4.9
4.6
3.0
8.9
16.4
6.1
8.1
0% 20% 40% 60% 80% 100%
Northwestern/Cameron
Northeastern
Central
Southeastern
Southwestern
Northwestern/Metro
Eastern
Missouri
Percentage
Regi
onFigure 2. Mother's Race/Ethnicity by Region,
Missouri PNSS, 2007White, Non-Hispanic
Black, Non-Hispanic
Hispanic
American Indian/ Alaskan Native
Asian/ Pacific Islander
Age The age of the mother can be considered a risk factor because the rates of some indicators vary with age. Less than 1% of women participating in the 2007 Missouri PNSS were younger than 15 years, 7.2% were 15-17 years of age, 14.5% were 18-19 years of age, 62.8% were 20-29 years of age, 14.1% were 30-39 years of age, and less than 1% were 40 years and older (Figure 3).
10.1 9.7 9.6 8.6 8.1 7.7 7.5 7.4 7.7 7.2 6.5
16.5 16.7 16.7 16.2 15.7 15.1 15.0 14.7 14.6 14.5 12.7
58.0 58.3 58.7 59.8 60.2 61.7 61.6 62.2 62.5 62.859.9
13.9 13.9 13.5 14.1 14.6 14.1 14.5 14.2 13.9 14.1 19.0
0.9 0.8 0.9 0.9 0.9 0.9 1.0 1.0 0.9 0.9 1.4
0%
50%
100%
1998 1999 2000 2001 2002 2003 2004 2005 2006 2007 Nation 2007
Perc
enta
ge
Year
Figure 3. Age Distribution Among PNSS Participants,Missouri, 1998-2007 and Nation, 2007
≥40 Years
30-39 Years
20-29 Years
18-19 Years
15-17 Years
<15 Years

2007 Missouri PNSS Summary Report
9
Teens (17 years and younger) and older women (40 years and older) were at greatest risk of poor birth outcomes (1
,2). Figure 4 shows that in the 2007 Missouri PNSS, 7.6% of pregnant women were 17 years and younger while less than 1% were women 40 years and older. From 1998 to 2007, the proportion of pregnant teens in the ≤ 17 years of age group decreased from 10.7% to 7.6%, while the proportion of pregnant women who were ≥ 40 years of age has remained relatively stable.
10.7 10.3 10.19.0 8.6 8.1 8.0 7.8 8.1 7.6
6.9
0.9 0.8 0.9 0.9 0.9 0.9 1.0 1.0 0.9 0.9 1.4
0
5
10
15
1998 1999 2000 2001 2002 2003 2004 2005 2006 2007 Nation 2007
Perc
enta
ge (%
)
Year
Figure 4. Percentages of Pregnant Women Age 17 Years and Younger, and 40 Years and Older in Missouri PNSS, 1998-2007 and Nation, 2007
≤17 Years
≥40 Years
Note: It is advised that data in Missouri and the nation not be compared directly, since they had different distributions on race/ethnicity.
Education Educational level among PNSS participants can be used as an indirect measure for socioeconomic status. Educational level can also be important in relation to indicators, such as smoking habits and breastfeeding initiation. In Figure 5, among 2007 Missouri PNSS participants, 22.3% had completed greater than high school education, 44.9% had completed high school, and 32.9% had not completed their high school education.

2007 Missouri PNSS Summary Report
10
32.9
44.9
22.3
33.1
45.3
21.6
0
20
40
60
< High School High School > High School
Perc
enta
ge (%
)
Mother's Educational Level
Figure 5. Distribution of Educational Level of WIC Participants, Missouri and National PNSS, 2007
Missouri
Nation
The percentage of women with high school and greater than high school education participating in the 2007 Missouri PNSS was similar to the average of all states contributing to the National PNSS in 2007. Poverty Level/Migrant Status The majority (70.4%) of 2007 Missouri PNSS participants reported household income at 0-100% of the federal poverty level, while 28.1% reported household income at 101-200% of the federal poverty level. Nationally, 60.9% of all women participating in the 2007 PNSS were at household income levels less than or equal to 100% of the federal poverty level, and 25.1% reported household incomes at 101-200% of the federal poverty level. Only 10 of the Missouri PNSS participants reported that they were migrants in 2007, compared to 7,469 (0.6%) among PNSS participants in all states participating in the surveillance system in 2007.
2007 Missouri PNSS Summary Report
11
MATERNAL HEALTH AND BEHAVIORAL HEALTH INDICATORS Prepregnancy Weight Status1
Prepregnancy weight is an indicator of the nutritional status of a woman before she becomes pregnant. It is a major factor affecting birth weight and the health of the newborn and the mother. Prepregnancy underweight can be a determinant of low birthweight, preterm, and full term low birthweight, while prepregnancy overweight and obesity can be a determinant of delivery of a high birthweight infant and cesarean section delivery. An association between prepregnancy weight and stillbirth has been reported, with the lowest risk among normal weight women and the highest risk among overweight women (3). In the PNSS, prepregnancy weight status was determined by the body mass index (BMI2
). In WIC clinics, self-reported prepregnancy weight and measured height are used to calculate prepregnancy BMI. According to the prepregnancy BMI, women are classified into one of four weight categories specified by the Institute of Medicine: underweight, normal weight, overweight, and obese (4).
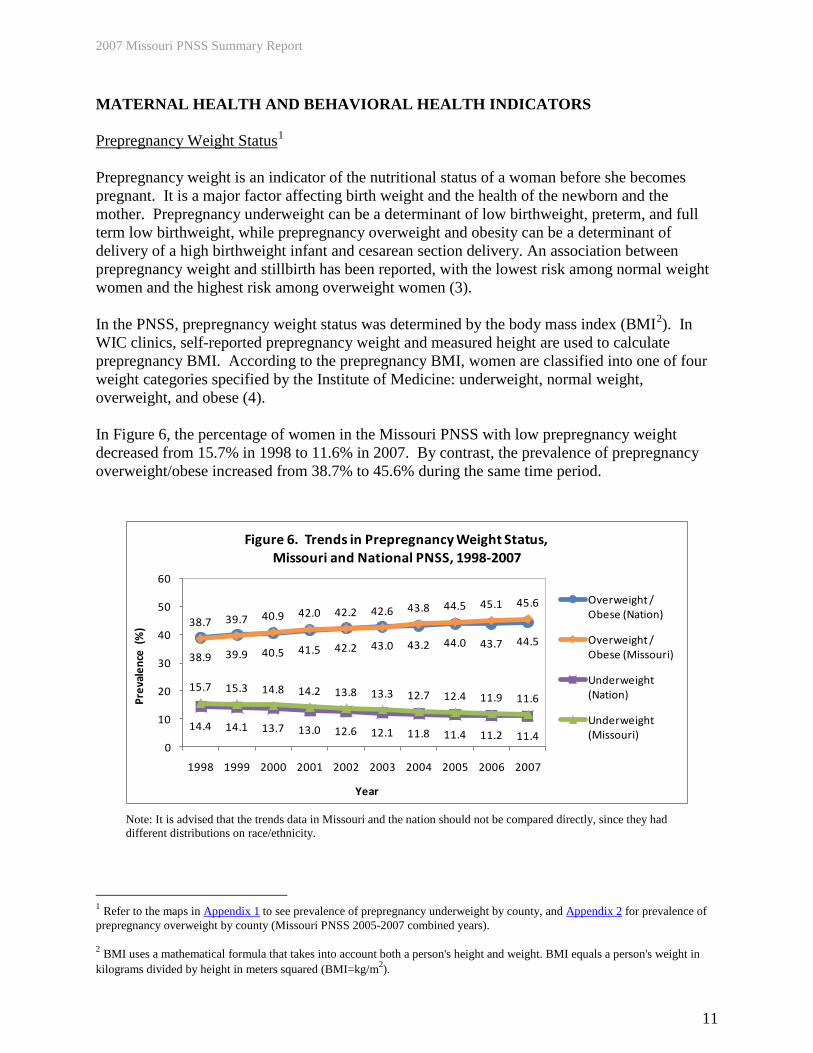
In Figure 6, the percentage of women in the Missouri PNSS with low prepregnancy weight decreased from 15.7% in 1998 to 11.6% in 2007. By contrast, the prevalence of prepregnancy overweight/obese increased from 38.7% to 45.6% during the same time period.
38.9 39.9 40.5 41.5 42.2 43.0 43.2 44.0 43.7 44.5
38.7 39.7 40.9 42.0 42.2 42.6 43.8 44.5 45.1 45.6
14.4 14.1 13.7 13.0 12.6 12.1 11.8 11.4 11.2 11.4
15.7 15.3 14.8 14.2 13.8 13.3 12.7 12.4 11.9 11.6
0
10
20
30
40
50
60
1998 1999 2000 2001 2002 2003 2004 2005 2006 2007
Prev
alen
ce (
%)
Year
Figure 6. Trends in Prepregnancy Weight Status,Missouri and National PNSS, 1998-2007
Overweight / Obese (Nation)
Overweight / Obese (Missouri)
Underweight (Nation)
Underweight (Missouri)
Note: It is advised that the trends data in Missouri and the nation should not be compared directly, since they had different distributions on race/ethnicity.
1 Refer to the maps in Appendix 1 to see prevalence of prepregnancy underweight by county, and Appendix 2 for prevalence of prepregnancy overweight by county (Missouri PNSS 2005-2007 combined years). 2 BMI uses a mathematical formula that takes into account both a person's height and weight. BMI equals a person's weight in kilograms divided by height in meters squared (BMI=kg/m2).
2007 Missouri PNSS Summary Report
12
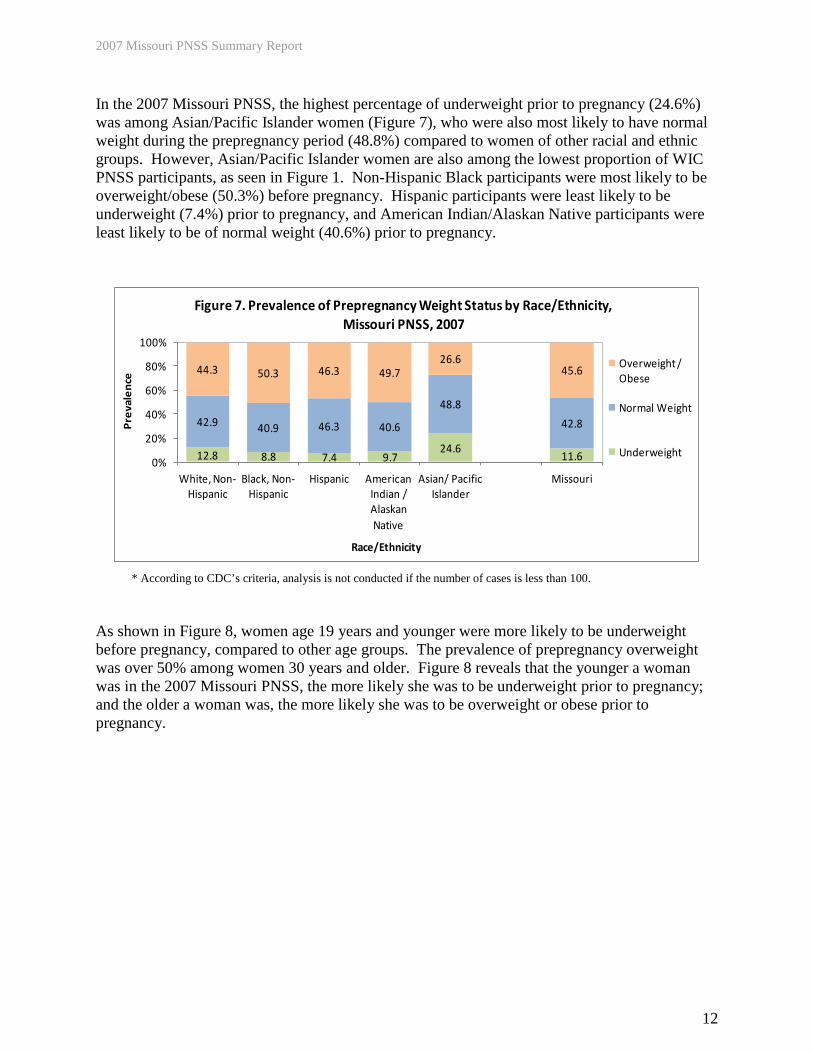
In the 2007 Missouri PNSS, the highest percentage of underweight prior to pregnancy (24.6%) was among Asian/Pacific Islander women (Figure 7), who were also most likely to have normal weight during the prepregnancy period (48.8%) compared to women of other racial and ethnic groups. However, Asian/Pacific Islander women are also among the lowest proportion of WIC PNSS participants, as seen in Figure 1. Non-Hispanic Black participants were most likely to be overweight/obese (50.3%) before pregnancy. Hispanic participants were least likely to be underweight (7.4%) prior to pregnancy, and American Indian/Alaskan Native participants were least likely to be of normal weight (40.6%) prior to pregnancy.
12.8 8.8 7.4 9.724.6
11.6
42.9 40.9 46.3 40.6
48.8
42.8
44.3 50.3 46.3 49.726.6
45.6
0%
20%
40%
60%
80%
100%
White, Non-Hispanic
Black, Non-Hispanic
Hispanic American Indian / Alaskan Native
Asian/ Pacific Islander
Missouri
Prev
alen
ce
Race/Ethnicity
Figure 7. Prevalence of Prepregnancy Weight Status by Race/Ethnicity,Missouri PNSS, 2007
Overweight / Obese
Normal Weight
Underweight
* According to CDC’s criteria, analysis is not conducted if the number of cases is less than 100.
As shown in Figure 8, women age 19 years and younger were more likely to be underweight before pregnancy, compared to other age groups. The prevalence of prepregnancy overweight was over 50% among women 30 years and older. Figure 8 reveals that the younger a woman was in the 2007 Missouri PNSS, the more likely she was to be underweight prior to pregnancy; and the older a woman was, the more likely she was to be overweight or obese prior to pregnancy.

2007 Missouri PNSS Summary Report
13
24.419.318.7
26.416.4
33.3
10.8
47.8
6.4
58.6
5.9
59.5
0
20
40
60
80
Underweight Overweight / Obese
Prev
alen
ce (%
)
Prepregnancy Weight Status
Figure 8. Prevalence of Underweight and Overweight/Obese Prepregnancy by Mother's Age, Missouri PNSS, 2007
<15 Years
15-17 Years
18-19 Years
20-29 Years
30-39 Years
≥40 Years
In the 2007 Missouri PNSS, women who were underweight before pregnancy were more likely to deliver a low birthweight baby (12.1%), compared with women who were normal weight (8.1%), overweight (7.6%), or obese (6.9%). Women who were obese before pregnancy were more likely to deliver a high birthweight infant (9.7%) compared with those who were overweight (7.4%), normal weight (5.2%), or underweight (2.8%) (Figure 9).
12.18.1 7.6 6.9
2.8
5.2 7.4 9.7
0
5
10
15
20
Underweight Normal Weight Overweight Obese
Prev
alen
ce (%
)
Prepregnancy Weight Status
Figure 9. Prevalence of Low Birthweight and High Birthweight by Prepregnancy Weight Status, Missouri PNSS, 2007
High Birthweight
Low Birthweight
2007 Missouri PNSS Summary Report
14
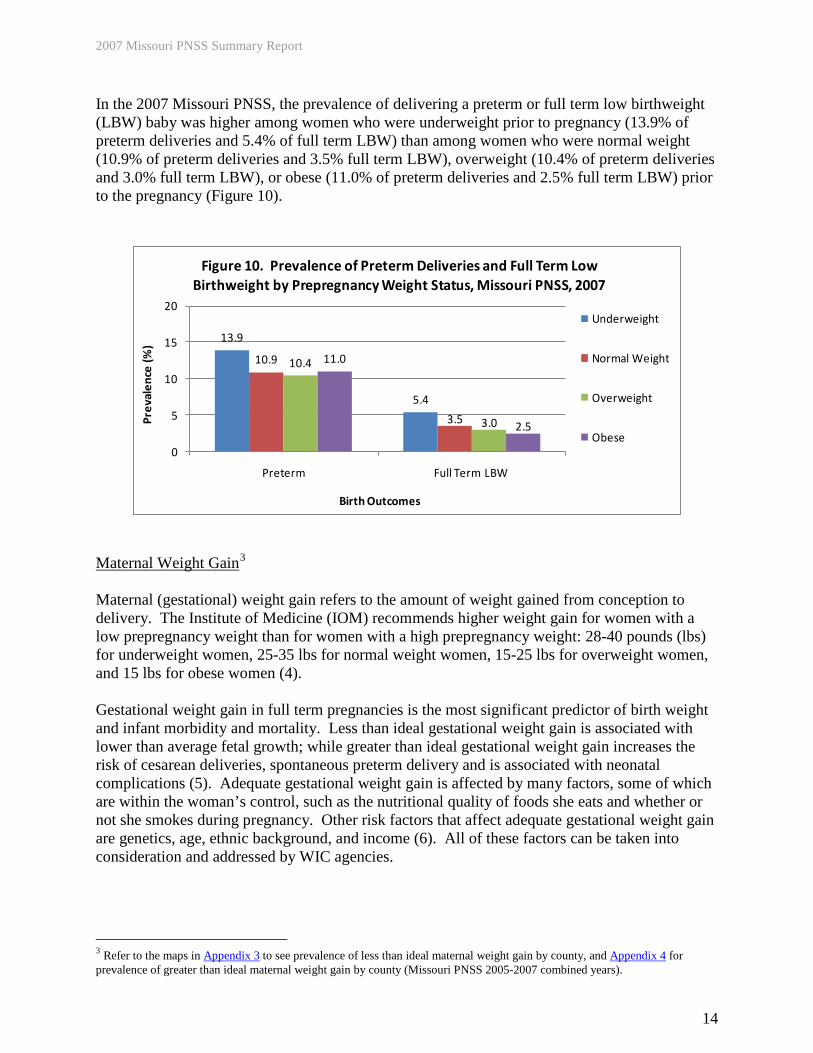
In the 2007 Missouri PNSS, the prevalence of delivering a preterm or full term low birthweight (LBW) baby was higher among women who were underweight prior to pregnancy (13.9% of preterm deliveries and 5.4% of full term LBW) than among women who were normal weight (10.9% of preterm deliveries and 3.5% full term LBW), overweight (10.4% of preterm deliveries and 3.0% full term LBW), or obese (11.0% of preterm deliveries and 2.5% full term LBW) prior to the pregnancy (Figure 10).
13.9
5.4
10.9
3.5
10.4
3.0
11.0
2.5
0
5
10
15
20
Preterm Full Term LBW
Prev
alen
ce (%
)
Birth Outcomes
Figure 10. Prevalence of Preterm Deliveries and Full Term Low Birthweight by Prepregnancy Weight Status, Missouri PNSS, 2007
Underweight
Normal Weight
Overweight
Obese
Maternal Weight Gain3
Maternal (gestational) weight gain refers to the amount of weight gained from conception to delivery. The Institute of Medicine (IOM) recommends higher weight gain for women with a low prepregnancy weight than for women with a high prepregnancy weight: 28-40 pounds (lbs) for underweight women, 25-35 lbs for normal weight women, 15-25 lbs for overweight women, and 15 lbs for obese women (4). Gestational weight gain in full term pregnancies is the most significant predictor of birth weight and infant morbidity and mortality. Less than ideal gestational weight gain is associated with lower than average fetal growth; while greater than ideal gestational weight gain increases the risk of cesarean deliveries, spontaneous preterm delivery and is associated with neonatal complications (5). Adequate gestational weight gain is affected by many factors, some of which are within the woman’s control, such as the nutritional quality of foods she eats and whether or not she smokes during pregnancy. Other risk factors that affect adequate gestational weight gain are genetics, age, ethnic background, and income (6). All of these factors can be taken into consideration and addressed by WIC agencies.
3 Refer to the maps in Appendix 3 to see prevalence of less than ideal maternal weight gain by county, and Appendix 4 for prevalence of greater than ideal maternal weight gain by county (Missouri PNSS 2005-2007 combined years).

2007 Missouri PNSS Summary Report
15
In the Missouri PNSS, the percentages of less than ideal and greater than ideal weight gain during pregnancy have been relatively stable from 1998 to 2007. The percentage of Missouri women with greater than ideal gestational weight gain remained consistently higher than that of the Nation, with Missouri’s highest rate being in 2006 (46.6%). The percentage of less than ideal gestational weight gain decreased slightly from 22.3% in 1998 to 20.0% in 2003 and then remained relatively stable through 2007. For the past 10 years, the percentage of Missouri women with less than ideal gestational weight gain remained consistently lower than that of the Nation (Figure 11).
37.5 41.3 42.9 43.3 43.1 44.1 43.6 43.3 43.1 42.8
43.2 43.7 44.9 44.4 44.3 45.4 45.9 46.1 46.6 45.4
33.128.4
25.9 25.8 25.7 25.2 25.6 25.8 24.8 25.0
22.3 21.7 20.9 21.3 21.6 20.0 20.4 20.3 20.3 20.6
0
10
20
30
40
50
60
1998 1999 2000 2001 2002 2003 2004 2005 2006 2007
Perc
enta
ge (%
)
Year
Figure 11. Trends in Maternal Weight Gain, Missouri and National PNSS, 1998-2007
Greater than Ideal (Nation)
Greater than Ideal (Missouri)
Less than Ideal (Nation)
Less than Ideal (Missouri)
Note: It is advised that the trends data in Missouri and the nation should not be compared directly, since they had different distributions on race/ethnicity.
In the 2007 Missouri PNSS, the majority of women (45.4%) gained greater than ideal weight during pregnancy, compared to 34.0% who gained ideal weight and 20.6% who gained less than ideal weight. Figure 12 shows the percentage of women with greater than ideal gestational weight gain was highest among American Indian/Alaskan Native women (47.9%) and lowest among Asian/Pacific Islander women (32.4%). The percentage of ideal weight gain during pregnancy was lowest among Non-Hispanic Black (33.3%) and American Indian/Alaskan Native women (33.3%) and highest among Asian/Pacific Islander women (41.6%).

2007 Missouri PNSS Summary Report
16
19.6 21.7 25.5 18.8 26.0 20.6
33.5 33.338.3
33.341.6
34.0
46.9 45.0 36.247.9
32.445.4
0%
25%
50%
75%
100%
White, Non-Hispanic
Black, Non-Hispanic
Hispanic American Indian / Alaskan Native
Asian/Pacific Islander
Missouri
Perc
enta
ge
Race/Ethnicity
Figure 12. Maternal Weight Gain by Race/Ethnicity, Missouri PNSS, 2007
Greater than Ideal
Ideal
Less than Ideal
* According to CDC’s criteria, analysis is not conducted if the number of cases is less than 100.
In Figure 13, women 18-19 years of age were more likely to gain greater than ideal weight during pregnancy (47.9%), while women who were 40 years or older were more likely to gain less than ideal weight (27.6%), compared to all other age groups. Women who were 40 years and older also had the largest proportion of ideal maternal weight gain (37.3%).
21.9 20.1 18.3 20.5 23.6 27.6 20.6
31.8 32.9 33.8 34.0 34.337.3
34.0
46.3 47.0 47.9 45.5 42.1 35.145.4
0%
20%
40%
60%
80%
100%
<15 15-17 18-19 20-29 30-39 ≥40 Missouri
Perc
enta
ge
Mother's Age (Years)
Figure 13. Maternal Weight Gain by Mother's Age, Missouri PNSS, 2007
Greater than Ideal
Ideal
Less than Ideal

2007 Missouri PNSS Summary Report
17
In Figure 14, only 26.2% of women who were overweight before pregnancy gained ideal gestational weight, while a majority (64.1%) gained greater than ideal gestational weight. The highest percentage of women (43.4%) with ideal gestational weight gain was in the group of women who were underweight before pregnancy.
29.3 21.69.7
20.9 20.6
43.437.3
26.2
29.5 34.0
27.341.1
64.149.6 45.4
0%
25%
50%
75%
100%
Underweight Normal Weight
Overweight Obese Missouri
Perc
enta
ge
Prepregnancy Weight Status
Figure 14. Maternal Weight Gain by Prepregnancy Weight Status, Missouri PNSS, 2007
Greater than Ideal Maternal Weight Gain
Ideal Maternal Weight Gain
Less than Ideal Maternal Weight Gain
Figure 15 shows that women who gained less than ideal weight during pregnancy were more likely to deliver preterm (16.8%), low birthweight (14.7%), and full term low birthweight (5.9%) babies than women who gained ideal weight during pregnancy (9.1%, 5.5%, and 2.2%, respectively). On the other hand, women who gained greater than ideal weight were more likely to have an infant with high birthweight (9.6%) than women who gained the ideal (4.5%) or less than ideal (3.2%) weight during pregnancy.
16.814.7
5.93.2
10.7
7.73.5 4.5
9.1
5.5
2.2
9.6
0
5
10
15
20
25
Preterm Low Birthweight Full Term LBW High Birthweight
Perc
enta
ge (%
)
Birth Outcomes
Figure 15. Poor Birth Outcomes by Maternal Weight Gain, Missouri PNSS, 2007
Less than Ideal Maternal Weight Gain
Ideal Maternal Weight Gain
Greater than Ideal Maternal Weight Gain

2007 Missouri PNSS Summary Report
18
Maternal Anemia (Low Hemoglobin/Hematocrit)4
Iron deficiency anemia during pregnancy is defined by CDC as less than the 5th percentile of the distribution of hemoglobin (Hb) or hematocrit (Hct) (7). The distribution and cut-off values in the PNSS vary by trimester for pregnant women and are different from those for non-pregnant women.5
Causes of iron deficiency anemia in pregnant women are numerous and multifaceted. An iron-poor diet has been considered as the major cause of this disorder (8). Cigarette smoking is another risk factor for having low hemoglobin/hematocrit because it decreases absorption of micronutrients in the intestine (9). Iron deficiency anemia can be treated with an excellent outcome (10). Treatment may include an iron rich diet, iron supplements and multivitamin/ mineral consumption (11). Iron deficiency anemia during the first two trimesters of pregnancy has been associated with inadequate gestational weight gain, a double risk for preterm delivery, and a 3 times higher risk for delivering a low birthweight infant (12). Longitudinal studies have shown that the highest prevalence of iron deficiency anemia during pregnancy is in the third trimester (13); therefore, the Healthy People 2010 Objectives set a goal to reduce the prevalence of iron deficiency anemia during the third trimester of pregnancy. This objective seeks to reduce the percentage of low-income women with iron deficiency anemia in the third trimester to 20% by 2010 (14). In Figure 16, the trends for the prevalence of iron deficiency anemia among women participating in the Missouri PNSS for both the third trimester and postpartum fluctuated somewhat from 1998 to 2007. There was a noticeable slight decrease in iron deficiency anemia among women during the third trimester from 1999 to 2000 and an increase in 2001. The trend remained relatively stable until it increased from 2006 to 2007. The 10 year trend for iron deficiency anemia during the third trimester in Missouri stayed roughly about 5% higher than that of the Nation. The trend in iron deficiency anemia among postpartum women looks nearly opposite of that for women in the third trimester with an increase from 1999 to 2001 and then a relatively stable trend through 2007.
4 Maps for the prevalence of anemia in the third trimester of pregnancy by county and the prevalence of anemia postpartum by county were not provided because over half of the counties had less than 100 cases for analysis on these two indicators. 5 CDC has established criteria to determine if a woman has a low Hb/Hct during pregnancy. Cutoff values for non-smokers used to define low Hb/Hct during each trimester of pregnancy are: first and third trimesters Hb <11 gm/dl or Hct < 33%; second trimester Hb <10.5 gm/dl or Hct <32%; postpartum Hb <12 gm/dl or Hct <36%.

2007 Missouri PNSS Summary Report
19
29.3 29.9 29.7 29.431.3 30.6 30.8 31.2
32.233.5
35.1 35.434.1
35.8 36.2 36.1 36.1 36.9 37.4
40.5
27.4 27.128.0
29.2 28.2 29.4 28.8 29.4 29.2 29.8
26.324.8
25.727.7 27.1 27.1 27.9 28.0 28.8 28.4
20
25
30
35
40
45
1998 1999 2000 2001 2002 2003 2004 2005 2006 2007
Prev
alen
ce (%
)
Year
Figure 16. Trends in Prevalence of Anemia in 3rd Trimester and Postpartum, Missouri and National PNSS, 1998-2007
3rd Trimester (Nation)
3rd Trimester (Missouri)
Postpartum (Nation)
Postpartum (Missouri)
Note: It is advised that the trends data in Missouri and the nation should not be compared directly, since they had different distributions on race/ethnicity.
The prevalence of iron deficiency anemia in the third trimester in the 2007 Missouri PNSS varied among racial and ethnic groups (Figure 17). Non-Hispanic Black women were at a higher risk, compared to all other groups. More than half (57.5%) of Non-Hispanic Black participants were diagnosed with iron deficiency anemia during the third trimester, which was 1.7 times greater than the prevalence for Non-Hispanic White women (34.7%). More than half (49.0%) of Non-Hispanic Black women were also at a higher risk of having iron deficiency anemia after delivery, which was 2.2 times greater than Non-Hispanic White participants (22.3%).
34.7
57.5
35.7 40.5
22.3
49.0
27.1 31.5 27.0 28.4
0
20
40
60
80
100
White, Non-Hispanic
Black, Non-Hispanic
Hispanic American Indian/ Alaskan Native*
Asian Pacific Islander*
Missouri
Prev
alen
ce (%
)
Mother's Race/Ethnicity
Figure 17. Prevalence of Anemia in the 3rd Trimester and Postpartum by Race/Ethnicity, Missouri PNSS, 2007
3rd Trimester
Postpartum
Healthy People 2010 Objective: 3rd Trimester
(20%)
* According to CDC’s criteria, analysis is not conducted if the number of cases is less than 100.

2007 Missouri PNSS Summary Report
20
The prevalence of iron deficiency anemia among the 2007 Missouri PNSS also varied between age groups. In Figure 18, the highest prevalence of iron deficiency anemia during both the third trimester (45.3%) and postpartum (35.1%) was in women 15-17 years of age. During the third trimester of pregnancy, the prevalence of iron deficiency anemia slightly decreased with increasing age. A similar trend occurred in women during the postpartum period with the exception of the 40 years and older group (25.6%), whose prevalence was less than that of the 20-29 year olds (27.9%) but more than that of the 30-39 year olds (25.0%).
45.3 43.939.9 36.735.1
31.6 27.9 25.0 25.6
0
20
40
60
80
15-17 18-19 20-29 30-39 ≥40*
Prev
alen
ce (%
)
Mother's Age (Years)
Figure 18. Prevalence of Anemia in 3rd Trimester and Postpartum by Mother's Age, Missouri PNSS, 2007
3rd Trimester
Postpartum
Healthy People 2010 Objective:
3rd Trimester (20%)
* According to CDC’s criteria, analysis is not conducted if the number of cases is less than 100.
Medical Care6
Women who begin medical care after the first trimester are at a higher risk for poor pregnancy outcomes with infants being born prematurely, with low birthweight, or growth retarded (15). One of the Healthy People 2010 Objectives is to increase the percentage of women who begin receiving medical care in the first trimester of pregnancy to 90% (14). Medical care in the PNSS indicates the month in which medical care began for the current pregnancy. Medical care data were collected at the prenatal and postpartum visits. However, a WIC participant would have only postpartum medical care data if she was enrolled in the WIC program after delivering the baby. Figure 19 shows that nearly three-fourths of Missouri WIC participants received medical care during the first trimester of pregnancy in 2007. This percentage (72.5%) is up from 69.1% in 1999. The proportion of women not receiving medical care during the first trimester decreased slightly from 1999 (17.3%) to 2000 (15.8%) but then remained relatively stable through 2007 (15.1%). Additionally, the proportion of women in Missouri not receiving medical care has been approximately 5-12% higher than that of the 6 Refer to the maps in Appendix 5 to see the percentage of WIC women who had medical care in the first trimester of pregnancy and Appendix 6 for the percentage of WIC women who had no medical care during pregnancy (Missouri PNSS 2005-2007 combined years).

2007 Missouri PNSS Summary Report
21
Nation for the past nine years, with the difference growing as the National percentage continues to decline while the Missouri percentage remains relatively stable.
75.4
74.2 73.9 74.9 76.0 77.0 78.2 78.7 78.5 79.481.2
69.1 71.4 71.8 73.2 73.9 73.4 74.3 72.4 72.5
6.8
10.9 10.7 10.1 9.4 8.8 6.0 6.2 5.6 4.72.1
17.3 15.8 15.8 15.3 15.7 15.9 15.3 15.9 15.1
0
20
40
60
80
100
1998 1999 2000 2001 2002 2003 2004 2005 2006 2007
Perc
enta
ge (%
)
Year
Figure 19. Trends of Percentages of Women Who Received Medical Care During The First Trimester of Pregnancy and Percentages of Women Who
Had No Medical Care, Missouri and National PNSS, 1998-2007
1st Trimester (Nation)
1st Trimester (Missouri)
No Medical Care (Nation)
No Medical Care (Missouri)
Healthy People 2010 Objective: 1st Trimester
(90%)
Note: It is advised that the trend data for Missouri and the nation should not be compared directly, since they had different distributions on race/ethnicity.
WIC Enrollment7
A number of studies have shown that enrollment in WIC is associated with a lower prevalence of small-for-gestational-age deliveries and preterm deliveries. In addition, longer enrollment in the WIC program is associated with a reduced risk of low birthweight. Women who participate in WIC show better dietary intake and prenatal weight gain than those who do not (16). The percentage of women in Missouri entering WIC during the first trimester of pregnancy remained relatively stable from 1998 to 2007 (Figure 20). The percentage of women enrolled in WIC during the first trimester of pregnancy was higher than in the second (26.3%) and third (12.9%) trimesters, and postpartum (20.5%) (Figure 21).
7 Refer to the map in Appendix 7 to see the percentage of women enrolled in WIC during the first trimester of pregnancy by county (Missouri PNSS 2005-2007 combined years).

2007 Missouri PNSS Summary Report
22
27.4 27.7 26.8 25.9 27.8 27.7 30.931.9 31.2 31.3
39.5 39.8 39.9 39.4 40.8 41.5 40.9 42.0 41.6 40.2
0
10
20
30
40
50
60
1998 1999 2000 2001 2002 2003 2004 2005 2006 2007
Perc
enta
ge (%
)
Year
Figure 20. Trends in WIC Enrollment During First Trimester of Pregnancy, Missouri and National PNSS, 1998-2007
1st Trimester (Nation)
1st Trimester (Missouri)
Note: It is advised that the trend data in Missouri and the nation should not be compared directly, since they had different distributions on race/ethnicity.
40.2
26.3
12.9
20.5
0
10
20
30
40
50
1st Trimester 2nd Trimester 3rd Trimester Postpartum
Perc
enta
ge (%
)
Figure 21. Timing of WIC Enrollment, Missouri PNSS, 2007
Smoking During Pregnancy8
Smoking during pregnancy increases the risk of miscarriage, preterm birth, and infant death, including sudden infant death syndrome (SIDS or “crib death”) (17). It is widely known that women who smoke during pregnancy are more likely to have low birthweight infants. In the 2007 Missouri PNSS, the percentage of women who did not smoke during pregnancy and had low birthweight infants was 6.8%, but the percentage of women who smoked and had low
8 Refer to the map in Appendix 8 to see the percentage of women who smoked during the last 3 months of pregnancy by county (Missouri PNSS 2005-2007 combined years).

2007 Missouri PNSS Summary Report
23
birthweight infants was 9.7%. Figure 22 shows the 10-year trend (1998-2007) of the percentage of women in the WIC program who smoked 3 months prior to pregnancy and the last 3 months of pregnancy. For this time period, the lowest prevalence (37.3%) of smoking 3 months prior to pregnancy in Missouri PNSS occurred in 2007. The trend for women enrolled in WIC who smoked the last 3 months of pregnancy fluctuated, but decreased in general from 1998 (26.2%) to 2007 (23.8%). Figure 22 shows that each year, about one-third of women enrolled in WIC who smoked 3 months prior to pregnancy quit smoking after they were aware of their pregnancy. However, approximately one-fourth of the pregnant women indicated they still smoked during the last three months of pregnancy each year from 1998 to 2007. The 2010 Healthy People Objective is to reduce the rate of cigarette smoking during pregnancy to 1% (14).
34.5 34.831.3 31.6 30.9
29.2 29.0 30.028.3
26.6
39.5 39.2 40.0 40.0 39.337.8 38.0 38.3 39.3
37.3
20.422.9
21.4 21.5 20.5 19.8 19.1 19.417.5
15.8
26.2 25.2 25.6 25.4 24.8 24.0 24.5 25.0
25.423.8
10
20
30
40
50
1998 1999 2000 2001 2002 2003 2004 2005 2006 2007
Perc
enta
ge (%
)
Year
Figure 22. Trends of Women Who Smoked 3 Months Prior to Pregnancy and Last 3 Months of Pregnancy, Missouri and National PNSS, 1998-2007
3 months prior to pregnancy (Nation)
3 months prior to pregnancy (Missouri)
Last 3 months of pregnancy (Nation)
Last 3 months of pregnancy (Missouri)
Note: It is advised that the trend data in Missouri and the nation should not be compared directly, since they had different distributions on race/ethnicity.
Figure 23 shows that Non-Hispanic White women in WIC had the highest rates of smoking 3 months prior to and the last 3 months of pregnancy (46.6% and 30.4%, respectively), while Hispanic women had the lowest rates (9.1% and 4.8%, respectively).

2007 Missouri PNSS Summary Report
24
46.6
21.8
9.1
31.6
9.5
37.3
30.4
12.7
4.8
19.0
5.5
23.8
0
20
40
60
White, Non-Hispanic
Black, Non-Hispanic
Hispanic American Indian/ Alaskan Native
Asian/Pacific Islander
Missouri
Perc
enta
ge (%
)
Mother's Race/Ethnicity
Figure 23. Percentage of Women Who Smoked 3 Months Prior to Pregnancy and Last 3 Months of Pregnancy by Race/Ethnicity, Missouri PNSS, 2007
3 Months Prior to Pregnancy
Last 3 Months of Pregnancy
Healthy People 2010 Objective: Last 3 Months
(1%)
* According to CDC’s criteria, analysis is not conducted if the number of cases is less than 100.
Educational level was also correlated with WIC participants’ smoking behaviors. The higher the level of education a woman had received, the less likely she would smoke prior to or during pregnancy. Figure 24 shows that the rates of WIC women who smoked 3 months prior to pregnancy and the last 3 months of pregnancy were highest among those who had less than a high school education (44.8% and 32.3%, respectively). In contrast, the rates for those who had greater than a high school education were lowest on these two indicators (25.2% and 13.1%, respectively).
44.8
37.7
25.2
37.332.3
23.0
13.1
23.8
0
20
40
60
< High School High School > High School Missouri
Prev
alen
ce (%
)
Mother's Educational Level
Figure 24. Prevalence of Women Who Smoked 3 Months Prior to Pregnancy and Last 3 Months of Pregnancy by Education, Missouri PNSS, 2007
3 Months Prior to Pregnancy
Last 3 Months of Pregnancy
Healthy People 2010 Objective: Last 3
Months (1%)

2007 Missouri PNSS Summary Report
25
Secondary Smoke from Other Household Members Secondary smoke from other household members is also unhealthy for women during pregnancy and for both the mother and the infant after birth. Infants exposed to secondary smoke are more likely to have respiratory infections (18). In Figure 25, the 10-year trend data show that before 2002, more than 40% of Missouri women enrolled in WIC during the prenatal period and more than 30% of those enrolled during the postpartum period lived with other household members who were smokers. However, the general trend for both indicators from 1998 to 2007 is a decrease from 43.2% to 37.4% for household smoking during pregnancy and 35.4% to 29.0% after delivery, but these rates are still considerably higher than those for the Nation.
31.6 31.7 29.0
28.5 27.8
25.6 25.0
27.6
22.520.9
43.2 42.8
41.8 40.439.3
37.6 37.2 37.8 38.3 37.4
26.628.2
26.525.3 24.6
26.2 27.126.5
24.122.6
35.434.1 33.3
31.329.6
28.5 29.2 29.4 29.929.0
15
20
25
30
35
40
45
1998 1999 2000 2001 2002 2003 2004 2005 2006 2007
Perc
enta
ge (%
)
Year
Figure 25. Trends of WIC Women Living With Another Household Member Who Smoked, Missouri and National PNSS, 1998-2007
During Pregnancy (Nation)
During Pregnancy (Missouri)
Postpartum (Nation)
Postpartum (Missouri)
Note: It is advised that the trend data in Missouri and the nation should not be compared directly, since they had different distributions on race/ethnicity.
Figure 26 shows that during the prenatal period, a higher percentage of Non-Hispanic White (44.2%) and American Indian/Alaskan Native women (33.7%) lived with a household member who smoked, compared to other racial and ethnic groups. Comparatively, during the prenatal period, a lower percentage of Hispanic (14.7%) and Asian/Pacific Islander women (23.0%) lived with a household member who smoked. The percentage of postpartum women living with a household member who smoked was highest for Non-Hispanic White women (36.3%) and lowest for the American Indian/Alaskan Native women (25.8%).

2007 Missouri PNSS Summary Report
26
44.2
25.7
14.7
33.7
23.0
37.436.3
15.4
10.5
25.816.3
29.0
0
10
20
30
40
50
White, Non-Hispanic
Black, Non-Hispanic
Hispanic American Indian / Alaskan Native
Asian / Pacific Islander
Missouri
Perc
enta
ge (%
)
Mother's Race/Ethnicity
Figure 26. Percentage of Women Living With Another Household Member Who Smoked by Race/Ethnicy, Missouri PNSS, 2007
Prenatal
Postpartum
* According to CDC’s criteria, analysis is not conducted if the number of cases is less than 100.
The educational level of a woman enrolled in WIC was also correlated to the rate of secondary smoking in the household. Figure 27 shows that the higher the educational level of a woman, the less likely this woman would be living with another household member who smokes.
45.5
36.7
24.9
37.436.5
28.7
18.8
29.0
0
10
20
30
40
50
< High School High School > High School Missouri
Perc
enta
ge (%
)
Mother's Educational Level
Figure 27. Percentage of Women Living With Another Household Member Who Smoked by Education, Missouri PNSS, 2007
Prenatal
Postpartum

2007 Missouri PNSS Summary Report
27
INFANT HEALTH INDICATORS
Low and High Birthweight9
Low birthweight (less than 2,500 grams or 5.5 pounds) is a major determinant of neonatal mortality and post-neonatal mortality. Infants with low birthweight are more likely to experience developmental delays and disabilities than infants with normal birthweight (19,20). The most important factors for low birthweight are cigarette smoking, followed by nutrition and pre-pregnancy weight (21). In addition, teenage mothers are at a higher risk for having low birthweight infants (22). Socioeconomic factors are strongly associated with low birthweight (23). The Healthy People 2010 Objective is to reduce the prevalence of low birthweight to less than 5% (14). On the other hand, high birthweight (greater than 4,000 grams or 8.8 pounds) significantly increases the risk of injuries such as shoulder dystocia (24). In the 1998-2007 Missouri PNSS, the prevalence of low birthweight has remained fairly stable, while the proportion of infants with high birthweight has been decreasing slowly from 8.3% in 1998 to 6.6% in 2007 (Figures 28 and 29).
7.77.9
7.77.9 8.0 8.1 8.1
8.3 8.3
8.2
8.78.4
8.2 8.18.3 8.3 8.4
8.68.4
8.1
6
7
8
9
10
1998 1999 2000 2001 2002 2003 2004 2005 2006 2007
Prev
alen
ce (%
)
Year
Figure 28. Trends in Low Birthweight,Missouri and National PNSS, 1998-2007
Low Birthweight (Nation)
Low Birthweight (Missouri)
9 Refer to the maps in Appendix 9 to see prevalence of low birthweight by county and Appendix 10 for prevalence of high birthweight by county (Missouri PNSS 2005-2007 combined years).

2007 Missouri PNSS Summary Report
28
8.68.4 8.3
7.9
7.5 7.57.3
7.06.8 6.7
8.38.0
7.8 7.77.5
7.2 7.16.8 6.7 6.6
6
7
8
9
10
1998 1999 2000 2001 2002 2003 2004 2005 2006 2007
Prev
alenc
e (%
)
Year
Figure 29. Trends in High Birthweight,Missouri and National PNSS, 1998-2007
High Birthweight (Nation)
High Birthweight (Missouri)
Note: It is advised that the trend data in Missouri and the nation should not be compared directly, since they had different distributions on race/ethnicity.
Figure 30 shows that the risk of having a low birthweight infant was higher among women aged 40 years and older (11.8%). In the 2007 Missouri PNSS, the highest risk of delivering a high birthweight infant (9.1%) was among women 30-39 years of age.
4.37.0 7.2 6.7 7.5
11.8
8.15.5
4.25.2
6.7
9.1 8.8
6.6
0
5
10
15
20
<15 15-17 18-19 20-29 30-39 ≥40 Missouri
Prev
alen
ce (%
)
Mother's Age (Years)
Figure 30. Prevalence of Low and High Birthweight by Mother's Age, Missouri PNSS, 2007
Low Birthweight High Birthweight
Healthy People 2010 Objective:
LBW (5%)
In the 2007 Missouri PNSS, Non-Hispanic Black women had the highest rate of delivering a low birthweight infant (12.1%) than all the other racial or ethnic groups (Figure 31). In fact, Non-Hispanic Black women were more than two times more likely to have low birthweight infants than Hispanic women and 1.7 times more likely than Non-Hispanic White women. In 2007, the proportion of infants born with low birthweight (8.1%) remained higher than the Healthy People

2007 Missouri PNSS Summary Report
29
2010 Objective of 5%. However, the prevalence of low birthweight in Hispanic women (5.5%) is close to reaching the target.
7.2
12.1
5.56.8
5.88.17.3
3.8
8.39.1
6.3 6.6
0
5
10
15
20
White, Non-Hispanic
Black, Non-Hispanic
Hispanic American Indian / Alaskan Native
Asian / Pacific
Islander
Missouri
Prev
alen
ce (%
)
Mother's Race/Ethnicity
Figure 31. Prevalence of Low and High Birthweight by Mother's Race/Ethnicity, Missouri PNSS, 2007
Low Birthweight
High Birthweight
Healthy People 2010 Objective:
LBW (5%)
* According to CDC’s criteria, analysis is not conducted if the number of cases is less than 100.
Preterm Delivery10
Preterm birth refers to delivery before 37 weeks of gestation. Preterm birth has been identified as one of the most important perinatal health problems in industrialized nations (25). An infant born prematurely is at an increased risk of neurological and respiratory disorders, ocular diseases, and death (26). It is increasingly recognized that the prevention of preterm birth is crucial to improving pregnancy outcomes (27). The Healthy People 2010 Objective is to reduce preterm delivery to not more than 7.6% (14). The prevalence of preterm delivery in the 2007 Missouri PNSS varied between racial and ethnic groups (Figure 32). The highest prevalence (13.9 %) was among Non-Hispanic Black mothers, and the lowest prevalence (9.4% and 9.5%) was among American Indian/Alaskan Native and Hispanic mothers, respectively. The general trend decreased from 13.3% in 1999 to 11.2% in 2007 (Figure 33).
10 Refer to the map in Appendix 11 to see prevalence of preterm delivery by county (Missouri PNSS 2005-2007 combined years).

2007 Missouri PNSS Summary Report
30
10.5
13.9
9.5 9.4 9.811.2
0
5
10
15
20
White, Non-Hispanic
Black, Non-Hispanic
Hispanic American Indian /
Alaskan Native
Asian / Pacific Islander
Missouri
Prev
alen
ce (%
)
Mother's Race/Ethnicity
Figure 32. Prevalence of Preterm Birth by Mother's Race/Ethnicity, Missouri PNSS, 2007
Healthy People 2010 Objective
(7.6%)
* According to CDC’s criteria, analysis is not conducted if the number of cases is less than 100.
10.9 11.0 10.9 11.4 11.3 11.3
12.3
12.2
12.1 11.9
13.3 13.1 12.4 13.1 12.8 12.6
12.1
12.7
11.8 11.2
0
5
10
15
20
1998 1999 2000 2001 2002 2003 2004 2005 2006 2007
Perc
enta
ge (%
)
Year
Figure 33. Trends in Preterm Delivery, Missouri and National PNSS, 1998-2007
Preterm (Nation)
Preterm (Missouri)
Note: It is advised that the trend data in Missouri and the nation should not be compared directly, since they had different distributions on race/ethnicity.
Figure 34 shows that the highest proportions of preterm infants were born to mothers aged 40 years and older (17.9%) and 30-39 years of age (13.6%). However, since the number of women in the 40 years and older age group was small (n = 363), caution should to be taken in concluding that the percentages of preterm births in this age group was much higher. The lowest percentage of preterm infants (9.9%) was among mothers in the less than 15 year old age group.

2007 Missouri PNSS Summary Report
31
9.911.3 10.4 10.7
13.6
17.9
0
5
10
15
20
< 15 15-17 18-19 20-29 30-39 ≥ 40
Prev
alen
ce (%
)
Mother's Age (Years)
Figure 34. Prevalence of Preterm Deliveries by Mother's Age, Missouri PNSS, 2007
Breastfeeding Initiation11
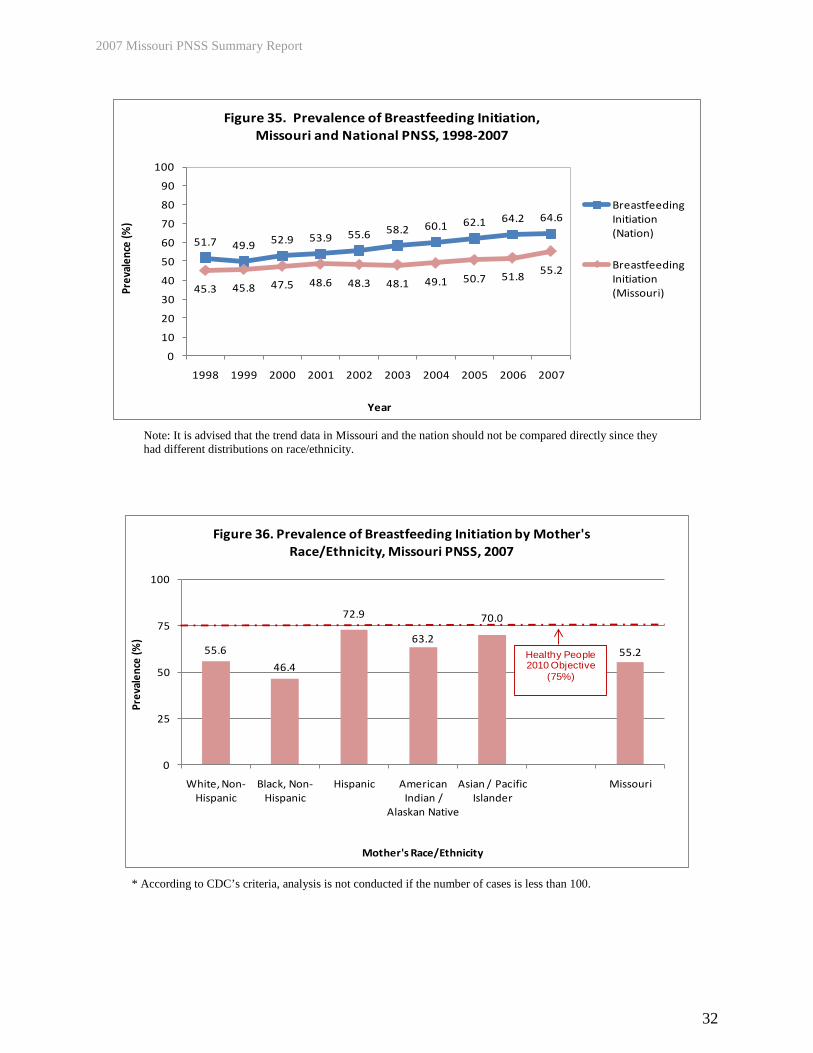
The advantages of breastfeeding for infants, mothers, families, and society have been documented by many studies (28,29,30,31,32,33,34). These advantages include health, nutritional, immunological, developmental, psychological, social, economic, and environmental benefits. The benefits for mothers include earlier return to prepregnancy weight and decreased risk of breast cancer. Breastfeeding is also associated with a lower incidence of obesity during childhood and adolescence, insulin-dependent diabetes mellitus, hypertension and hypercholesterolemia in adulthood. The Healthy People 2010 Objective for breastfeeding initiation is to increase the breastfeeding initiation rate to at least 75% (14). From 1998 to 2007, the proportion of Missouri PNSS women who initiated breastfeeding increased from 45.3% to 55.2% (Figure 35). However, in the 2007 Missouri PNSS, the percentage of women who initiated breastfeeding was still less than the Healthy People 2010 Objective of 75%. The percentage of breastfeeding initiation varied by mother’s race/ethnicity. Only 46.4% of Non-Hispanic Black mothers initiated breastfeeding, while 72.9% of Hispanic mothers initiated breastfeeding (Figure 36).
11 Refer to the map in Appendix 12 to see the breastfeeding initiation rate by county (Missouri PNSS 2005-2007 combined years).
2007 Missouri PNSS Summary Report
32
51.7 49.9 52.9 53.9 55.6 58.2 60.1 62.1 64.2 64.6
45.3 45.8 47.5 48.6 48.3 48.1 49.1 50.7 51.8 55.2
0
10
20
30
40
50
60
70
80
90
100
1998 1999 2000 2001 2002 2003 2004 2005 2006 2007
Prev
alen
ce (%
)
Year
Figure 35. Prevalence of Breastfeeding Initiation,Missouri and National PNSS, 1998-2007
Breastfeeding Initiation (Nation)
Breastfeeding Initiation (Missouri)
Note: It is advised that the trend data in Missouri and the nation should not be compared directly since they had different distributions on race/ethnicity.
55.6
46.4
72.9
63.2
70.0
55.2
0
25
50
75
100
White, Non-Hispanic
Black, Non-Hispanic
Hispanic American Indian /
Alaskan Native
Asian / Pacific Islander
Missouri
Prev
alen
ce (%
)
Mother's Race/Ethnicity
Figure 36. Prevalence of Breastfeeding Initiation by Mother's Race/Ethnicity, Missouri PNSS, 2007
Healthy People 2010 Objective
(75%)
* According to CDC’s criteria, analysis is not conducted if the number of cases is less than 100.
2007 Missouri PNSS Summary Report
33
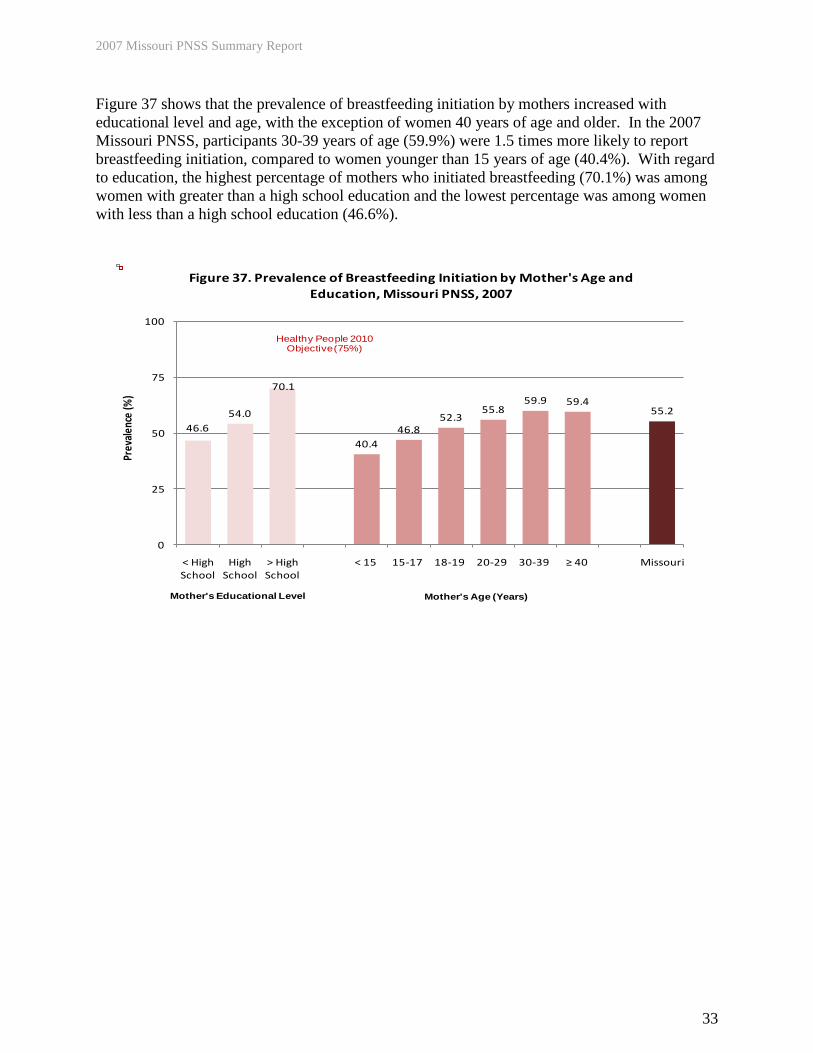
Figure 37 shows that the prevalence of breastfeeding initiation by mothers increased with educational level and age, with the exception of women 40 years of age and older. In the 2007 Missouri PNSS, participants 30-39 years of age (59.9%) were 1.5 times more likely to report breastfeeding initiation, compared to women younger than 15 years of age (40.4%). With regard to education, the highest percentage of mothers who initiated breastfeeding (70.1%) was among women with greater than a high school education and the lowest percentage was among women with less than a high school education (46.6%).
46.654.0
70.1
40.446.8
52.355.8
59.9 59.455.2
0
25
50
75
100
< High School
High School
> High School
< 15 15-17 18-19 20-29 30-39 ≥ 40 Missouri
Prev
alen
ce (%
)
Figure 37. Prevalence of Breastfeeding Initiation by Mother's Age and Education, Missouri PNSS, 2007
Mother's Educational Level Mother's Age (Years)
Healthy People 2010 Objective (75%)

2007 Missouri PNSS Summary Report
34
CONCLUSIONS AND RECOMMENDATIONS The Healthy People 2010 Objectives were designed to serve as goals for monitoring progress toward improving the health of the nation. Missouri’s PNSS population is moving toward the objectives on prenatal care, preterm birth, smoking during pregnancy, and breastfeeding initiation. There has been a slight overall increase in the percentage of pregnant women who received prenatal medical care in the first trimester and a slight overall decrease in the prevalence of preterm delivery and smoking during pregnancy from 1998 to 2007. There has been approximately a 10% increase in the percentage of mothers who initiated breastfeeding in the early postpartum period since 1998. Additionally, the following indicators have moved in a positive direction in the past ten years: the percentage of women who were underweight prior to pregnancy has decreased, the percentage of women who had less than ideal weight gain during pregnancy decreased slightly, the percentages of women living in a smoking household during pregnancy and after delivery have both decreased, and the percentage of high birth weight infants has decreased. However, the Missouri PNSS population is moving away from goals on overweight prepregnancy weight status, greater than ideal weight gain during pregnancy, and iron deficiency anemia. There have been increases in the percentages women who were overweight prior to pregnancy, women who had greater than ideal weight gain during pregnancy, and iron deficiency anemia during the third trimester and postpartum period. Finally, the prevalence of low birth weight infants and the percentage of women enrolled in WIC during the first trimester of pregnancy have remained relatively stable over the past 10 years. Compared with the National PNSS data12
, as shown in Table 1, the percentage of pregnant women in the Missouri PNSS who had greater than ideal weight gain was slightly higher than the national level. The percentage of women who had preterm births was lower than the national level, while the percentage of low birthweight infants was almost the same and just barely higher than the national level. However, the percentage of pregnant women who had iron deficiency anemia in the third trimester and the percentage of women who smoked during the last three months of pregnancy were both higher than the national levels. The percentage of women who received medical care in the first trimester and the percentage of women who initiated breastfeeding were lower than the national levels.
12 The proportions of racial and ethnic indicators in the 2007 National PNSS were different from those in the 2007 Missouri PNSS. Therefore, to make the Missouri PNSS population comparable to the Nation on indicators of interest, a standardization procedure was applied to Missouri’s PNSS data when a comparison occurred. The procedure is available on CDC’s website: http://www.cdc.gov/pednss/how_to/interpret_data/what/example.htm.

2007 Missouri PNSS Summary Report
35
Table 1. Monitoring Healthy People 2010 Objectives Using Missouri PNSS Trends 1998-2007 and Comparing Missouri and
National PNSS Data on Selected Health and Behavioral Indicators
Indicator
Healthy People 2010 Objectives Monitored by PNSS*
Trend of the Missouri PNSS 1998-2007
National PNSS
Prevalence 2007
Missouri PNSS
Adjusted Prevalence
2007**
Ideal Weight Gain
Increase the proportion of women who achieve a recommended weight gain during their pregnancies (no target established)
Stable 32.2 33.7
Anemia in 3rd Trimester
Decrease the proportion of low-income pregnant women with iron deficiency anemia in the third trimester to 20% (19-13)
Increase from 1998 to 2007 33.5 37.8
Medical Care 1st Trimester
Increase the proportion of pregnant women who receive medical care in the first trimester to 90% (16-10a)
Slight increase from 1999 to 2007 79.4 70.5
Smoking During the Last 3 Months of Pregnancy
Reduce the rate of smoking during pregnancy to 1% (16-17c)
Slight decrease from 1998 to 2007 15.8 17.4
Low Birthweight Decrease low birthweight to 5% (16-10b) Stable 7.1 7.6
Preterm Birth Decrease preterm births to 7.6% (16-11) Slight decrease from 1998 to 2007 11.9 10.7
Breastfeeding Initiation
Increase the proportion of mothers who breast feed in the early postpartum period to 75% (16-19a)
Increase from 1998 to 2007 64.6 57.3
* Healthy People 2010 Objectives: http://www.healthypeople.gov. ** All prevalence values have been standardized based on the race/ethnicity distribution of the nation, according to CDC’s procedure, thus making the state PNSS population comparable to the national PNSS population. The 2007 Missouri PNSS data indicate that state and community public health programs are needed to support the following interventions to meet the state health goals for maternal and child nutrition in low-income populations:
• Educate and encourage women to gain the ideal amount of weight during pregnancy, based on their prepregnancy weight status. Encourage women who are underweight before pregnancy to gain weight to reach normal prepregnancy weight in order to prevent complications, such as low birthweight and preterm delivery. In addition, increase counseling, health education and promotion efforts, and support for women who are overweight or obese before pregnancy. These efforts should address how to manage and maintain a healthy weight in order to prevent the related negative birth outcomes, such as high birthweight.
• Increase support for nutrition education focused on iron rich foods and iron
absorption-enhancing foods to help reduce the percentage of women with low hemoglobin/hematocrit participating in PNSS. Promote adequate multivitamin and iron supplement intake during pregnancy to decrease the risk of having iron deficiency anemia during the third trimester and postpartum.

2007 Missouri PNSS Summary Report
36
• Promote early identification of pregnancy and early entry into comprehensive
prenatal care, including medical care and WIC program services to better help pregnant women obtain all the important information and counseling needed, such as the harm of smoking and the benefit of appropriate food intake.
• Apply the evidence-based approach called the “5 A’s” to help pregnant women quit
smoking. The approach is recommended by the U.S. Public Health Service and the American College of Obstetricians and Gynecologists and has been proven effective for most pregnant smokers.13
• Continue establishment of breastfeeding as a social norm. Research indicates that programs combining breastfeeding education with behavior-oriented counseling were associated with increased rates of breastfeeding initiation and its continuation for up to 3 months.
13 The evidence-based counseling method follows five steps (the “5 A’s”): 1. Ask your patient about her smoking status; 2. Advise her in a clear, strong and personalized manner about the risks of smoking and the benefits of quitting for her self and her fetus; 3. Assess her willingness to make a quit attempt within the next 30 days; 4. Assist her with ways to quit by: suggesting problem solving methods and skills for quitting, providing support as part of the treatment, helping her arrange support among family, friends, and co-workers and providing pregnancy-specific cessation materials; 5. Arrange follow-up contacts with her to assess her smoking status, encourage smoking cessation if she continues to smoke, and refer her to more intensive help if needed. More information is available at: http://www.helppregnantsmokersquit.org/.

2007 Missouri PNSS Summary Report
37
REFERENCES 1. The National Campaign to Prevent Teen and Unplanned Pregnancy. Section E: The changing
portrait of teen childbearing over time. In: DCR Report. Available at: http://www.thenationalcampaign.org/resources/dcr/.
2. O’Reilly-Green C, Cohen WR. Pregnancy in women aged 40 and older. Obstetrics and
Gynecology Clinics of North America 1993 June;20(2):313-331. 3. Smith GC. Predicting antepartum stillbirth. Current Opinion in Obstetrics and Gynecology
2006 Dec;18(6):625-630. 4. Institute of Medicine. Nutrition during pregnancy: Part I: weight gain, part II: nutrient
supplements. Washington, DC: The National Academies Press; 1990. 5. Rosenberg TJ, Garbers S, Chavkin W, et al. Prepregnancy weight and adverse prenatal
outcomes in an ethnically diverse population. Obstetrics & Gynecology 2003;102:1022-1027. 6. Abrams B, Carmichael S, Selvin S. Factors associated with the pattern of maternal weight
gain during pregnancy. Obstetrics & Gynecology 1995;86:170-176. 7. Centers for Disease Control and Prevention. CDC criteria for anemia in children and child-
bearing-aged women. Morbidity and Mortality Weekly Report 1989;38(22):400-404. 8. Guha K. Investigating iron status in microcytic anaemia: Causes and management of iron
deficient anaemia. British Medical Journal 2006 Nov 4;333(7575):972. 9. Cogswell ME, Weisberg P, Spong C. Cigarette smoking, alcohol use and adverse pregnancy
outcomes: implications for micronutrient supplementation. Journal of Nutrition 2003;133:1722S-1731S.
10. Ross EM. Iron deficiency anemia: Risk, symptoms and treatment. Nutrition in Clinical Care
2002;5:Sept/Oct. 11. Centers for Disease Control and Prevention. Recommendations to prevent and control iron
deficiency in the United States. Morbidity and Mortality Weekly Report 1998;47(RR-3):1-36. 12. Scholl TO, Reilly T. Anemia, iron and pregnancy outcome. Journal of Nutrition
2000;130:443S-447S. 13. Black MM, Cutts DB, Frank DA, et al. Special supplemental nutrition program for women,
infants, and children participation and infants' growth and health: a multisite surveillance study. Pediatrics 2004 Jul;114(1):169-176.
14. U.S. Department of Health and Human Services. Tracking Healthy People 2010.
Washington, DC: U.S. Government Printing Office; November 2000.
Appendix 8

2007 Missouri PNSS Summary Report
38
15. Centers for Disease Control and Prevention. PNSS health indicators 2009. Available at:
www.cdc.gov/pednss/what_is/pnss_health_indicators.htm. 16. Rush D, Sloan NL, Leighton J, et al. The national WIC evaluation: Evaluation of the special
supplemental food program for women, infants, and children. V. Longitudinal study of pregnant women. American Journal of Clinical Nutrition 1988;48:439-483.
17. Matturri L, Ottaviani G, Lavezzi AM. Maternal smoking and sudden infant death syndrome:
Epidemiological study related to pathology. Virchows Arch 2006 Dec;449(6):697-706. Epub 2006 Nov 8.
18. Jin C, Rossiqnol AM. Effects of passive smoking on respiratory illness from birth to age
eighteen months, in Shanghai, People's Republic of China. Journal of Pediatrics 1993 Oct;123(4):553-558.
19. Ventura SJ, Kimberly MA, Martin JA, et al. Births and deaths: United States, 1996;
preliminary data. Monthly Vital Statistics Report Vol 46(1) Supp 2. Hyattsville, MD: National Center for Health Statistics; 1997 September 11.
20. Dubois L, Girard M. Determinants of birthweight inequalities: population-based
study. Pediatrics International 2006 Oct;48(5):470-478. 21. Paneth KA. The problem of low birthweight. Future Child 1995;5(1):19-34. 22. MacLeod S, Kiely JL. The effects of maternal age and parity on birthweight: A population-
based study in New York City. International Journal of Obstetrics and Gynecology 1988 Feb;26(1):11-19.
23. Paneth KA. The problem of low birthweight. Future Child 1995;5(1):19–34. 24. Acker DB, Sachs BP, Frieman EA. Risk factors for shoulder dystocia. Obstetrics and
Gynecology 1985;66:762-768. 25. Berkowitz GS, Papiernik E. Epidemiology of preterm birth. Epidemiologic Reviews
1993;15(2):414-443. 26. Institute of Medicine. Nutrition During Pregnancy: Weight Gain and Nutrient
Supplementation. Washington, DC: National Academy Press; 1990. 27. Alexander GR. Preterm birth: Etiology, mechanisms and prevention. Prenatal and Neonatal
Medicine 1998;3:3-9. 28. Turck D. Breastfeeding health benefit for child and mother. Archives de Pediatrie 2006
Dec;12S3:S145-S165. PMID: 16300936 [PubMed – as supplied by publisher]. 29. Leung AK, Sauve RS. Breast is best for babies. Journal of the National Medical Association
2006 July;97(7):1010-1019.
2007 Missouri PNSS Summary Report
39
30. Oddy WH. The impact of breast milk on infant and child health. Breastfeeding Review 2002
Nov;10(3):5-18. 31. Walker WA. The dynamic effects of breastfeeding on intestinal development and host
defense. Advances in Experimental Medicine and Biology 2004;554:155-170. 32. Kramer MS, Chalmer B, Hodnett ED, et al. Promotion of breastfeeding intervention trial
(PROBIT): A randomized trial in the Republic of Belarus. Journal of American Medical Association 2001;285:413-420.
33. Gartner LM, Morton J, Lawrence RA., et al. American academy of pediatrics section on
breastfeeding. Pediatrics 2006 Feb;115(2):496-506. PMID: 15687461 [PubMed – Indexed for MEDLINE].
34. Collaborative Group on Hormonal Factors in Breast Cancer. Breast cancer and breastfeeding:
Collaborative reanalysis of individual data from 47 epidemiological studies in 30 countries, including 50302 women with breast cancer and 96973 women without the disease. Lancet 2002;360:187-95.

2007 Missouri PNSS Summary Report
40
APPENDICES Appendix 1

2007 Missouri PNSS Summary Report
41
Appendix 2

2007 Missouri PNSS Summary Report
42
Appendix 3

2007 Missouri PNSS Summary Report
43
Appendix 4

2007 Missouri PNSS Summary Report
44
Appendix 5

2007 Missouri PNSS Summary Report
45
Appendix 6

2007 Missouri PNSS Summary Report
46
Appendix 7

2007 Missouri PNSS Summary Report
47
Appendix 8

2007 Missouri PNSS Summary Report
48
Appendix 9

2007 Missouri PNSS Summary Report
49
Appendix 10

2007 Missouri PNSS Summary Report
50
Appendix 11
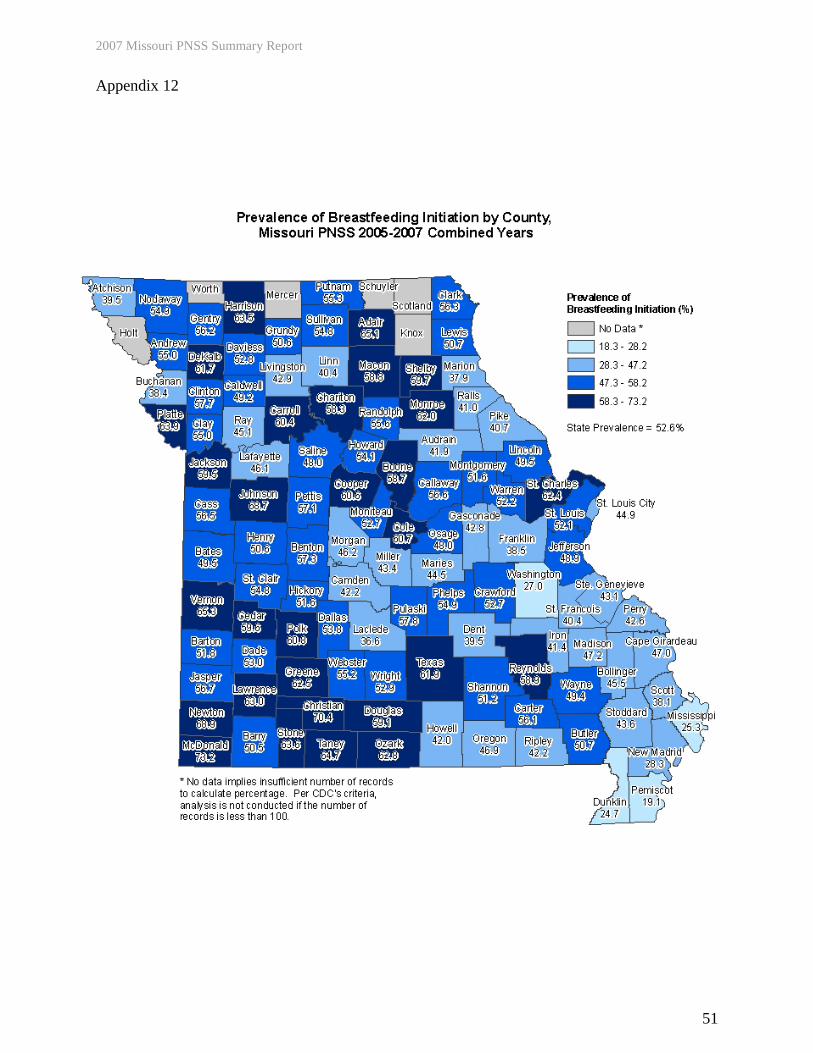
2007 Missouri PNSS Summary Report
51
Appendix 12