preliminary assessment of the effects of blast design
TRANSCRIPT

ASEAN Engineering Journal, Vol 10 No 2 (2020), e-ISSN 2586-9159 p. 58
PRELIMINARY ASSESSMENT OF THE EFFECTS
OF BLAST DESIGN FACTORS ON
FRAGMENTATION AT LAFARGE KANTHAN
LIMESTONE QUARRY, CHEMOR, PERAK
Shaib Abdulazeez Shehu1,2, Mohd Hazizan Mohd Hashim1*, and Nur Aliah Hazirah
Awang Kechik1
1 Strategic Mineral Niche, School of Materials and Mineral Resources Engineering, Universiti Sains
Malaysia, Penang, Malaysia, Tel. +60123551691, *e-mail: [email protected] 2 Department of Mineral and Petroleum Resources Engineering, School of Engineering, Kogi State
Polytechnic, Lokoja, Nigeria, Tel. +2348036553412, e-mail: [email protected]
Received Date: September 19, 2018; Revised Date: March 22, 2020; Acceptance Date: July 13, 2020
Abstract
The results of blasting affect every other downstream operation in quarrying and mining process.
Factors influencing blast results can be classified as either controllable or non-controllable. If desired
fragmentation is to be obtained, the controllable factors (blast geometry and explosive properties)
must be sufficiently designed to match the non-controllable ones (geological factors and legislative
constraints). This study investigates the influence of blast design parameters on rock fragmentation.
Six different blast designs were studied and analyzed. Rock samples were obtained from each face
to evaluate the uniaxial compressive strength (UCS). Images of muck pile were captured using
suitable digital camera. The images were uploaded into the WipFrag software to analyze the
fragmentation resulting from the blasting. The particle size distribution of each blast was obtained,
and the mean fragment size correlated with the blast design parameters. The percentage cumulative
passing for gyratory crusher with the feed size of 1500 mm ranges between 92.8 to 100%. The
stiffness ratio, powder factor and uniaxial compressive strength have high correlation with mean
fragment size. The stiffness ratio increases with mean fragment size with a correlation coefficient of
0.89. The mean fragment size becomes finer with increase in powder factor with a correlation
coefficient of 0.76. Powder factor also has a high correlation with the uniaxial compressive strength
of the rock. The higher the uniaxial compressive strength of rock, the higher the powder factor needed
for a specified fragment size. In this study, spacing to burden ratio has a very weak correlation with
the fragment size. All the studied blast events produced good fragmentation with a uniformity index
varying from 2.097 to 2.525.
Keywords: Fragmentation, Powder factor, Stiffness ratio, Uniaxial compressive strength,
Uniformity index, WipFrag
Introduction
Blast parameters are site specifics. The relationship between these factors and the final
fragmentation is very crucial in designing a blasting programme. The size of fragment is an
important factor to evaluate the efficiency and productivity of blasting [1], [2]. If rock
fragmentation is not accessed regularly, production cost and time delay in quarrying process
can increase beyond expectation. Drilling and blasting constitute 15 to 20% of the total
mining cost [3], and hence the need to tailor blast design towards optimal results to enhance
efficiency of the quarrying process.
If blasting does not generate desired fragment size, there will be an increase in
operational cost due to unnecessary secondary blasting and delays in materials handling [4].

ASEAN Engineering Journal, Vol 10 No 2 (2020), e-ISSN 2586-9159 p. 59
Good blast result could increase loader and excavator productivity by increasing the bucket
and truck fill factors as well as diggability of the excavator [5], [6]. A uniformly sized
fragmentation increases crusher and mill throughput and decreases the comminution energy.
If the drilling and blasting cost is increased due to high explosive charge value,
costs of subsequent operations will be reduced due to the resulting finer fragments [7].
However, excessive explosive must likewise be avoided to minimize environmental damage
and generation of disproportionate fines.
The bench height, burden distance and the powder factor are three core controllable
parameters affecting fragmentation distributions. Muckpile shape and fragment size are
more sensitive to the burden distance in production bench blasting [8], [9]. The powder factor
is essentially determined by the structural properties of the rock like discontinuity, rock
strength and lithology etc. [8], [9], [10], [11]. It is however generally believed that an
increase in powder factor ensures smaller fragment size if the rock factors are held constant
[3], [12].
Singh et al. [13] had observed that mean fragment size increases with bench height
and burden distance. For better accuracy, prediction of fragmentation distribution should not
be based purely on hypothetical and mechanical perceptive but incorporating practical data
from the field along with hypothetical investigation [9], [11]. By this method, a reliable
prediction model can be established for the specific site.
Location and Geology of the Study Area
This study was carried out at Lafarge Kanthan Quarry which is located at Gunung Kanthan
in Chemor, Perak. Figure 1a shows the location of Lafarge Quarry in Peninsula Malaysia
while 1b shows its location in Kanthan.
Figure 1a. Location map of the study quarry in Peninsula Malaysia

ASEAN Engineering Journal, Vol 10 No 2 (2020), e-ISSN 2586-9159 p. 60
Figure 1b. Location map of the study quarry in Kanthan
The study area has a longitude of 101˚06’57.79’’E and a latitude of 04˚46’20.11’’N. The
closest residential area is about 400 m away from the quarry. The quarry produces about 4.1
million tonnes of limestone annually for the construction industry in Malaysia.
The quarry is geologically within Kinta Valley which has been dated Devonian to
Permian timeline [14]. The limestone includes numerous relatively thin argillaceous beds,
exceeding 3000 m in stratigraphic thickness. Kinta Valley mainly consists of Palaeozoic
limestone formations bounded by granitic ridges. Schist is also found at the bottom of the
massive limestone body. The limestone is heavily jointed and fractured [15].
Materials and Methods
Basic blast design parameters were measured for six blast events. After blasting, the
muckpile images were taken using suitable camera for fragmentation analysis. Particle size
distribution graphs were generated based on the size of fragmented rocks. Rock specimen
were collected from each of the working faces for laboratory determination of the strength
value. The results obtained from the fragmentation analysis and point load test were analysed
and correlated with blast design parameters.
Blast Design Data
Six blast events were observed and the data for each blast obtained. The blast holes were
drilled based on the staggered pattern technique. Bulk explosives were used as the blasting
agent with the open cup density of 1.05 g/cm3. The hole diameter, hole depth, burden,
spacing, stemming length and charging density were measured. The blasts were initiated by
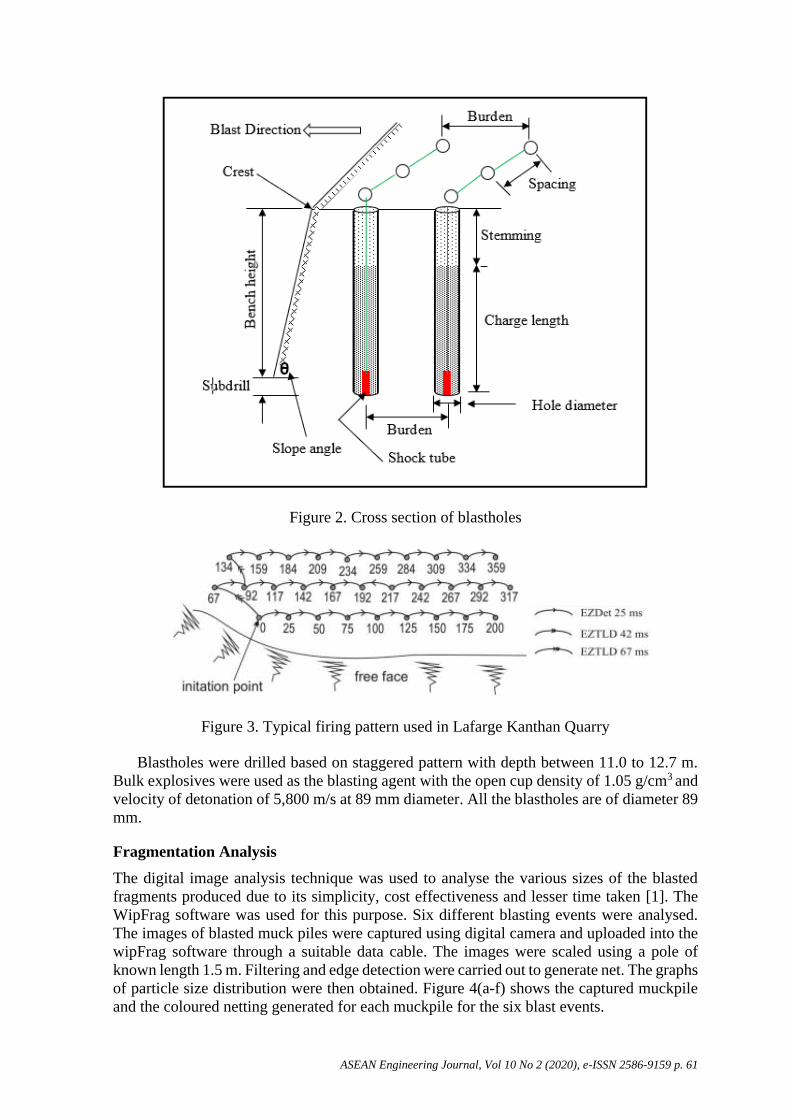
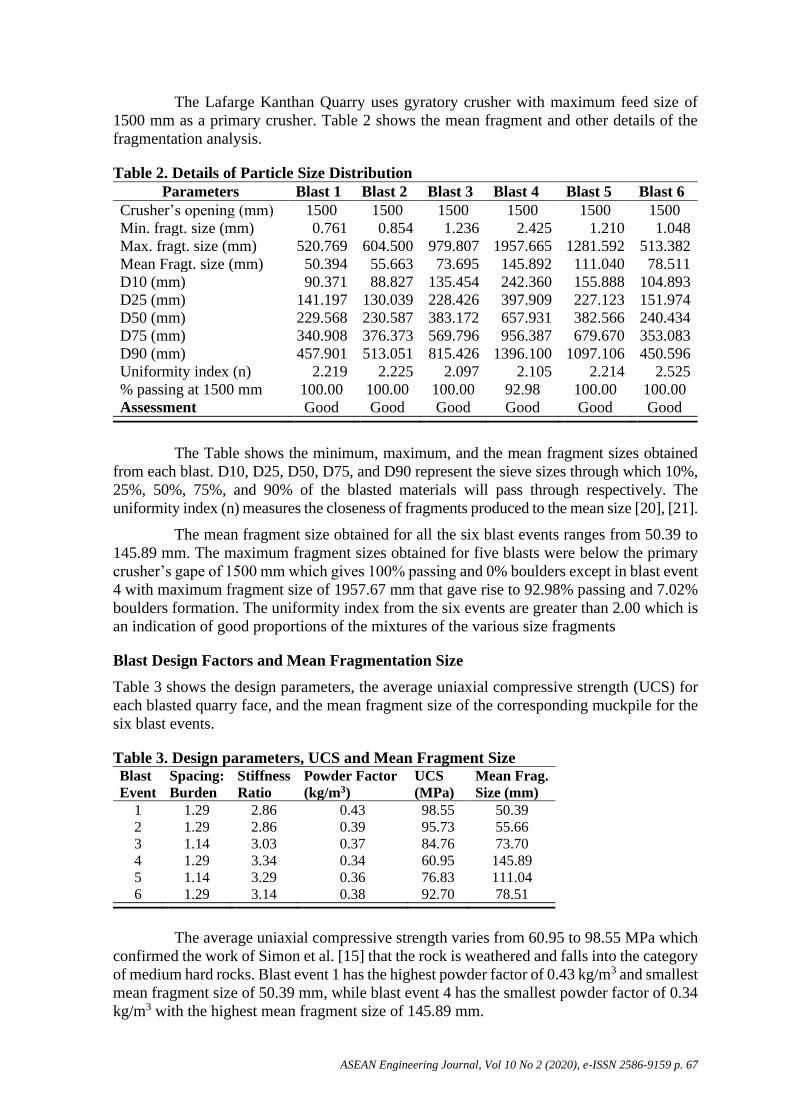
shock tube system sequencing at 25 ms, 42 ms and 67 ms. Figure 2 shows the cross section
of charged blastholes while Figure 3 illustrates a typical firing pattern of Lafarge quarry.
ASEAN Engineering Journal, Vol 10 No 2 (2020), e-ISSN 2586-9159 p. 61
Figure 2. Cross section of blastholes
Figure 3. Typical firing pattern used in Lafarge Kanthan Quarry
Blastholes were drilled based on staggered pattern with depth between 11.0 to 12.7 m.
Bulk explosives were used as the blasting agent with the open cup density of 1.05 g/cm3 and
velocity of detonation of 5,800 m/s at 89 mm diameter. All the blastholes are of diameter 89
mm.
Fragmentation Analysis
The digital image analysis technique was used to analyse the various sizes of the blasted
fragments produced due to its simplicity, cost effectiveness and lesser time taken [1]. The
WipFrag software was used for this purpose. Six different blasting events were analysed.
The images of blasted muck piles were captured using digital camera and uploaded into the
wipFrag software through a suitable data cable. The images were scaled using a pole of
known length 1.5 m. Filtering and edge detection were carried out to generate net. The graphs
of particle size distribution were then obtained. Figure 4(a-f) shows the captured muckpile
and the coloured netting generated for each muckpile for the six blast events.

ASEAN Engineering Journal, Vol 10 No 2 (2020), e-ISSN 2586-9159 p. 62
Figure 4. Captured muckpiles and their nettings
Powder Factor
Powder factor is expressed as the weight of explosives used to blast a given volume of rock.
Equation 1 was used to calculate the powder factor in each blast.
𝑃𝑜𝑤𝑑𝑒𝑟 𝑓𝑎𝑐𝑡𝑜𝑟 =𝑊𝑒𝑖𝑔ℎ𝑡 𝑜𝑓 𝑒𝑥𝑝𝑙𝑜𝑠𝑖𝑣𝑒 𝑝𝑒𝑟 𝑏𝑙𝑎𝑠𝑡ℎ𝑜𝑙𝑒 (𝑘𝑔)
𝑉𝑜𝑙𝑢𝑚𝑒 𝑜𝑓 𝑟𝑜𝑐𝑘 𝑏𝑙𝑎𝑠𝑡𝑒𝑑 𝑝𝑒𝑟 ℎ𝑜𝑙𝑒 (𝑚3) (1)
The quantity of explosive used per hole is the summation of booster or primer charge (P)
and column charge (Q) (Equation 2).
𝐸𝑥𝑝𝑙𝑜𝑠𝑖𝑣𝑒 𝑝𝑒𝑟 ℎ𝑜𝑙𝑒 = 𝑝𝑟𝑖𝑚𝑒𝑟 𝑐ℎ𝑎𝑟𝑔𝑒 (𝑃) + 𝑐𝑜𝑙𝑢𝑚𝑛 𝑐ℎ𝑎𝑟𝑔𝑒(𝑄) (2)
The amount of explosive utilized as column (booster) charge in kilogram was calculated
using Equation 3:
𝐶𝑜𝑙𝑢𝑚𝑛 𝐶ℎ𝑎𝑟𝑔𝑒 =1
4𝜋𝐷2 × 𝑄𝐿 × 𝜌 (3)
where D is the blast hole diameter (m); QL is charged length (m); and 𝜌 is the density of
explosive (kg/m3). The volume of rock broken per hole was estimated with Equation 4.
𝑉𝑜𝑙. 𝑜𝑓 𝑏𝑟𝑜𝑘𝑒𝑛 𝑟𝑜𝑐𝑘 𝑝𝑒𝑟 ℎ𝑜𝑙𝑒 = 𝑆 × 𝐵 × 𝐵𝐻 (4)
where S is the spacing (m); B is burden (m); and BH is the bench height (m). The bench
height was taken as the difference between the hole depth (L) and the Sub drill length (SD)
(Equation 5).
𝐵𝐻 = 𝐿 − 𝑆𝐷 (5)

ASEAN Engineering Journal, Vol 10 No 2 (2020), e-ISSN 2586-9159 p. 63
The Point Load and the Uniaxial Compressive Strength (UCS)
The point load test was used as an indirect measure of the compressive strength of the studied
rocks to determine point strength index, (Is50). The test was performed by subjecting a rock
specimen to an increasingly concentrated load until failure occurs by splitting the specimen.
Ten samples of rock from each blast area were tested to obtain a mean point load
index value. Irregular rock samples of diameters 50 ± 35 mm and of suitable shapes were
selected for point load test. The irregular lumps were shaped by cutting so that the diameter
to length ratio exceeds 1.0. The test procedure was in accordance to suggested methods by
the International Society of Rock Mechanics (ISRM) [16] and the American Society for
Testing and Materials (ASTM) [17]. The uncorrected point load strength value (𝐼𝑠) was
converted to corrected point load (𝐼𝑠50) as suggested by Broch and Franklin [18].
The uniaxial compressive strength (UCS) in MPa was evaluated from corrected point
load strength (𝐼𝑠50) using Equation (6) as recommended by [19].
𝑈𝐶𝑆 = 𝐼𝑠50 × (14~16) = [𝐼𝑆 × (𝐷𝑒
50)
0.45] × (14~16) (6)
where 𝐼𝑆 (MPa) is the uncorrected point load and De is the equivalent core diameter (mm).
Results and Discussion
Drill and Blast Parameters
Table 1 shows the drill and blast design parameters as obtained from each blast event. The
powder factor varies from 0.34 to 0.43 kg/m3 while the quantity of explosive detonated per
blast hole varies from 54.91 kg to 67.73 kg. All the six blast events have same burden of 3.5
m and a constant subdrill of 1 m. Figure 2 and Equation 2 to 5 explained the parameters of
Table 1.
Table 1. Drill and Blast Design Parameters
Percentage Cumulative Particle Size of Muckpiles
Figure 5 to 10 display the particle size distribution analysis chart obtained from the wipFrag
software for each blast event. Fundamentally, each of the figures contains four main parts.
To the left is the chart box that contains salient measurement information – the minimum
particle size, the maximum size, the mean size, some percentage passing sizes, and standard

ASEAN Engineering Journal, Vol 10 No 2 (2020), e-ISSN 2586-9159 p. 64
deviation amongst others. To the left are the sieve sizes and the corresponding cumulative
percentage passing values. The central part of the chart contains a blue line that represents the
cumulative percentage passing curve, and a red histogram that outlines the percentage passing
value for each size class. The horizontal axis (sieve size) is on a log scale for clarity purposes.
Figure 5. Particle size distribution analysis for blast event 1
Figure 6. Particle size distribution analysis for blast event 2

ASEAN Engineering Journal, Vol 10 No 2 (2020), e-ISSN 2586-9159 p. 65
Figure 7. Particle size distribution analysis for blast event 3
Figure 8. Particle size distribution analysis for blast event 4

ASEAN Engineering Journal, Vol 10 No 2 (2020), e-ISSN 2586-9159 p. 66
Figure 9. Particle size distribution analysis for blast event 5
Figure 10. Particle size distribution analysis for blast event 6
ASEAN Engineering Journal, Vol 10 No 2 (2020), e-ISSN 2586-9159 p. 67
The Lafarge Kanthan Quarry uses gyratory crusher with maximum feed size of
1500 mm as a primary crusher. Table 2 shows the mean fragment and other details of the
fragmentation analysis.
Table 2. Details of Particle Size Distribution
The Table shows the minimum, maximum, and the mean fragment sizes obtained
from each blast. D10, D25, D50, D75, and D90 represent the sieve sizes through which 10%,
25%, 50%, 75%, and 90% of the blasted materials will pass through respectively. The
uniformity index (n) measures the closeness of fragments produced to the mean size [20], [21].
The mean fragment size obtained for all the six blast events ranges from 50.39 to
145.89 mm. The maximum fragment sizes obtained for five blasts were below the primary
crusher’s gape of 1500 mm which gives 100% passing and 0% boulders except in blast event
4 with maximum fragment size of 1957.67 mm that gave rise to 92.98% passing and 7.02%
boulders formation. The uniformity index from the six events are greater than 2.00 which is
an indication of good proportions of the mixtures of the various size fragments
Blast Design Factors and Mean Fragmentation Size
Table 3 shows the design parameters, the average uniaxial compressive strength (UCS) for
each blasted quarry face, and the mean fragment size of the corresponding muckpile for the
six blast events.
Table 3. Design parameters, UCS and Mean Fragment Size
The average uniaxial compressive strength varies from 60.95 to 98.55 MPa which
confirmed the work of Simon et al. [15] that the rock is weathered and falls into the category
of medium hard rocks. Blast event 1 has the highest powder factor of 0.43 kg/m3 and smallest
mean fragment size of 50.39 mm, while blast event 4 has the smallest powder factor of 0.34
kg/m3 with the highest mean fragment size of 145.89 mm.
Parameters Blast 1 Blast 2 Blast 3 Blast 4 Blast 5 Blast 6
Crusher’s opening (mm) 1500 1500 1500 1500 1500 1500
Min. fragt. size (mm) 0.761 0.854 1.236 2.425 1.210 1.048
Max. fragt. size (mm) 520.769 604.500 979.807 1957.665 1281.592 513.382
Mean Fragt. size (mm) 50.394 55.663 73.695 145.892 111.040 78.511
D10 (mm) 90.371 88.827 135.454 242.360 155.888 104.893
D25 (mm) 141.197 130.039 228.426 397.909 227.123 151.974
D50 (mm) 229.568 230.587 383.172 657.931 382.566 240.434
D75 (mm) 340.908 376.373 569.796 956.387 679.670 353.083
D90 (mm) 457.901 513.051 815.426 1396.100 1097.106 450.596
Uniformity index (n) 2.219 2.225 2.097 2.105 2.214 2.525
% passing at 1500 mm 100.00 100.00 100.00 92.98 100.00 100.00
Assessment Good Good Good Good Good Good
Blast
Event
Spacing:
Burden
Stiffness
Ratio
Powder Factor
(kg/m3)
UCS
(MPa)
Mean Frag.
Size (mm)
1 1.29 2.86 0.43 98.55 50.39
2 1.29 2.86 0.39 95.73 55.66
3 1.14 3.03 0.37 84.76 73.70
4 1.29 3.34 0.34 60.95 145.89
5 1.14 3.29 0.36 76.83 111.04
6 1.29 3.14 0.38 92.70 78.51

ASEAN Engineering Journal, Vol 10 No 2 (2020), e-ISSN 2586-9159 p. 68
Figure 11 to 14 show the relationship between the evaluated blast design factors
and the mean fragment size obtained.
Figure 11. Regression analysis of mean fragment size and spacing-burden ratio
Figure 12. Regression analysis of mean fragment size and stiffness ratio
Figure 11 shows that the ratio of spacing to burden is insignificant in determining
the mean fragment size of a blast design. In Table 3, blast 1, 2 and 4 have the same spacing
to burden ratio of 1.29 but the mean fragment sizes differ. The much coarser fragment size
of blast 4 (145.89 mm) as compared to blast 1 (50.39 mm) and blast 2 (55.66 mm) of the
same spacing to burden ratio can be attributed to low powder factor (Table 3). Thus, the
spacing to burden ratio is not highly related to the mean fragment size produced. However,
adequate burden prevents the rapid release of gases to the atmosphere that can result into air
blasts and poor fragmentation while good spacing prevents excessive crushing and
inadequate fracturing [12].
ASEAN Engineering Journal, Vol 10 No 2 (2020), e-ISSN 2586-9159 p. 69
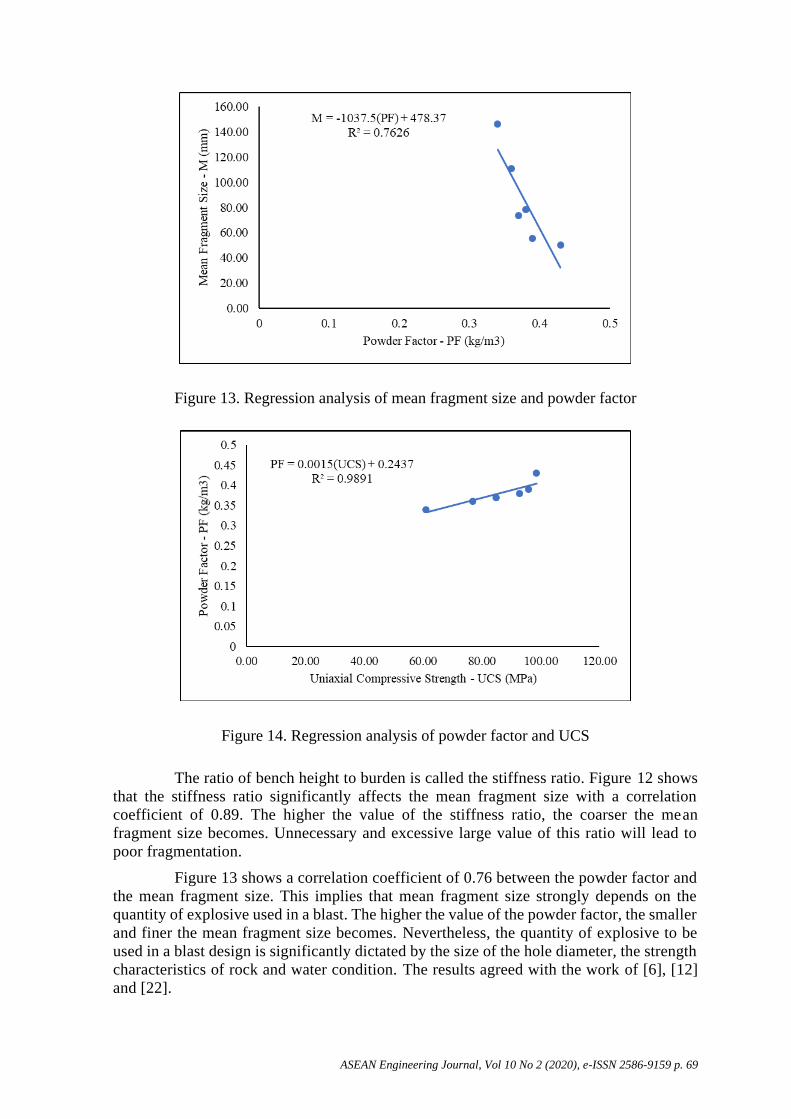
Figure 13. Regression analysis of mean fragment size and powder factor
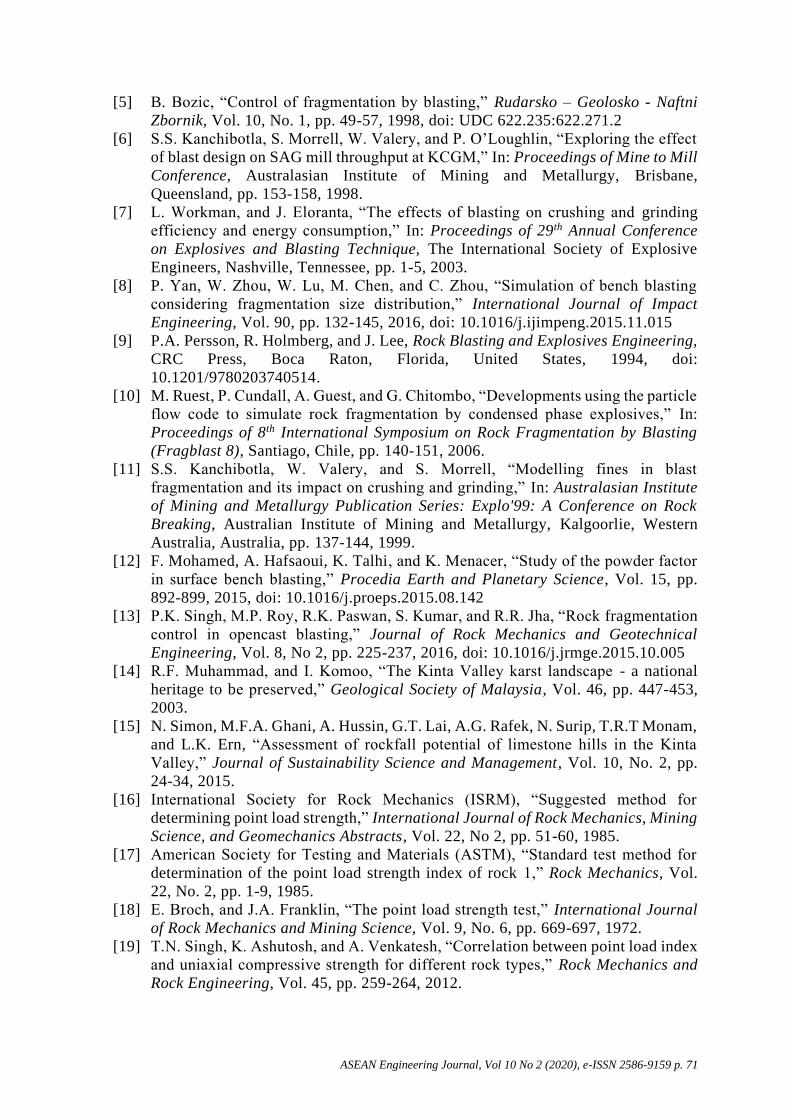
Figure 14. Regression analysis of powder factor and UCS
The ratio of bench height to burden is called the stiffness ratio. Figure 12 shows
that the stiffness ratio significantly affects the mean fragment size with a correlation
coefficient of 0.89. The higher the value of the stiffness ratio, the coarser the mean
fragment size becomes. Unnecessary and excessive large value of this ratio will lead to
poor fragmentation.
Figure 13 shows a correlation coefficient of 0.76 between the powder factor and
the mean fragment size. This implies that mean fragment size strongly depends on the
quantity of explosive used in a blast. The higher the value of the powder factor, the smaller
and finer the mean fragment size becomes. Nevertheless, the quantity of explosive to be
used in a blast design is significantly dictated by the size of the hole diameter, the strength
characteristics of rock and water condition. The results agreed with the work of [6], [12]
and [22].

ASEAN Engineering Journal, Vol 10 No 2 (2020), e-ISSN 2586-9159 p. 70
In Figure 14, the required powder factor was correlated with uniaxial compressive
strength (UCS). The regression analysis shows a correlation coefficient of 0.99. Thus, the
amount of explosive required to blast a rock is largely a function of its strength
characteristics. The powder factor increases with uniaxial compressive strength. Therefore,
rock strength is a crucial factor that must be evaluated in any rock blasting design.
Conclusions
The influence of blast design factors on the mean fragment size has been studied. The
stiffness ratio, the powder factor and the strength of rocks are principal factors
controlling the size of fragment obtained in a blast design. The mean fragment size
increases with stiffness ratio but decreases with higher amount of powder factor. The
amount of powder factor required to obtain a given mean fragment size increases with
the uniaxial compressive strength. The higher the powder factor, the finer the mean
fragment size becomes. However, the ratio of spacing to burden does not significantly
affect the mean fragment size obtained.
A powder factor of 0.34 to 0.43 kg/m3, burden of 3.5 m and spacing of 4.0 or 4.5m
as used at Lafarge Kanthan Quarry in this study produced a cumulative percentage passing
of 92.8 to 100% for all the six blast events. The 7.2% boulder recorded only occurred in one
blast event. The mean fragment size obtained in all the events ranges from 50.39 to 145.89
mm while the opening of the primary crusher is set at 1500 mm. Thus, all the blast events
assessed produced good fragmentation.
Only six blast events were studied and analyzed in this research for a preliminary
assessment. Further detail research involving a large number of blast events is required to
contribute to the position of this research for the studied quarry based on their current
practices and geological conditions. Uniaxial compressive strength is not the only rock factor
influencing fragmentation. Further research should also include other rock mass properties,
spacing and orientation of discontinuities, and the influence of explosives characteristics on
fragmentation.
Acknowledgment
The authors wish to acknowledge the Universiti Sains Malaysia for the financial support
through the grant number 1001/PBAHAN/8014043.
References
[1] B.S. Choudhary, “Firing patterns and its effect on muckpile shape parameters and
fragmentation in quarry blasts,” International Journal of Research in Engineering
and Technology, Vol. 02, No. 9, pp. 32-45, 2013.
[2] B. Elevli, I. Topal, and S. Elevli, “Multivariate statistics application in
development of blast fragmentation charts for different rock formations in
quarries,” Acta Montanistica Slovaca, Vol. 17, No. 4, pp. 300-309, 2012.
[3] S. Prasad, B.S. Choudhary, and A.K. Mishra, “Effect of stemming to burden ratio
and powder factor on blast induced rock fragmentation– a case study,” IOP
Conference Series: Materials Science and Engineering, Vol. 225, 2017, doi:
10.1088/1757-899X/225/1/012191
[4] P.H.S.W. Kulatilake, Q. Wu, T. Hudaverdi, and C. Kuzu, “Mean particle size
prediction in rock blast fragmentation using neural networks,” Engineering
Geology, Vol. 114, No. 3-4, pp. 298-311, 2010, doi: 10.1016/j.enggeo.2010.05.008
ASEAN Engineering Journal, Vol 10 No 2 (2020), e-ISSN 2586-9159 p. 71
[5] B. Bozic, “Control of fragmentation by blasting,” Rudarsko – Geolosko - Naftni
Zbornik, Vol. 10, No. 1, pp. 49-57, 1998, doi: UDC 622.235:622.271.2
[6] S.S. Kanchibotla, S. Morrell, W. Valery, and P. O’Loughlin, “Exploring the effect
of blast design on SAG mill throughput at KCGM,” In: Proceedings of Mine to Mill
Conference, Australasian Institute of Mining and Metallurgy, Brisbane,
Queensland, pp. 153-158, 1998.
[7] L. Workman, and J. Eloranta, “The effects of blasting on crushing and grinding
efficiency and energy consumption,” In: Proceedings of 29th Annual Conference
on Explosives and Blasting Technique, The International Society of Explosive
Engineers, Nashville, Tennessee, pp. 1-5, 2003.
[8] P. Yan, W. Zhou, W. Lu, M. Chen, and C. Zhou, “Simulation of bench blasting
considering fragmentation size distribution,” International Journal of Impact
Engineering, Vol. 90, pp. 132-145, 2016, doi: 10.1016/j.ijimpeng.2015.11.015
[9] P.A. Persson, R. Holmberg, and J. Lee, Rock Blasting and Explosives Engineering,
CRC Press, Boca Raton, Florida, United States, 1994, doi:
10.1201/9780203740514.
[10] M. Ruest, P. Cundall, A. Guest, and G. Chitombo, “Developments using the particle
flow code to simulate rock fragmentation by condensed phase explosives,” In:
Proceedings of 8th International Symposium on Rock Fragmentation by Blasting
(Fragblast 8), Santiago, Chile, pp. 140-151, 2006.
[11] S.S. Kanchibotla, W. Valery, and S. Morrell, “Modelling fines in blast
fragmentation and its impact on crushing and grinding,” In: Australasian Institute
of Mining and Metallurgy Publication Series: Explo'99: A Conference on Rock
Breaking, Australian Institute of Mining and Metallurgy, Kalgoorlie, Western
Australia, Australia, pp. 137-144, 1999.
[12] F. Mohamed, A. Hafsaoui, K. Talhi, and K. Menacer, “Study of the powder factor
in surface bench blasting,” Procedia Earth and Planetary Science, Vol. 15, pp.
892-899, 2015, doi: 10.1016/j.proeps.2015.08.142
[13] P.K. Singh, M.P. Roy, R.K. Paswan, S. Kumar, and R.R. Jha, “Rock fragmentation
control in opencast blasting,” Journal of Rock Mechanics and Geotechnical
Engineering, Vol. 8, No 2, pp. 225-237, 2016, doi: 10.1016/j.jrmge.2015.10.005
[14] R.F. Muhammad, and I. Komoo, “The Kinta Valley karst landscape - a national
heritage to be preserved,” Geological Society of Malaysia, Vol. 46, pp. 447-453,
2003.
[15] N. Simon, M.F.A. Ghani, A. Hussin, G.T. Lai, A.G. Rafek, N. Surip, T.R.T Monam,
and L.K. Ern, “Assessment of rockfall potential of limestone hills in the Kinta
Valley,” Journal of Sustainability Science and Management, Vol. 10, No. 2, pp.
24-34, 2015.
[16] International Society for Rock Mechanics (ISRM), “Suggested method for
determining point load strength,” International Journal of Rock Mechanics, Mining
Science, and Geomechanics Abstracts, Vol. 22, No 2, pp. 51-60, 1985.
[17] American Society for Testing and Materials (ASTM), “Standard test method for
determination of the point load strength index of rock 1,” Rock Mechanics, Vol.
22, No. 2, pp. 1-9, 1985.
[18] E. Broch, and J.A. Franklin, “The point load strength test,” International Journal
of Rock Mechanics and Mining Science, Vol. 9, No. 6, pp. 669-697, 1972.
[19] T.N. Singh, K. Ashutosh, and A. Venkatesh, “Correlation between point load index
and uniaxial compressive strength for different rock types,” Rock Mechanics and
Rock Engineering, Vol. 45, pp. 259-264, 2012.

ASEAN Engineering Journal, Vol 10 No 2 (2020), e-ISSN 2586-9159 p. 72
[20] C.V.B. Cunningham, “The Kuz-Ram model for prediction of fragmentation from
blasting,” In: R. Holmberg, and A. Rustan, eds., First International Symposium on
Rock Fragmentation, Division of Mining and Rock Excavation, Lulea University
of Technology, Lulea, Sweden, pp. 439-454, 1983.
[21] C.V.B. Cunningham, “Fragmentation estimations and the Kuz–Ram model - four
years on,” In: W.L. Fourney, and R.D. Dick, ed(s)., 2nd International Symposium
on Rock Fragmentation by Blasting, Society of Experimental Mechanics,
Keystone, Colorado, pp. 475-487, 1987.
[22] P.K. Singh, M.P. Roy, R.K. Pasawan, Md. Sarim, and S. Kumar, “Blast design and
fragmentation control - Key to productivity,” Journal of Mines, Metals and Fuels,
Vol. 63, No. 7, pp. 182-189, 2015.