preliminary delineation of wetlands and … › rwqcb2 › water_issues › hot...2012/02/23 ·...
TRANSCRIPT

PRELIMINARY DELINEATION OF WETLANDS AND OTHER
WATERS OF THE UNITED STATES
SAN FRANCISQUITO CREEK FLOOD PROTECTION PROJECT, EAST BAYSHORE ROAD TO SAN FRANCISCO BAY
P R E P A R E D F O R :
SanFrancisquitoCreekJointPowersAuthority
1231HooverStreet
MenloPark,CA94025
Contact:KevinMurray
650.561.4580
P R E P A R E D B Y :
ICFInternational
75EastSantaClaraStreet,Suite300
SanJose,CA95113
Contact:MatthewJones
408.216.2815
June2012

ICFInternational.2012.PreliminaryDelineationofWetlandsandOtherWatersoftheUnitedStates,SanFrancisquitoCreekFloodProtectionProject,EastBayshoreRoadtoSanFranciscoBay.June.(ICF00882.09.)SanJose,CA.PreparedforSanFrancisquitoCreekJointPowersAuthority,MenloPark,CA.

San Francisquito Creek Flood Protection Project Preliminary Delineation of Wetlands and Other Waters of the United States
i June 2012
ICF 00882.09
Contents
List of Tables and Figures ....................................................................................................................... ii
List of Acronyms and Abbreviations ...................................................................................................... iii
Page
1 Summary .......................................................................................................................................... 1
2 Introduction ..................................................................................................................................... 2
2.1 Site Location and Driving Directions ................................................................................... 2
2.2 Site Description ................................................................................................................... 3
3 Delineation Methods ....................................................................................................................... 6
4 Results .............................................................................................................................................. 7
4.1 Wetlands ............................................................................................................................. 7
4.2 Other Waters ...................................................................................................................... 8
5 Jurisdictional Determination Information ....................................................................................... 9
6 References Cited ............................................................................................................................ 10
Appendix A. Hydric Soil Information and Soils Map
Appendix B. WETS Tables
Appendix C. Plant Species Observed in the Delineation Study Area
Appendix D. Routine Wetland Determination Data Forms
Appendix E. Representative Photographs
Exhibit A. Delineation Maps
San Francisquito Creek Joint Powers Authority
San Francisquito Creek Flood Protection Project Preliminary Delineation of Wetlands and Other Waters of the United States
ii June 2012
ICF 00882.09
Tables and Figures
Table Page
1 Acreage Summary of Wetlands and Other Waters ............................................................ 1
2 Summary of Characteristics of the Soils in the Delineation Study Area ............................. 5
3 Acreage Summary of Wetlands and Other Waters ............................................................ 7
Figure Follows Page
1 Delineation Study Area ....................................................................................................... 2
San Francisquito Creek Joint Powers Authority
San Francisquito Creek Flood Protection Project Preliminary Delineation of Wetlands and Other Waters of the United States
iii June 2012
ICF 00882.09
Acronyms and Abbreviations
Arid West Supplement Corps of Engineers Wetland Delineation Manual: Arid West Region Creek San Francisquito Creek CWA Clean Water Act DM Diked Marsh FP Freshwater Pond FWM Freshwater Marsh GPS global positioning system HTL high tide line HTL high tide line MHW mean high water MSL mean sea level NAVD North American Vertical Datum other waters other waters of the United States Project San Francisquito Creek Flood Protection Project, East Bayshore Road to
San Francisco Bay RPW relatively permanent water TC Tidal Channel and Bay Waters TNW Traditional Navigable Water TP Tidal Pan TSM Tidal Salt Marsh US 101 U.S. Highway 101 USACE U.S. Army Corps of Engineers USDA U.S. Department of Agriculture USGS U.S. Geological Survey WETS Wetland Evaluation Technique Summary
San Francisquito Creek Flood Protection Project Preliminary Delineation of Wetlands and Other Waters of the United States
1 June 2012
ICF 00882.09
San Francisquito Creek Flood Protection Project Preliminary Delineation of Wetlands and
Other Waters of the United States
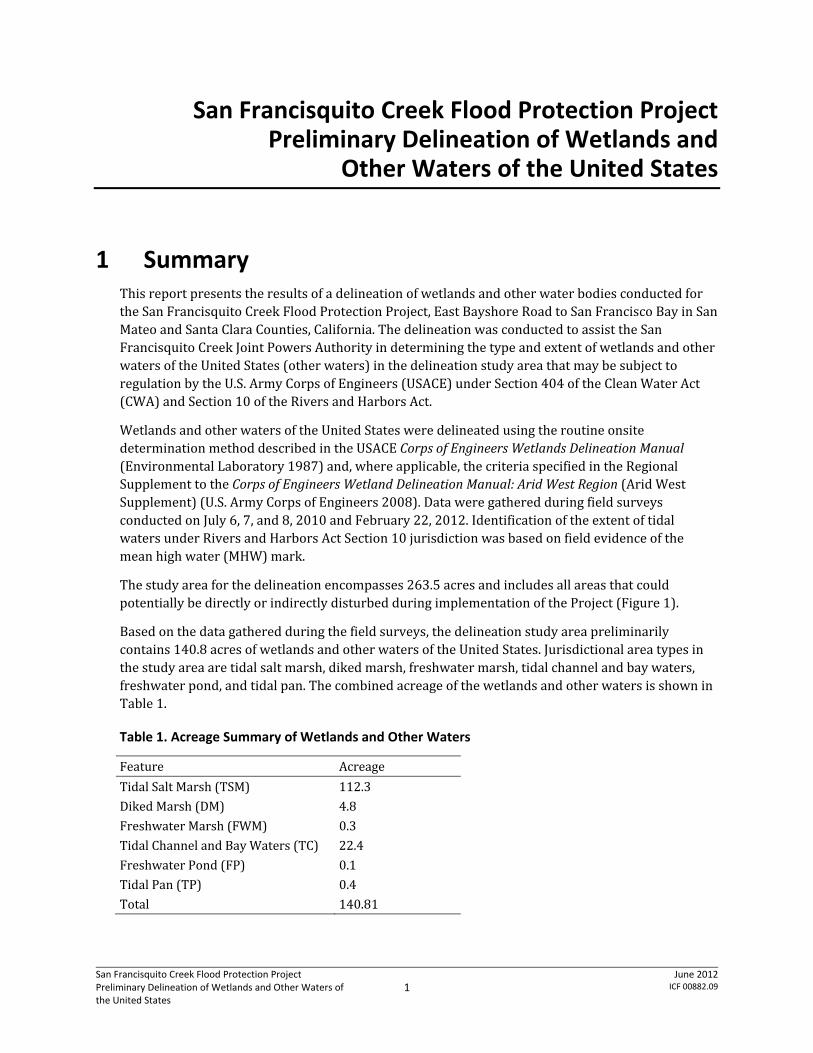
1 Summary ThisreportpresentstheresultsofadelineationofwetlandsandotherwaterbodiesconductedfortheSanFrancisquitoCreekFloodProtectionProject,EastBayshoreRoadtoSanFranciscoBayinSanMateoandSantaClaraCounties,California.ThedelineationwasconductedtoassisttheSanFrancisquitoCreekJointPowersAuthorityindeterminingthetypeandextentofwetlandsandotherwatersoftheUnitedStates(otherwaters)inthedelineationstudyareathatmaybesubjecttoregulationbytheU.S.ArmyCorpsofEngineers(USACE)underSection404oftheCleanWaterAct(CWA)andSection10oftheRiversandHarborsAct.
WetlandsandotherwatersoftheUnitedStatesweredelineatedusingtheroutineonsitedeterminationmethoddescribedintheUSACECorpsofEngineersWetlandsDelineationManual(EnvironmentalLaboratory1987)and,whereapplicable,thecriteriaspecifiedintheRegionalSupplementtotheCorpsofEngineersWetlandDelineationManual:AridWestRegion(AridWestSupplement)(U.S.ArmyCorpsofEngineers2008).DataweregatheredduringfieldsurveysconductedonJuly6,7,and8,2010andFebruary22,2012.IdentificationoftheextentoftidalwatersunderRiversandHarborsActSection10jurisdictionwasbasedonfieldevidenceofthemeanhighwater(MHW)mark.
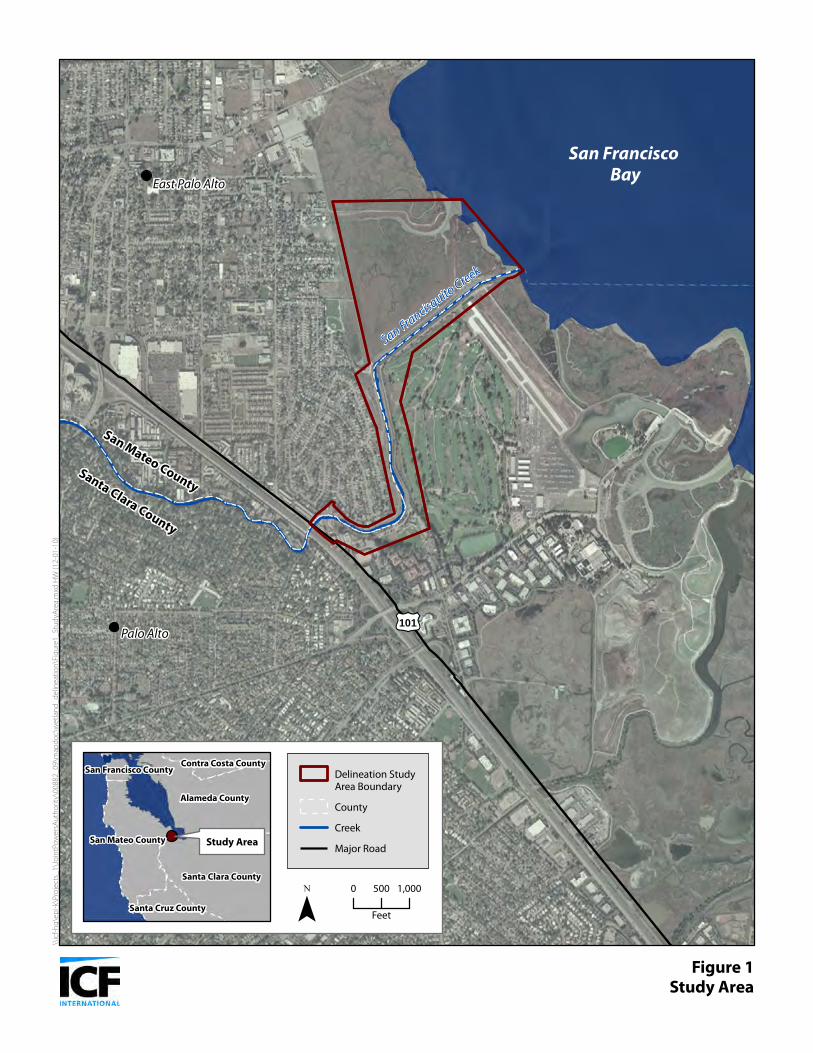
Thestudyareaforthedelineationencompasses263.5acresandincludesallareasthatcouldpotentiallybedirectlyorindirectlydisturbedduringimplementationoftheProject(Figure1).
Basedonthedatagatheredduringthefieldsurveys,thedelineationstudyareapreliminarilycontains140.8acresofwetlandsandotherwatersoftheUnitedStates.Jurisdictionalareatypesinthestudyareaaretidalsaltmarsh,dikedmarsh,freshwatermarsh,tidalchannelandbaywaters,freshwaterpond,andtidalpan.ThecombinedacreageofthewetlandsandotherwatersisshowninTable1.
Table 1. Acreage Summary of Wetlands and Other Waters
Feature Acreage
TidalSaltMarsh(TSM) 112.3
DikedMarsh(DM) 4.8
FreshwaterMarsh(FWM) 0.3
TidalChannelandBayWaters(TC) 22.4
FreshwaterPond(FP) 0.1
TidalPan(TP) 0.4
Total 140.81
San Francisquito Creek Joint Powers Authority
San Francisquito Creek Flood Protection Project Preliminary Delineation of Wetlands and Other Waters of the United States
2 June 2012
ICF 00882.09
AdescriptionofthewetlandsandotherwatersmappedinthedelineationstudyareaisprovidedintheResultssectionofthisreport,andtheirlocationsareshownonExhibitA.AlljurisdictionalareaboundariespresentedinthisreportarepreliminaryandsubjecttoverificationbytheUSACESanFranciscoDistrict.
2 Introduction ThisreportpresentstheresultsoftheICFInternational’sdelineationofwetlandsandotherwaterbodiesfortheproposedSanFrancisquitoCreekFloodProtectionProject,EastBayshoreRoadtoSanFranciscoBay(Project)inSanMateoandSantaClaracounties,California(Figure1).TheProjectisproposedtoprovideimprovedfloodprotectionforhomes,businesses,andotherfacilitiesalongSanFrancisquitoCreek(Creek)inthecitiesofPaloAltoandEastPaloAltodownstreamofU.S.Highway101(US101).TheProjectisexpectedtoconsistofacombinationofleveeimprovements,floodwalls,possibledevelopmentofexpandedfloodplainstorageontheadjacentPaloAltoMunicipalGolfCourse,andpossiblerestorationofthehydraulicconnectivitybetweentheCreekandtheadjacentFaberTractBaylands(FaberTract),restoringtheirhistoricroleastidallyinfluencedfloodplain,asdiscussedintheCityofPaloAlto’sBaylandsMasterPlan(2008).
TheProjectapplicantisSanFrancisquitoCreekJointPowersAuthority.ThecontactfortheProjectapplicantis
KevinMurrayProjectManagerSanFrancisquitoCreekJointPowersAuthority1231HooverStreet
MenloPark,CA94025650‐561‐4580
2.1 Site Location and Driving Directions
ThedelineationstudyareaislocatedinsoutheasternSanMateoCountyandnortheasternSantaClaraCounty,ontheborderbetweenEastPaloAltoandPaloAlto.Figure1showsthelocationofthedelineationstudyareaanditsrelationshiptothesurroundingtownsandhighways.
ThedelineationstudyareaisshownonthePaloAltoandMountainViewU.S.GeologicalSurvey(USGS)7.5‐minutequadrangles.Theapproximatecentroidofthedelineationstudyareaislocatedat37.46132°northlatitudeand122.12379°westlongitude.
Toreachthedelineationstudyarea,takeUS101southfromSanFrancisco.TaketheUniversityAvenueexitinPaloAltoandturnrightontoUniversityAvenue.Proceedapproximately0.2mileandturnrightonDonohoeStreet.Proceedapproximately0.25mileandturnrightontoClarkeAvenue.Proceedapproximately0.1mileandturnleftontoO’ConnorStreet.Proceedapproximately0.3miletoparkattheendofO’ConnorStreet.Walkashortdistancealongthefootpathtoreachthedelineationstudyarea.
£¤101
San Francisquito Creek
San Mateo CountySanta Clara County
San Francisco Bay
East Palo Alto
Palo Alto
\\ic
f-h
q\e
pi-
k\Pr
oje
cts_
1\Jo
intP
ow
ersA
uth
ori
ty\0
0882
_09
\map
do
c\w
etla
nd
_del
inea
tio
n\F
igu
re1_
Stu
dyA
rea.
mxd
HW
(12-
01-1
0)
Study Area
Alameda County
Santa Clara County
San Mateo County
Santa Cruz County
Contra Costa CountySan Francisco County Delineation Study
Area Boundary
County
Creek
Major Road
¯0 500 1,000
Feet
Figure 1Study Area
San Francisquito Creek Joint Powers Authority
San Francisquito Creek Flood Protection Project Preliminary Delineation of Wetlands and Other Waters of the United States
3 June 2012
ICF 00882.09
2.2 Site Description
2.2.1 General
The263.5‐acredelineationstudyareaissituatedinalluvialplain,alluvialfan,andtidalmarsharea.PaloAltoMunicipalGolfCourseandthePaloAltoAirportareadjacenttotheeasternandsouthernboundariesofthestudyarea.SanFranciscoBayistotheeast,andresidentialareasandtidalmarshesaretothenorth.ThewesternedgeisformedbyEastBayshoreRoad.
Awetlanddelineationoftheentiregolfcoursewaspreparedin1994(H.T.HarveyandAssociates1994);thedelineationmapwasverifiedbytheUSACESanFranciscoDistrictonApril28,1995(filenumber21160S49).Thedelineationreportindicatesthat2.51acresofSection404jurisdictionalwetlandsand17.3acres“historicwaters”existinthegolfcoursestudyarea.ThehistoricwaterswerefeaturesthatwereidentifiedbyH.T.Harvey&Associatesusinghistoricmaps(preparedbeforethegolfcoursewasconstructed)andconsistedofsloughs,channels,andponds.(Thesefeatures,whichnolongerexistonthesite,wereassumedtomeetthedefinitionRiversandHarborsActSection10jurisdiction.TheyappeartobeshownontheH.T.Harvey&Associatesdelineationmapbutarenotlabeledassuch.)BecauseH.T.Harvey’sdelineationmapwasverifiedmorethanfiveyearsago,itisnolongervalidandneedstobeupdatedusingtheAridWestSupplement.
ArtificialleveesexistalongbothsidesofSanFrancisquitoCreekandalongthewesternedgeandinterioroftheFaberTract(discussedbelow).Afootbridge(FriendshipBridge)crossestheCreekchanneljustsouthoftheFaberTract.
Elevationsinthedelineationstudyareaareroughly15feetabovemeansealevel(MSL)(referencedtotheNorthAmericanVerticalDatum[NAVD])nearEastBayshoreRoadtoapproximatelysealevelintheeasternpart.Withtheexceptionoflevees,slopesarenearlylevelinmostareasandundulatinginthegolfcourse.Leveeslopesareapproximately1:1to2:1(horizontal:vertical).ThebanksofSanFrancisquitoCreekareroughlyfourfeethighandinplacesarevertical.Naturalleveesexistonthe“benches”alongtheCreekinplaces,causingthegroundtoslopeawayfromthechannelintheseareas.
Inthenorthernpartoftheareaaretheapproximately87‐acreFaberTractandthesouthernportionoftheLaumeisterTract,thelatterofwhichconsistsofanaturalmarsh.TheFaberTractappearstohavebeendikedinthe1930sandusedforpastureandforhayproduction(H.T.Harvey&Associates2009).Thedikeprobablyerodedsometimebetween1961and1963,allowingsometidalexchangeintothearea.DredgespoilsfromthePaloAltoHarborsubsequentlyweredepositedonthetractbetween1968and1969.SanMateoCountyinitiallyestablishedahydrologicconnectionbetweentheFaberTractandtheadjacenttidalmarshtothenorth(intheLaumeisterTract)viathreeculvertsinstalledthroughtheleveeseparatingthetwoareas.In1971,thecountybreachedtheoutboardleveeinthenortheasterncorneroftheFaberTract,openingthetracttotidalactiontoSanFranciscoBay.
San Francisquito Creek Joint Powers Authority
San Francisquito Creek Flood Protection Project Preliminary Delineation of Wetlands and Other Waters of the United States
4 June 2012
ICF 00882.09
2.2.2 Hydrology
ThedelineationstudyareaislocatedintheSanFranciscoBayhydrologicunit(HUC18050004)(U.S.GeologicalSurvey2007).
SanFrancisquitoCreek,shownasaperennialstreamontheUSGStopographicquadranglemap,flowsoveralleasterlythroughtheentiredelineationstudyarea(ExhibitA).TheCreekemptiesintoSouthSanFranciscoBayattheeasternedgeofthedelineationstudyarea.BasedonareviewofhistoricaerialphotographsandU.S.CoastSurveymaps(Hermstadetal.2009),muchoftheplanformoftheCreekandextentofitsassociatedtidalmarsheshavesignificantlychangedsincethemid‐1800s.An1899USGStopographicmapshowstheCreekchannelextendingthroughwhatisnowthePaloAltoMunicipalGolfCourse.ASeptember1948aerialphotographavailableonGoogleEarthshowstheareaofwhatisnowthegolfcourseasoccupiedbyanairfieldwithtwodirtorgrassrunways.
SanFrancisquitoCreekistidallyinfluencedthroughoutthedelineationstudyarea.AtSanFrancisquitoCreek’sconfluencewithSanFranciscoBay,theMHWelevationis6.544feetNAVD1988(convertedfromNGVD1929)(H.T.Harvey&Associates1994).Thehightideline(HTL)atthePortofRedwoodCity(i.e.,thenearestknownrecordforHTL)is7.034feetNAVD1988(convertedfromNGVD1929)(WetlandsResearchAssociates2007).Becausethetidallyinfluencedareasofthestudyareaareboundedbylevees,inplanviewthedatumseffectivelycoincidenearthelandsidetoeoftheleveeswhenviewedatthescalethatwasusedforthedelineationmap(seeExhibitA).Becauseofmapdatalimitations,theMHWandHTLelevationsarebothrepresentedbythenearestwhole‐footcontour(i.e.,7.0feetNAVD1988)ontheexhibit.
WetlandsthatarenothydrologicallyconnectedtoSanFrancisquitoCreek(i.e.,thoseisolatedbyleveesordikes)arenotinfluencedbytidalaction(FP1,FP2,andDM1toDM13).TheCityofEastPaloAltomaintainstwostormwateroutfallfacilitiestoSanFrancisquitoCreekneartheeastendofO’ConnorStreetandSanFrancisquitoCreek,andimmediatelynorthofEastBayshoreRoadattheupstreamendofasidechanneltoSanFrancisquitoCreek.TheEastBayshoreRoadoutfalldrainstoanapparentartificialchannel,whichextendsashortdistancetoSanFrancisquitoCreek.
2.2.3 Soils
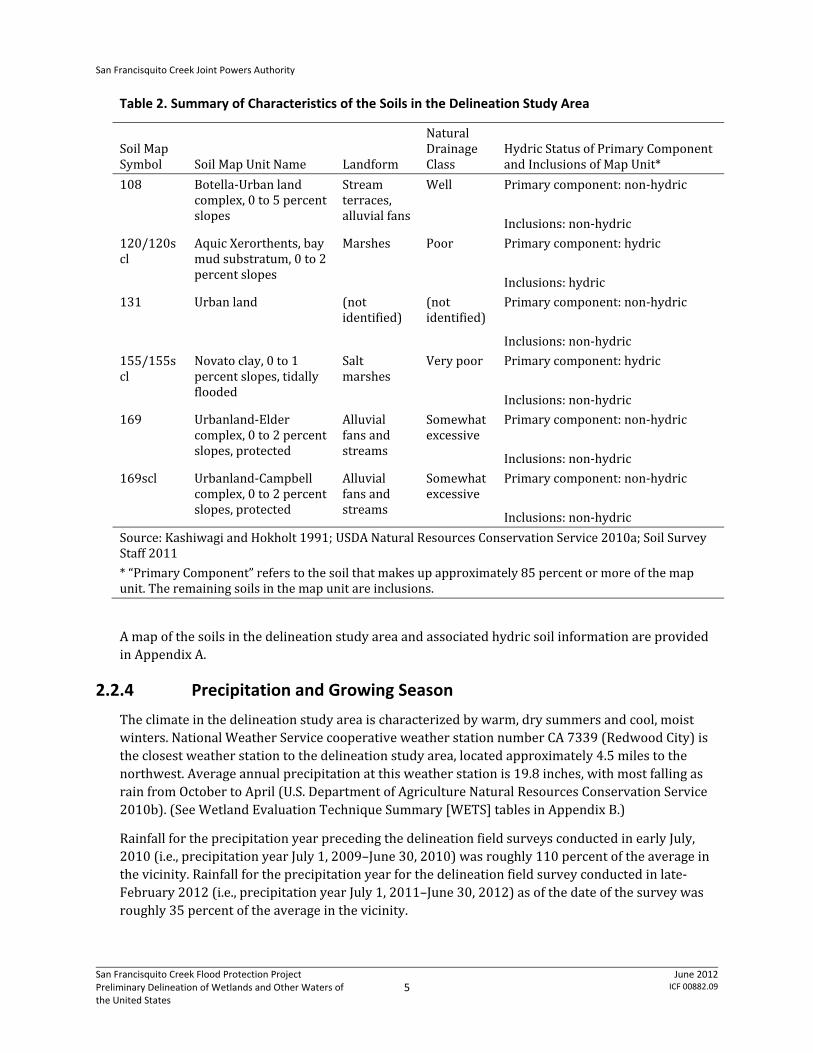
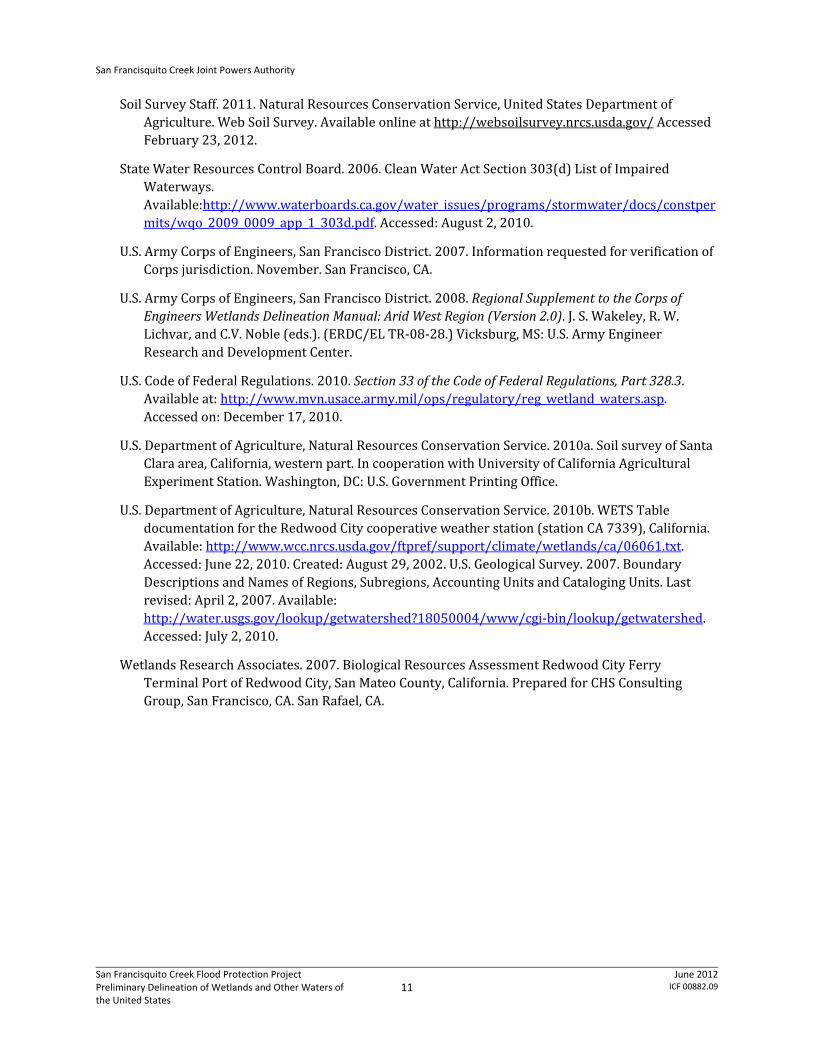
TheU.S.DepartmentofAgriculture(USDA)SoilConservationService(KashiwagiandHokholt1991)(SanMateoCounty)andtheUSDANaturalResourcesConservationService(2010a)(SantaClaraCounty)havemappedthesoilswithinthedelineationstudyarea.SalientcharacteristicsofthesoilmapunitsaresummarizedinTable2.Amongthese,theonlysoilmapunitthatconsistsentirelyofnativesoilmaterialisNovatoclay.(ThesoilsurveyapparentlydidnotrecognizethefactthatdredgedmaterialwasplacedintheFaberTract,whichthesoilsurveyindicatesisNovatoclay.)Alloftheothermapunitsconsistpartlyorwhollyofvariousthicknessesoffillmaterialthathasbeenplacedontopofthenativesoil.
San Francisquito Creek Joint Powers Authority
San Francisquito Creek Flood Protection Project Preliminary Delineation of Wetlands and Other Waters of the United States
5 June 2012
ICF 00882.09
Table 2. Summary of Characteristics of the Soils in the Delineation Study Area
SoilMapSymbol SoilMapUnitName Landform
NaturalDrainageClass
HydricStatusofPrimaryComponentandInclusionsofMapUnit*
108 Botella‐Urbanlandcomplex,0to5percentslopes
Streamterraces,alluvialfans
Well Primarycomponent:non‐hydric
Inclusions:non‐hydric
120/120scl
AquicXerorthents,baymudsubstratum,0to2percentslopes
Marshes Poor Primarycomponent:hydric
Inclusions:hydric
131 Urbanland (notidentified)
(notidentified)
Primarycomponent:non‐hydric
Inclusions:non‐hydric
155/155scl
Novatoclay,0to1percentslopes,tidallyflooded
Saltmarshes
Verypoor Primarycomponent:hydric
Inclusions:non‐hydric
169 Urbanland‐Eldercomplex,0to2percentslopes,protected
Alluvialfansandstreams
Somewhatexcessive
Primarycomponent:non‐hydric
Inclusions:non‐hydric
169scl Urbanland‐Campbellcomplex,0to2percentslopes,protected
Alluvialfansandstreams
Somewhatexcessive
Primarycomponent:non‐hydric
Inclusions:non‐hydric
Source:KashiwagiandHokholt1991;USDANaturalResourcesConservationService2010a;SoilSurveyStaff2011
*“PrimaryComponent”referstothesoilthatmakesupapproximately85percentormoreofthemapunit.Theremainingsoilsinthemapunitareinclusions.
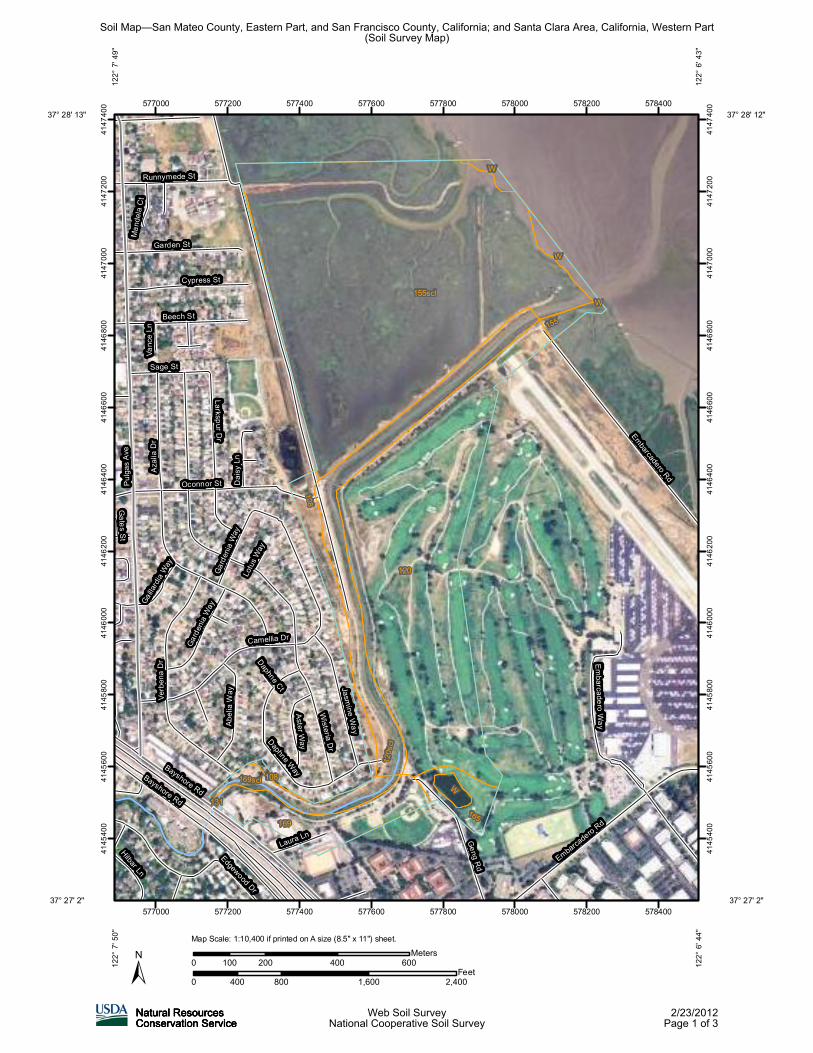
AmapofthesoilsinthedelineationstudyareaandassociatedhydricsoilinformationareprovidedinAppendixA.
2.2.4 Precipitation and Growing Season
Theclimateinthedelineationstudyareaischaracterizedbywarm,drysummersandcool,moistwinters.NationalWeatherServicecooperativeweatherstationnumberCA7339(RedwoodCity)istheclosestweatherstationtothedelineationstudyarea,locatedapproximately4.5milestothenorthwest.Averageannualprecipitationatthisweatherstationis19.8inches,withmostfallingasrainfromOctobertoApril(U.S.DepartmentofAgricultureNaturalResourcesConservationService2010b).(SeeWetlandEvaluationTechniqueSummary[WETS]tablesinAppendixB.)
RainfallfortheprecipitationyearprecedingthedelineationfieldsurveysconductedinearlyJuly,2010(i.e.,precipitationyearJuly1,2009–June30,2010)wasroughly110percentoftheaverageinthevicinity.Rainfallfortheprecipitationyearforthedelineationfieldsurveyconductedinlate‐February2012(i.e.,precipitationyearJuly1,2011–June30,2012)asofthedateofthesurveywasroughly35percentoftheaverageinthevicinity.
San Francisquito Creek Joint Powers Authority
San Francisquito Creek Flood Protection Project Preliminary Delineation of Wetlands and Other Waters of the United States
6 June 2012
ICF 00882.09
ThelengthofthegrowingseasonattheRedwoodCityweatherstationin5yearsoutof10at28degreesairtemperatureaverages365days(U.S.DepartmentofAgricultureNaturalResourcesConservationService2010b).
2.2.5 Vegetation
ThedelineationstudyareaiswithintheSanFranciscoBayAreasubregionoftheCentralWesternCaliforniaregionintheCaliforniaFloristicProvince(Hickman1993).
InadditiontotheaquatichabitatsdescribedintheResultssectionbelow,thedelineationstudyareaalsosupportsannualgrasslands,ruderalareas,turf,andurbanizedareas.ScientificnamesoftheplantspeciesthatwereobservedwhileconductingthedelineationfieldsurveysandtheirwetlandindicatorstatusareprovidedinAppendixC.ThewetlandplantcommunitiesfoundinthedelineationstudyareaaredescribedintheResultssectionofthisreport.
3 Delineation Methods FieldworkforthedelineationwasconductedbyasoilandwetlandscientistandabotanistonJuly6,7,and8,2010andonFebruary22,2012,usingtheroutineonsitedeterminationmethoddescribedintheCorpsofEngineersWetlandsDelineationManual(EnvironmentalLaboratory1987)and,whereapplicable,criteriaspecifiedintheRegionalSupplementtotheCorpsofEngineersWetlandDelineationManual:AridWestRegion(AridWestSupplement)(U.S.ArmyCorpsofEngineers2008).
AsdetailedintheAridWestSupplement,dataonvegetation,soil,andhydrologycharacteristicsusedasthebasisforwetlandboundarydeterminationswerecollectedandrecordedonAridWestSupplementdataforms(AppendixD).Dataformswerecompletedat49sampleplots(datapoints).
ThewetlandindicatorstatusofeachplantspecieswasbasedontheNationalListofPlantSpeciesthatOccurinWetlands:California(Reed1988).CommonandscientificplantnamesweretakenfromTheJepsonManual:VascularPlantsofCalifornia,SecondEdition(Baldwinetal.2012).
TheinlandlimitofUSACEjurisdictionfortidallyinfluencedwaterswasmappedatthehightideline(HTL)intheabsenceofadjacentwetlands.USACEjurisdictionofnontidalwaterswasmappedattheMHWmark.TheMHWmarkrepresentsthelimitofpotentialUSACEjurisdictionovertidalwatersunderSection10oftheRiversandHarborsAct,whereastheHTLrepresentstheinlandlimitofUSACEjurisdictionintheabsenceofadjacentnontidalwetlandsunderSection404oftheCleanWaterAct.
Forpracticalpurposes,theHTLmarkwasidentifiedusingthelandwardextentofhydrophyticvegetation,accordingtoUSACEguidanceinSection33oftheU.S.CodeofFederalRegulations,Part328.3(2010).Thehydrophyticvegetationwaspredominantlycomposedofpickleweed(Salicorniapacifica).Pickleweedtypicallyoccurstothelandwardlimitofwetlandsinthetidallyinfluencedareasofthestudyareabecausesuchareasareborderedbyasteepleveeslope,therebyseverelylimitingtheoccurrenceof“high”marshspecies,suchasalkaliheath(Frankeniasalina)andsaltgrass(Distichlisspicata),whichwouldoccupythelandwardlimitsofwetlandsinareasunconstrainedbylevees.
ATrimbleGeoXTglobalpositioningsystem(GPS)receiver,typicallyaccuratetolessthan1meterhorizontally,wasusedtorecordthelocationofthedatapointsandcertainjurisdictionalarea
San Francisquito Creek Joint Powers Authority
San Francisquito Creek Flood Protection Project Preliminary Delineation of Wetlands and Other Waters of the United States
7 June 2012
ICF 00882.09
boundaries.However,wherephysicalaccesstotheboundarywaspoor,thefeaturesweremappeddirectlyontoarecent1inch=160footcoloraerialphotograph(takenin2008)basemap(ESRI2008).Thedivisionbetweenwetlandsandotherwaterswasalsomappedfromaerialphotographinterpretation.Featuresdepictedintheaerialphotographweredigitizedintoageographicinformationsystemdatalayer.ThismappingwasaddedtotheGPSdatalayertogeneratethedelineationmapatascaleof1inch=100feet.
TheresultingdelineationmapandthisreportwerepreparedinaccordancewithUSACESanFranciscoDistrictguidelines(U.S.ArmyCorpsofEngineers2007).
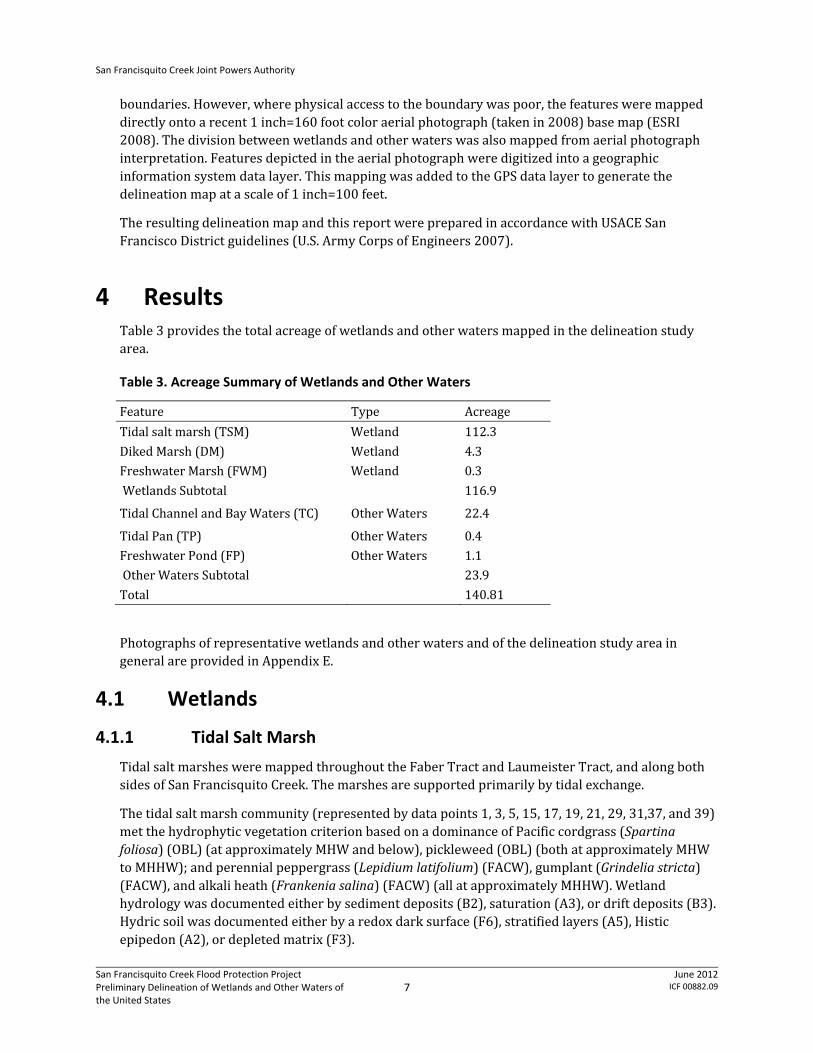
4 Results Table3providesthetotalacreageofwetlandsandotherwatersmappedinthedelineationstudyarea.
Table 3. Acreage Summary of Wetlands and Other Waters
Feature Type Acreage
Tidalsaltmarsh(TSM) Wetland 112.3
DikedMarsh(DM) Wetland 4.3
FreshwaterMarsh(FWM) Wetland 0.3
WetlandsSubtotal 116.9
TidalChannelandBayWaters(TC) OtherWaters 22.4
TidalPan(TP) OtherWaters 0.4
FreshwaterPond(FP) OtherWaters 1.1
OtherWatersSubtotal 23.9
Total 140.81
PhotographsofrepresentativewetlandsandotherwatersandofthedelineationstudyareaingeneralareprovidedinAppendixE.
4.1 Wetlands
4.1.1 Tidal Salt Marsh
TidalsaltmarshesweremappedthroughouttheFaberTractandLaumeisterTract,andalongbothsidesofSanFrancisquitoCreek.Themarshesaresupportedprimarilybytidalexchange.
Thetidalsaltmarshcommunity(representedbydatapoints1,3,5,15,17,19,21,29,31,37,and39)metthehydrophyticvegetationcriterionbasedonadominanceofPacificcordgrass(Spartinafoliosa)(OBL)(atapproximatelyMHWandbelow),pickleweed(OBL)(bothatapproximatelyMHWtoMHHW);andperennialpeppergrass(Lepidiumlatifolium)(FACW),gumplant(Grindeliastricta)(FACW),andalkaliheath(Frankeniasalina)(FACW)(allatapproximatelyMHHW).Wetlandhydrologywasdocumentedeitherbysedimentdeposits(B2),saturation(A3),ordriftdeposits(B3).Hydricsoilwasdocumentedeitherbyaredoxdarksurface(F6),stratifiedlayers(A5),Histicepipedon(A2),ordepletedmatrix(F3).
San Francisquito Creek Joint Powers Authority
San Francisquito Creek Flood Protection Project Preliminary Delineation of Wetlands and Other Waters of the United States
8 June 2012
ICF 00882.09
Includedwithinthemappedareasoftidalsaltmarsharetidalchannelsthatweretoonarrowtomapatthescaleused.Alsoincludedarenarrowbandsofbrackishtidalmarshalongafew‐hundred‐foot‐longsectionofSanFrancisquitoCreekdownstreamofEastBayshoreRoad.Inthebrackishmarsh,bulrush(Schoenoplectussp.)isthedominantspeciesratherthancordgrassandpickleweed.
4.1.2 Diked Marsh
DikedmarshesweremappedinareasonthelandwardsideoftheleveesalongSanFrancisquitoCreekandwithinthegolfcourse.Suchareasappeartohavetohavebeentidalsaltmarshbeforeleveeswereconstructedintheareaandappeartonothavereceivedsignificantamountsoffillmaterialaspartofleveeandgolfcourseconstruction.
Thedikedmarshcommunity(representedbydatapoints7,9,11,13,24,25,27,33,35,41,45,and48)metthehydrophyticvegetationcriterionbasedonadominanceofsaltgrass(FACW),pickleweed,alkaliheath,Mediterraneanbarley(Hordeummarinumssp.gussoneanum),andotherhydrophytes.(Percentvegetativecoverislowissomeareas,butoverallgreaterthanthe5percentcoverthresholdrequiredforwetlands[U.S.ArmyCorpsofEngineers2008]).Wetlandhydrologywasdocumentedeitherbyasaltcrust(B11),surfacesoilcracks(B6),oroxidizedrhizospheres(C3).Hydricsoilwasdocumentedeitherbyadepletedmatrix(F3)orredoxdarksurface(F6).
Themarshesgenerallyappeartobesupportedprimarilybyincidentprecipitation.However,thedikedmarshesthatoccurwithinoradjoiningthegolfcoursemayreceiveinputsfromtheturfsprinklersystems,bothindirectlyandasrunoff.
4.1.3 Freshwater Marsh
Thefreshwatermarshcommunitywasmappedatonlyonelocation,alongtheshoreofapondwithinthePaloAltoMunicipalGolfCourse.
Freshwatermarshisrepresentedbydatapoint44andisdominatedbycattail(Typhasp.)andhardstembulrush(Schoenoplectusacutus)(bothobligatewetlandspecies).Themarshmetthehydrophyticvegetationcriterionbasedondominancebycattail.Wetlandhydrologywasdocumentedbythepresenceofsurfacewater.Hydricsoilwasdocumentedbyredoxdarksurface(F6).
Thefreshwatermarshappearstobesupportedbywaterpipedintotheassociatedfreshwaterpond(discussedunderFreshwaterPond,Section4.3.2below),andtoalesserdegreegroundwater.
4.2 Other Waters
Aquaticareasmappedasotherwaterswerelessthanfivepercentvegetated,andthereforequalifyasotherwaters(U.S.ArmyCorpsofEngineers2008).
4.2.1 Tidal Channel and Bay Waters
TidalchannelsexistasSanFrancisquitoCreekandsloughsthatextendintotheFaberTractandLaumeisterTract.BaywatersexistasthedeepwaterareaofSouthSanFranciscoBay.Allthechannelsaresupportedbytidalaction.
San Francisquito Creek Joint Powers Authority
San Francisquito Creek Flood Protection Project Preliminary Delineation of Wetlands and Other Waters of the United States
9 June 2012
ICF 00882.09
4.2.2 Freshwater Pond
Thefreshwaterpondcommunitywasmappedatonlyonelocation,onthePaloAltoMunicipalGolfCourse.Thepondappearstobesupportedbywaterpipedintoitforthegolfcourseandtoalesserdegreebygroundwater.
The1948aerialphotographmentionedunderHydrology,Section2.3.2aboveshowsthatapondexistedinthegeneralfootprintofthepresent‐daypond.
4.2.3 Tidal Pan
ThreetidalpansweremappedwithintheFaberTract.ThepansappeartoexistatapproximatelyMHHWandappeartobeprimarilysupportedbyextremehightides.
5 Jurisdictional Determination Information InaccordancewithUSACESanFranciscoDistrict(2007)delineationreportguidelines,thissectionprovidesinformationintendedtoassisttheUSACEincompletingtheApprovedJurisdictionalDeterminationForm,inparticularSectionIII,PartsAandB.
5.2.1 Relatively Permanent Waters
BecauseSanFrancisquitoCreekappearstobeintermittentorperennialandbecauseitissubjecttotidalaction,itqualifiesasarelativelypermanentwater(RPW)(ExhibitA).
AllofthesloughsthatextendintotheFaberTractandLaumeisterTractalsoappeartobeRPWsbecausetheyaresubjecttotheebbandflowofthetide.
5.2.2 Traditional Navigable Waters
SouthFranciscoBay(alongthenortheasternedgeofthedelineationstudyarea)isaTraditionalNavigableWater(TNW)(ExhibitA),asdefinedunder33CFRSection329.4and33CFRSection328.3(a)(1).
5.2.3 Evaluation of Hydrologic and Water Quality Characteristics of Stream Order Segment
SanFrancisquitoCreekhasawatershedofapproximately45squaremiles.TheheadwatersoftheCreekarerelativelyundeveloped.Thelowerpartofitswatershedisheavilyurbanized.ThemainstemoftheCreekis14mileslong(CityofPaloAltoParksandRecreationCommission2010).
DuringthewetlanddelineationfieldsurveysinearlyJuly2010,asmallbaseflowintheCreekwasobservedatlowtide.Itisunknownwhetherthebaseflownormallycontinuesthroughtothebeginningofthefollowingrainyseason.
SanFrancisquitoCreekislistedasimpairedforsedimentation/siltationontheStateWaterResourcesControlBoard(2006)CleanWaterActSection303(d)ListofImpairedWaterways.
San Francisquito Creek Joint Powers Authority
San Francisquito Creek Flood Protection Project Preliminary Delineation of Wetlands and Other Waters of the United States
10 June 2012
ICF 00882.09
5.2.4 Evaluation of Hydrologic, Water Quality, and Functional Characteristics of Onsite Wetlands
Therearenoknowndataonthehydrologicorwaterqualitycharacteristicsofthewetlandsinthedelineationstudyarea.However,thetidalsaltmarshesthatadjointheSanFrancisquitoCreekchannelareexpectedtoreceivetypicalwildlandandurbanrunoffpollutants,includingsediment,nutrients,pesticides,andlitter.Thedikedmarshesthatexistwithinandadjacenttothegolfcourseandthefreshwatermarshareassumedtoreceiverunoffcontainingnutrientsandpesticidesfromthegolfcourse.
6 References Cited Baldwin,B.,D.Goldman,D.Keil,R.Patterson,T.Rosatti,andD.Wilken,editors.2012.TheJepson
Manual:VascularPlantsofCalifornia,SecondEdition.UniversityofCaliforniaPress,Berkeley,CA.
CityofPaloAltoParksandRecreationCommission.2010.SanFrancisquitoCreek,Bayto101CapitalProject.June22.
CityofPaloAlto.2008.BaylandsMasterPlan.4thedition.Availableat:http://www.cityofpaloalto.org/civica/filebank/blobdload.asp?BlobID=14882.Accessedon:December17,2010.
EnvironmentalLaboratory.1987.CorpsofEngineersWetlandsDelineationManual.(TechnicalReportY‐87‐1.)Vicksburg,MS:U.S.ArmyWaterwaysExperimentStation.
ESRI.2008.AerialPhotograph—I3ImageryPrimeWorld2D.Redlands,CA.
H.T.Harvey&Associates.1994.PaloAltoGolfCourseSantaClaraCounty,CaliforniaIdentificationofWatersoftheU.S.andBioticAssessment.(Project#805‐01).May.PreparedforAmphionEnvironmental,Inc.,Oakland,CA.Alviso,CA.
H.T.Harvey&Associates.2009.SanFranciscoCreekFloodProtectionAnalysisProject—BioticConstraintsandOpportunitiesAssessment(Project#3029‐01).May29,2009lettertoChristieBeeman,P.E.,PhilipWilliams&Associates,SanFrancisco,CA.LosGatos,CA.
Hermstad,D.,K.Cayce,andR.Grossinger.2009.HistoricalecologyoflowerSanFrancisquitoCreek,Phase1.TechnicalmemorandumandaccompanyingprojectGISdata.ContributionNo.579.HistoricalEcologyProgram,SanFranciscoEstuaryInstitute,Oakland,CA.
Hickman,J.C.1993.TheJepsonManualofHigherPlantsofCalifornia.BerkeleyandLosAngeles:UniversityofCaliforniaPress.
Kashiwagi,J.H.andHokholt,L.A.1991.SoilSurveyofSanMateoCounty,easternpart,andSanFranciscoCounty,California.U.S.DepartmentofAgriculture,SoilConservationServiceincooperationwithUniversityofCaliforniaAgriculturalExperimentStation.Washington,DC:U.S.GovernmentPrintingOffice.
Reed,P.B.1988.NationalListofPlantSpeciesthatOccurinWetlands:California(Region0).(BiologicalReport88[26.10].)May.Washington,DC:U.S.FishandWildlifeService,ResearchandDevelopment.PreparedforNationalWetlandsInventory.
San Francisquito Creek Joint Powers Authority
San Francisquito Creek Flood Protection Project Preliminary Delineation of Wetlands and Other Waters of the United States
11 June 2012
ICF 00882.09
SoilSurveyStaff.2011.NaturalResourcesConservationService,UnitedStatesDepartmentofAgriculture.WebSoilSurvey.Availableonlineathttp://websoilsurvey.nrcs.usda.gov/AccessedFebruary23,2012.
StateWaterResourcesControlBoard.2006.CleanWaterActSection303(d)ListofImpairedWaterways.Available:http://www.waterboards.ca.gov/water_issues/programs/stormwater/docs/constpermits/wqo_2009_0009_app_1_303d.pdf.Accessed:August2,2010.
U.S.ArmyCorpsofEngineers,SanFranciscoDistrict.2007.InformationrequestedforverificationofCorpsjurisdiction.November.SanFrancisco,CA.
U.S.ArmyCorpsofEngineers,SanFranciscoDistrict.2008.RegionalSupplementtotheCorpsofEngineersWetlandsDelineationManual:AridWestRegion(Version2.0).J.S.Wakeley,R.W.Lichvar,andC.V.Noble(eds.).(ERDC/ELTR‐08‐28.)Vicksburg,MS:U.S.ArmyEngineerResearchandDevelopmentCenter.
U.S.CodeofFederalRegulations.2010.Section33oftheCodeofFederalRegulations,Part328.3.Availableat:http://www.mvn.usace.army.mil/ops/regulatory/reg_wetland_waters.asp.Accessedon:December17,2010.
U.S.DepartmentofAgriculture,NaturalResourcesConservationService.2010a.SoilsurveyofSantaClaraarea,California,westernpart.IncooperationwithUniversityofCaliforniaAgriculturalExperimentStation.Washington,DC:U.S.GovernmentPrintingOffice.
U.S.DepartmentofAgriculture,NaturalResourcesConservationService.2010b.WETSTabledocumentationfortheRedwoodCitycooperativeweatherstation(stationCA7339),California.Available:http://www.wcc.nrcs.usda.gov/ftpref/support/climate/wetlands/ca/06061.txt.Accessed:June22,2010.Created:August29,2002.U.S.GeologicalSurvey.2007.BoundaryDescriptionsandNamesofRegions,Subregions,AccountingUnitsandCatalogingUnits.Lastrevised:April2,2007.Available:http://water.usgs.gov/lookup/getwatershed?18050004/www/cgi‐bin/lookup/getwatershed.Accessed:July2,2010.
WetlandsResearchAssociates.2007.BiologicalResourcesAssessmentRedwoodCityFerryTerminalPortofRedwoodCity,SanMateoCounty,California.PreparedforCHSConsultingGroup,SanFrancisco,CA.SanRafael,CA.

Appendix A Hydric Soil Information and Soils Map
Pul
gas
Ave
Wisteria D
r
Aza
lia D
r
Camellia Dr
Oconnor St
Verb
ena
Dr
Bayshore Rd
Embarcadero Rd
Geng R
d
Beech St
Larkspur Dr
Garden St
Edgewood Dr
Cypress St
Jasmine W
ay
Sage St
Daphne Way
Abe
lia W
ay
Aster W
ay
Runnymede St
Em
barcadero Way
Gar
deni
a W
ay
Laura Ln
Dai
sy L
n
Hilbar Ln
Gailla
rdia
Way
Man
dela
Ct
Vanc
e Ln
Lotu
s W
ay
Gates S
t
Daphne Ct
Embarcadero Rd
Bayshore Rd
Gar
deni
a W
ay
120
155scl
169
120s
cl
108
165
169sclW
155
W
W
108
W
131
577000
577000
577200
577200
577400
577400
577600
577600
577800
577800
578000
578000
578200
578200
578400
578400
4145
400
4145
400
4145
600
4145
600
4145
800
4145
800
4146
000
4146
000
4146
200
4146
200
4146
400
4146
400
4146
600
4146
600
4146
800
4146
800
4147
000
4147
000
4147
200
4147
200
4147
400
4147
400
0 800 1,600 2,400400Feet
0 200 400 600100Meters
±
37° 28' 12''
122°
6' 4
3''
37° 27' 2''
122°
6' 4
4''
37° 27' 2''
37° 28' 13''12
2° 7
' 50'
'12
2° 7
' 49'
'
Map Scale: 1:10,400 if printed on A size (8.5" x 11") sheet.
Soil Map—San Mateo County, Eastern Part, and San Francisco County, California; and Santa Clara Area, California, Western Part(Soil Survey Map)
Natural ResourcesNatural ResourcesNatural ResourcesNatural ResourcesConservation ServiceConservation ServiceConservation ServiceConservation Service
Web Soil SurveyNational Cooperative Soil Survey
2/23/2012Page 1 of 3
MAP LEGEND MAP INFORMATION
Area of Interest (AOI)Area of Interest (AOI)
SoilsSoil Map Units
Special Point FeaturesBlowout
Borrow Pit
Clay Spot
Closed Depression
Gravel Pit
Gravelly Spot
Landfill
Lava Flow
Marsh or swamp
Mine or Quarry
Miscellaneous Water
Perennial Water
Rock Outcrop
Saline Spot
Sandy Spot
Severely Eroded Spot
Sinkhole
Slide or Slip
Sodic Spot
Spoil Area
Stony Spot
Very Stony Spot
Wet Spot
Other
Special Line FeaturesGully
Short Steep Slope
Other
Political FeaturesCities
Water FeaturesStreams and Canals
TransportationRails
Interstate Highways
US Routes
Major Roads
Local Roads
Map Scale: 1:10,400 if printed on A size (8.5" × 11") sheet.
The soil surveys that comprise your AOI were mapped at 1:24,000.
Warning: Soil Map may not be valid at this scale.
Enlargement of maps beyond the scale of mapping can causemisunderstanding of the detail of mapping and accuracy of soil lineplacement. The maps do not show the small areas of contrastingsoils that could have been shown at a more detailed scale.
Please rely on the bar scale on each map sheet for accurate mapmeasurements.
Source of Map: Natural Resources Conservation ServiceWeb Soil Survey URL: http://websoilsurvey.nrcs.usda.govCoordinate System: UTM Zone 10N NAD83
This product is generated from the USDA-NRCS certified data as ofthe version date(s) listed below.
Soil Survey Area: San Mateo County, Eastern Part, and SanFrancisco County, CaliforniaSurvey Area Data: Version 9, Jul 11, 2011
Soil Survey Area: Santa Clara Area, California, Western PartSurvey Area Data: Version 1, Jul 27, 2010
Your area of interest (AOI) includes more than one soil survey area.These survey areas may have been mapped at different scales, witha different land use in mind, at different times, or at different levelsof detail. This may result in map unit symbols, soil properties, andinterpretations that do not completely agree across soil survey areaboundaries.
Date(s) aerial images were photographed: 6/12/2005; 6/13/2005
The orthophoto or other base map on which the soil lines werecompiled and digitized probably differs from the backgroundimagery displayed on these maps. As a result, some minor shiftingof map unit boundaries may be evident.
Soil Map–San Mateo County, Eastern Part, and San Francisco County, California; and Santa Clara Area, California, Western Part(Soil Survey Map)
Natural ResourcesConservation Service
Web Soil SurveyNational Cooperative Soil Survey
2/23/2012Page 2 of 3
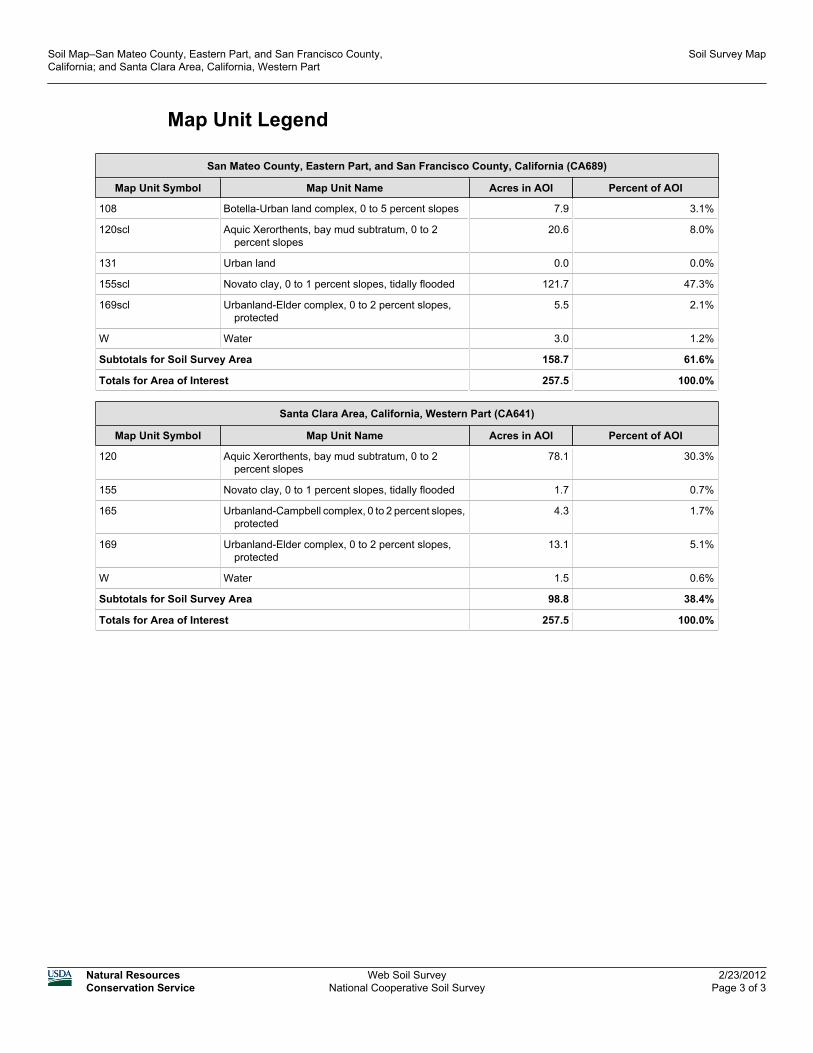
Map Unit Legend
San Mateo County, Eastern Part, and San Francisco County, California (CA689)
Map Unit Symbol Map Unit Name Acres in AOI Percent of AOI
108 Botella-Urban land complex, 0 to 5 percent slopes 7.9 3.1%
120scl Aquic Xerorthents, bay mud subtratum, 0 to 2percent slopes
20.6 8.0%
131 Urban land 0.0 0.0%
155scl Novato clay, 0 to 1 percent slopes, tidally flooded 121.7 47.3%
169scl Urbanland-Elder complex, 0 to 2 percent slopes,protected
5.5 2.1%
W Water 3.0 1.2%
Subtotals for Soil Survey Area 158.7 61.6%
Totals for Area of Interest 257.5 100.0%
Santa Clara Area, California, Western Part (CA641)
Map Unit Symbol Map Unit Name Acres in AOI Percent of AOI
120 Aquic Xerorthents, bay mud subtratum, 0 to 2percent slopes
78.1 30.3%
155 Novato clay, 0 to 1 percent slopes, tidally flooded 1.7 0.7%
165 Urbanland-Campbell complex, 0 to 2 percent slopes,protected
4.3 1.7%
169 Urbanland-Elder complex, 0 to 2 percent slopes,protected
13.1 5.1%
W Water 1.5 0.6%
Subtotals for Soil Survey Area 98.8 38.4%
Totals for Area of Interest 257.5 100.0%
Soil Map–San Mateo County, Eastern Part, and San Francisco County,California; and Santa Clara Area, California, Western Part
Soil Survey Map
Natural ResourcesConservation Service
Web Soil SurveyNational Cooperative Soil Survey
2/23/2012Page 3 of 3

Hydric Soils (CA)
This table lists the map unit components and their hydric status in the survey area.This list can help in planning land uses; however, onsite investigation isrecommended to determine the hydric soils on a specific site (National ResearchCouncil, 1995; Hurt and others, 2002).
The three essential characteristics of wetlands are hydrophytic vegetation, hydricsoils, and wetland hydrology (Cowardin and others, 1979; U.S. Army Corps ofEngineers, 1987; National Research Council, 1995; Tiner, 1985). Criteria for all ofthe characteristics must be met for areas to be identified as wetlands. Undrainedhydric soils that have natural vegetation should support a dominant population ofecological wetland plant species. Hydric soils that have been converted to otheruses should be capable of being restored to wetlands.
Hydric soils are defined by the National Technical Committee for Hydric Soils(NTCHS) as soils that formed under conditions of saturation, flooding, or pondinglong enough during the growing season to develop anaerobic conditions in theupper part (Federal Register, 1994). These soils, under natural conditions, areeither saturated or inundated long enough during the growing season to supportthe growth and reproduction of hydrophytic vegetation.
The NTCHS definition identifies general soil properties that are associated withwetness. In order to determine whether a specific soil is a hydric soil or nonhydricsoil, however, more specific information, such as information about the depth andduration of the water table, is needed. Thus, criteria that identify those estimatedsoil properties unique to hydric soils have been established (Federal Register,2002). These criteria are used to identify map unit components that normally areassociated with wetlands. The criteria used are selected estimated soil propertiesthat are described in "Soil Taxonomy" (Soil Survey Staff, 1999) and "Keys to SoilTaxonomy" (Soil Survey Staff, 2006) and in the "Soil Survey Manual" (Soil SurveyDivision Staff, 1993).
If soils are wet enough for a long enough period of time to be considered hydric,they should exhibit certain properties that can be easily observed in the field. Thesevisible properties are indicators of hydric soils. The indicators used to make onsitedeterminations of hydric soils are specified in "Field Indicators of Hydric Soils in theUnited States" (Hurt and Vasilas, 2006).
Hydric soils are identified by examining and describing the soil to a depth of about20 inches. This depth may be greater if determination of an appropriate indicatorso requires. It is always recommended that soils be excavated and described tothe depth necessary for an understanding of the redoximorphic processes. Then,using the completed soil descriptions, soil scientists can compare the soil featuresrequired by each indicator and specify which indicators have been matched withthe conditions observed in the soil. The soil can be identified as a hydric soil if atleast one of the approved indicators is present.
Map units that are dominantly made up of hydric soils may have small areas, orinclusions, of nonhydric soils in the higher positions on the landform, and map unitsdominantly made up of nonhydric soils may have inclusions of hydric soils in thelower positions on the landform.
The criteria for hydric soils are represented by codes in the table (for example, 2B3).Definitions for the codes are as follows:
Hydric Soils (CA)–San Mateo County, Eastern Part, and San Francisco County,California; and Santa Clara Area, California, Western Part
Hydric Soil Information
Natural ResourcesConservation Service
Web Soil SurveyNational Cooperative Soil Survey
2/23/2012Page 1 of 4

1. All Histels except for Folistels, and Histosols except for Folists.2. Soils in Aquic suborders, great groups, or subgroups, Albolls suborder,
Historthels great group, Histoturbels great group, Pachic subgroups, orCumulic subgroups that:A. are somewhat poorly drained and have a water table at the surface (0.0
feet) during the growing season, orB. are poorly drained or very poorly drained and have either:
i. a water table at the surface (0.0 feet) during the growing season iftextures are coarse sand, sand, or fine sand in all layers within a depthof 20 inches, or
ii. a water table at a depth of 0.5 foot or less during the growing seasonif saturated hydraulic conductivity (Ksat) is equal to or greater than6.0 in/hr in all layers within a depth of 20 inches, or
iii. a water table at a depth of 1.0 foot or less during the growing seasonif saturated hydraulic conductivity (Ksat) is less than 6.0 in/hr in anylayer within a depth of 20 inches.
3. Soils that are frequently ponded for long or very long duration during thegrowing season.
4. Soils that are frequently flooded for long or very long duration during thegrowing season.
Hydric Condition: Food Security Act information regarding the ability to grow acommodity crop without removing woody vegetation or manipulating hydrology.
References:Cowardin, L.M., V. Carter, F.C. Golet, and E.T. LaRoe. 1979. Classification ofwetlands and deep-water habitats of the United States. U.S. Fish and WildlifeService FWS/OBS-79/31.Federal Register. September 18, 2002. Hydric soils of the United States.Federal Register. July 13, 1994. Changes in hydric soils of the United States.Hurt, G.W., and L.M. Vasilas, editors. Version 6.0, 2006. Field indicators of hydricsoils in the United States.National Research Council. 1995. Wetlands: Characteristics and boundaries.Soil Survey Division Staff. 1993. Soil survey manual. Soil Conservation Service.U.S. Department of Agriculture Handbook 18.Soil Survey Staff. 2006. Keys to soil taxonomy. 10th edition. U.S. Department ofAgriculture, Natural Resources Conservation Service.Soil Survey Staff. 1999. Soil taxonomy: A basic system of soil classification formaking and interpreting soil surveys. 2nd edition. Natural Resources ConservationService. U.S. Department of Agriculture Handbook 436.Tiner, R.W., Jr. 1985. Wetlands of Delaware. U.S. Fish and Wildlife Service andDelaware Department of Natural Resources and Environmental Control, WetlandsSection.United States Army Corps of Engineers, Environmental Laboratory. 1987. Corpsof Engineers wetlands delineation manual. Waterways Experiment StationTechnical Report Y-87-1.
Hydric Soils (CA)–San Mateo County, Eastern Part, and San Francisco County,California; and Santa Clara Area, California, Western Part
Hydric Soil Information
Natural ResourcesConservation Service
Web Soil SurveyNational Cooperative Soil Survey
2/23/2012Page 2 of 4
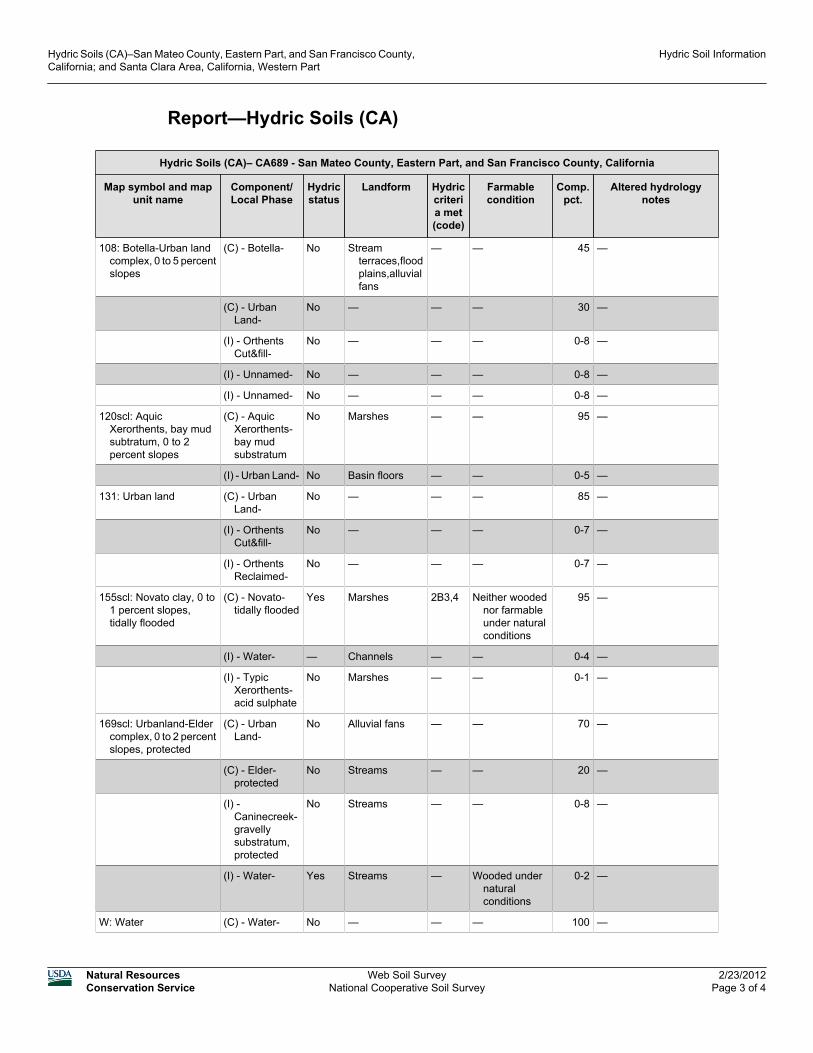
Report—Hydric Soils (CA)
Hydric Soils (CA)– CA689 - San Mateo County, Eastern Part, and San Francisco County, California
Map symbol and mapunit name
Component/Local Phase
Hydricstatus
Landform Hydriccriteria met(code)
Farmablecondition
Comp.pct.
Altered hydrologynotes
108: Botella-Urban landcomplex, 0 to 5 percentslopes
(C) - Botella- No Streamterraces,floodplains,alluvialfans
— — 45 —
(C) - UrbanLand-
No — — — 30 —
(I) - OrthentsCut&fill-
No — — — 0-8 —
(I) - Unnamed- No — — — 0-8 —
(I) - Unnamed- No — — — 0-8 —
120scl: AquicXerorthents, bay mudsubtratum, 0 to 2percent slopes
(C) - AquicXerorthents-bay mudsubstratum
No Marshes — — 95 —
(I) - Urban Land- No Basin floors — — 0-5 —
131: Urban land (C) - UrbanLand-
No — — — 85 —
(I) - OrthentsCut&fill-
No — — — 0-7 —
(I) - OrthentsReclaimed-
No — — — 0-7 —
155scl: Novato clay, 0 to1 percent slopes,tidally flooded
(C) - Novato-tidally flooded
Yes Marshes 2B3,4 Neither woodednor farmableunder naturalconditions
95 —
(I) - Water- — Channels — — 0-4 —
(I) - TypicXerorthents-acid sulphate
No Marshes — — 0-1 —
169scl: Urbanland-Eldercomplex, 0 to 2 percentslopes, protected
(C) - UrbanLand-
No Alluvial fans — — 70 —
(C) - Elder-protected
No Streams — — 20 —
(I) -Caninecreek-gravellysubstratum,protected
No Streams — — 0-8 —
(I) - Water- Yes Streams — Wooded undernaturalconditions
0-2 —
W: Water (C) - Water- No — — — 100 —
Hydric Soils (CA)–San Mateo County, Eastern Part, and San Francisco County,California; and Santa Clara Area, California, Western Part
Hydric Soil Information
Natural ResourcesConservation Service
Web Soil SurveyNational Cooperative Soil Survey
2/23/2012Page 3 of 4

Hydric Soils (CA)– CA641 - Santa Clara Area, California, Western Part
Map symbol and mapunit name
Component/Local Phase
Hydricstatus
Landform Hydriccriteria met(code)
Farmablecondition
Comp.pct.
Altered hydrologynotes
120: Aquic Xerorthents,bay mud subtratum, 0to 2 percent slopes
(C) - AquicXerorthents-bay mudsubstratum
No Marshes — — 95 —
(I) - Urban Land- No Basin floors — — 0-5 —
155: Novato clay, 0 to 1percent slopes, tidallyflooded
(C) - Novato-tidally flooded
Yes Marshes 2B3,4 Neither woodednor farmableunder naturalconditions
95 —
(I) - Water- — Channels — — 0-4 —
(I) - TypicXerorthents-acid sulphate
No Marshes — — 0-1 —
165: Urbanland-Campbell complex, 0to 2 percent slopes,protected
(C) - UrbanLand-
No Alluvial fans — — 70 —
(C) - Campbell-protected
No Alluvial fans — — 20 water tables have beenlowered below the soilprofile by historicagricultural pumping
(I) - Newpark- No Alluvial fans — — 0-5 —
(I) - Clear Lake- No Basin floors — — 0-5 —
169: Urbanland-Eldercomplex, 0 to 2 percentslopes, protected
(C) - UrbanLand-
No Alluvial fans — — 70 —
(C) - Elder-protected
No Streams — — 20 —
(I) -Caninecreek-gravellysubstratum,protected
No Streams — — 0-8 —
(I) - Water- Yes Streams — Wooded undernaturalconditions
0-2 —
W: Water (C) - Water- No — — — 100 —
Data Source Information
Soil Survey Area: San Mateo County, Eastern Part, and San Francisco County,CaliforniaSurvey Area Data: Version 9, Jul 11, 2011
Soil Survey Area: Santa Clara Area, California, Western PartSurvey Area Data: Version 1, Jul 27, 2010
Hydric Soils (CA)–San Mateo County, Eastern Part, and San Francisco County,California; and Santa Clara Area, California, Western Part
Hydric Soil Information
Natural ResourcesConservation Service
Web Soil SurveyNational Cooperative Soil Survey
2/23/2012Page 4 of 4

Appendix B WETS Tables
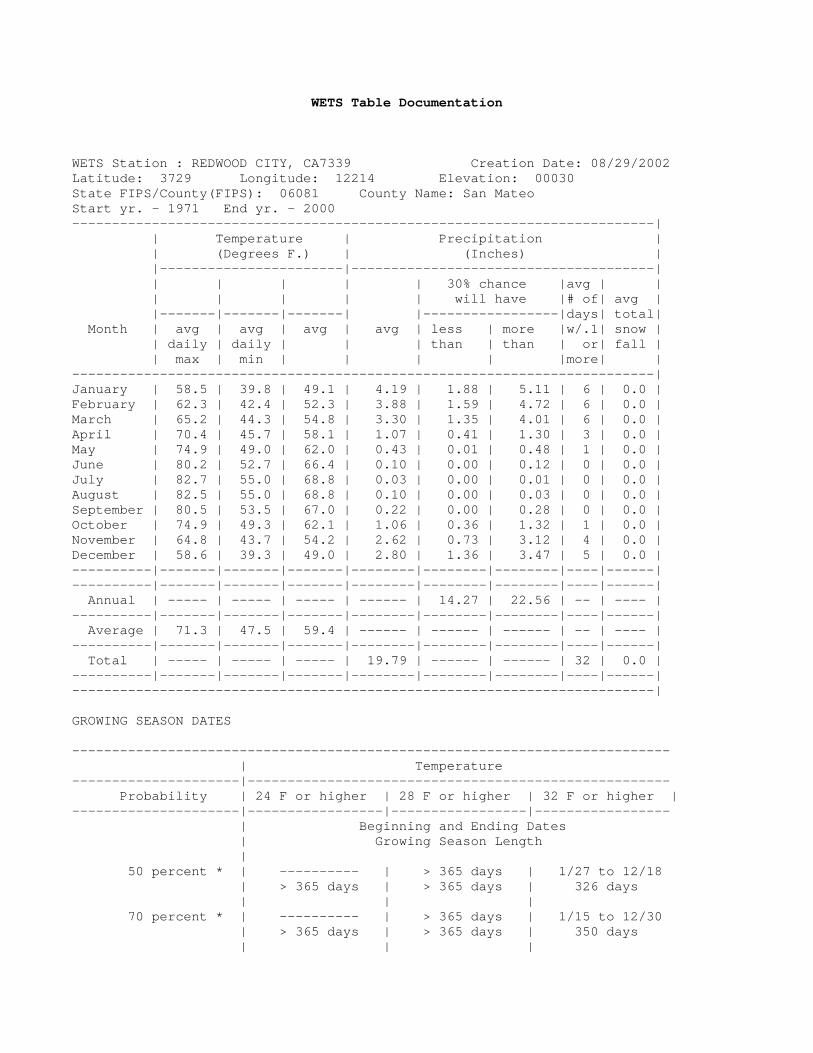
WETS Table Documentation WETS Station : REDWOOD CITY, CA7339 Creation Date: 08/29/2002 Latitude: 3729 Longitude: 12214 Elevation: 00030 State FIPS/County(FIPS): 06081 County Name: San Mateo Start yr. - 1971 End yr. - 2000 -------------------------------------------------------------------------| | Temperature | Precipitation | | (Degrees F.) | (Inches) | |-----------------------|--------------------------------------| | | | | | 30% chance |avg | | | | | | | will have |# of| avg | |-------|-------|-------| |-----------------|days| total| Month | avg | avg | avg | avg | less | more |w/.1| snow | | daily | daily | | | than | than | or| fall | | max | min | | | | |more| | -------------------------------------------------------------------------| January | 58.5 | 39.8 | 49.1 | 4.19 | 1.88 | 5.11 | 6 | 0.0 | February | 62.3 | 42.4 | 52.3 | 3.88 | 1.59 | 4.72 | 6 | 0.0 | March | 65.2 | 44.3 | 54.8 | 3.30 | 1.35 | 4.01 | 6 | 0.0 | April | 70.4 | 45.7 | 58.1 | 1.07 | 0.41 | 1.30 | 3 | 0.0 | May | 74.9 | 49.0 | 62.0 | 0.43 | 0.01 | 0.48 | 1 | 0.0 | June | 80.2 | 52.7 | 66.4 | 0.10 | 0.00 | 0.12 | 0 | 0.0 | July | 82.7 | 55.0 | 68.8 | 0.03 | 0.00 | 0.01 | 0 | 0.0 | August | 82.5 | 55.0 | 68.8 | 0.10 | 0.00 | 0.03 | 0 | 0.0 | September | 80.5 | 53.5 | 67.0 | 0.22 | 0.00 | 0.28 | 0 | 0.0 | October | 74.9 | 49.3 | 62.1 | 1.06 | 0.36 | 1.32 | 1 | 0.0 | November | 64.8 | 43.7 | 54.2 | 2.62 | 0.73 | 3.12 | 4 | 0.0 | December | 58.6 | 39.3 | 49.0 | 2.80 | 1.36 | 3.47 | 5 | 0.0 | ----------|-------|-------|-------|--------|--------|--------|----|------| ----------|-------|-------|-------|--------|--------|--------|----|------| Annual | ----- | ----- | ----- | ------ | 14.27 | 22.56 | -- | ---- | ----------|-------|-------|-------|--------|--------|--------|----|------| Average | 71.3 | 47.5 | 59.4 | ------ | ------ | ------ | -- | ---- | ----------|-------|-------|-------|--------|--------|--------|----|------| Total | ----- | ----- | ----- | 19.79 | ------ | ------ | 32 | 0.0 | ----------|-------|-------|-------|--------|--------|--------|----|------| -------------------------------------------------------------------------| GROWING SEASON DATES --------------------------------------------------------------------------- | Temperature ---------------------|----------------------------------------------------- Probability | 24 F or higher | 28 F or higher | 32 F or higher | ---------------------|-----------------|-----------------|----------------- | Beginning and Ending Dates | Growing Season Length | 50 percent * | ---------- | > 365 days | 1/27 to 12/18 | > 365 days | > 365 days | 326 days | | | 70 percent * | ---------- | > 365 days | 1/15 to 12/30 | > 365 days | > 365 days | 350 days | | |

--------------------------------------------------------------------------- * Percent chance of the growing season occurring between the Beginning and Ending dates. total 1948-2002 prcp Station : CA7339, REDWOOD CITY ------- Unit = inches yr jan feb mar apr may jun jul aug sep oct nov dec annl ------- ----- ----- ----- ----- ----- ----- ----- ----- ----- ----- ----- ----- 48 0.02 0.00 0.00 0.25 M0.12 4.10 4.49 49 1.20 3.39 4.91 0.00 0.72 0.01 0.09 0.21 0.03 0.07 1.54 2.09 14.26 50 7.44 2.52 1.47 1.05 0.53 0.03 0.00 0.00 0.00 1.66 6.54 5.69 26.93 51 2.92 2.21 1.18 0.89 0.64 0.02 0.00 0.00 0.00 1.03 2.58 9.34 20.81 52 8.57 1.90 4.43 0.80 0.25 0.09 0.03 0.00 0.01 0.14 2.51 10.19 28.92 53 3.12 0.04 1.76 2.11 0.48 0.16 0.00 0.03 0.00 0.24 2.44 0.36 10.74 54 4.33 2.67 3.07 0.98 0.04 0.24 0.00 0.00 0.00 0.02 2.30 4.00 17.65 55 4.58 1.71 0.11 1.55 0.60 0.00 0.00 0.00 0.00 0.00 1.45 14.16 24.16 56 7.85 2.36 0.19 0.94 0.93 0.01 M0.00 0.00 0.22 1.10 0.00 0.35 13.95 57 2.97 4.06 1.42 1.32 2.76 0.00 0.00 0.00 0.72 1.95 0.66 4.12 19.98 58 4.61 8.82 6.52 6.37 0.30 0.20 0.00 0.00 0.10 0.01 0.12 1.06 28.11 59 5.05 4.55 0.14 0.21 0.00 0.00 0.00 0.02 3.07 0.00 0.00 1.65 14.69 60 4.51 4.57 0.89 0.65 0.63 0.00 0.00 0.00 0.00 0.05 3.15 0.99 15.44 61 1.95 0.83 2.70 0.94 0.76 0.03 0.00 0.02 0.36 0.19 3.11 1.77 12.66 62 1.84 7.58 3.29 0.25 0.00 0.00 0.00 0.01 0.01 6.39 0.33 2.82 22.52 63 4.46 3.20 3.63 2.92 0.55 0.00 0.00 0.00 0.29 0.95 3.98 0.26 20.24 64 3.60 0.27 1.67 0.13 0.56 0.75 0.00 0.08 0.00 1.30 3.59 6.63 18.58 65 3.88 1.08 1.96 3.25 0.00 0.00 0.00 0.07 0.01 0.00 4.45 5.17 19.87 66 2.18 1.81 0.24 0.66 0.13 0.09 0.30 0.04 0.10 0.00 4.04 3.56 13.15 6710.90 0.17 5.44 4.68 0.15 0.52 0.00 0.00 0.00 0.25 1.33 2.86 26.30 68 5.44 1.42 3.43 0.78 0.07 0.00 0.00 0.11 0.00 0.37 1.95 4.75 18.32 69 9.39 8.90 1.42 1.79 0.01 0.04 0.00 0.00 0.01 1.24 0.73 4.11 27.64 70 8.77 2.04 1.43 0.40 0.04 0.06 0.00 0.00 0.00 0.74 6.69 7.42 27.59 71 1.22 0.36 2.73 0.73 0.21 0.00 0.01 0.35 0.12 0.03 0.81 4.36 10.93 72 1.15 1.21 0.09 0.86 0.00 0.08 0.00 0.00 0.47 4.19 6.29 1.80 16.14 73 7.61 6.07 2.09 0.11 0.00 0.00 0.00 0.00 0.03 1.96 7.36 4.83 30.06 74 3.46 1.05 4.64 2.11 0.00 0.13 0.22 0.00 0.00 1.20 0.69 2.59 16.09 75 1.50 4.33 5.72 1.57 0.00 0.11 0.13 0.46 0.00 1.55 0.22 0.22 15.81 76 0.27 1.92 0.84 0.79 0.00 0.03 0.02 0.90 0.52 0.38 1.11 1.23 8.01 77 1.46 0.86 1.97 0.01 1.07 0.00 0.10 0.00 0.85 0.25 2.17 3.49 12.23 78 9.05 4.95 5.01 2.83 0.02 0.00 0.00 0.00 0.36 0.00 1.73 0.52 24.47 79 5.73 4.94 3.53 1.00 0.38 0.00 0.23 0.00 0.00 2.08 1.65 M1.03 20.57 80 4.56 8.08 1.79 1.43 0.10 0.02 0.10 0.00 0.00 0.05 0.07 2.54 18.74 81 7.21 2.50 4.39 0.19 0.06 0.00 0.00 0.00 0.26 2.20 7.23 5.20 29.24 82 7.29 3.41 8.23 3.27 0.00 0.10 0.00 0.02 1.03 2.05 5.94 5.25 36.59 83 8.07 7.36 9.20 3.58 0.37 0.00 0.00 0.00 0.37 0.69 7.09 6.09 42.82 84 0.46 1.66 1.58 0.54 0.00 0.03 0.00 0.20 0.22 1.83 5.67 2.03 14.22 85 0.66 1.97 4.15 0.08 0.45 0.15 0.05 0.01 0.18 0.99 M2.87 2.57 14.13 86 2.98 10.06 0.67 0.45 0.00 0.03 0.00 0.63 0.00 0.04 1.33 16.19 87 2.84 5.01 1.60 0.22 0.03 0.00 0.00 0.00 0.00 1.05 1.60 3.93 16.28 88 3.31 0.58 0.05 1.65 0.24 0.03 0.00 0.00 0.00 0.18 1.87 3.09 11.00 89 1.59 1.37 3.27 0.95 0.05 0.03 0.00 0.00 0.64 1.72 1.42 0.00 11.04 90 2.48 2.68 0.76 0.18 1.61 0.00 0.01 0.00 0.11 0.20 0.09 2.04 10.16 91 0.33 2.94 7.87 0.33 0.15 0.15 0.00 0.17 0.13 1.70 0.40 2.63 16.80 92 1.85 6.34 3.05 0.20 0.00 0.20 0.00 0.05 0.00 1.58 0.09 6.26 19.62 93 9.81 4.78 2.51 0.63 0.44 0.31 0.00 0.00 0.00 0.41 1.40 2.08 22.37
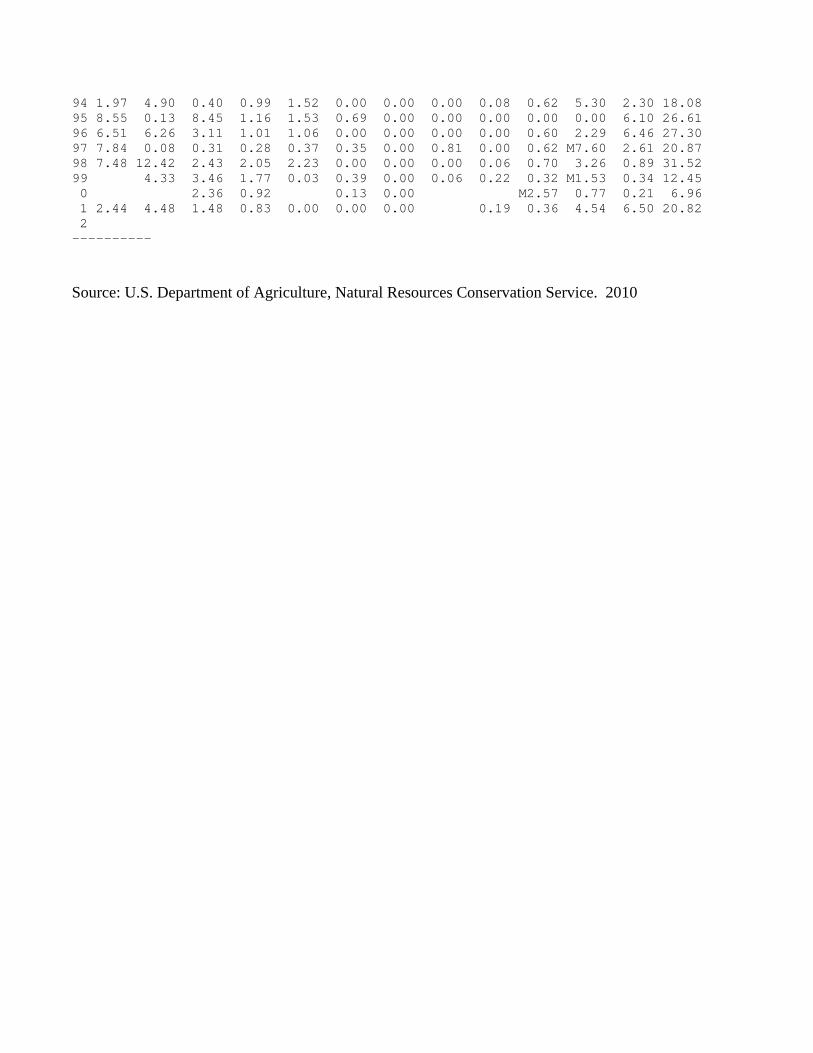
94 1.97 4.90 0.40 0.99 1.52 0.00 0.00 0.00 0.08 0.62 5.30 2.30 18.08 95 8.55 0.13 8.45 1.16 1.53 0.69 0.00 0.00 0.00 0.00 0.00 6.10 26.61 96 6.51 6.26 3.11 1.01 1.06 0.00 0.00 0.00 0.00 0.60 2.29 6.46 27.30 97 7.84 0.08 0.31 0.28 0.37 0.35 0.00 0.81 0.00 0.62 M7.60 2.61 20.87 98 7.48 12.42 2.43 2.05 2.23 0.00 0.00 0.00 0.06 0.70 3.26 0.89 31.52 99 4.33 3.46 1.77 0.03 0.39 0.00 0.06 0.22 0.32 M1.53 0.34 12.45 0 2.36 0.92 0.13 0.00 M2.57 0.77 0.21 6.96 1 2.44 4.48 1.48 0.83 0.00 0.00 0.00 0.19 0.36 4.54 6.50 20.82 2 ---------- Source: U.S. Department of Agriculture, Natural Resources Conservation Service. 2010

Appendix C Plant Species Observed in the Delineation Study Area

Appendix C. Plant Species Observed in the Delineation Study Area
The * following a scientific name indicates that the species is not native. Wetland indicator status follows Reed (1988); nomenclature follows Reed (1988) and The Jepson Manual, Second Edition (Baldwin et al. 2012) and online updates.
Scientific Name Common Name Wetland Indicator Status‡
Trees
Acacia greggii* acacia, catclaw FACU
Acacia melanoxylon* Blackwood acacia not listed
Acer negundo box elder FACW
Alnus rhombifolia white alder FACW
Eucalyptus globulus* blue gum not listed
Juglans sp. walnut not determined
Pinus spp.* pine-ornamental UPL
Populus alba* white cottonwood not listed
Quercus agrifolia coast live oak not listed
Salix babylonica* weeping willow FACW-
Umbellularia californica California bay laurel FAC
Shrubs and Woody Vines
Baccharis pilularis coyote brush not listed
Morella (Myrica) californica California wax myrtle FAC+
Rubus armeniacus [R. discolor]* Himalayan blackberry FACW*
Rubus ursinus [R. vitifolius] California blackberry FACW*
Salix lasiolepis arroyo willow FACW
Sambucus nigra ssp. caerulea (S.mexicana) blue elderberry FAC
Forbs
Achillea millefolium yarrow FACU
Artemisia californica California sagebrush not listed
Artemisia douglasiana mugwort FACW
Atriplex prostrata (A. triangularis)* fat hen not listed
Brassica nigra* black mustard not listed
Carduus pycnocephalus* Italian thistle not listed
Carpobrotus chilensis* iceplant; sea fig not listed
Centaurea solstitialis* yellow star-thistle not listed
Centromadia fitchii Fitch's spikeweed not listed
Chenopodium sp. goosefoot undetermined
Cirsium vulgare* bull thistle FACU
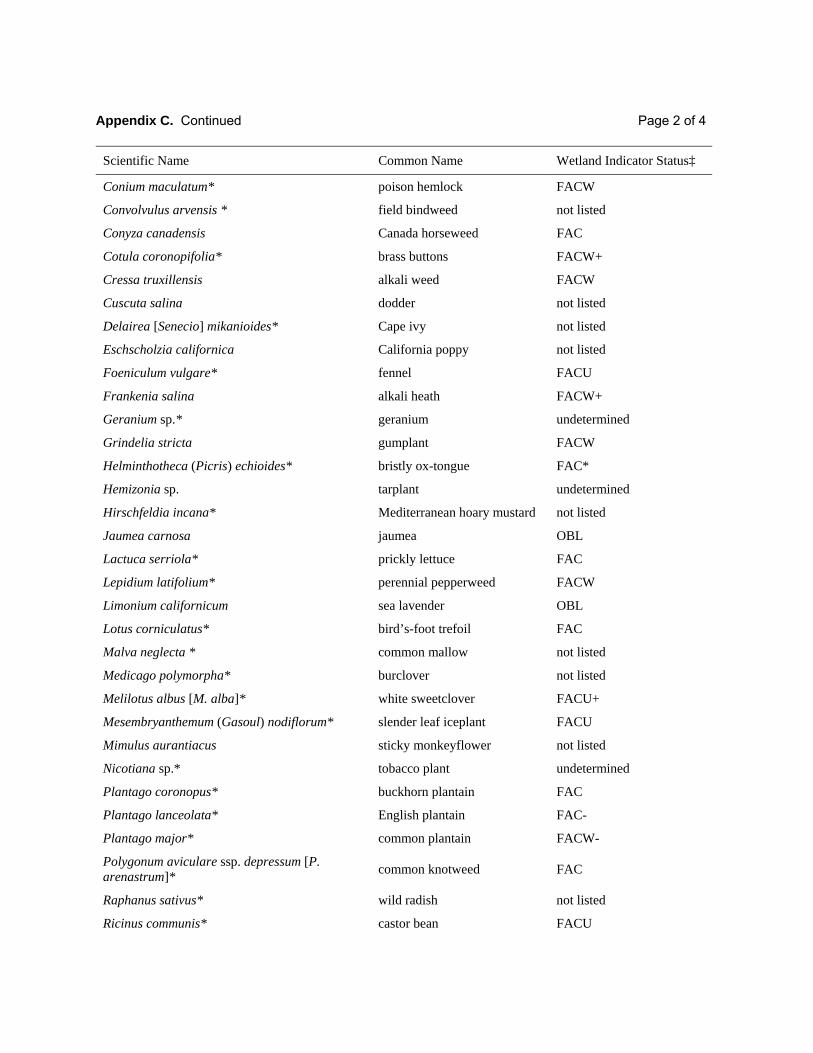
Appendix C. Continued Page 2 of 4
Scientific Name Common Name Wetland Indicator Status‡
Conium maculatum* poison hemlock FACW
Convolvulus arvensis * field bindweed not listed
Conyza canadensis Canada horseweed FAC
Cotula coronopifolia* brass buttons FACW+
Cressa truxillensis alkali weed FACW
Cuscuta salina dodder not listed
Delairea [Senecio] mikanioides* Cape ivy not listed
Eschscholzia californica California poppy not listed
Foeniculum vulgare* fennel FACU
Frankenia salina alkali heath FACW+
Geranium sp.* geranium undetermined
Grindelia stricta gumplant FACW
Helminthotheca (Picris) echioides* bristly ox-tongue FAC*
Hemizonia sp. tarplant undetermined
Hirschfeldia incana* Mediterranean hoary mustard not listed
Jaumea carnosa jaumea OBL
Lactuca serriola* prickly lettuce FAC
Lepidium latifolium* perennial pepperweed FACW
Limonium californicum sea lavender OBL
Lotus corniculatus* bird’s-foot trefoil FAC
Malva neglecta * common mallow not listed
Medicago polymorpha* burclover not listed
Melilotus albus [M. alba]* white sweetclover FACU+
Mesembryanthemum (Gasoul) nodiflorum* slender leaf iceplant FACU
Mimulus aurantiacus sticky monkeyflower not listed
Nicotiana sp.* tobacco plant undetermined
Plantago coronopus* buckhorn plantain FAC
Plantago lanceolata* English plantain FAC-
Plantago major* common plantain FACW-
Polygonum aviculare ssp. depressum [P. arenastrum]*
common knotweed FAC
Raphanus sativus* wild radish not listed
Ricinus communis* castor bean FACU
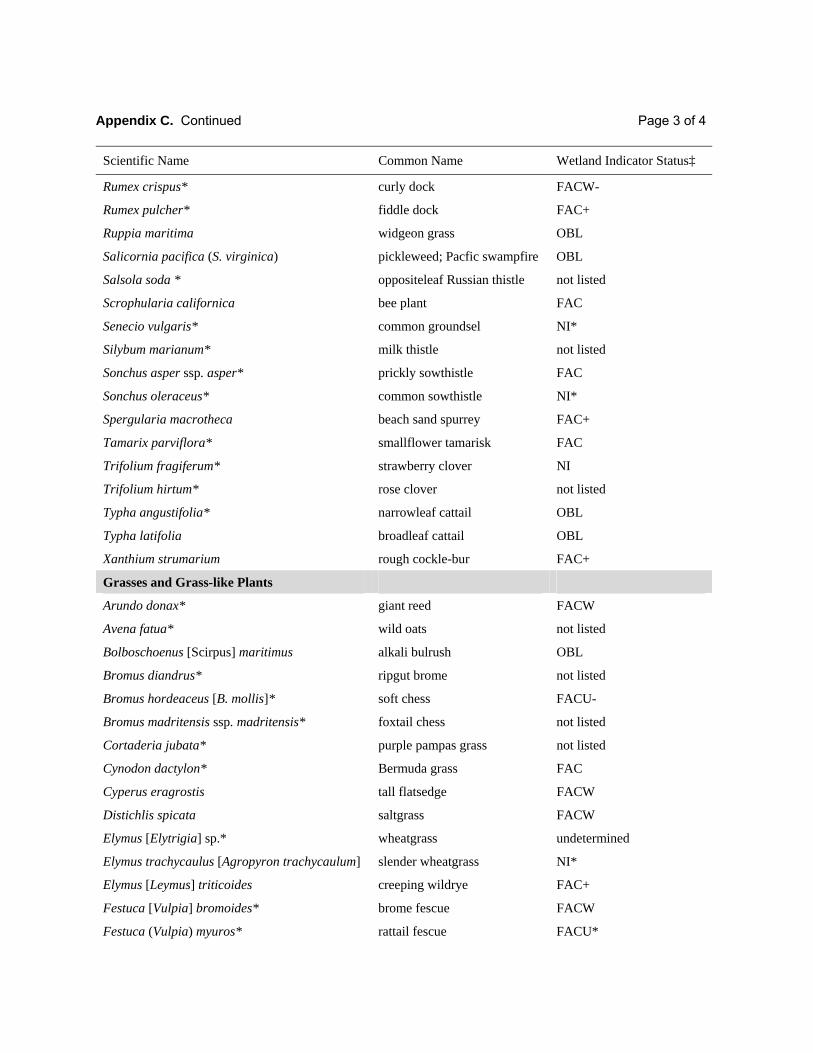
Appendix C. Continued Page 3 of 4
Scientific Name Common Name Wetland Indicator Status‡
Rumex crispus* curly dock FACW-
Rumex pulcher* fiddle dock FAC+
Ruppia maritima widgeon grass OBL
Salicornia pacifica (S. virginica) pickleweed; Pacfic swampfire OBL
Salsola soda * oppositeleaf Russian thistle not listed
Scrophularia californica bee plant FAC
Senecio vulgaris* common groundsel NI*
Silybum marianum* milk thistle not listed
Sonchus asper ssp. asper* prickly sowthistle FAC
Sonchus oleraceus* common sowthistle NI*
Spergularia macrotheca beach sand spurrey FAC+
Tamarix parviflora* smallflower tamarisk FAC
Trifolium fragiferum* strawberry clover NI
Trifolium hirtum* rose clover not listed
Typha angustifolia* narrowleaf cattail OBL
Typha latifolia broadleaf cattail OBL
Xanthium strumarium rough cockle-bur FAC+
Grasses and Grass-like Plants
Arundo donax* giant reed FACW
Avena fatua* wild oats not listed
Bolboschoenus [Scirpus] maritimus alkali bulrush OBL
Bromus diandrus* ripgut brome not listed
Bromus hordeaceus [B. mollis]* soft chess FACU-
Bromus madritensis ssp. madritensis* foxtail chess not listed
Cortaderia jubata* purple pampas grass not listed
Cynodon dactylon* Bermuda grass FAC
Cyperus eragrostis tall flatsedge FACW
Distichlis spicata saltgrass FACW
Elymus [Elytrigia] sp.* wheatgrass undetermined
Elymus trachycaulus [Agropyron trachycaulum] slender wheatgrass NI*
Elymus [Leymus] triticoides creeping wildrye FAC+
Festuca [Vulpia] bromoides* brome fescue FACW
Festuca (Vulpia) myuros* rattail fescue FACU*
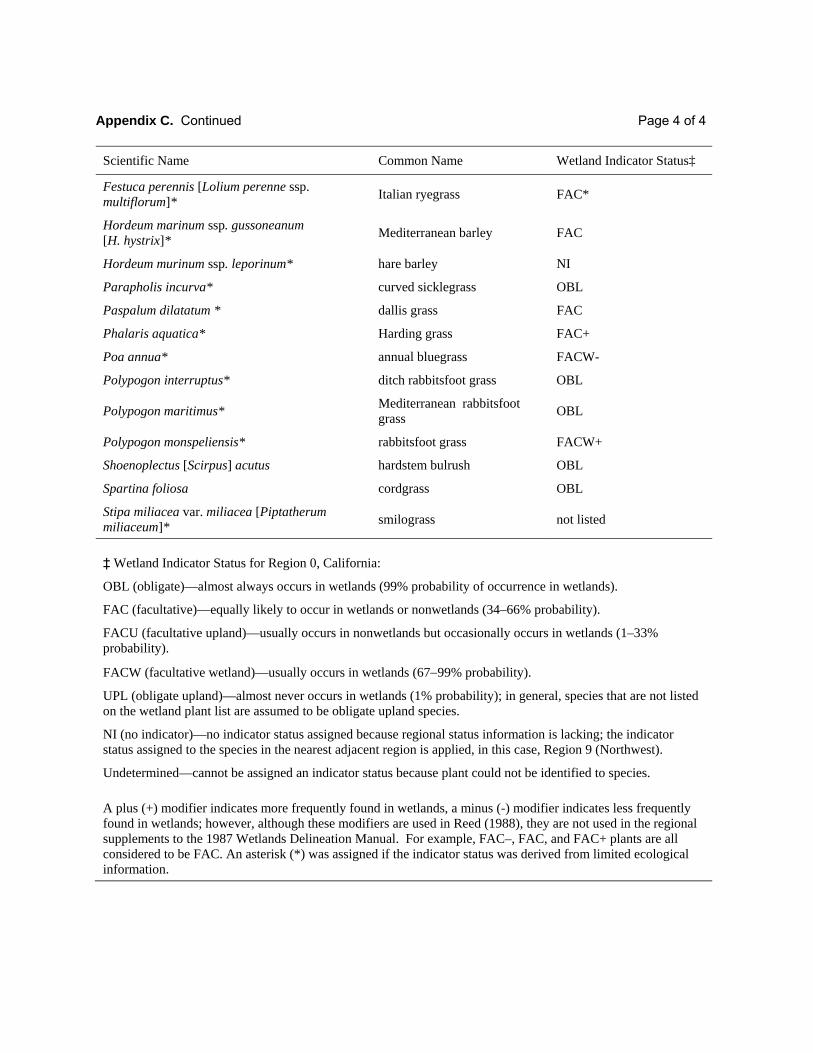
Appendix C. Continued Page 4 of 4
Scientific Name Common Name Wetland Indicator Status‡
Festuca perennis [Lolium perenne ssp. multiflorum]*
Italian ryegrass FAC*
Hordeum marinum ssp. gussoneanum [H. hystrix]*
Mediterranean barley FAC
Hordeum murinum ssp. leporinum* hare barley NI
Parapholis incurva* curved sicklegrass OBL
Paspalum dilatatum * dallis grass FAC
Phalaris aquatica* Harding grass FAC+
Poa annua* annual bluegrass FACW-
Polypogon interruptus* ditch rabbitsfoot grass OBL
Polypogon maritimus* Mediterranean rabbitsfoot grass
OBL
Polypogon monspeliensis* rabbitsfoot grass FACW+
Shoenoplectus [Scirpus] acutus hardstem bulrush OBL
Spartina foliosa cordgrass OBL
Stipa miliacea var. miliacea [Piptatherum miliaceum]*
smilograss not listed
‡ Wetland Indicator Status for Region 0, California:
OBL (obligate)—almost always occurs in wetlands (99% probability of occurrence in wetlands).
FAC (facultative)—equally likely to occur in wetlands or nonwetlands (34–66% probability).
FACU (facultative upland)—usually occurs in nonwetlands but occasionally occurs in wetlands (1–33% probability).
FACW (facultative wetland)—usually occurs in wetlands (6799% probability).
UPL (obligate upland)—almost never occurs in wetlands (1% probability); in general, species that are not listed on the wetland plant list are assumed to be obligate upland species.
NI (no indicator)—no indicator status assigned because regional status information is lacking; the indicator status assigned to the species in the nearest adjacent region is applied, in this case, Region 9 (Northwest).
Undetermined—cannot be assigned an indicator status because plant could not be identified to species.
A plus (+) modifier indicates more frequently found in wetlands, a minus (-) modifier indicates less frequently found in wetlands; however, although these modifiers are used in Reed (1988), they are not used in the regional supplements to the 1987 Wetlands Delineation Manual. For example, FAC–, FAC, and FAC+ plants are all considered to be FAC. An asterisk (*) was assigned if the indicator status was derived from limited ecological information.
Appendix D Wetland Determination Data Forms
US Army Corps of Engineers Arid West – Version 2.0 (modified)
WETLAND DETERMINATION DATA FORM – Arid West Region
VEGETATION
Tree Stratum (Plot size r = 30 ft.) Absolute % Cover
Dominant Species?
Indicator Status
Dominance Test Worksheet:
1. Number of Dominant Species That Are OBL, FACW, or FAC:
2 (A) 2.
3. Total Number of Dominant Species Across All Strata:
2 (B) 4.
= Total Cover Percent of Dominant Species That Are OBL, FACW, or FAC:
100 (A/B) Sapling/Shrub Stratum (Plot size r = 5 ft.)
1. Prevalence Index Worksheet:
2. Total % Cover of: Multiply by:
3. OBL species x1 =
4. FACW species x2 =
5. FAC species x3 =
= Total Cover FACU species x4 =
Herb Stratum (Plot size r = 5 ft.) UPL species x5 =
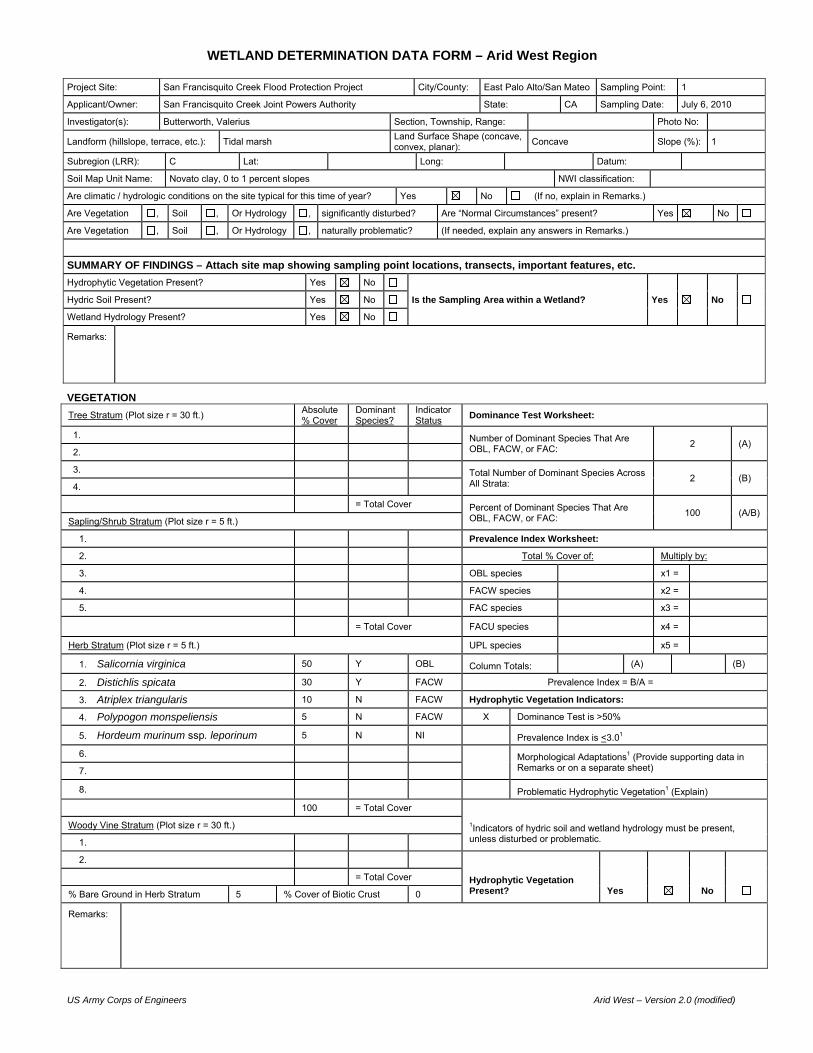
1. Salicornia virginica 50 Y OBL Column Totals: (A) (B)
2. Distichlis spicata 30 Y FACW Prevalence Index = B/A =
3. Atriplex triangularis 10 N FACW Hydrophytic Vegetation Indicators:
4. Polypogon monspeliensis 5 N FACW X Dominance Test is >50%
5. Hordeum murinum ssp. leporinum 5 N NI Prevalence Index is <3.01
6.
Morphological Adaptations1 (Provide supporting data in Remarks or on a separate sheet) 7.
8. Problematic Hydrophytic Vegetation1 (Explain)
100 = Total Cover
1Indicators of hydric soil and wetland hydrology must be present, unless disturbed or problematic.
Woody Vine Stratum (Plot size r = 30 ft.)
1.
2.
Hydrophytic Vegetation Present? Yes No
= Total Cover
% Bare Ground in Herb Stratum 5 % Cover of Biotic Crust 0
Remarks:
Project Site: San Francisquito Creek Flood Protection Project City/County: East Palo Alto/San Mateo Sampling Point: 1
Applicant/Owner: San Francisquito Creek Joint Powers Authority State: CA Sampling Date: July 6, 2010
Investigator(s): Butterworth, Valerius Section, Township, Range: Photo No:
Landform (hillslope, terrace, etc.): Tidal marsh Land Surface Shape (concave, convex, planar):
Concave Slope (%): 1
Subregion (LRR): C Lat: Long: Datum:
Soil Map Unit Name: Novato clay, 0 to 1 percent slopes NWI classification:
Are climatic / hydrologic conditions on the site typical for this time of year? Yes No (If no, explain in Remarks.)
Are Vegetation , Soil , Or Hydrology , significantly disturbed? Are “Normal Circumstances” present? Yes No
Are Vegetation , Soil , Or Hydrology , naturally problematic? (If needed, explain any answers in Remarks.)
SUMMARY OF FINDINGS – Attach site map showing sampling point locations, transects, important features, etc.
Hydrophytic Vegetation Present? Yes No
Is the Sampling Area within a Wetland? Yes No Hydric Soil Present? Yes No
Wetland Hydrology Present? Yes No
Remarks:

US Army Corps of Engineers Arid West – Version 2.0 (modified)
SOIL Sampling Point: 1
Profile Description: (Describe to the depth needed to document the indicator or confirm the absence of indicators.)
Depth Matrix Redox Features
(inches) Color (moist) % Color (Moist) % Type1 Loc2 Texture Horizon Remarks
0-4 10YR4/3 100 cl A1
4-8 10YR4/3 100 sicl A2
8-20 Gley 1 2.5/10Y 95 7.5YR3/4 5 C PL sic Bg
1Type: C= Concentration, D=Depletion, RM=Reduced Matrix, CS=Covered or Coated Sand Grains. 2Location: PL=Pore Lining, LRC=Living Root Channel, M=Matrix.
Hydric Soil Indicators: (Applicable to all LRRs, unless otherwise noted.) Indicators for Problematic Hydric Soils3:
Histosol (A1) Sandy Redox (S5) 1 cm Muck (A9) (LRR C)
Histic Epipedon (A2) Stripped Matrix (S6) 2 cm Muck (A10) (LRR B)
Black Histic (A3) Loamy Mucky Mineral (F1) Reduced Vertic (F18)
Hydrogen Sulfide (A4) Loamy Gleyed Matrix (F2) Red Parent Material (TF2)
Stratified Layers (A5) (LRR C) Depleted Matrix (F3) Other (Explain in Remarks)
1 cm Muck (A9) (LRR D) Redox Dark Surface (F6)
3Indicators of hydrophytic vegetation and wetland hydrology must be present.
Depleted Below Dark Surface (A11) Depleted Dark Surface (F7)
Thick Dark Surface (A12) Redox Depressions (F8)
Sandy Mucky Mineral (S1) Vernal Pools (F9)
Sandy Gleyed Matrix (S4)
Restrictive Layer (if present):
Hydric Soils Present? Yes No
Type:
Depth (Inches):
Remarks:
HYDROLOGY Wetland Hydrology Indicators:
Primary Indicators (any one indicator is sufficient) Secondary Indicators (2 or more required)
Surface Water (A1) Salt Crust (B11) Water Marks (B1) (Riverine)
High Water Table (A2) Biotic Crust (B12) Sediment Deposits (B2) (Riverine)
Saturation (A3) Aquatic Invertebrates (B13) Drift Deposits (B3) (Riverine)
Water Marks (B1) (Nonriverine) Hydrogen Sulfide Odor (C1) Drainage Patterns (B10)
Sediment Deposits (B2) (Nonriverine) Oxidized Rhizospheres along Living Roots (C3) Dry-Season Water Table (C2)
Drift Deposits (B3) (Nonriverine) Presence of Reduced Iron (C4) Crayfish Burrows (C8)
Surface Soil Cracks (B6) Recent Iron Reduction in Tilled Soils (C6) Saturation Visible on Aerial Imagery (C9)
Inundation Visible on Aerial Imagery (B7) Thin Muck Surface (C7) Shallow Aquitard (D3)
Water-Stained Leaves (B9) Other (Explain in Remarks) FAC-Neutral Test (D5)
Field Observations:
Surface Water Present? Yes No Depth (inches): n/a Wetland Hydrology Present?
Yes
No
Water Table Present? Yes No Depth (inches): None to 20
Saturation Present? (includes capillary fringe)
Yes No Depth (inches): None to 20
Describe Recorded Data (stream gauge, monitoring well, aerial photos, previous inspections), if available:
Remarks:
Project Site: San Francisquito Creek Flood Protection Project
US Army Corps of Engineers Arid West – Version 2.0 (modified)
WETLAND DETERMINATION DATA FORM – Arid West Region
VEGETATION
Tree Stratum (Plot size r = 30 ft.) Absolute % Cover
Dominant Species?
Indicator Status
Dominance Test Worksheet:
1. Number of Dominant Species That Are OBL, FACW, or FAC:
3 (A) 2.
3. Total Number of Dominant Species Across All Strata:
1 (B) 4.
= Total Cover Percent of Dominant Species That Are OBL, FACW, or FAC:
33 (A/B) Sapling/Shrub Stratum (Plot size r = 5 ft.)
1. Prevalence Index Worksheet:
2. Total % Cover of: Multiply by:
3. OBL species x1 =
4. FACW species x2 =
5. FAC species x3 =
= Total Cover FACU species x4 =
Herb Stratum (Plot size r = 5 ft.) UPL species x5 =
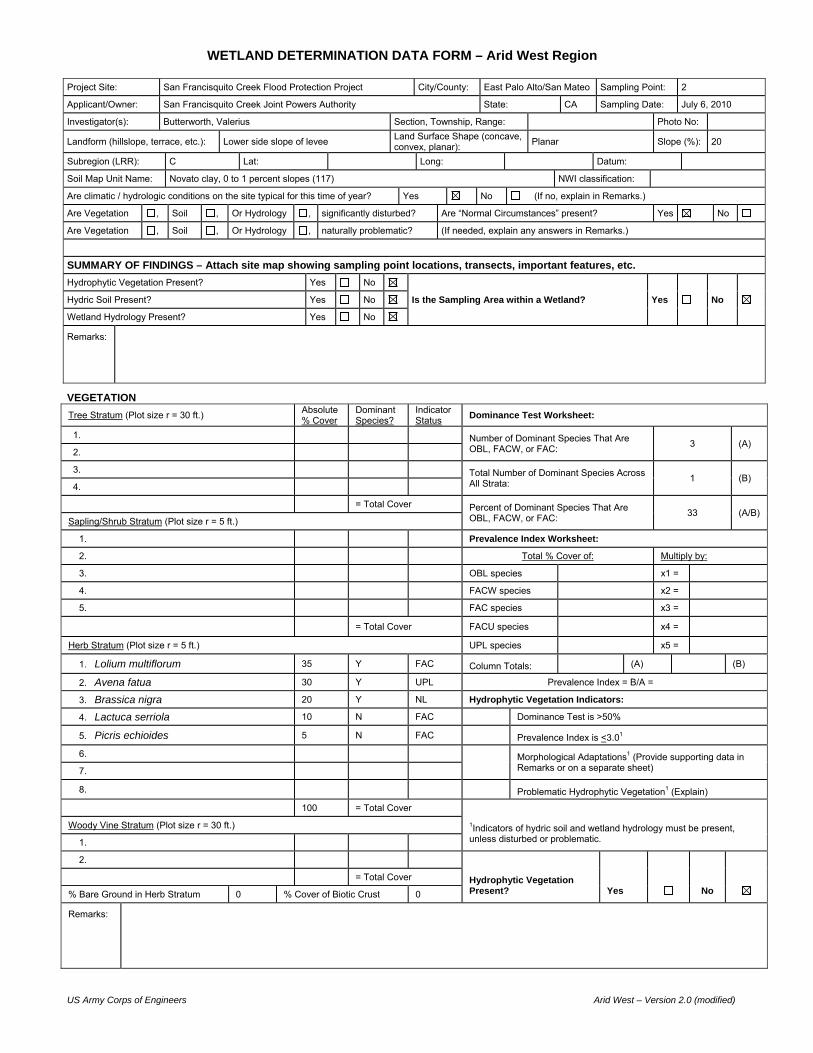
1. Lolium multiflorum 35 Y FAC Column Totals: (A) (B)
2. Avena fatua 30 Y UPL Prevalence Index = B/A =
3. Brassica nigra 20 Y NL Hydrophytic Vegetation Indicators:
4. Lactuca serriola 10 N FAC Dominance Test is >50%
5. Picris echioides 5 N FAC Prevalence Index is <3.01
6.
Morphological Adaptations1 (Provide supporting data in Remarks or on a separate sheet) 7.
8. Problematic Hydrophytic Vegetation1 (Explain)
100 = Total Cover
1Indicators of hydric soil and wetland hydrology must be present, unless disturbed or problematic.
Woody Vine Stratum (Plot size r = 30 ft.)
1.
2.
Hydrophytic Vegetation Present? Yes No
= Total Cover
% Bare Ground in Herb Stratum 0 % Cover of Biotic Crust 0
Remarks:
Project Site: San Francisquito Creek Flood Protection Project City/County: East Palo Alto/San Mateo Sampling Point: 2
Applicant/Owner: San Francisquito Creek Joint Powers Authority State: CA Sampling Date: July 6, 2010
Investigator(s): Butterworth, Valerius Section, Township, Range: Photo No:
Landform (hillslope, terrace, etc.): Lower side slope of levee Land Surface Shape (concave, convex, planar):
Planar Slope (%): 20
Subregion (LRR): C Lat: Long: Datum:
Soil Map Unit Name: Novato clay, 0 to 1 percent slopes (117) NWI classification:
Are climatic / hydrologic conditions on the site typical for this time of year? Yes No (If no, explain in Remarks.)
Are Vegetation , Soil , Or Hydrology , significantly disturbed? Are “Normal Circumstances” present? Yes No
Are Vegetation , Soil , Or Hydrology , naturally problematic? (If needed, explain any answers in Remarks.)
SUMMARY OF FINDINGS – Attach site map showing sampling point locations, transects, important features, etc.
Hydrophytic Vegetation Present? Yes No
Is the Sampling Area within a Wetland? Yes No Hydric Soil Present? Yes No
Wetland Hydrology Present? Yes No
Remarks:

US Army Corps of Engineers Arid West – Version 2.0 (modified)
SOIL Sampling Point: 2
Profile Description: (Describe to the depth needed to document the indicator or confirm the absence of indicators.)
Depth Matrix Redox Features
(inches) Color (moist) % Color (Moist) % Type1 Loc2 Texture Horizon Remarks
0-10 10YR3/2 100 cl Fill 1
10-19 5Y3/1 85 10YR3/4 15 C M c Fill 2
1Type: C= Concentration, D=Depletion, RM=Reduced Matrix, CS=Covered or Coated Sand Grains. 2Location: PL=Pore Lining, LRC=Living Root Channel, M=Matrix.
Hydric Soil Indicators: (Applicable to all LRRs, unless otherwise noted.) Indicators for Problematic Hydric Soils3:
Histosol (A1) Sandy Redox (S5) 1 cm Muck (A9) (LRR C)
Histic Epipedon (A2) Stripped Matrix (S6) 2 cm Muck (A10) (LRR B)
Black Histic (A3) Loamy Mucky Mineral (F1) Reduced Vertic (F18)
Hydrogen Sulfide (A4) Loamy Gleyed Matrix (F2) Red Parent Material (TF2)
Stratified Layers (A5) (LRR C) Depleted Matrix (F3) Other (Explain in Remarks)
1 cm Muck (A9) (LRR D) Redox Dark Surface (F6)
3Indicators of hydrophytic vegetation and wetland hydrology must be present.
Depleted Below Dark Surface (A11) Depleted Dark Surface (F7)
Thick Dark Surface (A12) Redox Depressions (F8)
Sandy Mucky Mineral (S1) Vernal Pools (F9)
Sandy Gleyed Matrix (S4)
Restrictive Layer (if present):
Hydric Soils Present? Yes No
Type:
Depth (Inches):
Remarks: Redox appears to be contemporary.
HYDROLOGY Wetland Hydrology Indicators:
Primary Indicators (any one indicator is sufficient) Secondary Indicators (2 or more required)
Surface Water (A1) Salt Crust (B11) Water Marks (B1) (Riverine)
High Water Table (A2) Biotic Crust (B12) Sediment Deposits (B2) (Riverine)
Saturation (A3) Aquatic Invertebrates (B13) Drift Deposits (B3) (Riverine)
Water Marks (B1) (Nonriverine) Hydrogen Sulfide Odor (C1) Drainage Patterns (B10)
Sediment Deposits (B2) (Nonriverine) Oxidized Rhizospheres along Living Roots (C3) Dry-Season Water Table (C2)
Drift Deposits (B3) (Nonriverine) Presence of Reduced Iron (C4) Crayfish Burrows (C8)
Surface Soil Cracks (B6) Recent Iron Reduction in Tilled Soils (C6) Saturation Visible on Aerial Imagery (C9)
Inundation Visible on Aerial Imagery (B7) Thin Muck Surface (C7) Shallow Aquitard (D3)
Water-Stained Leaves (B9) Other (Explain in Remarks) FAC-Neutral Test (D5)
Field Observations:
Surface Water Present? Yes No Depth (inches): n/a Wetland Hydrology Present?
Yes
No
Water Table Present? Yes No Depth (inches): None to 19
Saturation Present? (includes capillary fringe)
Yes No Depth (inches): None to 19
Describe Recorded Data (stream gauge, monitoring well, aerial photos, previous inspections), if available:
Remarks:
Project Site: San Francisquito Creek Flood Protection Project

US Army Corps of Engineers Arid West – Version 2.0 (modified)
WETLAND DETERMINATION DATA FORM – Arid West Region
VEGETATION
Tree Stratum (Plot size r = 30 ft.) Absolute % Cover
Dominant Species?
Indicator Status
Dominance Test Worksheet:
1. Number of Dominant Species That Are OBL, FACW, or FAC:
1 (A) 2.
3. Total Number of Dominant Species Across All Strata:
1 (B) 4.
= Total Cover Percent of Dominant Species That Are OBL, FACW, or FAC:
100 (A/B) Sapling/Shrub Stratum (Plot size r = 5 ft.)
1. Prevalence Index Worksheet:
2. Total % Cover of: Multiply by:
3. OBL species x1 =
4. FACW species x2 =
5. FAC species x3 =
= Total Cover FACU species x4 =
Herb Stratum (Plot size r = 5 ft.) UPL species x5 =
1. Lepidium latifolium 90 Y FACW Column Totals: (A) (B)
2. Salicornia virginica 10 N OBL Prevalence Index = B/A =
3. Hydrophytic Vegetation Indicators:
4. X Dominance Test is >50%
5. Prevalence Index is <3.01
6.
Morphological Adaptations1 (Provide supporting data in Remarks or on a separate sheet) 7.
8. Problematic Hydrophytic Vegetation1 (Explain)
100 = Total Cover
1Indicators of hydric soil and wetland hydrology must be present, unless disturbed or problematic.
Woody Vine Stratum (Plot size r = 30 ft.)
1.
2.
Hydrophytic Vegetation Present? Yes No
= Total Cover
% Bare Ground in Herb Stratum 5 % Cover of Biotic Crust 0
Remarks:
Project Site: San Francisquito Creek Flood Protection Project City/County: East Palo Alto/San Mateo Sampling Point: 3
Applicant/Owner: San Francisquito Creek Joint Powers Authority State: CA Sampling Date: July 6, 2010
Investigator(s): Butterworth, Valerius Section, Township, Range: Photo No:
Landform (hillslope, terrace, etc.): Tidal marsh Land Surface Shape (concave, convex, planar):
Concave Slope (%): 0-1
Subregion (LRR): C Lat: Long: Datum:
Soil Map Unit Name: Novato clay, 0 to 1 percent slopes (117) NWI classification:
Are climatic / hydrologic conditions on the site typical for this time of year? Yes No (If no, explain in Remarks.)
Are Vegetation , Soil , Or Hydrology , significantly disturbed? N Are “Normal Circumstances” present? Yes No
Are Vegetation , Soil , Or Hydrology , naturally problematic? N (If needed, explain any answers in Remarks.)
SUMMARY OF FINDINGS – Attach site map showing sampling point locations, transects, important features, etc.
Hydrophytic Vegetation Present? Yes No
Is the Sampling Area within a Wetland? Yes No Hydric Soil Present? Yes No
Wetland Hydrology Present? Yes No
Remarks:
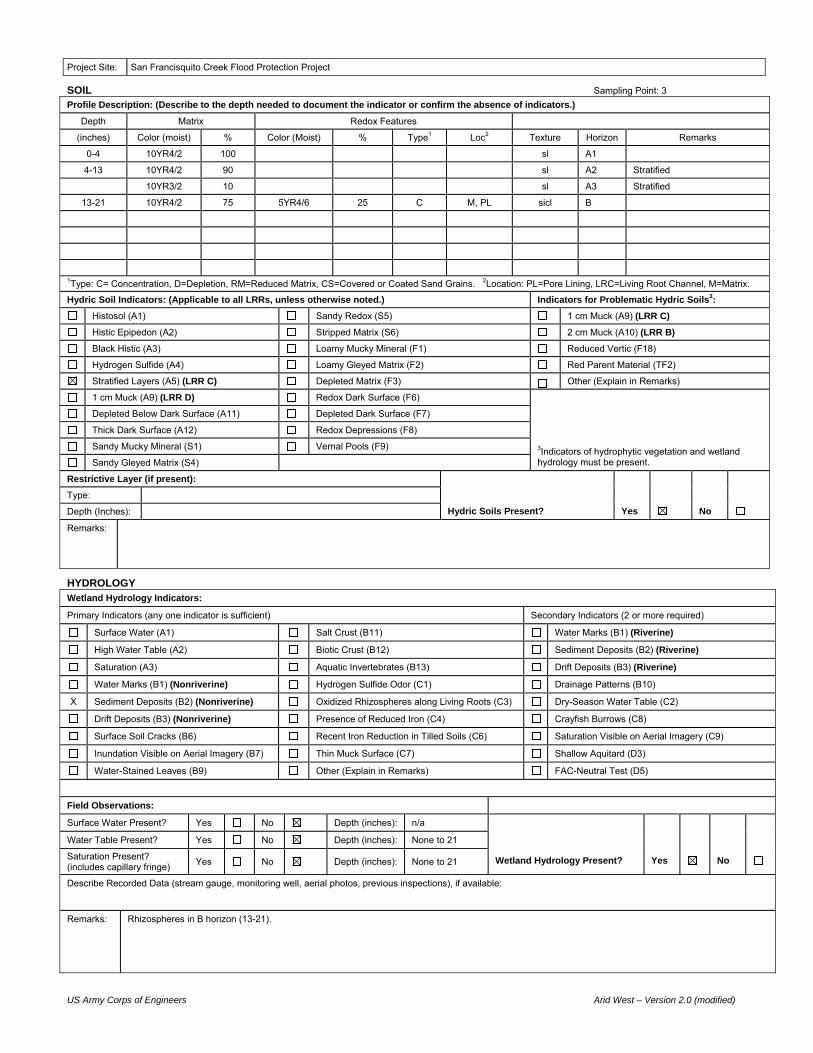
US Army Corps of Engineers Arid West – Version 2.0 (modified)
SOIL Sampling Point: 3
Profile Description: (Describe to the depth needed to document the indicator or confirm the absence of indicators.)
Depth Matrix Redox Features
(inches) Color (moist) % Color (Moist) % Type1 Loc2 Texture Horizon Remarks
0-4 10YR4/2 100 sl A1
4-13 10YR4/2 90 sl A2 Stratified
10YR3/2 10 sl A3 Stratified
13-21 10YR4/2 75 5YR4/6 25 C M, PL sicl B
1Type: C= Concentration, D=Depletion, RM=Reduced Matrix, CS=Covered or Coated Sand Grains. 2Location: PL=Pore Lining, LRC=Living Root Channel, M=Matrix.
Hydric Soil Indicators: (Applicable to all LRRs, unless otherwise noted.) Indicators for Problematic Hydric Soils3:
Histosol (A1) Sandy Redox (S5) 1 cm Muck (A9) (LRR C)
Histic Epipedon (A2) Stripped Matrix (S6) 2 cm Muck (A10) (LRR B)
Black Histic (A3) Loamy Mucky Mineral (F1) Reduced Vertic (F18)
Hydrogen Sulfide (A4) Loamy Gleyed Matrix (F2) Red Parent Material (TF2)
Stratified Layers (A5) (LRR C) Depleted Matrix (F3) Other (Explain in Remarks)
1 cm Muck (A9) (LRR D) Redox Dark Surface (F6)
3Indicators of hydrophytic vegetation and wetland hydrology must be present.
Depleted Below Dark Surface (A11) Depleted Dark Surface (F7)
Thick Dark Surface (A12) Redox Depressions (F8)
Sandy Mucky Mineral (S1) Vernal Pools (F9)
Sandy Gleyed Matrix (S4)
Restrictive Layer (if present):
Hydric Soils Present? Yes No
Type:
Depth (Inches):
Remarks:
HYDROLOGY Wetland Hydrology Indicators:
Primary Indicators (any one indicator is sufficient) Secondary Indicators (2 or more required)
Surface Water (A1) Salt Crust (B11) Water Marks (B1) (Riverine)
High Water Table (A2) Biotic Crust (B12) Sediment Deposits (B2) (Riverine)
Saturation (A3) Aquatic Invertebrates (B13) Drift Deposits (B3) (Riverine)
Water Marks (B1) (Nonriverine) Hydrogen Sulfide Odor (C1) Drainage Patterns (B10)
X Sediment Deposits (B2) (Nonriverine) Oxidized Rhizospheres along Living Roots (C3) Dry-Season Water Table (C2)
Drift Deposits (B3) (Nonriverine) Presence of Reduced Iron (C4) Crayfish Burrows (C8)
Surface Soil Cracks (B6) Recent Iron Reduction in Tilled Soils (C6) Saturation Visible on Aerial Imagery (C9)
Inundation Visible on Aerial Imagery (B7) Thin Muck Surface (C7) Shallow Aquitard (D3)
Water-Stained Leaves (B9) Other (Explain in Remarks) FAC-Neutral Test (D5)
Field Observations:
Surface Water Present? Yes No Depth (inches): n/a Wetland Hydrology Present?
Yes
No
Water Table Present? Yes No Depth (inches): None to 21
Saturation Present? (includes capillary fringe)
Yes No Depth (inches): None to 21
Describe Recorded Data (stream gauge, monitoring well, aerial photos, previous inspections), if available:
Remarks: Rhizospheres in B horizon (13-21).
Project Site: San Francisquito Creek Flood Protection Project

US Army Corps of Engineers Arid West – Version 2.0 (modified)
WETLAND DETERMINATION DATA FORM – Arid West Region
VEGETATION
Tree Stratum (Plot size r = 30 ft.) Absolute % Cover
Dominant Species?
Indicator Status
Dominance Test Worksheet:
1. Number of Dominant Species That Are OBL, FACW, or FAC:
0 (A) 2.
3. Total Number of Dominant Species Across All Strata:
1 (B) 4.
= Total Cover Percent of Dominant Species That Are OBL, FACW, or FAC:
0 (A/B) Sapling/Shrub Stratum (Plot size r = 5 ft.)
1. Prevalence Index Worksheet:
2. Total % Cover of: Multiply by:
3. OBL species x1 =
4. FACW species x2 =
5. FAC species x3 =
= Total Cover FACU species x4 =
Herb Stratum (Plot size r = 5 ft.) UPL species x5 =
1. Avena fatua 60 Y UPL Column Totals: (A) (B)
2. Raphanus sativus 15 N NL Prevalence Index = B/A =
3. Lactuca serriola 15 N FAC Hydrophytic Vegetation Indicators:
4. Lepidium latifolium 10 N FACW Dominance Test is >50%
5. Prevalence Index is <3.01
6.
Morphological Adaptations1 (Provide supporting data in Remarks or on a separate sheet) 7.
8. Problematic Hydrophytic Vegetation1 (Explain)
100 = Total Cover
1Indicators of hydric soil and wetland hydrology must be present, unless disturbed or problematic.
Woody Vine Stratum (Plot size r = 30 ft.)
1.
2.
Hydrophytic Vegetation Present? Yes No
= Total Cover
% Bare Ground in Herb Stratum 0 % Cover of Biotic Crust 0
Remarks:
Project Site: San Francisquito Creek Flood Protection Project City/County: East Palo Alto/San Mateo Sampling Point: 4
Applicant/Owner: San Francisquito Creek Joint Powers Authority State: CA Sampling Date: July 6, 2010
Investigator(s): Butterworth, Valerius Section, Township, Range: Photo No:
Landform (hillslope, terrace, etc.): Lower side slope of levee Land Surface Shape (concave, convex, planar):
Planar Slope (%): 25
Subregion (LRR): C Lat: Long: Datum:
Soil Map Unit Name: Novato clay, 0 to 1 percent slopes (117) NWI classification:
Are climatic / hydrologic conditions on the site typical for this time of year? Yes No (If no, explain in Remarks.)
Are Vegetation , Soil , Or Hydrology , significantly disturbed? Are “Normal Circumstances” present? Yes No
Are Vegetation , Soil , Or Hydrology , naturally problematic? (If needed, explain any answers in Remarks.)
SUMMARY OF FINDINGS – Attach site map showing sampling point locations, transects, important features, etc.
Hydrophytic Vegetation Present? Yes No
Is the Sampling Area within a Wetland? Yes No Hydric Soil Present? Yes No
Wetland Hydrology Present? Yes No
Remarks:

US Army Corps of Engineers Arid West – Version 2.0 (modified)
SOIL Sampling Point: 4
Profile Description: (Describe to the depth needed to document the indicator or confirm the absence of indicators.)
Depth Matrix Redox Features
(inches) Color (moist) % Color (Moist) % Type1 Loc2 Texture Horizon Remarks
0-11 10YR3/2 100 l Fill 1
11-20 10YR3/2 85 7.5YR4/6 15 C M cl Fill 2
1Type: C= Concentration, D=Depletion, RM=Reduced Matrix, CS=Covered or Coated Sand Grains. 2Location: PL=Pore Lining, LRC=Living Root Channel, M=Matrix.
Hydric Soil Indicators: (Applicable to all LRRs, unless otherwise noted.) Indicators for Problematic Hydric Soils3:
Histosol (A1) Sandy Redox (S5) 1 cm Muck (A9) (LRR C)
Histic Epipedon (A2) Stripped Matrix (S6) 2 cm Muck (A10) (LRR B)
Black Histic (A3) Loamy Mucky Mineral (F1) Reduced Vertic (F18)
Hydrogen Sulfide (A4) Loamy Gleyed Matrix (F2) Red Parent Material (TF2)
Stratified Layers (A5) (LRR C) Depleted Matrix (F3) Other (Explain in Remarks)
1 cm Muck (A9) (LRR D) Redox Dark Surface (F6)
3Indicators of hydrophytic vegetation and wetland hydrology must be present.
Depleted Below Dark Surface (A11) Depleted Dark Surface (F7)
Thick Dark Surface (A12) Redox Depressions (F8)
Sandy Mucky Mineral (S1) Vernal Pools (F9)
Sandy Gleyed Matrix (S4)
Restrictive Layer (if present):
Hydric Soils Present? Yes No X
Type:
Depth (Inches):
Remarks: Redox appears to be contemporary.
HYDROLOGY Wetland Hydrology Indicators:
Primary Indicators (any one indicator is sufficient) Secondary Indicators (2 or more required)
Surface Water (A1) Salt Crust (B11) Water Marks (B1) (Riverine)
High Water Table (A2) Biotic Crust (B12) Sediment Deposits (B2) (Riverine)
Saturation (A3) Aquatic Invertebrates (B13) Drift Deposits (B3) (Riverine)
Water Marks (B1) (Nonriverine) Hydrogen Sulfide Odor (C1) Drainage Patterns (B10)
Sediment Deposits (B2) (Nonriverine) Oxidized Rhizospheres along Living Roots (C3) Dry-Season Water Table (C2)
Drift Deposits (B3) (Nonriverine) Presence of Reduced Iron (C4) Crayfish Burrows (C8)
Surface Soil Cracks (B6) Recent Iron Reduction in Tilled Soils (C6) Saturation Visible on Aerial Imagery (C9)
Inundation Visible on Aerial Imagery (B7) Thin Muck Surface (C7) Shallow Aquitard (D3)
Water-Stained Leaves (B9) Other (Explain in Remarks) FAC-Neutral Test (D5)
Field Observations:
Surface Water Present? Yes No Depth (inches): n/a Wetland Hydrology Present?
Yes
No
Water Table Present? Yes No Depth (inches): None to 20
Saturation Present? (includes capillary fringe)
Yes No Depth (inches): None to 20
Describe Recorded Data (stream gauge, monitoring well, aerial photos, previous inspections), if available:
Remarks:
Project Site: San Francisquito Creek Flood Protection Project
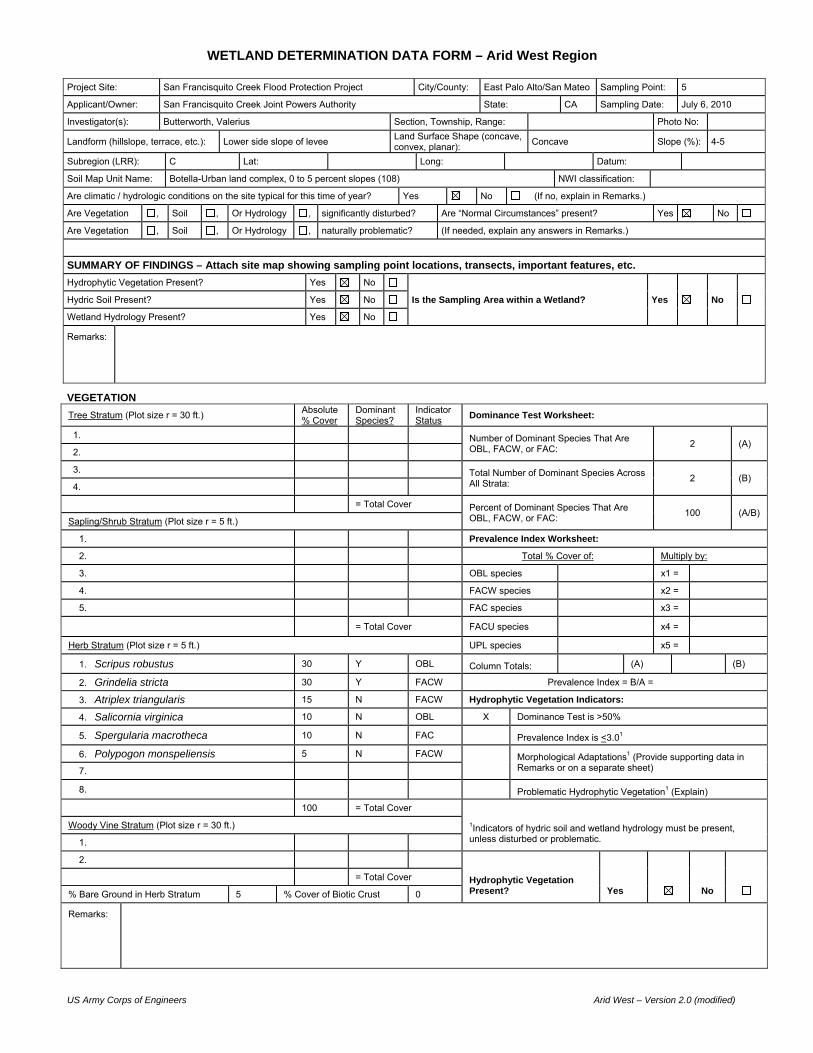
US Army Corps of Engineers Arid West – Version 2.0 (modified)
WETLAND DETERMINATION DATA FORM – Arid West Region
VEGETATION
Tree Stratum (Plot size r = 30 ft.) Absolute % Cover
Dominant Species?
Indicator Status
Dominance Test Worksheet:
1. Number of Dominant Species That Are OBL, FACW, or FAC:
2 (A) 2.
3. Total Number of Dominant Species Across All Strata:
2 (B) 4.
= Total Cover Percent of Dominant Species That Are OBL, FACW, or FAC:
100 (A/B) Sapling/Shrub Stratum (Plot size r = 5 ft.)
1. Prevalence Index Worksheet:
2. Total % Cover of: Multiply by:
3. OBL species x1 =
4. FACW species x2 =
5. FAC species x3 =
= Total Cover FACU species x4 =
Herb Stratum (Plot size r = 5 ft.) UPL species x5 =
1. Scripus robustus 30 Y OBL Column Totals: (A) (B)
2. Grindelia stricta 30 Y FACW Prevalence Index = B/A =
3. Atriplex triangularis 15 N FACW Hydrophytic Vegetation Indicators:
4. Salicornia virginica 10 N OBL X Dominance Test is >50%
5. Spergularia macrotheca 10 N FAC Prevalence Index is <3.01
6. Polypogon monspeliensis 5 N FACW
Morphological Adaptations1 (Provide supporting data in Remarks or on a separate sheet) 7.
8. Problematic Hydrophytic Vegetation1 (Explain)
100 = Total Cover
1Indicators of hydric soil and wetland hydrology must be present, unless disturbed or problematic.
Woody Vine Stratum (Plot size r = 30 ft.)
1.
2.
Hydrophytic Vegetation Present? Yes No
= Total Cover
% Bare Ground in Herb Stratum 5 % Cover of Biotic Crust 0
Remarks:
Project Site: San Francisquito Creek Flood Protection Project City/County: East Palo Alto/San Mateo Sampling Point: 5
Applicant/Owner: San Francisquito Creek Joint Powers Authority State: CA Sampling Date: July 6, 2010
Investigator(s): Butterworth, Valerius Section, Township, Range: Photo No:
Landform (hillslope, terrace, etc.): Lower side slope of levee Land Surface Shape (concave, convex, planar):
Concave Slope (%): 4-5
Subregion (LRR): C Lat: Long: Datum:
Soil Map Unit Name: Botella-Urban land complex, 0 to 5 percent slopes (108) NWI classification:
Are climatic / hydrologic conditions on the site typical for this time of year? Yes No (If no, explain in Remarks.)
Are Vegetation , Soil , Or Hydrology , significantly disturbed? Are “Normal Circumstances” present? Yes No
Are Vegetation , Soil , Or Hydrology , naturally problematic? (If needed, explain any answers in Remarks.)
SUMMARY OF FINDINGS – Attach site map showing sampling point locations, transects, important features, etc.
Hydrophytic Vegetation Present? Yes No
Is the Sampling Area within a Wetland? Yes No Hydric Soil Present? Yes No
Wetland Hydrology Present? Yes No
Remarks:

US Army Corps of Engineers Arid West – Version 2.0 (modified)
SOIL Sampling Point: 5
Profile Description: (Describe to the depth needed to document the indicator or confirm the absence of indicators.)
Depth Matrix Redox Features
(inches) Color (moist) % Color (Moist) % Type1 Loc2 Texture Horizon Remarks
0-5 10YR3/2 100 cl A
5-18 Gley 1 2.5/N 100 clayey muck Bg
1Type: C= Concentration, D=Depletion, RM=Reduced Matrix, CS=Covered or Coated Sand Grains. 2Location: PL=Pore Lining, LRC=Living Root Channel, M=Matrix.
Hydric Soil Indicators: (Applicable to all LRRs, unless otherwise noted.) Indicators for Problematic Hydric Soils3:
Histosol (A1) Sandy Redox (S5) 1 cm Muck (A9) (LRR C)
Histic Epipedon (A2) Stripped Matrix (S6) 2 cm Muck (A10) (LRR B)
Black Histic (A3) Loamy Mucky Mineral (F1) Reduced Vertic (F18)
Hydrogen Sulfide (A4) Loamy Gleyed Matrix (F2) Red Parent Material (TF2)
Stratified Layers (A5) (LRR C) Depleted Matrix (F3) Other (Explain in Remarks)
1 cm Muck (A9) (LRR D) Redox Dark Surface (F6)
3Indicators of hydrophytic vegetation and wetland hydrology must be present.
Depleted Below Dark Surface (A11) Depleted Dark Surface (F7)
Thick Dark Surface (A12) Redox Depressions (F8)
Sandy Mucky Mineral (S1) Vernal Pools (F9)
Sandy Gleyed Matrix (S4)
Restrictive Layer (if present):
Hydric Soils Present? Yes X No
Type:
Depth (Inches):
Remarks:
HYDROLOGY Wetland Hydrology Indicators:
Primary Indicators (any one indicator is sufficient) Secondary Indicators (2 or more required)
Surface Water (A1) Salt Crust (B11) Water Marks (B1) (Riverine)
High Water Table (A2) Biotic Crust (B12) Sediment Deposits (B2) (Riverine)
Saturation (A3) Aquatic Invertebrates (B13) Drift Deposits (B3) (Riverine)
Water Marks (B1) (Nonriverine) Hydrogen Sulfide Odor (C1) Drainage Patterns (B10)
Sediment Deposits (B2) (Nonriverine) Oxidized Rhizospheres along Living Roots (C3) Dry-Season Water Table (C2)
Drift Deposits (B3) (Nonriverine) Presence of Reduced Iron (C4) Crayfish Burrows (C8)
Surface Soil Cracks (B6) Recent Iron Reduction in Tilled Soils (C6) Saturation Visible on Aerial Imagery (C9)
Inundation Visible on Aerial Imagery (B7) Thin Muck Surface (C7) Shallow Aquitard (D3)
Water-Stained Leaves (B9) Other (Explain in Remarks) FAC-Neutral Test (D5)
Field Observations:
Surface Water Present? Yes No Depth (inches): n/a Wetland Hydrology Present?
Yes
No
Water Table Present? Yes No Depth (inches): None to 18
Saturation Present? (includes capillary fringe)
Yes No Depth (inches): None to 18
Describe Recorded Data (stream gauge, monitoring well, aerial photos, previous inspections), if available:
Remarks:
Project Site: San Francisquito Creek Flood Protection Project

US Army Corps of Engineers Arid West – Version 2.0 (modified)
WETLAND DETERMINATION DATA FORM – Arid West Region
VEGETATION
Tree Stratum (Plot size r = 30 ft.) Absolute % Cover
Dominant Species?
Indicator Status
Dominance Test Worksheet:
1. Number of Dominant Species That Are OBL, FACW, or FAC:
0 (A) 2.
3. Total Number of Dominant Species Across All Strata:
1 (B) 4.
= Total Cover Percent of Dominant Species That Are OBL, FACW, or FAC:
0 (A/B) Sapling/Shrub Stratum (Plot size r = 5 ft.)
1. Prevalence Index Worksheet:
2. Total % Cover of: Multiply by:
3. OBL species x1 =
4. FACW species x2 =
5. FAC species x3 =
= Total Cover FACU species x4 =
Herb Stratum (Plot size r = 5 ft.) UPL species x5 =
1. Avena fatua 85 Y UPL Column Totals: (A) (B)
2. Lepidium latifolium 10 N FACW Prevalence Index = B/A =
3. Brassica nigra 5 N NL Hydrophytic Vegetation Indicators:
4. Dominance Test is >50%
5. Prevalence Index is <3.01
6.
Morphological Adaptations1 (Provide supporting data in Remarks or on a separate sheet) 7.
8. Problematic Hydrophytic Vegetation1 (Explain)
100 = Total Cover
1Indicators of hydric soil and wetland hydrology must be present, unless disturbed or problematic.
Woody Vine Stratum (Plot size r = 30 ft.)
1.
2.
Hydrophytic Vegetation Present? Yes No
= Total Cover
% Bare Ground in Herb Stratum 0 % Cover of Biotic Crust 0
Remarks:
Project Site: San Francisquito Creek Flood Protection Project City/County: East Palo Alto/San Mateo Sampling Point: 6
Applicant/Owner: San Francisquito Creek Joint Powers Authority State: CA Sampling Date: July 6, 2010
Investigator(s): Butterworth, Valerius Section, Township, Range: Photo No:
Landform (hillslope, terrace, etc.): Stream bank Land Surface Shape (concave, convex, planar):
Planar Slope (%): 45
Subregion (LRR): C Lat: Long: Datum:
Soil Map Unit Name: Botella-Urban land complex, 0 to 5 percent slopes (108) NWI classification:
Are climatic / hydrologic conditions on the site typical for this time of year? Yes No (If no, explain in Remarks.)
Are Vegetation , Soil , Or Hydrology , significantly disturbed? Are “Normal Circumstances” present? Yes No
Are Vegetation , Soil , Or Hydrology , naturally problematic? (If needed, explain any answers in Remarks.)
SUMMARY OF FINDINGS – Attach site map showing sampling point locations, transects, important features, etc.
Hydrophytic Vegetation Present? Yes No
Is the Sampling Area within a Wetland? Yes No Hydric Soil Present? Yes No
Wetland Hydrology Present? Yes No
Remarks:

US Army Corps of Engineers Arid West – Version 2.0 (modified)
SOIL Sampling Point: 6
Profile Description: (Describe to the depth needed to document the indicator or confirm the absence of indicators.)
Depth Matrix Redox Features
(inches) Color (moist) % Color (Moist) % Type1 Loc2 Texture Horizon Remarks
0-19 10YR4/3 100 fsl A
1Type: C= Concentration, D=Depletion, RM=Reduced Matrix, CS=Covered or Coated Sand Grains. 2Location: PL=Pore Lining, LRC=Living Root Channel, M=Matrix.
Hydric Soil Indicators: (Applicable to all LRRs, unless otherwise noted.) Indicators for Problematic Hydric Soils3:
Histosol (A1) Sandy Redox (S5) 1 cm Muck (A9) (LRR C)
Histic Epipedon (A2) Stripped Matrix (S6) 2 cm Muck (A10) (LRR B)
Black Histic (A3) Loamy Mucky Mineral (F1) Reduced Vertic (F18)
Hydrogen Sulfide (A4) Loamy Gleyed Matrix (F2) Red Parent Material (TF2)
Stratified Layers (A5) (LRR C) Depleted Matrix (F3) Other (Explain in Remarks)
1 cm Muck (A9) (LRR D) Redox Dark Surface (F6)
3Indicators of hydrophytic vegetation and wetland hydrology must be present.
Depleted Below Dark Surface (A11) Depleted Dark Surface (F7)
Thick Dark Surface (A12) Redox Depressions (F8)
Sandy Mucky Mineral (S1) Vernal Pools (F9)
Sandy Gleyed Matrix (S4)
Restrictive Layer (if present):
Hydric Soils Present? Yes No X
Type:
Depth (Inches):
Remarks:
HYDROLOGY Wetland Hydrology Indicators:
Primary Indicators (any one indicator is sufficient) Secondary Indicators (2 or more required)
Surface Water (A1) Salt Crust (B11) Water Marks (B1) (Riverine)
High Water Table (A2) Biotic Crust (B12) Sediment Deposits (B2) (Riverine)
Saturation (A3) Aquatic Invertebrates (B13) Drift Deposits (B3) (Riverine)
Water Marks (B1) (Nonriverine) Hydrogen Sulfide Odor (C1) Drainage Patterns (B10)
Sediment Deposits (B2) (Nonriverine) Oxidized Rhizospheres along Living Roots (C3) Dry-Season Water Table (C2)
Drift Deposits (B3) (Nonriverine) Presence of Reduced Iron (C4) Crayfish Burrows (C8)
Surface Soil Cracks (B6) Recent Iron Reduction in Tilled Soils (C6) Saturation Visible on Aerial Imagery (C9)
Inundation Visible on Aerial Imagery (B7) Thin Muck Surface (C7) Shallow Aquitard (D3)
Water-Stained Leaves (B9) Other (Explain in Remarks) FAC-Neutral Test (D5)
Field Observations:
Surface Water Present? Yes No Depth (inches): n/a Wetland Hydrology Present?
Yes
No
Water Table Present? Yes No Depth (inches): None to 19
Saturation Present? (includes capillary fringe)
Yes No Depth (inches): None to 19
Describe Recorded Data (stream gauge, monitoring well, aerial photos, previous inspections), if available:
Remarks:
Project Site: San Francisquito Creek Flood Protection Project

US Army Corps of Engineers Arid West – Version 2.0 (modified)
WETLAND DETERMINATION DATA FORM – Arid West Region
VEGETATION
Tree Stratum (Plot size r = 30 ft.) Absolute % Cover
Dominant Species?
Indicator Status
Dominance Test Worksheet:
1. Number of Dominant Species That Are OBL, FACW, or FAC:
1 (A) 2.
3. Total Number of Dominant Species Across All Strata:
1 (B) 4.
= Total Cover Percent of Dominant Species That Are OBL, FACW, or FAC:
100 (A/B) Sapling/Shrub Stratum (Plot size r = 5 ft.)
1. Prevalence Index Worksheet:
2. Total % Cover of: Multiply by:
3. OBL species x1 =
4. FACW species x2 =
5. FAC species x3 =
= Total Cover FACU species x4 =
Herb Stratum (Plot size r = 5 ft.) UPL species x5 =
1. Ruppia maritima 80 Y OBL Column Totals: (A) (B)
2. Prevalence Index = B/A =
3. Hydrophytic Vegetation Indicators:
4. X Dominance Test is >50%
5. Prevalence Index is <3.01
6.
Morphological Adaptations1 (Provide supporting data in Remarks or on a separate sheet) 7.
8. Problematic Hydrophytic Vegetation1 (Explain)
80 = Total Cover
1Indicators of hydric soil and wetland hydrology must be present, unless disturbed or problematic.
Woody Vine Stratum (Plot size r = 30 ft.)
1.
2.
Hydrophytic Vegetation Present? Yes No
= Total Cover
% Bare Ground in Herb Stratum 20 % Cover of Biotic Crust 0
Remarks: Pickleweed and rabbitsfoot grass present around edges of depression.
Project Site: San Francisquito Creek Flood Protection Project City/County: East Palo Alto/San Mateo Sampling Point: 7
Applicant/Owner: San Francisquito Creek Joint Powers Authority State: CA Sampling Date: July 6, 2010
Investigator(s): Butterworth, Valerius Section, Township, Range: Photo No: 1
Landform (hillslope, terrace, etc.): Diked tidal marsh Land Surface Shape (concave, convex, planar):
Concave Slope (%): 0
Subregion (LRR): C Lat: Long: Datum:
Soil Map Unit Name: Novato clay, 0 to 1 percent slopes (117) NWI classification:
Are climatic / hydrologic conditions on the site typical for this time of year? Yes No (If no, explain in Remarks.)
Are Vegetation , Soil , Or Hydrology , significantly disturbed? Are “Normal Circumstances” present? Yes No
Are Vegetation , Soil , Or Hydrology , naturally problematic? (If needed, explain any answers in Remarks.)
SUMMARY OF FINDINGS – Attach site map showing sampling point locations, transects, important features, etc.
Hydrophytic Vegetation Present? Yes No
Is the Sampling Area within a Wetland? Yes No Hydric Soil Present? Yes No
Wetland Hydrology Present? Yes No
Remarks:
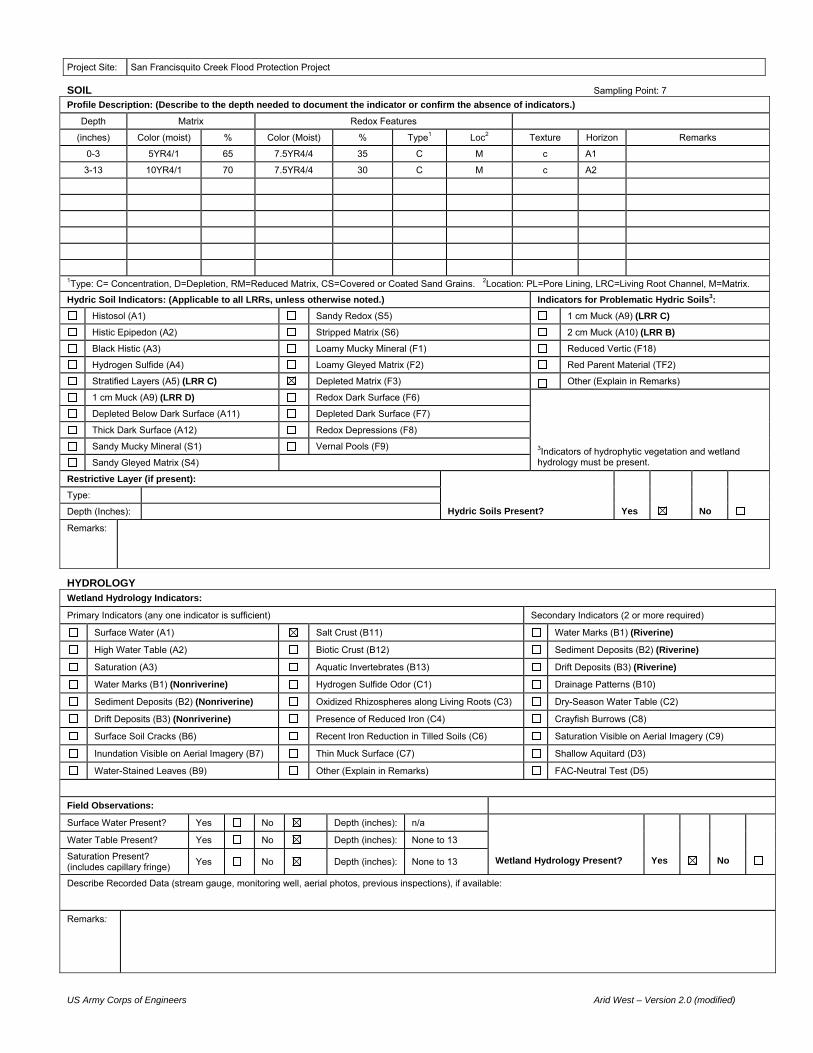
US Army Corps of Engineers Arid West – Version 2.0 (modified)
SOIL Sampling Point: 7
Profile Description: (Describe to the depth needed to document the indicator or confirm the absence of indicators.)
Depth Matrix Redox Features
(inches) Color (moist) % Color (Moist) % Type1 Loc2 Texture Horizon Remarks
0-3 5YR4/1 65 7.5YR4/4 35 C M c A1
3-13 10YR4/1 70 7.5YR4/4 30 C M c A2
1Type: C= Concentration, D=Depletion, RM=Reduced Matrix, CS=Covered or Coated Sand Grains. 2Location: PL=Pore Lining, LRC=Living Root Channel, M=Matrix.
Hydric Soil Indicators: (Applicable to all LRRs, unless otherwise noted.) Indicators for Problematic Hydric Soils3:
Histosol (A1) Sandy Redox (S5) 1 cm Muck (A9) (LRR C)
Histic Epipedon (A2) Stripped Matrix (S6) 2 cm Muck (A10) (LRR B)
Black Histic (A3) Loamy Mucky Mineral (F1) Reduced Vertic (F18)
Hydrogen Sulfide (A4) Loamy Gleyed Matrix (F2) Red Parent Material (TF2)
Stratified Layers (A5) (LRR C) Depleted Matrix (F3) Other (Explain in Remarks)
1 cm Muck (A9) (LRR D) Redox Dark Surface (F6)
3Indicators of hydrophytic vegetation and wetland hydrology must be present.
Depleted Below Dark Surface (A11) Depleted Dark Surface (F7)
Thick Dark Surface (A12) Redox Depressions (F8)
Sandy Mucky Mineral (S1) Vernal Pools (F9)
Sandy Gleyed Matrix (S4)
Restrictive Layer (if present):
Hydric Soils Present? Yes No
Type:
Depth (Inches):
Remarks:
HYDROLOGY Wetland Hydrology Indicators:
Primary Indicators (any one indicator is sufficient) Secondary Indicators (2 or more required)
Surface Water (A1) Salt Crust (B11) Water Marks (B1) (Riverine)
High Water Table (A2) Biotic Crust (B12) Sediment Deposits (B2) (Riverine)
Saturation (A3) Aquatic Invertebrates (B13) Drift Deposits (B3) (Riverine)
Water Marks (B1) (Nonriverine) Hydrogen Sulfide Odor (C1) Drainage Patterns (B10)
Sediment Deposits (B2) (Nonriverine) Oxidized Rhizospheres along Living Roots (C3) Dry-Season Water Table (C2)
Drift Deposits (B3) (Nonriverine) Presence of Reduced Iron (C4) Crayfish Burrows (C8)
Surface Soil Cracks (B6) Recent Iron Reduction in Tilled Soils (C6) Saturation Visible on Aerial Imagery (C9)
Inundation Visible on Aerial Imagery (B7) Thin Muck Surface (C7) Shallow Aquitard (D3)
Water-Stained Leaves (B9) Other (Explain in Remarks) FAC-Neutral Test (D5)
Field Observations:
Surface Water Present? Yes No Depth (inches): n/a Wetland Hydrology Present?
Yes
No
Water Table Present? Yes No Depth (inches): None to 13
Saturation Present? (includes capillary fringe)
Yes No Depth (inches): None to 13
Describe Recorded Data (stream gauge, monitoring well, aerial photos, previous inspections), if available:
Remarks:
Project Site: San Francisquito Creek Flood Protection Project

US Army Corps of Engineers Arid West – Version 2.0 (modified)
WETLAND DETERMINATION DATA FORM – Arid West Region
VEGETATION
Tree Stratum (Plot size r = 30 ft.) Absolute % Cover
Dominant Species?
Indicator Status
Dominance Test Worksheet:
5. Number of Dominant Species That Are OBL, FACW, or FAC:
0 (A) 6.
7. Total Number of Dominant Species Across All Strata:
1 (B) 8.
= Total Cover Percent of Dominant Species That Are OBL, FACW, or FAC:
0 (A/B) Sapling/Shrub Stratum (Plot size r = 5 ft.)
6. Prevalence Index Worksheet:
7. Total % Cover of: Multiply by:
8. OBL species x1 =
9. FACW species x2 =
10. FAC species x3 =
= Total Cover FACU species x4 =
Herb Stratum (Plot size r = 5 ft.) UPL species x5 =
9. Avena fatua 35 Y UPL Column Totals: (A) (B)
10. Picris echioides 5 N FAC Prevalence Index = B/A =
11. Malva sp. 5 N NL Hydrophytic Vegetation Indicators:
12. Lolium multiflorum 5 N FAC Dominance Test is >50%
13. Prevalence Index is <3.01
14.
Morphological Adaptations1 (Provide supporting data in Remarks or on a separate sheet) 15.
16. Problematic Hydrophytic Vegetation1 (Explain)
50 = Total Cover
1Indicators of hydric soil and wetland hydrology must be present, unless disturbed or problematic.
Woody Vine Stratum (Plot size r = 30 ft.)
3.
4.
Hydrophytic Vegetation Present? Yes No
= Total Cover
% Bare Ground in Herb Stratum 50 % Cover of Biotic Crust 0
Remarks: Part of levee slope was burned = bare soil.
Project Site: San Francisquito Creek Flood Protection Project City/County: East Palo Alto/San Mateo Sampling Point: 8
Applicant/Owner: San Francisquito Creek Joint Powers Authority State: CA Sampling Date: July 6, 2010
Investigator(s): Butterworth, Valerius Section, Township, Range: Photo No:
Landform (hillslope, terrace, etc.): Levee slope Land Surface Shape (concave, convex, planar):
Planar Slope (%): 90
Subregion (LRR): C Lat: Long: Datum:
Soil Map Unit Name: Novato clay, 0 to 1 percent slopes (117) NWI classification:
Are climatic / hydrologic conditions on the site typical for this time of year? Yes No (If no, explain in Remarks.)
Are Vegetation , Soil , Or Hydrology , significantly disturbed? Are “Normal Circumstances” present? Yes No
Are Vegetation , Soil , Or Hydrology , naturally problematic? (If needed, explain any answers in Remarks.)
SUMMARY OF FINDINGS – Attach site map showing sampling point locations, transects, important features, etc.
Hydrophytic Vegetation Present? Yes No
Is the Sampling Area within a Wetland? Yes No Hydric Soil Present? Yes No
Wetland Hydrology Present? Yes No
Remarks:

US Army Corps of Engineers Arid West – Version 2.0 (modified)
SOIL Sampling Point: 8
Profile Description: (Describe to the depth needed to document the indicator or confirm the absence of indicators.)
Depth Matrix Redox Features
(inches) Color (moist) % Color (Moist) % Type1 Loc2 Texture Horizon Remarks
0-18 10YR3/1 100 grcl Fill
1Type: C= Concentration, D=Depletion, RM=Reduced Matrix, CS=Covered or Coated Sand Grains. 2Location: PL=Pore Lining, LRC=Living Root Channel, M=Matrix.
Hydric Soil Indicators: (Applicable to all LRRs, unless otherwise noted.) Indicators for Problematic Hydric Soils3:
Histosol (A1) Sandy Redox (S5) 1 cm Muck (A9) (LRR C)
Histic Epipedon (A2) Stripped Matrix (S6) 2 cm Muck (A10) (LRR B)
Black Histic (A3) Loamy Mucky Mineral (F1) Reduced Vertic (F18)
Hydrogen Sulfide (A4) Loamy Gleyed Matrix (F2) Red Parent Material (TF2)
Stratified Layers (A5) (LRR C) Depleted Matrix (F3) Other (Explain in Remarks)
1 cm Muck (A9) (LRR D) Redox Dark Surface (F6)
3Indicators of hydrophytic vegetation and wetland hydrology must be present.
Depleted Below Dark Surface (A11) Depleted Dark Surface (F7)
Thick Dark Surface (A12) Redox Depressions (F8)
Sandy Mucky Mineral (S1) Vernal Pools (F9)
Sandy Gleyed Matrix (S4)
Restrictive Layer (if present):
Hydric Soils Present? Yes No
Type:
Depth (Inches):
Remarks:
HYDROLOGY Wetland Hydrology Indicators:
Primary Indicators (any one indicator is sufficient) Secondary Indicators (2 or more required)
Surface Water (A1) Salt Crust (B11) Water Marks (B1) (Riverine)
High Water Table (A2) Biotic Crust (B12) Sediment Deposits (B2) (Riverine)
Saturation (A3) Aquatic Invertebrates (B13) Drift Deposits (B3) (Riverine)
Water Marks (B1) (Nonriverine) Hydrogen Sulfide Odor (C1) Drainage Patterns (B10)
Sediment Deposits (B2) (Nonriverine) Oxidized Rhizospheres along Living Roots (C3) Dry-Season Water Table (C2)
Drift Deposits (B3) (Nonriverine) Presence of Reduced Iron (C4) Crayfish Burrows (C8)
Surface Soil Cracks (B6) Recent Iron Reduction in Tilled Soils (C6) Saturation Visible on Aerial Imagery (C9)
Inundation Visible on Aerial Imagery (B7) Thin Muck Surface (C7) Shallow Aquitard (D3)
Water-Stained Leaves (B9) Other (Explain in Remarks) FAC-Neutral Test (D5)
Field Observations:
Surface Water Present? Yes No Depth (inches): n/a Wetland Hydrology Present?
Yes
No
Water Table Present? Yes No Depth (inches): None to 18
Saturation Present? (includes capillary fringe)
Yes No Depth (inches): None to 18
Describe Recorded Data (stream gauge, monitoring well, aerial photos, previous inspections), if available:
Remarks:
Project Site: San Francisquito Creek Flood Protection Project
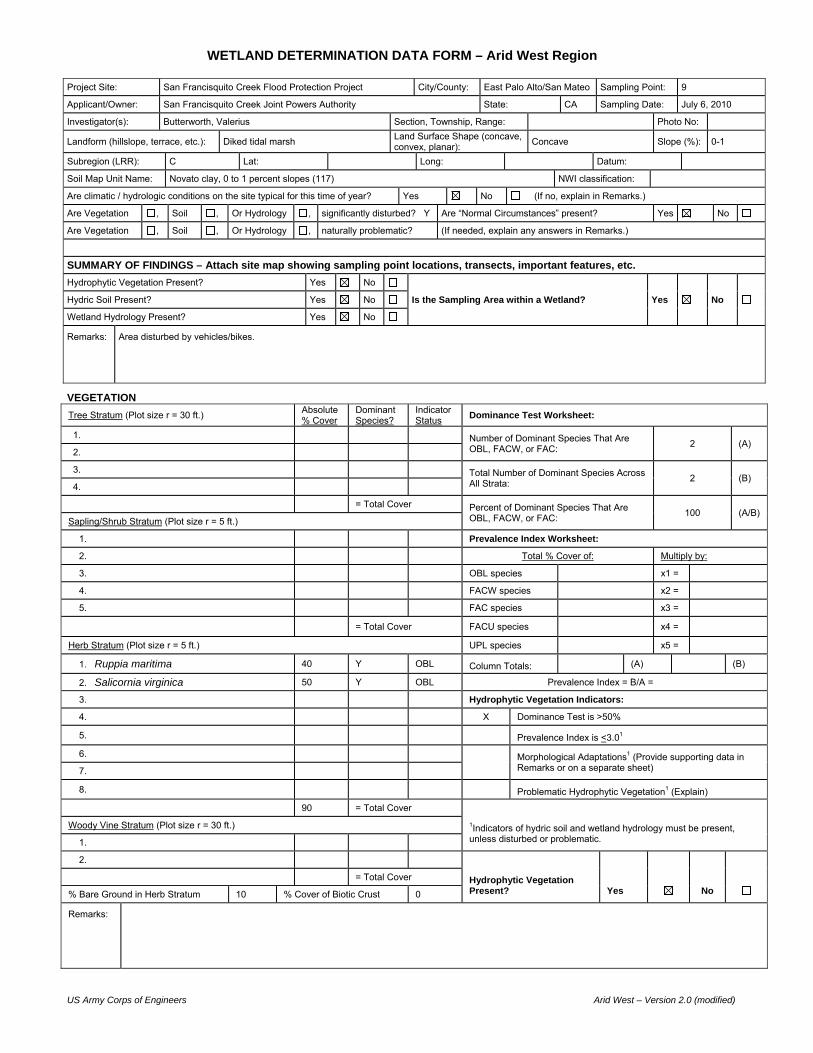
US Army Corps of Engineers Arid West – Version 2.0 (modified)
WETLAND DETERMINATION DATA FORM – Arid West Region
VEGETATION
Tree Stratum (Plot size r = 30 ft.) Absolute % Cover
Dominant Species?
Indicator Status
Dominance Test Worksheet:
1. Number of Dominant Species That Are OBL, FACW, or FAC:
2 (A) 2.
3. Total Number of Dominant Species Across All Strata:
2 (B) 4.
= Total Cover Percent of Dominant Species That Are OBL, FACW, or FAC:
100 (A/B) Sapling/Shrub Stratum (Plot size r = 5 ft.)
1. Prevalence Index Worksheet:
2. Total % Cover of: Multiply by:
3. OBL species x1 =
4. FACW species x2 =
5. FAC species x3 =
= Total Cover FACU species x4 =
Herb Stratum (Plot size r = 5 ft.) UPL species x5 =
1. Ruppia maritima 40 Y OBL Column Totals: (A) (B)
2. Salicornia virginica 50 Y OBL Prevalence Index = B/A =
3. Hydrophytic Vegetation Indicators:
4. X Dominance Test is >50%
5. Prevalence Index is <3.01
6.
Morphological Adaptations1 (Provide supporting data in Remarks or on a separate sheet) 7.
8. Problematic Hydrophytic Vegetation1 (Explain)
90 = Total Cover
1Indicators of hydric soil and wetland hydrology must be present, unless disturbed or problematic.
Woody Vine Stratum (Plot size r = 30 ft.)
1.
2.
Hydrophytic Vegetation Present? Yes No
= Total Cover
% Bare Ground in Herb Stratum 10 % Cover of Biotic Crust 0
Remarks:
Project Site: San Francisquito Creek Flood Protection Project City/County: East Palo Alto/San Mateo Sampling Point: 9
Applicant/Owner: San Francisquito Creek Joint Powers Authority State: CA Sampling Date: July 6, 2010
Investigator(s): Butterworth, Valerius Section, Township, Range: Photo No:
Landform (hillslope, terrace, etc.): Diked tidal marsh Land Surface Shape (concave, convex, planar):
Concave Slope (%): 0-1
Subregion (LRR): C Lat: Long: Datum:
Soil Map Unit Name: Novato clay, 0 to 1 percent slopes (117) NWI classification:
Are climatic / hydrologic conditions on the site typical for this time of year? Yes No (If no, explain in Remarks.)
Are Vegetation , Soil , Or Hydrology , significantly disturbed? Y Are “Normal Circumstances” present? Yes No
Are Vegetation , Soil , Or Hydrology , naturally problematic? (If needed, explain any answers in Remarks.)
SUMMARY OF FINDINGS – Attach site map showing sampling point locations, transects, important features, etc.
Hydrophytic Vegetation Present? Yes No
Is the Sampling Area within a Wetland? Yes No Hydric Soil Present? Yes No
Wetland Hydrology Present? Yes No
Remarks:
Area disturbed by vehicles/bikes.

US Army Corps of Engineers Arid West – Version 2.0 (modified)
SOIL Sampling Point: 9
Profile Description: (Describe to the depth needed to document the indicator or confirm the absence of indicators.)
Depth Matrix Redox Features
(inches) Color (moist) % Color (Moist) % Type1 Loc2 Texture Horizon Remarks
0-4 10YR4/2 100 cl Fill Disturbed
4-18 10YR4/1 80 7.5YR4/4 20 C M c Ab
1Type: C= Concentration, D=Depletion, RM=Reduced Matrix, CS=Covered or Coated Sand Grains. 2Location: PL=Pore Lining, LRC=Living Root Channel, M=Matrix.
Hydric Soil Indicators: (Applicable to all LRRs, unless otherwise noted.) Indicators for Problematic Hydric Soils3:
Histosol (A1) Sandy Redox (S5) 1 cm Muck (A9) (LRR C)
Histic Epipedon (A2) Stripped Matrix (S6) 2 cm Muck (A10) (LRR B)
Black Histic (A3) Loamy Mucky Mineral (F1) Reduced Vertic (F18)
Hydrogen Sulfide (A4) Loamy Gleyed Matrix (F2) Red Parent Material (TF2)
Stratified Layers (A5) (LRR C) Depleted Matrix (F3) Other (Explain in Remarks)
1 cm Muck (A9) (LRR D) Redox Dark Surface (F6)
3Indicators of hydrophytic vegetation and wetland hydrology must be present.
Depleted Below Dark Surface (A11) Depleted Dark Surface (F7)
Thick Dark Surface (A12) Redox Depressions (F8)
Sandy Mucky Mineral (S1) Vernal Pools (F9)
Sandy Gleyed Matrix (S4)
Restrictive Layer (if present):
Hydric Soils Present? Yes No
Type:
Depth (Inches):
Remarks:
HYDROLOGY Wetland Hydrology Indicators:
Primary Indicators (any one indicator is sufficient) Secondary Indicators (2 or more required)
Surface Water (A1) Salt Crust (B11) Water Marks (B1) (Riverine)
High Water Table (A2) Biotic Crust (B12) Sediment Deposits (B2) (Riverine)
Saturation (A3) Aquatic Invertebrates (B13) Drift Deposits (B3) (Riverine)
Water Marks (B1) (Nonriverine) Hydrogen Sulfide Odor (C1) Drainage Patterns (B10)
Sediment Deposits (B2) (Nonriverine) Oxidized Rhizospheres along Living Roots (C3) Dry-Season Water Table (C2)
Drift Deposits (B3) (Nonriverine) Presence of Reduced Iron (C4) Crayfish Burrows (C8)
Surface Soil Cracks (B6) Recent Iron Reduction in Tilled Soils (C6) Saturation Visible on Aerial Imagery (C9)
Inundation Visible on Aerial Imagery (B7) Thin Muck Surface (C7) Shallow Aquitard (D3)
Water-Stained Leaves (B9) Other (Explain in Remarks) FAC-Neutral Test (D5)
Field Observations:
Surface Water Present? Yes No Depth (inches): n/a Wetland Hydrology Present?
Yes
No
Water Table Present? Yes No Depth (inches): None to 18
Saturation Present? (includes capillary fringe)
Yes No Depth (inches): None to 18
Describe Recorded Data (stream gauge, monitoring well, aerial photos, previous inspections), if available:
Remarks:
Project Site: San Francisquito Creek Flood Protection Project

US Army Corps of Engineers Arid West – Version 2.0 (modified)
WETLAND DETERMINATION DATA FORM – Arid West Region
VEGETATION
Tree Stratum (Plot size r = 30 ft.) Absolute % Cover
Dominant Species?
Indicator Status
Dominance Test Worksheet:
1. Number of Dominant Species That Are OBL, FACW, or FAC:
1 (A) 2.
3. Total Number of Dominant Species Across All Strata:
2 (B) 4.
= Total Cover Percent of Dominant Species That Are OBL, FACW, or FAC:
50 (A/B) Sapling/Shrub Stratum (Plot size r = 5 ft.)
1. Prevalence Index Worksheet:
2. Total % Cover of: Multiply by:
3. OBL species x1 =
4. FACW species x2 =
5. FAC species x3 =
= Total Cover FACU species x4 =
Herb Stratum (Plot size r = 5 ft.) UPL species x5 =
1. Avena fatua 60 Y UPL Column Totals: (A) (B)
2. Rumex sp. 20 Y FACW Prevalence Index = B/A =
3. Malva sp. 10 N NL Hydrophytic Vegetation Indicators:
4. Picris echioides 5 N FAC Dominance Test is >50%
5. Lactuca serriola 5 N FAC Prevalence Index is <3.01
6.
Morphological Adaptations1 (Provide supporting data in Remarks or on a separate sheet) 7.
8. Problematic Hydrophytic Vegetation1 (Explain)
100 = Total Cover
1Indicators of hydric soil and wetland hydrology must be present, unless disturbed or problematic.
Woody Vine Stratum (Plot size r = 30 ft.)
1.
2.
Hydrophytic Vegetation Present? Yes No
= Total Cover
% Bare Ground in Herb Stratum 5 % Cover of Biotic Crust 0
Remarks:
Project Site: San Francisquito Creek Flood Protection Project City/County: East Palo Alto/San Mateo Sampling Point: 10
Applicant/Owner: San Francisquito Creek Joint Powers Authority State: CA Sampling Date: July 6, 2010
Investigator(s): Butterworth, Valerius Section, Township, Range: Photo No:
Landform (hillslope, terrace, etc.): Fill mound Land Surface Shape (concave, convex, planar):
Planar Slope (%): 20
Subregion (LRR): C Lat: Long: Datum:
Soil Map Unit Name: Novato clay, 0 to 1 percent slopes (117) NWI classification:
Are climatic / hydrologic conditions on the site typical for this time of year? Yes No (If no, explain in Remarks.)
Are Vegetation , Soil , Or Hydrology , significantly disturbed? Are “Normal Circumstances” present? Yes No
Are Vegetation , Soil , Or Hydrology , naturally problematic? (If needed, explain any answers in Remarks.)
SUMMARY OF FINDINGS – Attach site map showing sampling point locations, transects, important features, etc.
Hydrophytic Vegetation Present? Yes No
Is the Sampling Area within a Wetland? Yes No Hydric Soil Present? Yes No
Wetland Hydrology Present? Yes No
Remarks:

US Army Corps of Engineers Arid West – Version 2.0 (modified)
SOIL Sampling Point: 10
Profile Description: (Describe to the depth needed to document the indicator or confirm the absence of indicators.)
Depth Matrix Redox Features
(inches) Color (moist) % Color (Moist) % Type1 Loc2 Texture Horizon Remarks
0-19 10YR4/4 100 cl Fill
1Type: C= Concentration, D=Depletion, RM=Reduced Matrix, CS=Covered or Coated Sand Grains. 2Location: PL=Pore Lining, LRC=Living Root Channel, M=Matrix.
Hydric Soil Indicators: (Applicable to all LRRs, unless otherwise noted.) Indicators for Problematic Hydric Soils3:
Histosol (A1) Sandy Redox (S5) 1 cm Muck (A9) (LRR C)
Histic Epipedon (A2) Stripped Matrix (S6) 2 cm Muck (A10) (LRR B)
Black Histic (A3) Loamy Mucky Mineral (F1) Reduced Vertic (F18)
Hydrogen Sulfide (A4) Loamy Gleyed Matrix (F2) Red Parent Material (TF2)
Stratified Layers (A5) (LRR C) Depleted Matrix (F3) Other (Explain in Remarks)
1 cm Muck (A9) (LRR D) Redox Dark Surface (F6)
3Indicators of hydrophytic vegetation and wetland hydrology must be present.
Depleted Below Dark Surface (A11) Depleted Dark Surface (F7)
Thick Dark Surface (A12) Redox Depressions (F8)
Sandy Mucky Mineral (S1) Vernal Pools (F9)
Sandy Gleyed Matrix (S4)
Restrictive Layer (if present):
Hydric Soils Present? Yes No
Type:
Depth (Inches):
Remarks:
HYDROLOGY Wetland Hydrology Indicators:
Primary Indicators (any one indicator is sufficient) Secondary Indicators (2 or more required)
Surface Water (A1) Salt Crust (B11) Water Marks (B1) (Riverine)
High Water Table (A2) Biotic Crust (B12) Sediment Deposits (B2) (Riverine)
Saturation (A3) Aquatic Invertebrates (B13) Drift Deposits (B3) (Riverine)
Water Marks (B1) (Nonriverine) Hydrogen Sulfide Odor (C1) Drainage Patterns (B10)
Sediment Deposits (B2) (Nonriverine) Oxidized Rhizospheres along Living Roots (C3) Dry-Season Water Table (C2)
Drift Deposits (B3) (Nonriverine) Presence of Reduced Iron (C4) Crayfish Burrows (C8)
Surface Soil Cracks (B6) Recent Iron Reduction in Tilled Soils (C6) Saturation Visible on Aerial Imagery (C9)
Inundation Visible on Aerial Imagery (B7) Thin Muck Surface (C7) Shallow Aquitard (D3)
Water-Stained Leaves (B9) Other (Explain in Remarks) FAC-Neutral Test (D5)
Field Observations:
Surface Water Present? Yes No Depth (inches): n/a Wetland Hydrology Present?
Yes
No
Water Table Present? Yes No Depth (inches): None to 19
Saturation Present? (includes capillary fringe)
Yes No Depth (inches): None to 19
Describe Recorded Data (stream gauge, monitoring well, aerial photos, previous inspections), if available:
Remarks:
Project Site: San Francisquito Creek Flood Protection Project
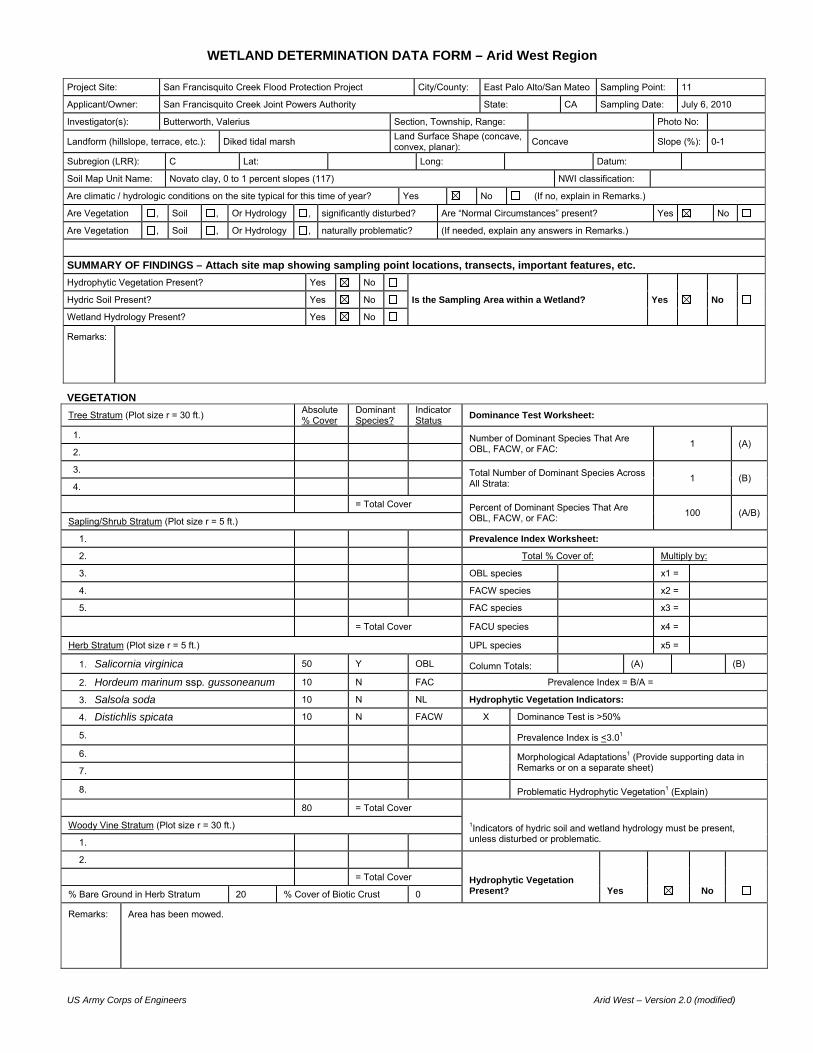
US Army Corps of Engineers Arid West – Version 2.0 (modified)
WETLAND DETERMINATION DATA FORM – Arid West Region
VEGETATION
Tree Stratum (Plot size r = 30 ft.) Absolute % Cover
Dominant Species?
Indicator Status
Dominance Test Worksheet:
1. Number of Dominant Species That Are OBL, FACW, or FAC:
1 (A) 2.
3. Total Number of Dominant Species Across All Strata:
1 (B) 4.
= Total Cover Percent of Dominant Species That Are OBL, FACW, or FAC:
100 (A/B) Sapling/Shrub Stratum (Plot size r = 5 ft.)
1. Prevalence Index Worksheet:
2. Total % Cover of: Multiply by:
3. OBL species x1 =
4. FACW species x2 =
5. FAC species x3 =
= Total Cover FACU species x4 =
Herb Stratum (Plot size r = 5 ft.) UPL species x5 =
1. Salicornia virginica 50 Y OBL Column Totals: (A) (B)
2. Hordeum marinum ssp. gussoneanum 10 N FAC Prevalence Index = B/A =
3. Salsola soda 10 N NL Hydrophytic Vegetation Indicators:
4. Distichlis spicata 10 N FACW X Dominance Test is >50%
5. Prevalence Index is <3.01
6.
Morphological Adaptations1 (Provide supporting data in Remarks or on a separate sheet) 7.
8. Problematic Hydrophytic Vegetation1 (Explain)
80 = Total Cover
1Indicators of hydric soil and wetland hydrology must be present, unless disturbed or problematic.
Woody Vine Stratum (Plot size r = 30 ft.)
1.
2.
Hydrophytic Vegetation Present? Yes No
= Total Cover
% Bare Ground in Herb Stratum 20 % Cover of Biotic Crust 0
Remarks: Area has been mowed.
Project Site: San Francisquito Creek Flood Protection Project City/County: East Palo Alto/San Mateo Sampling Point: 11
Applicant/Owner: San Francisquito Creek Joint Powers Authority State: CA Sampling Date: July 6, 2010
Investigator(s): Butterworth, Valerius Section, Township, Range: Photo No:
Landform (hillslope, terrace, etc.): Diked tidal marsh Land Surface Shape (concave, convex, planar):
Concave Slope (%): 0-1
Subregion (LRR): C Lat: Long: Datum:
Soil Map Unit Name: Novato clay, 0 to 1 percent slopes (117) NWI classification:
Are climatic / hydrologic conditions on the site typical for this time of year? Yes No (If no, explain in Remarks.)
Are Vegetation , Soil , Or Hydrology , significantly disturbed? Are “Normal Circumstances” present? Yes No
Are Vegetation , Soil , Or Hydrology , naturally problematic? (If needed, explain any answers in Remarks.)
SUMMARY OF FINDINGS – Attach site map showing sampling point locations, transects, important features, etc.
Hydrophytic Vegetation Present? Yes No
Is the Sampling Area within a Wetland? Yes No Hydric Soil Present? Yes No
Wetland Hydrology Present? Yes No
Remarks:
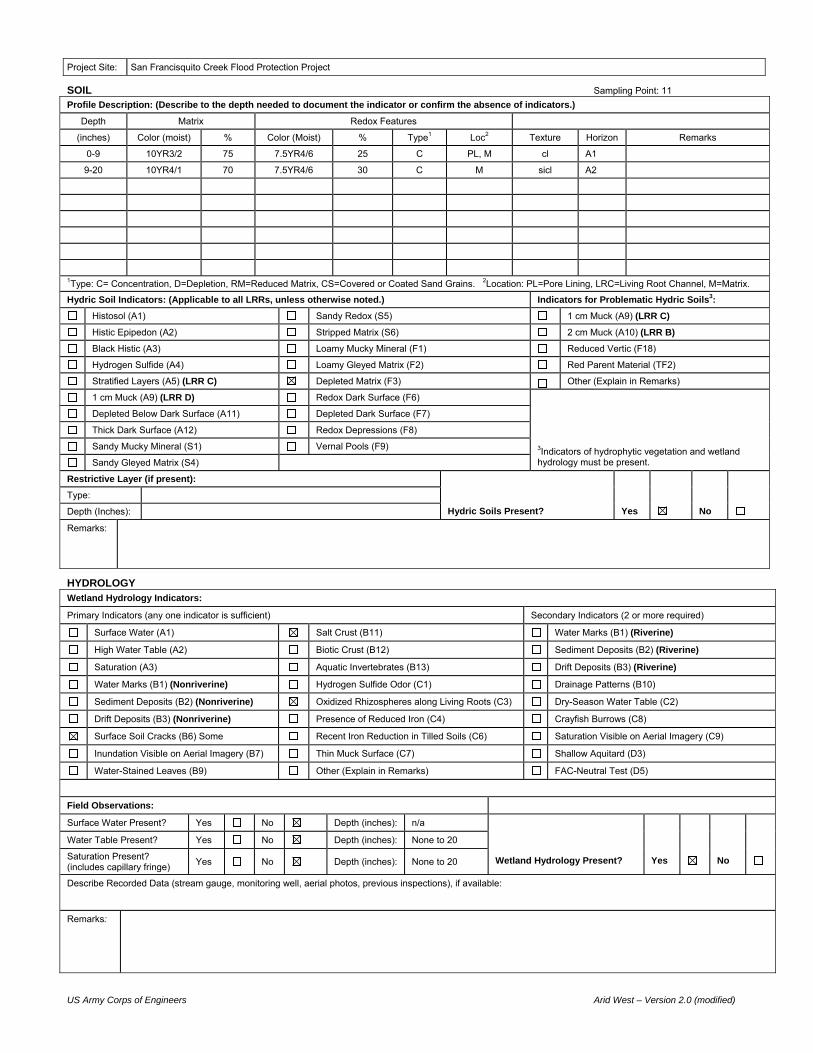
US Army Corps of Engineers Arid West – Version 2.0 (modified)
SOIL Sampling Point: 11
Profile Description: (Describe to the depth needed to document the indicator or confirm the absence of indicators.)
Depth Matrix Redox Features
(inches) Color (moist) % Color (Moist) % Type1 Loc2 Texture Horizon Remarks
0-9 10YR3/2 75 7.5YR4/6 25 C PL, M cl A1
9-20 10YR4/1 70 7.5YR4/6 30 C M sicl A2
1Type: C= Concentration, D=Depletion, RM=Reduced Matrix, CS=Covered or Coated Sand Grains. 2Location: PL=Pore Lining, LRC=Living Root Channel, M=Matrix.
Hydric Soil Indicators: (Applicable to all LRRs, unless otherwise noted.) Indicators for Problematic Hydric Soils3:
Histosol (A1) Sandy Redox (S5) 1 cm Muck (A9) (LRR C)
Histic Epipedon (A2) Stripped Matrix (S6) 2 cm Muck (A10) (LRR B)
Black Histic (A3) Loamy Mucky Mineral (F1) Reduced Vertic (F18)
Hydrogen Sulfide (A4) Loamy Gleyed Matrix (F2) Red Parent Material (TF2)
Stratified Layers (A5) (LRR C) Depleted Matrix (F3) Other (Explain in Remarks)
1 cm Muck (A9) (LRR D) Redox Dark Surface (F6)
3Indicators of hydrophytic vegetation and wetland hydrology must be present.
Depleted Below Dark Surface (A11) Depleted Dark Surface (F7)
Thick Dark Surface (A12) Redox Depressions (F8)
Sandy Mucky Mineral (S1) Vernal Pools (F9)
Sandy Gleyed Matrix (S4)
Restrictive Layer (if present):
Hydric Soils Present? Yes No
Type:
Depth (Inches):
Remarks:
HYDROLOGY Wetland Hydrology Indicators:
Primary Indicators (any one indicator is sufficient) Secondary Indicators (2 or more required)
Surface Water (A1) Salt Crust (B11) Water Marks (B1) (Riverine)
High Water Table (A2) Biotic Crust (B12) Sediment Deposits (B2) (Riverine)
Saturation (A3) Aquatic Invertebrates (B13) Drift Deposits (B3) (Riverine)
Water Marks (B1) (Nonriverine) Hydrogen Sulfide Odor (C1) Drainage Patterns (B10)
Sediment Deposits (B2) (Nonriverine) Oxidized Rhizospheres along Living Roots (C3) Dry-Season Water Table (C2)
Drift Deposits (B3) (Nonriverine) Presence of Reduced Iron (C4) Crayfish Burrows (C8)
Surface Soil Cracks (B6) Some Recent Iron Reduction in Tilled Soils (C6) Saturation Visible on Aerial Imagery (C9)
Inundation Visible on Aerial Imagery (B7) Thin Muck Surface (C7) Shallow Aquitard (D3)
Water-Stained Leaves (B9) Other (Explain in Remarks) FAC-Neutral Test (D5)
Field Observations:
Surface Water Present? Yes No Depth (inches): n/a Wetland Hydrology Present?
Yes
No
Water Table Present? Yes No Depth (inches): None to 20
Saturation Present? (includes capillary fringe)
Yes No Depth (inches): None to 20
Describe Recorded Data (stream gauge, monitoring well, aerial photos, previous inspections), if available:
Remarks:
Project Site: San Francisquito Creek Flood Protection Project

US Army Corps of Engineers Arid West – Version 2.0 (modified)
WETLAND DETERMINATION DATA FORM – Arid West Region
VEGETATION
Tree Stratum (Plot size r = 30 ft.) Absolute % Cover
Dominant Species?
Indicator Status
Dominance Test Worksheet:
1. Number of Dominant Species That Are OBL, FACW, or FAC:
0 (A) 2.
3. Total Number of Dominant Species Across All Strata:
1 (B) 4.
= Total Cover Percent of Dominant Species That Are OBL, FACW, or FAC:
100 (A/B) Sapling/Shrub Stratum (Plot size r = 5 ft.)
1. Prevalence Index Worksheet:
2. Total % Cover of: Multiply by:
3. OBL species x1 =
4. FACW species x2 =
5. FAC species x3 =
= Total Cover FACU species x4 =
Herb Stratum (Plot size r = 5 ft.) UPL species x5 =
1. Avena fatua 95 Y UPL Column Totals: (A) (B)
2. Distichlis spicata 5 N FACW Prevalence Index = B/A =
3. Hydrophytic Vegetation Indicators:
4. Dominance Test is >50%
5. Prevalence Index is <3.01
6.
Morphological Adaptations1 (Provide supporting data in Remarks or on a separate sheet) 7.
8. Problematic Hydrophytic Vegetation1 (Explain)
100 = Total Cover
1Indicators of hydric soil and wetland hydrology must be present, unless disturbed or problematic.
Woody Vine Stratum (Plot size r = 30 ft.)
1.
2.
Hydrophytic Vegetation Present? Yes No
= Total Cover
% Bare Ground in Herb Stratum 0 % Cover of Biotic Crust 0
Remarks:
Project Site: San Francisquito Creek Flood Protection Project City/County: East Palo Alto/San Mateo Sampling Point: 12
Applicant/Owner: San Francisquito Creek Joint Powers Authority State: CA Sampling Date: July 6, 2010
Investigator(s): Butterworth, Valerius Section, Township, Range: Photo No:
Landform (hillslope, terrace, etc.): Toe of levee Land Surface Shape (concave, convex, planar):
Planar Slope (%): 10
Subregion (LRR): C Lat: Long: Datum:
Soil Map Unit Name: Novato clay, 0 to 1 percent slopes (117) NWI classification:
Are climatic / hydrologic conditions on the site typical for this time of year? Yes No (If no, explain in Remarks.)
Are Vegetation , Soil , Or Hydrology , significantly disturbed? Are “Normal Circumstances” present? Yes No
Are Vegetation , Soil , Or Hydrology , naturally problematic? (If needed, explain any answers in Remarks.)
SUMMARY OF FINDINGS – Attach site map showing sampling point locations, transects, important features, etc.
Hydrophytic Vegetation Present? Yes No
Is the Sampling Area within a Wetland? Yes No Hydric Soil Present? Yes No
Wetland Hydrology Present? Yes No
Remarks:

US Army Corps of Engineers Arid West – Version 2.0 (modified)
SOIL Sampling Point: 12
Profile Description: (Describe to the depth needed to document the indicator or confirm the absence of indicators.)
Depth Matrix Redox Features
(inches) Color (moist) % Color (Moist) % Type1 Loc2 Texture Horizon Remarks
0-19 10YR3/2 100 cl Fill
1Type: C= Concentration, D=Depletion, RM=Reduced Matrix, CS=Covered or Coated Sand Grains. 2Location: PL=Pore Lining, LRC=Living Root Channel, M=Matrix.
Hydric Soil Indicators: (Applicable to all LRRs, unless otherwise noted.) Indicators for Problematic Hydric Soils3:
Histosol (A1) Sandy Redox (S5) 1 cm Muck (A9) (LRR C)
Histic Epipedon (A2) Stripped Matrix (S6) 2 cm Muck (A10) (LRR B)
Black Histic (A3) Loamy Mucky Mineral (F1) Reduced Vertic (F18)
Hydrogen Sulfide (A4) Loamy Gleyed Matrix (F2) Red Parent Material (TF2)
Stratified Layers (A5) (LRR C) Depleted Matrix (F3) Other (Explain in Remarks)
1 cm Muck (A9) (LRR D) Redox Dark Surface (F6)
3Indicators of hydrophytic vegetation and wetland hydrology must be present.
Depleted Below Dark Surface (A11) Depleted Dark Surface (F7)
Thick Dark Surface (A12) Redox Depressions (F8)
Sandy Mucky Mineral (S1) Vernal Pools (F9)
Sandy Gleyed Matrix (S4)
Restrictive Layer (if present):
Hydric Soils Present? Yes No
Type:
Depth (Inches):
Remarks:
HYDROLOGY Wetland Hydrology Indicators:
Primary Indicators (any one indicator is sufficient) Secondary Indicators (2 or more required)
Surface Water (A1) Salt Crust (B11) Water Marks (B1) (Riverine)
High Water Table (A2) Biotic Crust (B12) Sediment Deposits (B2) (Riverine)
Saturation (A3) Aquatic Invertebrates (B13) Drift Deposits (B3) (Riverine)
Water Marks (B1) (Nonriverine) Hydrogen Sulfide Odor (C1) Drainage Patterns (B10)
Sediment Deposits (B2) (Nonriverine) Oxidized Rhizospheres along Living Roots (C3) Dry-Season Water Table (C2)
Drift Deposits (B3) (Nonriverine) Presence of Reduced Iron (C4) Crayfish Burrows (C8)
Surface Soil Cracks (B6) Recent Iron Reduction in Tilled Soils (C6) Saturation Visible on Aerial Imagery (C9)
Inundation Visible on Aerial Imagery (B7) Thin Muck Surface (C7) Shallow Aquitard (D3)
Water-Stained Leaves (B9) Other (Explain in Remarks) FAC-Neutral Test (D5)
Field Observations:
Surface Water Present? Yes No Depth (inches): n/a Wetland Hydrology Present?
Yes
No
Water Table Present? Yes No Depth (inches): None to 19
Saturation Present? (includes capillary fringe)
Yes No Depth (inches): None to 19
Describe Recorded Data (stream gauge, monitoring well, aerial photos, previous inspections), if available:
Remarks:
Project Site: San Francisquito Creek Flood Protection Project

US Army Corps of Engineers Arid West – Version 2.0 (modified)
WETLAND DETERMINATION DATA FORM – Arid West Region
VEGETATION
Tree Stratum (Plot size r = 30 ft.) Absolute % Cover
Dominant Species?
Indicator Status
Dominance Test Worksheet:
1. Number of Dominant Species That Are OBL, FACW, or FAC:
2 (A) 2.
3. Total Number of Dominant Species Across All Strata:
3 (B) 4.
= Total Cover Percent of Dominant Species That Are OBL, FACW, or FAC:
66 (A/B) Sapling/Shrub Stratum (Plot size r = 5 ft.)
1. Prevalence Index Worksheet:
2. Total % Cover of: Multiply by:
3. OBL species x1 =
4. FACW species x2 =
5. FAC species x3 =
= Total Cover FACU species x4 =
Herb Stratum (Plot size r = 5 ft.) UPL species x5 =
1. Salicornia virginica 45 Y OBL Column Totals: (A) (B)
2. Polypogon maritimus 10 N OBL Prevalence Index = B/A =
3. Lolium multiflorum 20 N FAC Hydrophytic Vegetation Indicators:
4. Salsola soda 20 N NL X Dominance Test is >50%
5. Atriplex triangularis 5 N FACW Prevalence Index is <3.01
6.
Morphological Adaptations1 (Provide supporting data in Remarks or on a separate sheet) 7.
8. Problematic Hydrophytic Vegetation1 (Explain)
90 = Total Cover
1Indicators of hydric soil and wetland hydrology must be present, unless disturbed or problematic.
Woody Vine Stratum (Plot size r = 30 ft.)
1.
2.
Hydrophytic Vegetation Present? Yes No
= Total Cover
% Bare Ground in Herb Stratum 10 % Cover of Biotic Crust 0
Remarks:
Project Site: San Francisquito Creek Flood Protection Project City/County: East Palo Alto/San Mateo Sampling Point: 13
Applicant/Owner: San Francisquito Creek Joint Powers Authority State: CA Sampling Date: July 6, 2010
Investigator(s): Butterworth, Valerius Section, Township, Range: Photo No:
Landform (hillslope, terrace, etc.): Diked tidal marsh Land Surface Shape (concave, convex, planar):
Concave Slope (%): 0-1
Subregion (LRR): C Lat: Long: Datum:
Soil Map Unit Name: Novato clay, 0 to 1 percent slopes (117) NWI classification:
Are climatic / hydrologic conditions on the site typical for this time of year? Yes No (If no, explain in Remarks.)
Are Vegetation , Soil , Or Hydrology , significantly disturbed? Are “Normal Circumstances” present? Yes No
Are Vegetation , Soil , Or Hydrology , naturally problematic? (If needed, explain any answers in Remarks.)
SUMMARY OF FINDINGS – Attach site map showing sampling point locations, transects, important features, etc.
Hydrophytic Vegetation Present? Yes No
Is the Sampling Area within a Wetland? Yes No Hydric Soil Present? Yes No
Wetland Hydrology Present? Yes No
Remarks:

US Army Corps of Engineers Arid West – Version 2.0 (modified)
SOIL Sampling Point: 13
Profile Description: (Describe to the depth needed to document the indicator or confirm the absence of indicators.)
Depth Matrix Redox Features
(inches) Color (moist) % Color (Moist) % Type1 Loc2 Texture Horizon Remarks
0-8 10YR3/2 93 7.5YR5/6 7 C PL cl A1
8-17 10YR4/1 85 7.5YR4/4 15 C M c A2
1Type: C= Concentration, D=Depletion, RM=Reduced Matrix, CS=Covered or Coated Sand Grains. 2Location: PL=Pore Lining, LRC=Living Root Channel, M=Matrix.
Hydric Soil Indicators: (Applicable to all LRRs, unless otherwise noted.) Indicators for Problematic Hydric Soils3:
Histosol (A1) Sandy Redox (S5) 1 cm Muck (A9) (LRR C)
Histic Epipedon (A2) Stripped Matrix (S6) 2 cm Muck (A10) (LRR B)
Black Histic (A3) Loamy Mucky Mineral (F1) Reduced Vertic (F18)
Hydrogen Sulfide (A4) Loamy Gleyed Matrix (F2) Red Parent Material (TF2)
Stratified Layers (A5) (LRR C) Depleted Matrix (F3) Other (Explain in Remarks)
1 cm Muck (A9) (LRR D) Redox Dark Surface (F6)
3Indicators of hydrophytic vegetation and wetland hydrology must be present.
Depleted Below Dark Surface (A11) Depleted Dark Surface (F7)
Thick Dark Surface (A12) Redox Depressions (F8)
Sandy Mucky Mineral (S1) Vernal Pools (F9)
Sandy Gleyed Matrix (S4)
Restrictive Layer (if present):
Hydric Soils Present? Yes No
Type:
Depth (Inches):
Remarks:
HYDROLOGY Wetland Hydrology Indicators:
Primary Indicators (any one indicator is sufficient) Secondary Indicators (2 or more required)
Surface Water (A1) Salt Crust (B11) Water Marks (B1) (Riverine)
High Water Table (A2) Biotic Crust (B12) Sediment Deposits (B2) (Riverine)
Saturation (A3) Aquatic Invertebrates (B13) Drift Deposits (B3) (Riverine)
Water Marks (B1) (Nonriverine) Hydrogen Sulfide Odor (C1) Drainage Patterns (B10)
Sediment Deposits (B2) (Nonriverine) Oxidized Rhizospheres along Living Roots (C3) Dry-Season Water Table (C2)
Drift Deposits (B3) (Nonriverine) Presence of Reduced Iron (C4) Crayfish Burrows (C8)
Surface Soil Cracks (B6) Recent Iron Reduction in Tilled Soils (C6) Saturation Visible on Aerial Imagery (C9)
Inundation Visible on Aerial Imagery (B7) Thin Muck Surface (C7) Shallow Aquitard (D3)
Water-Stained Leaves (B9) Other (Explain in Remarks) FAC-Neutral Test (D5)
Field Observations:
Surface Water Present? Yes No Depth (inches): n/a Wetland Hydrology Present?
Yes
No
Water Table Present? Yes No Depth (inches): None to 17
Saturation Present? (includes capillary fringe)
Yes No Depth (inches): None to 17
Describe Recorded Data (stream gauge, monitoring well, aerial photos, previous inspections), if available:
Remarks:
Project Site: San Francisquito Creek Flood Protection Project

US Army Corps of Engineers Arid West – Version 2.0 (modified)
WETLAND DETERMINATION DATA FORM – Arid West Region
VEGETATION
Tree Stratum (Plot size r = 30 ft.) Absolute % Cover
Dominant Species?
Indicator Status
Dominance Test Worksheet:
1. Number of Dominant Species That Are OBL, FACW, or FAC:
1 (A) 2.
3. Total Number of Dominant Species Across All Strata:
3 (B) 4.
= Total Cover Percent of Dominant Species That Are OBL, FACW, or FAC:
33 (A/B) Sapling/Shrub Stratum (Plot size r = 5 ft.)
1. Prevalence Index Worksheet:
2. Total % Cover of: Multiply by:
3. OBL species x1 =
4. FACW species x2 =
5. FAC species x3 =
= Total Cover FACU species x4 =
Herb Stratum (Plot size r = 5 ft.) UPL species x5 =
1. Avena fatua 60 Y UPL Column Totals: (A) (B)
2. Picris echioides 20 Y FAC Prevalence Index = B/A =
3. Malva sp. 20 Y NL Hydrophytic Vegetation Indicators:
4. Dominance Test is >50%
5. Prevalence Index is <3.01
6.
Morphological Adaptations1 (Provide supporting data in Remarks or on a separate sheet) 7.
8. Problematic Hydrophytic Vegetation1 (Explain)
100 = Total Cover
1Indicators of hydric soil and wetland hydrology must be present, unless disturbed or problematic.
Woody Vine Stratum (Plot size r = 30 ft.)
1.
2.
Hydrophytic Vegetation Present? Yes No
= Total Cover
% Bare Ground in Herb Stratum 0 % Cover of Biotic Crust 0
Remarks:
Project Site: San Francisquito Creek Flood Protection Project City/County: East Palo Alto/San Mateo Sampling Point: 14
Applicant/Owner: San Francisquito Creek Joint Powers Authority State: CA Sampling Date: July 6, 2010
Investigator(s): Butterworth, Valerius Section, Township, Range: Photo No:
Landform (hillslope, terrace, etc.): Levee slope Land Surface Shape (concave, convex, planar):
Planar Slope (%): 70
Subregion (LRR): C Lat: Long: Datum:
Soil Map Unit Name: Novato clay, 0 to 1 percent slopes (117) NWI classification:
Are climatic / hydrologic conditions on the site typical for this time of year? Yes No (If no, explain in Remarks.)
Are Vegetation , Soil , Or Hydrology , significantly disturbed? Are “Normal Circumstances” present? Yes No
Are Vegetation , Soil , Or Hydrology , naturally problematic? (If needed, explain any answers in Remarks.)
SUMMARY OF FINDINGS – Attach site map showing sampling point locations, transects, important features, etc.
Hydrophytic Vegetation Present? Yes No
Is the Sampling Area within a Wetland? Yes No Hydric Soil Present? Yes No
Wetland Hydrology Present? Yes No
Remarks:

US Army Corps of Engineers Arid West – Version 2.0 (modified)
SOIL Sampling Point: 14
Profile Description: (Describe to the depth needed to document the indicator or confirm the absence of indicators.)
Depth Matrix Redox Features
(inches) Color (moist) % Color (Moist) % Type1 Loc2 Texture Horizon Remarks
0-11 10YR3/1 100 vgrcl Fill
1Type: C= Concentration, D=Depletion, RM=Reduced Matrix, CS=Covered or Coated Sand Grains. 2Location: PL=Pore Lining, LRC=Living Root Channel, M=Matrix.
Hydric Soil Indicators: (Applicable to all LRRs, unless otherwise noted.) Indicators for Problematic Hydric Soils3:
Histosol (A1) Sandy Redox (S5) 1 cm Muck (A9) (LRR C)
Histic Epipedon (A2) Stripped Matrix (S6) 2 cm Muck (A10) (LRR B)
Black Histic (A3) Loamy Mucky Mineral (F1) Reduced Vertic (F18)
Hydrogen Sulfide (A4) Loamy Gleyed Matrix (F2) Red Parent Material (TF2)
Stratified Layers (A5) (LRR C) Depleted Matrix (F3) Other (Explain in Remarks)
1 cm Muck (A9) (LRR D) Redox Dark Surface (F6)
3Indicators of hydrophytic vegetation and wetland hydrology must be present.
Depleted Below Dark Surface (A11) Depleted Dark Surface (F7)
Thick Dark Surface (A12) Redox Depressions (F8)
Sandy Mucky Mineral (S1) Vernal Pools (F9)
Sandy Gleyed Matrix (S4)
Restrictive Layer (if present):
Hydric Soils Present? Yes No
Type:
Depth (Inches):
Remarks: Refusal by gravel at 11”.
HYDROLOGY Wetland Hydrology Indicators:
Primary Indicators (any one indicator is sufficient) Secondary Indicators (2 or more required)
Surface Water (A1) Salt Crust (B11) Water Marks (B1) (Riverine)
High Water Table (A2) Biotic Crust (B12) Sediment Deposits (B2) (Riverine)
Saturation (A3) Aquatic Invertebrates (B13) Drift Deposits (B3) (Riverine)
Water Marks (B1) (Nonriverine) Hydrogen Sulfide Odor (C1) Drainage Patterns (B10)
Sediment Deposits (B2) (Nonriverine) Oxidized Rhizospheres along Living Roots (C3) Dry-Season Water Table (C2)
Drift Deposits (B3) (Nonriverine) Presence of Reduced Iron (C4) Crayfish Burrows (C8)
Surface Soil Cracks (B6) Recent Iron Reduction in Tilled Soils (C6) Saturation Visible on Aerial Imagery (C9)
Inundation Visible on Aerial Imagery (B7) Thin Muck Surface (C7) Shallow Aquitard (D3)
Water-Stained Leaves (B9) Other (Explain in Remarks) FAC-Neutral Test (D5)
Field Observations:
Surface Water Present? Yes No Depth (inches): n/a Wetland Hydrology Present?
Yes
No
Water Table Present? Yes No Depth (inches): None to 11
Saturation Present? (includes capillary fringe)
Yes No Depth (inches): None to 11
Describe Recorded Data (stream gauge, monitoring well, aerial photos, previous inspections), if available:
Remarks:
Project Site: San Francisquito Creek Flood Protection Project

US Army Corps of Engineers Arid West – Version 2.0 (modified)
WETLAND DETERMINATION DATA FORM – Arid West Region
VEGETATION
Tree Stratum (Plot size r = 30 ft.) Absolute % Cover
Dominant Species?
Indicator Status
Dominance Test Worksheet:
1. Number of Dominant Species That Are OBL, FACW, or FAC:
1 (A) 2.
3. Total Number of Dominant Species Across All Strata:
1 (B) 4.
= Total Cover Percent of Dominant Species That Are OBL, FACW, or FAC:
100 (A/B) Sapling/Shrub Stratum (Plot size r = 5 ft.)
1. Prevalence Index Worksheet:
2. Total % Cover of: Multiply by:
3. OBL species x1 =
4. FACW species x2 =
5. FAC species x3 =
= Total Cover FACU species x4 =
Herb Stratum (Plot size r = 5 ft.) UPL species x5 =
1. Salicornia virginica 90 Y OBL Column Totals: (A) (B)
2. Jaumea carnosa 10 N OBL Prevalence Index = B/A =
3. Hydrophytic Vegetation Indicators:
4. X Dominance Test is >50%
5. Prevalence Index is <3.01
6.
Morphological Adaptations1 (Provide supporting data in Remarks or on a separate sheet) 7.
8. Problematic Hydrophytic Vegetation1 (Explain)
100 = Total Cover
1Indicators of hydric soil and wetland hydrology must be present, unless disturbed or problematic.
Woody Vine Stratum (Plot size r = 30 ft.)
1.
2.
Hydrophytic Vegetation Present? Yes No
= Total Cover
% Bare Ground in Herb Stratum 0 % Cover of Biotic Crust 0
Remarks:
Project Site: San Francisquito Creek Flood Protection Project City/County: East Palo Alto/San Mateo Sampling Point: 15
Applicant/Owner: San Francisquito Creek Joint Powers Authority State: CA Sampling Date: July 6, 2010
Investigator(s): Butterworth, Valerius Section, Township, Range: Photo No:
Landform (hillslope, terrace, etc.): Salt marsh Land Surface Shape (concave, convex, planar):
Concave Slope (%): 0
Subregion (LRR): C Lat: Long: Datum:
Soil Map Unit Name: Novato clay, 0 to 1 percent slopes (117) NWI classification:
Are climatic / hydrologic conditions on the site typical for this time of year? Yes No (If no, explain in Remarks.)
Are Vegetation , Soil , Or Hydrology , significantly disturbed? Are “Normal Circumstances” present? Yes No
Are Vegetation , Soil , Or Hydrology , naturally problematic? (If needed, explain any answers in Remarks.)
SUMMARY OF FINDINGS – Attach site map showing sampling point locations, transects, important features, etc.
Hydrophytic Vegetation Present? Yes No
Is the Sampling Area within a Wetland? Yes No Hydric Soil Present? Yes No
Wetland Hydrology Present? Yes No
Remarks:
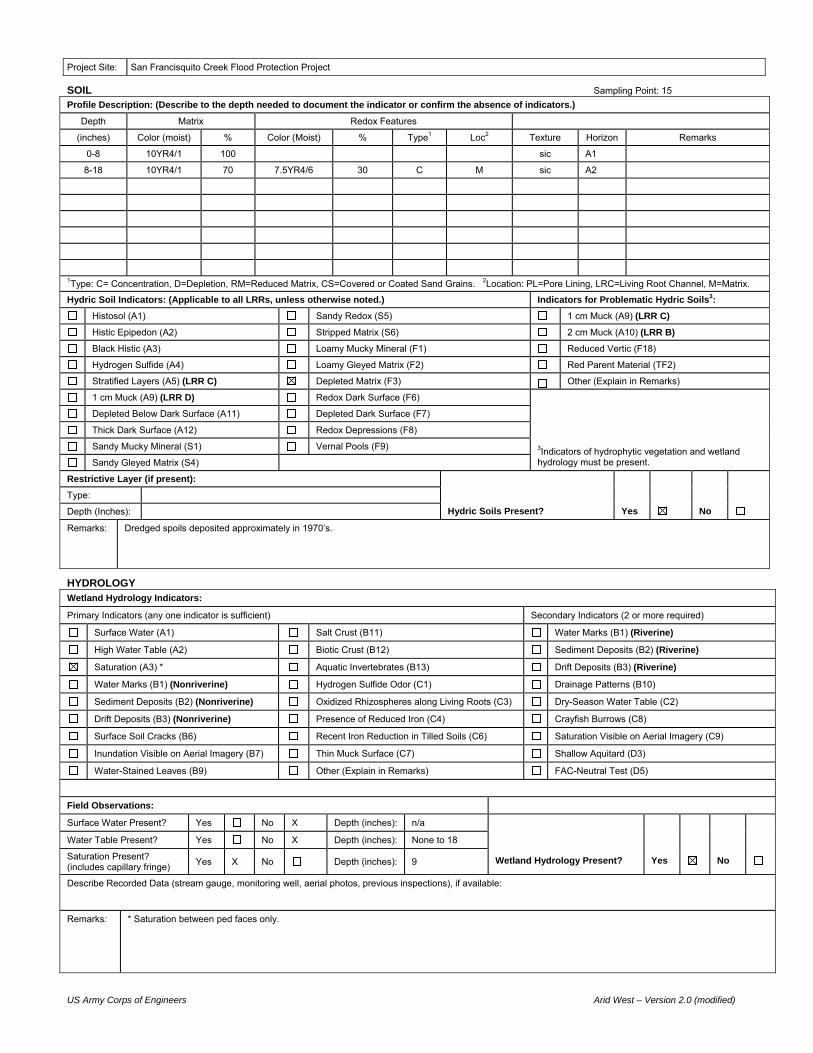
US Army Corps of Engineers Arid West – Version 2.0 (modified)
SOIL Sampling Point: 15
Profile Description: (Describe to the depth needed to document the indicator or confirm the absence of indicators.)
Depth Matrix Redox Features
(inches) Color (moist) % Color (Moist) % Type1 Loc2 Texture Horizon Remarks
0-8 10YR4/1 100 sic A1
8-18 10YR4/1 70 7.5YR4/6 30 C M sic A2
1Type: C= Concentration, D=Depletion, RM=Reduced Matrix, CS=Covered or Coated Sand Grains. 2Location: PL=Pore Lining, LRC=Living Root Channel, M=Matrix.
Hydric Soil Indicators: (Applicable to all LRRs, unless otherwise noted.) Indicators for Problematic Hydric Soils3:
Histosol (A1) Sandy Redox (S5) 1 cm Muck (A9) (LRR C)
Histic Epipedon (A2) Stripped Matrix (S6) 2 cm Muck (A10) (LRR B)
Black Histic (A3) Loamy Mucky Mineral (F1) Reduced Vertic (F18)
Hydrogen Sulfide (A4) Loamy Gleyed Matrix (F2) Red Parent Material (TF2)
Stratified Layers (A5) (LRR C) Depleted Matrix (F3) Other (Explain in Remarks)
1 cm Muck (A9) (LRR D) Redox Dark Surface (F6)
3Indicators of hydrophytic vegetation and wetland hydrology must be present.
Depleted Below Dark Surface (A11) Depleted Dark Surface (F7)
Thick Dark Surface (A12) Redox Depressions (F8)
Sandy Mucky Mineral (S1) Vernal Pools (F9)
Sandy Gleyed Matrix (S4)
Restrictive Layer (if present):
Hydric Soils Present? Yes No
Type:
Depth (Inches):
Remarks: Dredged spoils deposited approximately in 1970’s.
HYDROLOGY Wetland Hydrology Indicators:
Primary Indicators (any one indicator is sufficient) Secondary Indicators (2 or more required)
Surface Water (A1) Salt Crust (B11) Water Marks (B1) (Riverine)
High Water Table (A2) Biotic Crust (B12) Sediment Deposits (B2) (Riverine)
Saturation (A3) * Aquatic Invertebrates (B13) Drift Deposits (B3) (Riverine)
Water Marks (B1) (Nonriverine) Hydrogen Sulfide Odor (C1) Drainage Patterns (B10)
Sediment Deposits (B2) (Nonriverine) Oxidized Rhizospheres along Living Roots (C3) Dry-Season Water Table (C2)
Drift Deposits (B3) (Nonriverine) Presence of Reduced Iron (C4) Crayfish Burrows (C8)
Surface Soil Cracks (B6) Recent Iron Reduction in Tilled Soils (C6) Saturation Visible on Aerial Imagery (C9)
Inundation Visible on Aerial Imagery (B7) Thin Muck Surface (C7) Shallow Aquitard (D3)
Water-Stained Leaves (B9) Other (Explain in Remarks) FAC-Neutral Test (D5)
Field Observations:
Surface Water Present? Yes No X Depth (inches): n/a Wetland Hydrology Present?
Yes
No
Water Table Present? Yes No X Depth (inches): None to 18
Saturation Present? (includes capillary fringe)
Yes X No Depth (inches): 9
Describe Recorded Data (stream gauge, monitoring well, aerial photos, previous inspections), if available:
Remarks: * Saturation between ped faces only.
Project Site: San Francisquito Creek Flood Protection Project
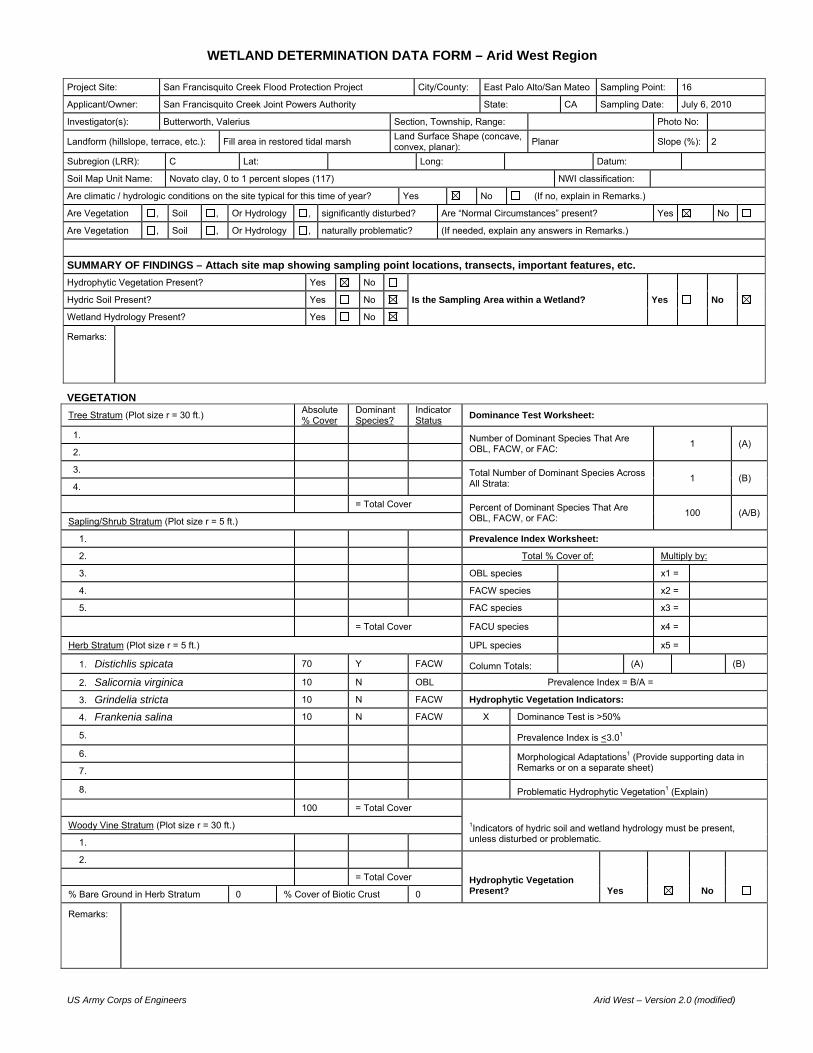
US Army Corps of Engineers Arid West – Version 2.0 (modified)
WETLAND DETERMINATION DATA FORM – Arid West Region
VEGETATION
Tree Stratum (Plot size r = 30 ft.) Absolute % Cover
Dominant Species?
Indicator Status
Dominance Test Worksheet:
1. Number of Dominant Species That Are OBL, FACW, or FAC:
1 (A) 2.
3. Total Number of Dominant Species Across All Strata:
1 (B) 4.
= Total Cover Percent of Dominant Species That Are OBL, FACW, or FAC:
100 (A/B) Sapling/Shrub Stratum (Plot size r = 5 ft.)
1. Prevalence Index Worksheet:
2. Total % Cover of: Multiply by:
3. OBL species x1 =
4. FACW species x2 =
5. FAC species x3 =
= Total Cover FACU species x4 =
Herb Stratum (Plot size r = 5 ft.) UPL species x5 =
1. Distichlis spicata 70 Y FACW Column Totals: (A) (B)
2. Salicornia virginica 10 N OBL Prevalence Index = B/A =
3. Grindelia stricta 10 N FACW Hydrophytic Vegetation Indicators:
4. Frankenia salina 10 N FACW X Dominance Test is >50%
5. Prevalence Index is <3.01
6.
Morphological Adaptations1 (Provide supporting data in Remarks or on a separate sheet) 7.
8. Problematic Hydrophytic Vegetation1 (Explain)
100 = Total Cover
1Indicators of hydric soil and wetland hydrology must be present, unless disturbed or problematic.
Woody Vine Stratum (Plot size r = 30 ft.)
1.
2.
Hydrophytic Vegetation Present? Yes No
= Total Cover
% Bare Ground in Herb Stratum 0 % Cover of Biotic Crust 0
Remarks:
Project Site: San Francisquito Creek Flood Protection Project City/County: East Palo Alto/San Mateo Sampling Point: 16
Applicant/Owner: San Francisquito Creek Joint Powers Authority State: CA Sampling Date: July 6, 2010
Investigator(s): Butterworth, Valerius Section, Township, Range: Photo No:
Landform (hillslope, terrace, etc.): Fill area in restored tidal marsh Land Surface Shape (concave, convex, planar):
Planar Slope (%): 2
Subregion (LRR): C Lat: Long: Datum:
Soil Map Unit Name: Novato clay, 0 to 1 percent slopes (117) NWI classification:
Are climatic / hydrologic conditions on the site typical for this time of year? Yes No (If no, explain in Remarks.)
Are Vegetation , Soil , Or Hydrology , significantly disturbed? Are “Normal Circumstances” present? Yes No
Are Vegetation , Soil , Or Hydrology , naturally problematic? (If needed, explain any answers in Remarks.)
SUMMARY OF FINDINGS – Attach site map showing sampling point locations, transects, important features, etc.
Hydrophytic Vegetation Present? Yes No
Is the Sampling Area within a Wetland? Yes No Hydric Soil Present? Yes No
Wetland Hydrology Present? Yes No
Remarks:

US Army Corps of Engineers Arid West – Version 2.0 (modified)
SOIL Sampling Point: 16
Profile Description: (Describe to the depth needed to document the indicator or confirm the absence of indicators.)
Depth Matrix Redox Features
(inches) Color (moist) % Color (Moist) % Type1 Loc2 Texture Horizon Remarks
0-7 10YR3/2 100 cl A1 Fill
7-18 10YR4/1 50 sic A2 variegated
and 10YR5/4 50
1Type: C= Concentration, D=Depletion, RM=Reduced Matrix, CS=Covered or Coated Sand Grains. 2Location: PL=Pore Lining, LRC=Living Root Channel, M=Matrix.
Hydric Soil Indicators: (Applicable to all LRRs, unless otherwise noted.) Indicators for Problematic Hydric Soils3:
Histosol (A1) Sandy Redox (S5) 1 cm Muck (A9) (LRR C)
Histic Epipedon (A2) Stripped Matrix (S6) 2 cm Muck (A10) (LRR B)
Black Histic (A3) Loamy Mucky Mineral (F1) Reduced Vertic (F18)
Hydrogen Sulfide (A4) Loamy Gleyed Matrix (F2) Red Parent Material (TF2)
Stratified Layers (A5) (LRR C) Depleted Matrix (F3) Other (Explain in Remarks)
1 cm Muck (A9) (LRR D) Redox Dark Surface (F6)
3Indicators of hydrophytic vegetation and wetland hydrology must be present.
Depleted Below Dark Surface (A11) Depleted Dark Surface (F7)
Thick Dark Surface (A12) Redox Depressions (F8)
Sandy Mucky Mineral (S1) Vernal Pools (F9)
Sandy Gleyed Matrix (S4)
Restrictive Layer (if present):
Hydric Soils Present? Yes No
Type:
Depth (Inches):
Remarks:
HYDROLOGY Wetland Hydrology Indicators:
Primary Indicators (any one indicator is sufficient) Secondary Indicators (2 or more required)
Surface Water (A1) Salt Crust (B11) Water Marks (B1) (Riverine)
High Water Table (A2) Biotic Crust (B12) Sediment Deposits (B2) (Riverine)
Saturation (A3) Aquatic Invertebrates (B13) Drift Deposits (B3) (Riverine)
Water Marks (B1) (Nonriverine) Hydrogen Sulfide Odor (C1) Drainage Patterns (B10)
Sediment Deposits (B2) (Nonriverine) Oxidized Rhizospheres along Living Roots (C3) Dry-Season Water Table (C2)
Drift Deposits (B3) (Nonriverine) Presence of Reduced Iron (C4) Crayfish Burrows (C8)
Surface Soil Cracks (B6) Recent Iron Reduction in Tilled Soils (C6) Saturation Visible on Aerial Imagery (C9)
Inundation Visible on Aerial Imagery (B7) Thin Muck Surface (C7) Shallow Aquitard (D3)
Water-Stained Leaves (B9) Other (Explain in Remarks) FAC-Neutral Test (D5)
Field Observations:
Surface Water Present? Yes No Depth (inches): n/a Wetland Hydrology Present?
Yes
No
Water Table Present? Yes No Depth (inches): None to 18
Saturation Present? (includes capillary fringe)
Yes No Depth (inches): None to 18
Describe Recorded Data (stream gauge, monitoring well, aerial photos, previous inspections), if available:
Remarks:
Project Site: San Francisquito Creek Flood Protection Project

US Army Corps of Engineers Arid West – Version 2.0 (modified)
WETLAND DETERMINATION DATA FORM – Arid West Region
VEGETATION
Tree Stratum (Plot size r = 30 ft.) Absolute % Cover
Dominant Species?
Indicator Status
Dominance Test Worksheet:
1. Number of Dominant Species That Are OBL, FACW, or FAC:
1 (A) 2.
3. Total Number of Dominant Species Across All Strata:
1 (B) 4.
= Total Cover Percent of Dominant Species That Are OBL, FACW, or FAC:
100 (A/B) Sapling/Shrub Stratum (Plot size r = 5 ft.)
1. Prevalence Index Worksheet:
2. Total % Cover of: Multiply by:
3. OBL species x1 =
4. FACW species x2 =
5. FAC species x3 =
= Total Cover FACU species x4 =
Herb Stratum (Plot size r = 5 ft.) UPL species x5 =
1. Salicornia virginica 100 Y OBL Column Totals: (A) (B)
2. Prevalence Index = B/A =
3. Hydrophytic Vegetation Indicators:
4. X Dominance Test is >50%
5. Prevalence Index is <3.01
6.
Morphological Adaptations1 (Provide supporting data in Remarks or on a separate sheet) 7.
8. Problematic Hydrophytic Vegetation1 (Explain)
100 = Total Cover
1Indicators of hydric soil and wetland hydrology must be present, unless disturbed or problematic.
Woody Vine Stratum (Plot size r = 30 ft.)
1.
2.
Hydrophytic Vegetation Present? Yes No
= Total Cover
% Bare Ground in Herb Stratum 0 % Cover of Biotic Crust 0
Remarks:
Project Site: San Francisquito Creek Flood Protection Project City/County: East Palo Alto/San Mateo Sampling Point: 17
Applicant/Owner: San Francisquito Creek Joint Powers Authority State: CA Sampling Date: July 7, 2010
Investigator(s): Butterworth, Valerius Section, Township, Range: Photo No:
Landform (hillslope, terrace, etc.): Salt marsh Land Surface Shape (concave, convex, planar):
Concave/planar Slope (%): 0
Subregion (LRR): C Lat: Long: Datum:
Soil Map Unit Name: Novato clay, 0 to 1 percent slopes (117) NWI classification:
Are climatic / hydrologic conditions on the site typical for this time of year? Yes No (If no, explain in Remarks.)
Are Vegetation , Soil , Or Hydrology , significantly disturbed? Are “Normal Circumstances” present? Yes No
Are Vegetation , Soil , Or Hydrology , naturally problematic? (If needed, explain any answers in Remarks.)
SUMMARY OF FINDINGS – Attach site map showing sampling point locations, transects, important features, etc.
Hydrophytic Vegetation Present? Yes No
Is the Sampling Area within a Wetland? Yes No Hydric Soil Present? Yes No
Wetland Hydrology Present? Yes No
Remarks:

US Army Corps of Engineers Arid West – Version 2.0 (modified)
SOIL Sampling Point: 17
Profile Description: (Describe to the depth needed to document the indicator or confirm the absence of indicators.)
Depth Matrix Redox Features
(inches) Color (moist) % Color (Moist) % Type1 Loc2 Texture Horizon Remarks
0-15 10YR5/1 80 5YR4/6 20 C M sic A1
15-16 Gley 1 3/N 100 sic A2
1Type: C= Concentration, D=Depletion, RM=Reduced Matrix, CS=Covered or Coated Sand Grains. 2Location: PL=Pore Lining, LRC=Living Root Channel, M=Matrix.
Hydric Soil Indicators: (Applicable to all LRRs, unless otherwise noted.) Indicators for Problematic Hydric Soils3:
Histosol (A1) Sandy Redox (S5) 1 cm Muck (A9) (LRR C)
Histic Epipedon (A2) Stripped Matrix (S6) 2 cm Muck (A10) (LRR B)
Black Histic (A3) Loamy Mucky Mineral (F1) Reduced Vertic (F18)
Hydrogen Sulfide (A4) Loamy Gleyed Matrix (F2) Red Parent Material (TF2)
Stratified Layers (A5) (LRR C) Depleted Matrix (F3) Other (Explain in Remarks)
1 cm Muck (A9) (LRR D) Redox Dark Surface (F6)
3Indicators of hydrophytic vegetation and wetland hydrology must be present.
Depleted Below Dark Surface (A11) Depleted Dark Surface (F7)
Thick Dark Surface (A12) Redox Depressions (F8)
Sandy Mucky Mineral (S1) Vernal Pools (F9)
Sandy Gleyed Matrix (S4)
Restrictive Layer (if present):
Hydric Soils Present? Yes No
Type:
Depth (Inches):
Remarks:
HYDROLOGY Wetland Hydrology Indicators:
Primary Indicators (any one indicator is sufficient) Secondary Indicators (2 or more required)
Surface Water (A1) Salt Crust (B11) Water Marks (B1) (Riverine)
High Water Table (A2) Biotic Crust (B12) Sediment Deposits (B2) (Riverine)
Saturation (A3) Aquatic Invertebrates (B13) Drift Deposits (B3) (Riverine)
Water Marks (B1) (Nonriverine) Hydrogen Sulfide Odor (C1) Drainage Patterns (B10)
Sediment Deposits (B2) (Nonriverine) Oxidized Rhizospheres along Living Roots (C3) Dry-Season Water Table (C2)
Drift Deposits (B3) (Nonriverine) Presence of Reduced Iron (C4) Crayfish Burrows (C8)
Surface Soil Cracks (B6) Recent Iron Reduction in Tilled Soils (C6) Saturation Visible on Aerial Imagery (C9)
Inundation Visible on Aerial Imagery (B7) Thin Muck Surface (C7) Shallow Aquitard (D3)
Water-Stained Leaves (B9) Other (Explain in Remarks) FAC-Neutral Test (D5)
Field Observations:
Surface Water Present? Yes No Depth (inches): n/a Wetland Hydrology Present?
Yes
No
Water Table Present? Yes No Depth (inches): 15
Saturation Present? (includes capillary fringe)
Yes No Depth (inches): 13
Describe Recorded Data (stream gauge, monitoring well, aerial photos, previous inspections), if available:
Remarks:
Project Site: San Francisquito Creek Flood Protection Project
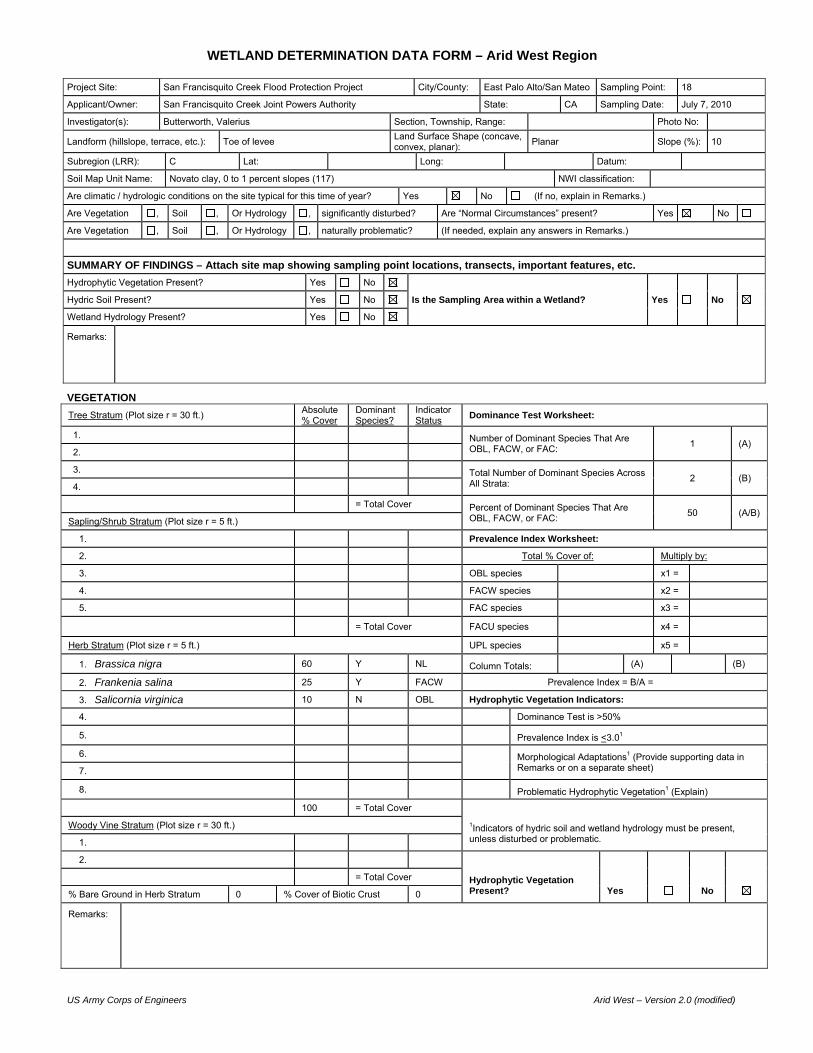
US Army Corps of Engineers Arid West – Version 2.0 (modified)
WETLAND DETERMINATION DATA FORM – Arid West Region
VEGETATION
Tree Stratum (Plot size r = 30 ft.) Absolute % Cover
Dominant Species?
Indicator Status
Dominance Test Worksheet:
1. Number of Dominant Species That Are OBL, FACW, or FAC:
1 (A) 2.
3. Total Number of Dominant Species Across All Strata:
2 (B) 4.
= Total Cover Percent of Dominant Species That Are OBL, FACW, or FAC:
50 (A/B) Sapling/Shrub Stratum (Plot size r = 5 ft.)
1. Prevalence Index Worksheet:
2. Total % Cover of: Multiply by:
3. OBL species x1 =
4. FACW species x2 =
5. FAC species x3 =
= Total Cover FACU species x4 =
Herb Stratum (Plot size r = 5 ft.) UPL species x5 =
1. Brassica nigra 60 Y NL Column Totals: (A) (B)
2. Frankenia salina 25 Y FACW Prevalence Index = B/A =
3. Salicornia virginica 10 N OBL Hydrophytic Vegetation Indicators:
4. Dominance Test is >50%
5. Prevalence Index is <3.01
6.
Morphological Adaptations1 (Provide supporting data in Remarks or on a separate sheet) 7.
8. Problematic Hydrophytic Vegetation1 (Explain)
100 = Total Cover
1Indicators of hydric soil and wetland hydrology must be present, unless disturbed or problematic.
Woody Vine Stratum (Plot size r = 30 ft.)
1.
2.
Hydrophytic Vegetation Present? Yes No
= Total Cover
% Bare Ground in Herb Stratum 0 % Cover of Biotic Crust 0
Remarks:
Project Site: San Francisquito Creek Flood Protection Project City/County: East Palo Alto/San Mateo Sampling Point: 18
Applicant/Owner: San Francisquito Creek Joint Powers Authority State: CA Sampling Date: July 7, 2010
Investigator(s): Butterworth, Valerius Section, Township, Range: Photo No:
Landform (hillslope, terrace, etc.): Toe of levee Land Surface Shape (concave, convex, planar):
Planar Slope (%): 10
Subregion (LRR): C Lat: Long: Datum:
Soil Map Unit Name: Novato clay, 0 to 1 percent slopes (117) NWI classification:
Are climatic / hydrologic conditions on the site typical for this time of year? Yes No (If no, explain in Remarks.)
Are Vegetation , Soil , Or Hydrology , significantly disturbed? Are “Normal Circumstances” present? Yes No
Are Vegetation , Soil , Or Hydrology , naturally problematic? (If needed, explain any answers in Remarks.)
SUMMARY OF FINDINGS – Attach site map showing sampling point locations, transects, important features, etc.
Hydrophytic Vegetation Present? Yes No
Is the Sampling Area within a Wetland? Yes No Hydric Soil Present? Yes No
Wetland Hydrology Present? Yes No
Remarks:
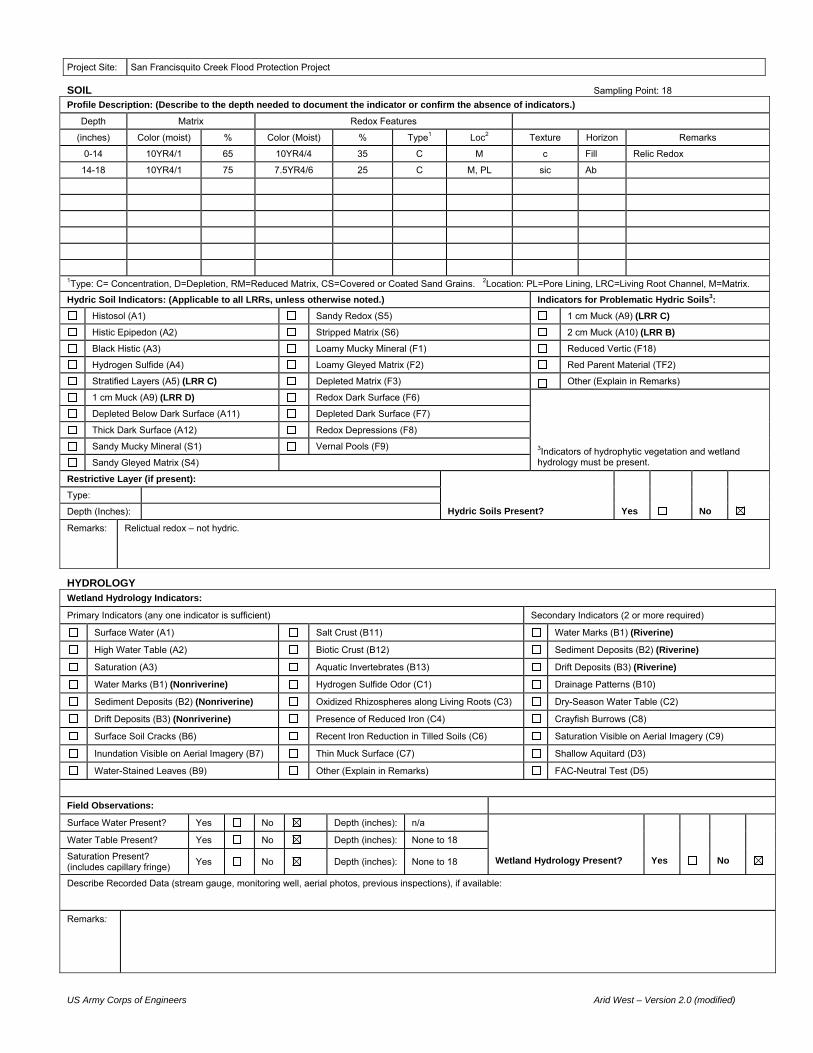
US Army Corps of Engineers Arid West – Version 2.0 (modified)
SOIL Sampling Point: 18
Profile Description: (Describe to the depth needed to document the indicator or confirm the absence of indicators.)
Depth Matrix Redox Features
(inches) Color (moist) % Color (Moist) % Type1 Loc2 Texture Horizon Remarks
0-14 10YR4/1 65 10YR4/4 35 C M c Fill Relic Redox
14-18 10YR4/1 75 7.5YR4/6 25 C M, PL sic Ab
1Type: C= Concentration, D=Depletion, RM=Reduced Matrix, CS=Covered or Coated Sand Grains. 2Location: PL=Pore Lining, LRC=Living Root Channel, M=Matrix.
Hydric Soil Indicators: (Applicable to all LRRs, unless otherwise noted.) Indicators for Problematic Hydric Soils3:
Histosol (A1) Sandy Redox (S5) 1 cm Muck (A9) (LRR C)
Histic Epipedon (A2) Stripped Matrix (S6) 2 cm Muck (A10) (LRR B)
Black Histic (A3) Loamy Mucky Mineral (F1) Reduced Vertic (F18)
Hydrogen Sulfide (A4) Loamy Gleyed Matrix (F2) Red Parent Material (TF2)
Stratified Layers (A5) (LRR C) Depleted Matrix (F3) Other (Explain in Remarks)
1 cm Muck (A9) (LRR D) Redox Dark Surface (F6)
3Indicators of hydrophytic vegetation and wetland hydrology must be present.
Depleted Below Dark Surface (A11) Depleted Dark Surface (F7)
Thick Dark Surface (A12) Redox Depressions (F8)
Sandy Mucky Mineral (S1) Vernal Pools (F9)
Sandy Gleyed Matrix (S4)
Restrictive Layer (if present):
Hydric Soils Present? Yes No
Type:
Depth (Inches):
Remarks: Relictual redox – not hydric.
HYDROLOGY Wetland Hydrology Indicators:
Primary Indicators (any one indicator is sufficient) Secondary Indicators (2 or more required)
Surface Water (A1) Salt Crust (B11) Water Marks (B1) (Riverine)
High Water Table (A2) Biotic Crust (B12) Sediment Deposits (B2) (Riverine)
Saturation (A3) Aquatic Invertebrates (B13) Drift Deposits (B3) (Riverine)
Water Marks (B1) (Nonriverine) Hydrogen Sulfide Odor (C1) Drainage Patterns (B10)
Sediment Deposits (B2) (Nonriverine) Oxidized Rhizospheres along Living Roots (C3) Dry-Season Water Table (C2)
Drift Deposits (B3) (Nonriverine) Presence of Reduced Iron (C4) Crayfish Burrows (C8)
Surface Soil Cracks (B6) Recent Iron Reduction in Tilled Soils (C6) Saturation Visible on Aerial Imagery (C9)
Inundation Visible on Aerial Imagery (B7) Thin Muck Surface (C7) Shallow Aquitard (D3)
Water-Stained Leaves (B9) Other (Explain in Remarks) FAC-Neutral Test (D5)
Field Observations:
Surface Water Present? Yes No Depth (inches): n/a Wetland Hydrology Present?
Yes
No
Water Table Present? Yes No Depth (inches): None to 18
Saturation Present? (includes capillary fringe)
Yes No Depth (inches): None to 18
Describe Recorded Data (stream gauge, monitoring well, aerial photos, previous inspections), if available:
Remarks:
Project Site: San Francisquito Creek Flood Protection Project

US Army Corps of Engineers Arid West – Version 2.0 (modified)
WETLAND DETERMINATION DATA FORM – Arid West Region
VEGETATION
Tree Stratum (Plot size r = 30 ft.) Absolute % Cover
Dominant Species?
Indicator Status
Dominance Test Worksheet:
1. Number of Dominant Species That Are OBL, FACW, or FAC:
1 (A) 2.
3. Total Number of Dominant Species Across All Strata:
1 (B) 4.
= Total Cover Percent of Dominant Species That Are OBL, FACW, or FAC:
100 (A/B) Sapling/Shrub Stratum (Plot size r = 5 ft.)
1. Prevalence Index Worksheet:
2. Total % Cover of: Multiply by:
3. OBL species x1 =
4. FACW species x2 =
5. FAC species x3 =
= Total Cover FACU species x4 =
Herb Stratum (Plot size r = 5 ft.) UPL species x5 =
1. Salicornia virginica 100 Y OBL Column Totals: (A) (B)
2. Prevalence Index = B/A =
3. Hydrophytic Vegetation Indicators:
4. X Dominance Test is >50%
5. Prevalence Index is <3.01
6.
Morphological Adaptations1 (Provide supporting data in Remarks or on a separate sheet) 7.
8. Problematic Hydrophytic Vegetation1 (Explain)
100 = Total Cover
1Indicators of hydric soil and wetland hydrology must be present, unless disturbed or problematic.
Woody Vine Stratum (Plot size r = 30 ft.)
1.
2.
Hydrophytic Vegetation Present? Yes No
= Total Cover
% Bare Ground in Herb Stratum 10 % Cover of Biotic Crust 0
Remarks:
Project Site: San Francisquito Creek Flood Protection Project City/County: East Palo Alto/San Mateo Sampling Point: 19
Applicant/Owner: San Francisquito Creek Joint Powers Authority State: CA Sampling Date: July 7, 2010
Investigator(s): Butterworth, Valerius Section, Township, Range: Photo No:
Landform (hillslope, terrace, etc.): Salt marsh Land Surface Shape (concave, convex, planar):
Concave/planar Slope (%): 0
Subregion (LRR): C Lat: Long: Datum:
Soil Map Unit Name: Novato clay, 0 to 1 percent slopes (117) NWI classification:
Are climatic / hydrologic conditions on the site typical for this time of year? Yes No (If no, explain in Remarks.)
Are Vegetation , Soil , Or Hydrology , significantly disturbed? Are “Normal Circumstances” present? Yes No
Are Vegetation , Soil , Or Hydrology , naturally problematic? (If needed, explain any answers in Remarks.)
SUMMARY OF FINDINGS – Attach site map showing sampling point locations, transects, important features, etc.
Hydrophytic Vegetation Present? Yes No
Is the Sampling Area within a Wetland? Yes No Hydric Soil Present? Yes No
Wetland Hydrology Present? Yes No
Remarks:

US Army Corps of Engineers Arid West – Version 2.0 (modified)
SOIL Sampling Point: 19
Profile Description: (Describe to the depth needed to document the indicator or confirm the absence of indicators.)
Depth Matrix Redox Features
(inches) Color (moist) % Color (Moist) % Type1 Loc2 Texture Horizon Remarks
0-8 10YR5/1 75 5YR4/6 25 C M sic A
8-22 Gley 1 4/N 100 sic Bg
1Type: C= Concentration, D=Depletion, RM=Reduced Matrix, CS=Covered or Coated Sand Grains. 2Location: PL=Pore Lining, LRC=Living Root Channel, M=Matrix.
Hydric Soil Indicators: (Applicable to all LRRs, unless otherwise noted.) Indicators for Problematic Hydric Soils3:
Histosol (A1) Sandy Redox (S5) 1 cm Muck (A9) (LRR C)
Histic Epipedon (A2) Stripped Matrix (S6) 2 cm Muck (A10) (LRR B)
Black Histic (A3) Loamy Mucky Mineral (F1) Reduced Vertic (F18)
Hydrogen Sulfide (A4) Loamy Gleyed Matrix (F2) Red Parent Material (TF2)
Stratified Layers (A5) (LRR C) Depleted Matrix (F3) Other (Explain in Remarks)
1 cm Muck (A9) (LRR D) Redox Dark Surface (F6)
3Indicators of hydrophytic vegetation and wetland hydrology must be present.
Depleted Below Dark Surface (A11) Depleted Dark Surface (F7)
Thick Dark Surface (A12) Redox Depressions (F8)
Sandy Mucky Mineral (S1) Vernal Pools (F9)
Sandy Gleyed Matrix (S4)
Restrictive Layer (if present):
Hydric Soils Present? Yes No
Type:
Depth (Inches):
Remarks:
HYDROLOGY Wetland Hydrology Indicators:
Primary Indicators (any one indicator is sufficient) Secondary Indicators (2 or more required)
Surface Water (A1) Salt Crust (B11) Water Marks (B1) (Riverine)
High Water Table (A2) Biotic Crust (B12) Sediment Deposits (B2) (Riverine)
Saturation (A3) Aquatic Invertebrates (B13) Drift Deposits (B3) (Riverine)
Water Marks (B1) (Nonriverine) Hydrogen Sulfide Odor (C1) Drainage Patterns (B10)
Sediment Deposits (B2) (Nonriverine) Oxidized Rhizospheres along Living Roots (C3) Dry-Season Water Table (C2)
Drift Deposits (B3) (Nonriverine) Presence of Reduced Iron (C4) Crayfish Burrows (C8)
Surface Soil Cracks (B6) Recent Iron Reduction in Tilled Soils (C6) Saturation Visible on Aerial Imagery (C9)
Inundation Visible on Aerial Imagery (B7) Thin Muck Surface (C7) Shallow Aquitard (D3)
Water-Stained Leaves (B9) Other (Explain in Remarks) FAC-Neutral Test (D5)
Field Observations:
Surface Water Present? Yes No Depth (inches): n/a Wetland Hydrology Present?
Yes
No
Water Table Present? Yes No Depth (inches): 20 *
Saturation Present? (includes capillary fringe)
Yes No Depth (inches): 4
Describe Recorded Data (stream gauge, monitoring well, aerial photos, previous inspections), if available:
Remarks: * Not yet stabilized.
Project Site: San Francisquito Creek Flood Protection Project
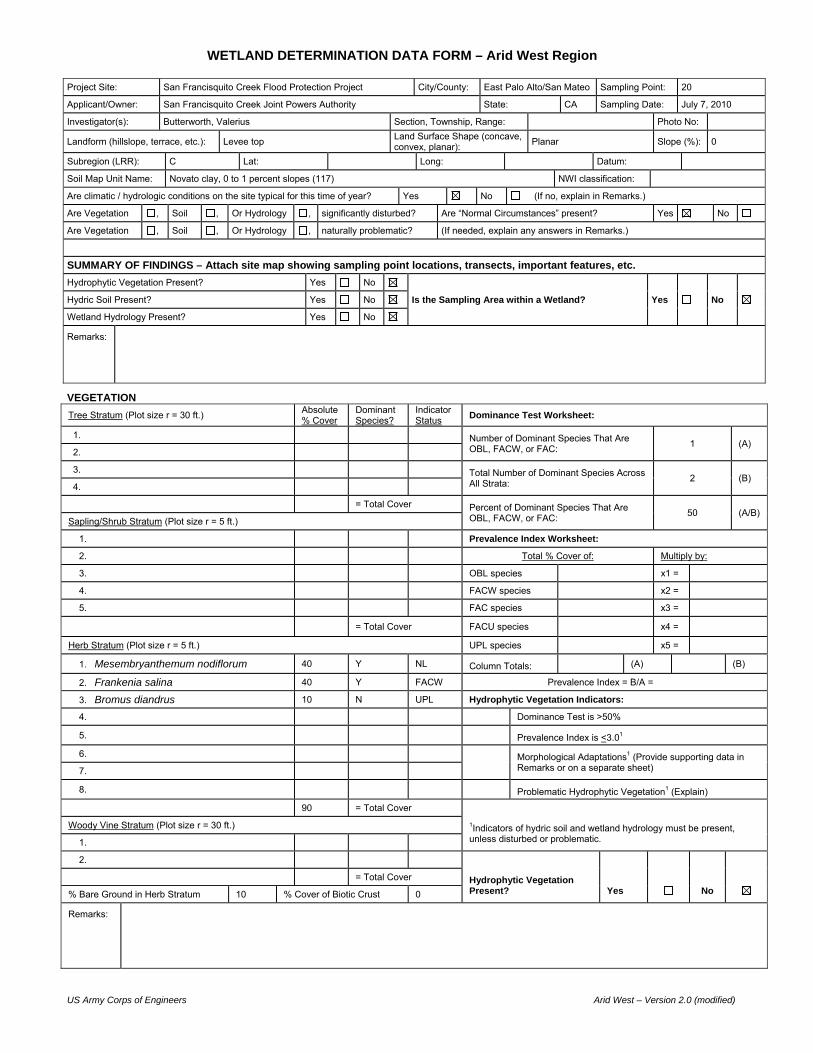
US Army Corps of Engineers Arid West – Version 2.0 (modified)
WETLAND DETERMINATION DATA FORM – Arid West Region
VEGETATION
Tree Stratum (Plot size r = 30 ft.) Absolute % Cover
Dominant Species?
Indicator Status
Dominance Test Worksheet:
1. Number of Dominant Species That Are OBL, FACW, or FAC:
1 (A) 2.
3. Total Number of Dominant Species Across All Strata:
2 (B) 4.
= Total Cover Percent of Dominant Species That Are OBL, FACW, or FAC:
50 (A/B) Sapling/Shrub Stratum (Plot size r = 5 ft.)
1. Prevalence Index Worksheet:
2. Total % Cover of: Multiply by:
3. OBL species x1 =
4. FACW species x2 =
5. FAC species x3 =
= Total Cover FACU species x4 =
Herb Stratum (Plot size r = 5 ft.) UPL species x5 =
1. Mesembryanthemum nodiflorum 40 Y NL Column Totals: (A) (B)
2. Frankenia salina 40 Y FACW Prevalence Index = B/A =
3. Bromus diandrus 10 N UPL Hydrophytic Vegetation Indicators:
4. Dominance Test is >50%
5. Prevalence Index is <3.01
6.
Morphological Adaptations1 (Provide supporting data in Remarks or on a separate sheet) 7.
8. Problematic Hydrophytic Vegetation1 (Explain)
90 = Total Cover
1Indicators of hydric soil and wetland hydrology must be present, unless disturbed or problematic.
Woody Vine Stratum (Plot size r = 30 ft.)
1.
2.
Hydrophytic Vegetation Present? Yes No
= Total Cover
% Bare Ground in Herb Stratum 10 % Cover of Biotic Crust 0
Remarks:
Project Site: San Francisquito Creek Flood Protection Project City/County: East Palo Alto/San Mateo Sampling Point: 20
Applicant/Owner: San Francisquito Creek Joint Powers Authority State: CA Sampling Date: July 7, 2010
Investigator(s): Butterworth, Valerius Section, Township, Range: Photo No:
Landform (hillslope, terrace, etc.): Levee top Land Surface Shape (concave, convex, planar):
Planar Slope (%): 0
Subregion (LRR): C Lat: Long: Datum:
Soil Map Unit Name: Novato clay, 0 to 1 percent slopes (117) NWI classification:
Are climatic / hydrologic conditions on the site typical for this time of year? Yes No (If no, explain in Remarks.)
Are Vegetation , Soil , Or Hydrology , significantly disturbed? Are “Normal Circumstances” present? Yes No
Are Vegetation , Soil , Or Hydrology , naturally problematic? (If needed, explain any answers in Remarks.)
SUMMARY OF FINDINGS – Attach site map showing sampling point locations, transects, important features, etc.
Hydrophytic Vegetation Present? Yes No
Is the Sampling Area within a Wetland? Yes No Hydric Soil Present? Yes No
Wetland Hydrology Present? Yes No
Remarks:

US Army Corps of Engineers Arid West – Version 2.0 (modified)
SOIL Sampling Point: 20
Profile Description: (Describe to the depth needed to document the indicator or confirm the absence of indicators.)
Depth Matrix Redox Features
(inches) Color (moist) % Color (Moist) % Type1 Loc2 Texture Horizon Remarks
0-5 10YR4/2 100 cl Fill 1
5-21 10YR3/1 85 7.5YR3/2 15 C M sic Fill 2 Relic redox
1Type: C= Concentration, D=Depletion, RM=Reduced Matrix, CS=Covered or Coated Sand Grains. 2Location: PL=Pore Lining, LRC=Living Root Channel, M=Matrix.
Hydric Soil Indicators: (Applicable to all LRRs, unless otherwise noted.) Indicators for Problematic Hydric Soils3:
Histosol (A1) Sandy Redox (S5) 1 cm Muck (A9) (LRR C)
Histic Epipedon (A2) Stripped Matrix (S6) 2 cm Muck (A10) (LRR B)
Black Histic (A3) Loamy Mucky Mineral (F1) Reduced Vertic (F18)
Hydrogen Sulfide (A4) Loamy Gleyed Matrix (F2) Red Parent Material (TF2)
Stratified Layers (A5) (LRR C) Depleted Matrix (F3) Other (Explain in Remarks)
1 cm Muck (A9) (LRR D) Redox Dark Surface (F6)
3Indicators of hydrophytic vegetation and wetland hydrology must be present.
Depleted Below Dark Surface (A11) Depleted Dark Surface (F7)
Thick Dark Surface (A12) Redox Depressions (F8)
Sandy Mucky Mineral (S1) Vernal Pools (F9)
Sandy Gleyed Matrix (S4)
Restrictive Layer (if present):
Hydric Soils Present? Yes No
Type:
Depth (Inches):
Remarks:
HYDROLOGY Wetland Hydrology Indicators:
Primary Indicators (any one indicator is sufficient) Secondary Indicators (2 or more required)
Surface Water (A1) Salt Crust (B11) Water Marks (B1) (Riverine)
High Water Table (A2) Biotic Crust (B12) Sediment Deposits (B2) (Riverine)
Saturation (A3) Aquatic Invertebrates (B13) Drift Deposits (B3) (Riverine)
Water Marks (B1) (Nonriverine) Hydrogen Sulfide Odor (C1) Drainage Patterns (B10)
Sediment Deposits (B2) (Nonriverine) Oxidized Rhizospheres along Living Roots (C3) Dry-Season Water Table (C2)
Drift Deposits (B3) (Nonriverine) Presence of Reduced Iron (C4) Crayfish Burrows (C8)
Surface Soil Cracks (B6) Recent Iron Reduction in Tilled Soils (C6) Saturation Visible on Aerial Imagery (C9)
Inundation Visible on Aerial Imagery (B7) Thin Muck Surface (C7) Shallow Aquitard (D3)
Water-Stained Leaves (B9) Other (Explain in Remarks) FAC-Neutral Test (D5)
Field Observations:
Surface Water Present? Yes No Depth (inches): n/a Wetland Hydrology Present?
Yes
No
Water Table Present? Yes No Depth (inches): None to 21
Saturation Present? (includes capillary fringe)
Yes No Depth (inches): None to 21
Describe Recorded Data (stream gauge, monitoring well, aerial photos, previous inspections), if available:
Remarks:
Project Site: San Francisquito Creek Flood Protection Project

US Army Corps of Engineers Arid West – Version 2.0 (modified)
WETLAND DETERMINATION DATA FORM – Arid West Region
VEGETATION
Tree Stratum (Plot size r = 30 ft.) Absolute % Cover
Dominant Species?
Indicator Status
Dominance Test Worksheet:
1. Number of Dominant Species That Are OBL, FACW, or FAC:
1 (A) 2.
3. Total Number of Dominant Species Across All Strata:
1 (B) 4.
= Total Cover Percent of Dominant Species That Are OBL, FACW, or FAC:
100 (A/B) Sapling/Shrub Stratum (Plot size r = 5 ft.)
1. Prevalence Index Worksheet:
2. Total % Cover of: Multiply by:
3. OBL species x1 =
4. FACW species x2 =
5. FAC species x3 =
= Total Cover FACU species x4 =
Herb Stratum (Plot size r = 5 ft.) UPL species x5 =
1. Salicornia virginica 100 Y OBL Column Totals: (A) (B)
2. Distichlis spicata 5 N FACW Prevalence Index = B/A =
3. Hydrophytic Vegetation Indicators:
4. X Dominance Test is >50%
5. Prevalence Index is <3.01
6.
Morphological Adaptations1 (Provide supporting data in Remarks or on a separate sheet) 7.
8. Problematic Hydrophytic Vegetation1 (Explain)
105 = Total Cover
1Indicators of hydric soil and wetland hydrology must be present, unless disturbed or problematic.
Woody Vine Stratum (Plot size r = 30 ft.)
1.
2.
Hydrophytic Vegetation Present? Yes No
= Total Cover
% Bare Ground in Herb Stratum 0 % Cover of Biotic Crust 0
Remarks:
Project Site: San Francisquito Creek Flood Protection Project City/County: East Palo Alto/San Mateo Sampling Point: 21
Applicant/Owner: San Francisquito Creek Joint Powers Authority State: CA Sampling Date: July 7, 2010
Investigator(s): Butterworth, Valerius Section, Township, Range: Photo No:
Landform (hillslope, terrace, etc.): Salt marsh Land Surface Shape (concave, convex, planar):
Planar Slope (%): 0
Subregion (LRR): C Lat: Long: Datum:
Soil Map Unit Name: Novato clay, 0 to 1 percent slopes (117) NWI classification:
Are climatic / hydrologic conditions on the site typical for this time of year? Yes No (If no, explain in Remarks.)
Are Vegetation , Soil , Or Hydrology , significantly disturbed? Are “Normal Circumstances” present? Yes No
Are Vegetation , Soil , Or Hydrology , naturally problematic? (If needed, explain any answers in Remarks.)
SUMMARY OF FINDINGS – Attach site map showing sampling point locations, transects, important features, etc.
Hydrophytic Vegetation Present? Yes No
Is the Sampling Area within a Wetland? Yes No Hydric Soil Present? Yes No
Wetland Hydrology Present? Yes No
Remarks:

US Army Corps of Engineers Arid West – Version 2.0 (modified)
SOIL Sampling Point: 21
Profile Description: (Describe to the depth needed to document the indicator or confirm the absence of indicators.)
Depth Matrix Redox Features
(inches) Color (moist) % Color (Moist) % Type1 Loc2 Texture Horizon Remarks
0-11 10YR4/1 85 5YR4/6 15 C M sic A
1Type: C= Concentration, D=Depletion, RM=Reduced Matrix, CS=Covered or Coated Sand Grains. 2Location: PL=Pore Lining, LRC=Living Root Channel, M=Matrix.
Hydric Soil Indicators: (Applicable to all LRRs, unless otherwise noted.) Indicators for Problematic Hydric Soils3:
Histosol (A1) Sandy Redox (S5) 1 cm Muck (A9) (LRR C)
Histic Epipedon (A2) Stripped Matrix (S6) 2 cm Muck (A10) (LRR B)
Black Histic (A3) Loamy Mucky Mineral (F1) Reduced Vertic (F18)
Hydrogen Sulfide (A4) Loamy Gleyed Matrix (F2) Red Parent Material (TF2)
Stratified Layers (A5) (LRR C) Depleted Matrix (F3) Other (Explain in Remarks)
1 cm Muck (A9) (LRR D) Redox Dark Surface (F6)
3Indicators of hydrophytic vegetation and wetland hydrology must be present.
Depleted Below Dark Surface (A11) Depleted Dark Surface (F7)
Thick Dark Surface (A12) Redox Depressions (F8)
Sandy Mucky Mineral (S1) Vernal Pools (F9)
Sandy Gleyed Matrix (S4)
Restrictive Layer (if present):
Hydric Soils Present? Yes No
Type:
Depth (Inches):
Remarks:
HYDROLOGY Wetland Hydrology Indicators:
Primary Indicators (any one indicator is sufficient) Secondary Indicators (2 or more required)
Surface Water (A1) Salt Crust (B11) Water Marks (B1) (Riverine)
High Water Table (A2) Biotic Crust (B12) Sediment Deposits (B2) (Riverine)
Saturation (A3) Aquatic Invertebrates (B13) Drift Deposits (B3) (Riverine)
Water Marks (B1) (Nonriverine) Hydrogen Sulfide Odor (C1) Drainage Patterns (B10)
Sediment Deposits (B2) (Nonriverine) Oxidized Rhizospheres along Living Roots (C3) Dry-Season Water Table (C2)
Drift Deposits (B3) (Nonriverine) Presence of Reduced Iron (C4) Crayfish Burrows (C8)
Surface Soil Cracks (B6) Recent Iron Reduction in Tilled Soils (C6) Saturation Visible on Aerial Imagery (C9)
Inundation Visible on Aerial Imagery (B7) Thin Muck Surface (C7) Shallow Aquitard (D3)
Water-Stained Leaves (B9) Other (Explain in Remarks) FAC-Neutral Test (D5)
Field Observations:
Surface Water Present? Yes No Depth (inches): n/a Wetland Hydrology Present?
Yes
No
Water Table Present? Yes No Depth (inches): 10 *
Saturation Present? (includes capillary fringe)
Yes No Depth (inches): 3
Describe Recorded Data (stream gauge, monitoring well, aerial photos, previous inspections), if available:
Remarks: * Water table not yet stabilized.
Project Site: San Francisquito Creek Flood Protection Project

US Army Corps of Engineers Arid West – Version 2.0 (modified)
WETLAND DETERMINATION DATA FORM – Arid West Region
VEGETATION
Tree Stratum (Plot size r = 30 ft.) Absolute % Cover
Dominant Species?
Indicator Status
Dominance Test Worksheet:
1. Number of Dominant Species That Are OBL, FACW, or FAC:
1 (A) 2.
3. Total Number of Dominant Species Across All Strata:
3 (B) 4.
= Total Cover Percent of Dominant Species That Are OBL, FACW, or FAC:
33 (A/B) Sapling/Shrub Stratum (Plot size r = 5 ft.)
1. Prevalence Index Worksheet:
2. Total % Cover of: Multiply by:
3. OBL species x1 =
4. FACW species x2 =
5. FAC species x3 =
= Total Cover FACU species x4 =
Herb Stratum (Plot size r = 5 ft.) UPL species x5 =
1. Brassica nigra 60 Y NL Column Totals: (A) (B)
2. Carduus pycnocephalus 20 Y NL Prevalence Index = B/A =
3. Salicornia virginica 20 Y OBL Hydrophytic Vegetation Indicators:
4. Dominance Test is >50%
5. Prevalence Index is <3.01
6.
Morphological Adaptations1 (Provide supporting data in Remarks or on a separate sheet) 7.
8. Problematic Hydrophytic Vegetation1 (Explain)
100 = Total Cover
1Indicators of hydric soil and wetland hydrology must be present, unless disturbed or problematic.
Woody Vine Stratum (Plot size r = 30 ft.)
1.
2.
Hydrophytic Vegetation Present? Yes No
= Total Cover
% Bare Ground in Herb Stratum 0 % Cover of Biotic Crust 0
Remarks:
Project Site: San Francisquito Creek Flood Protection Project City/County: East Palo Alto/San Mateo Sampling Point: 22
Applicant/Owner: San Francisquito Creek Joint Powers Authority State: CA Sampling Date: July 7, 2010
Investigator(s): Butterworth, Valerius Section, Township, Range: Photo No:
Landform (hillslope, terrace, etc.): Levee slope near toe Land Surface Shape (concave, convex, planar):
Planar Slope (%): 30
Subregion (LRR): C Lat: Long: Datum:
Soil Map Unit Name: Novato clay, 0 to 1 percent slopes (117) NWI classification:
Are climatic / hydrologic conditions on the site typical for this time of year? Yes No (If no, explain in Remarks.)
Are Vegetation , Soil , Or Hydrology , significantly disturbed? Are “Normal Circumstances” present? Yes No
Are Vegetation , Soil , Or Hydrology , naturally problematic? (If needed, explain any answers in Remarks.)
SUMMARY OF FINDINGS – Attach site map showing sampling point locations, transects, important features, etc.
Hydrophytic Vegetation Present? Yes No
Is the Sampling Area within a Wetland? Yes No Hydric Soil Present? Yes No
Wetland Hydrology Present? Yes No
Remarks:

US Army Corps of Engineers Arid West – Version 2.0 (modified)
SOIL Sampling Point: 22
Profile Description: (Describe to the depth needed to document the indicator or confirm the absence of indicators.)
Depth Matrix Redox Features
(inches) Color (moist) % Color (Moist) % Type1 Loc2 Texture Horizon Remarks
0-13 10YR3/2 100 c Fill
13-19 10YR3/1 95 7.5YR4/6 5 C PL c Ab
1Type: C= Concentration, D=Depletion, RM=Reduced Matrix, CS=Covered or Coated Sand Grains. 2Location: PL=Pore Lining, LRC=Living Root Channel, M=Matrix.
Hydric Soil Indicators: (Applicable to all LRRs, unless otherwise noted.) Indicators for Problematic Hydric Soils3:
Histosol (A1) Sandy Redox (S5) 1 cm Muck (A9) (LRR C)
Histic Epipedon (A2) Stripped Matrix (S6) 2 cm Muck (A10) (LRR B)
Black Histic (A3) Loamy Mucky Mineral (F1) Reduced Vertic (F18)
Hydrogen Sulfide (A4) Loamy Gleyed Matrix (F2) Red Parent Material (TF2)
Stratified Layers (A5) (LRR C) Depleted Matrix (F3) Other (Explain in Remarks)
1 cm Muck (A9) (LRR D) Redox Dark Surface (F6)
3Indicators of hydrophytic vegetation and wetland hydrology must be present.
Depleted Below Dark Surface (A11) Depleted Dark Surface (F7)
Thick Dark Surface (A12) Redox Depressions (F8)
Sandy Mucky Mineral (S1) Vernal Pools (F9)
Sandy Gleyed Matrix (S4)
Restrictive Layer (if present):
Hydric Soils Present? Yes No
Type:
Depth (Inches):
Remarks:
HYDROLOGY Wetland Hydrology Indicators:
Primary Indicators (any one indicator is sufficient) Secondary Indicators (2 or more required)
Surface Water (A1) Salt Crust (B11) Water Marks (B1) (Riverine)
High Water Table (A2) Biotic Crust (B12) Sediment Deposits (B2) (Riverine)
Saturation (A3) Aquatic Invertebrates (B13) Drift Deposits (B3) (Riverine)
Water Marks (B1) (Nonriverine) Hydrogen Sulfide Odor (C1) Drainage Patterns (B10)
Sediment Deposits (B2) (Nonriverine) Oxidized Rhizospheres along Living Roots (C3) Dry-Season Water Table (C2)
Drift Deposits (B3) (Nonriverine) Presence of Reduced Iron (C4) Crayfish Burrows (C8)
Surface Soil Cracks (B6) Recent Iron Reduction in Tilled Soils (C6) Saturation Visible on Aerial Imagery (C9)
Inundation Visible on Aerial Imagery (B7) Thin Muck Surface (C7) Shallow Aquitard (D3)
Water-Stained Leaves (B9) Other (Explain in Remarks) FAC-Neutral Test (D5)
Field Observations:
Surface Water Present? Yes No Depth (inches): n/a Wetland Hydrology Present?
Yes
No
Water Table Present? Yes No Depth (inches): None to 19
Saturation Present? (includes capillary fringe)
Yes No Depth (inches): None to 19
Describe Recorded Data (stream gauge, monitoring well, aerial photos, previous inspections), if available:
Remarks:
Project Site: San Francisquito Creek Flood Protection Project
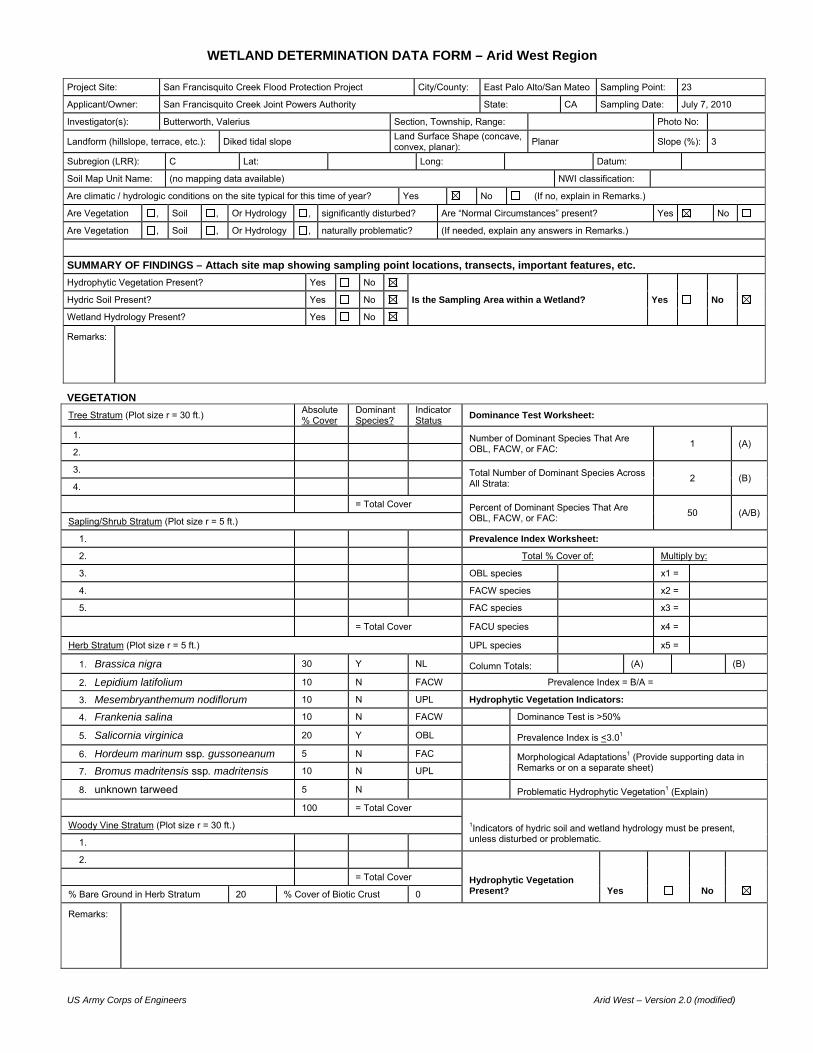
US Army Corps of Engineers Arid West – Version 2.0 (modified)
WETLAND DETERMINATION DATA FORM – Arid West Region
VEGETATION
Tree Stratum (Plot size r = 30 ft.) Absolute % Cover
Dominant Species?
Indicator Status
Dominance Test Worksheet:
1. Number of Dominant Species That Are OBL, FACW, or FAC:
1 (A) 2.
3. Total Number of Dominant Species Across All Strata:
2 (B) 4.
= Total Cover Percent of Dominant Species That Are OBL, FACW, or FAC:
50 (A/B) Sapling/Shrub Stratum (Plot size r = 5 ft.)
1. Prevalence Index Worksheet:
2. Total % Cover of: Multiply by:
3. OBL species x1 =
4. FACW species x2 =
5. FAC species x3 =
= Total Cover FACU species x4 =
Herb Stratum (Plot size r = 5 ft.) UPL species x5 =
1. Brassica nigra 30 Y NL Column Totals: (A) (B)
2. Lepidium latifolium 10 N FACW Prevalence Index = B/A =
3. Mesembryanthemum nodiflorum 10 N UPL Hydrophytic Vegetation Indicators:
4. Frankenia salina 10 N FACW Dominance Test is >50%
5. Salicornia virginica 20 Y OBL Prevalence Index is <3.01
6. Hordeum marinum ssp. gussoneanum 5 N FAC
Morphological Adaptations1 (Provide supporting data in Remarks or on a separate sheet) 7. Bromus madritensis ssp. madritensis 10 N UPL
8. unknown tarweed 5 N Problematic Hydrophytic Vegetation1 (Explain)
100 = Total Cover
1Indicators of hydric soil and wetland hydrology must be present, unless disturbed or problematic.
Woody Vine Stratum (Plot size r = 30 ft.)
1.
2.
Hydrophytic Vegetation Present? Yes No
= Total Cover
% Bare Ground in Herb Stratum 20 % Cover of Biotic Crust 0
Remarks:
Project Site: San Francisquito Creek Flood Protection Project City/County: East Palo Alto/San Mateo Sampling Point: 23
Applicant/Owner: San Francisquito Creek Joint Powers Authority State: CA Sampling Date: July 7, 2010
Investigator(s): Butterworth, Valerius Section, Township, Range: Photo No:
Landform (hillslope, terrace, etc.): Diked tidal slope Land Surface Shape (concave, convex, planar):
Planar Slope (%): 3
Subregion (LRR): C Lat: Long: Datum:
Soil Map Unit Name: (no mapping data available) NWI classification:
Are climatic / hydrologic conditions on the site typical for this time of year? Yes No (If no, explain in Remarks.)
Are Vegetation , Soil , Or Hydrology , significantly disturbed? Are “Normal Circumstances” present? Yes No
Are Vegetation , Soil , Or Hydrology , naturally problematic? (If needed, explain any answers in Remarks.)
SUMMARY OF FINDINGS – Attach site map showing sampling point locations, transects, important features, etc.
Hydrophytic Vegetation Present? Yes No
Is the Sampling Area within a Wetland? Yes No Hydric Soil Present? Yes No
Wetland Hydrology Present? Yes No
Remarks:

US Army Corps of Engineers Arid West – Version 2.0 (modified)
SOIL Sampling Point: 23
Profile Description: (Describe to the depth needed to document the indicator or confirm the absence of indicators.)
Depth Matrix Redox Features
(inches) Color (moist) % Color (Moist) % Type1 Loc2 Texture Horizon Remarks
0-10 10YR3/1 100 grcl Fill 1
10-12 10YR3/2 95 10YR3/4 5 C M grcl Fill 2
1Type: C= Concentration, D=Depletion, RM=Reduced Matrix, CS=Covered or Coated Sand Grains. 2Location: PL=Pore Lining, LRC=Living Root Channel, M=Matrix.
Hydric Soil Indicators: (Applicable to all LRRs, unless otherwise noted.) Indicators for Problematic Hydric Soils3:
Histosol (A1) Sandy Redox (S5) 1 cm Muck (A9) (LRR C)
Histic Epipedon (A2) Stripped Matrix (S6) 2 cm Muck (A10) (LRR B)
Black Histic (A3) Loamy Mucky Mineral (F1) Reduced Vertic (F18)
Hydrogen Sulfide (A4) Loamy Gleyed Matrix (F2) Red Parent Material (TF2)
Stratified Layers (A5) (LRR C) Depleted Matrix (F3) Other (Explain in Remarks)
1 cm Muck (A9) (LRR D) Redox Dark Surface (F6)
3Indicators of hydrophytic vegetation and wetland hydrology must be present.
Depleted Below Dark Surface (A11) Depleted Dark Surface (F7)
Thick Dark Surface (A12) Redox Depressions (F8)
Sandy Mucky Mineral (S1) Vernal Pools (F9)
Sandy Gleyed Matrix (S4)
Restrictive Layer (if present):
Hydric Soils Present? Yes No
Type:
Depth (Inches):
Remarks: Refusal at 12” by gravel.
HYDROLOGY Wetland Hydrology Indicators:
Primary Indicators (any one indicator is sufficient) Secondary Indicators (2 or more required)
Surface Water (A1) Salt Crust (B11) Water Marks (B1) (Riverine)
High Water Table (A2) Biotic Crust (B12) Sediment Deposits (B2) (Riverine)
Saturation (A3) Aquatic Invertebrates (B13) Drift Deposits (B3) (Riverine)
Water Marks (B1) (Nonriverine) Hydrogen Sulfide Odor (C1) Drainage Patterns (B10)
Sediment Deposits (B2) (Nonriverine) Oxidized Rhizospheres along Living Roots (C3) Dry-Season Water Table (C2)
Drift Deposits (B3) (Nonriverine) Presence of Reduced Iron (C4) Crayfish Burrows (C8)
Surface Soil Cracks (B6) Recent Iron Reduction in Tilled Soils (C6) Saturation Visible on Aerial Imagery (C9)
Inundation Visible on Aerial Imagery (B7) Thin Muck Surface (C7) Shallow Aquitard (D3)
Water-Stained Leaves (B9) Other (Explain in Remarks) FAC-Neutral Test (D5)
Field Observations:
Surface Water Present? Yes No Depth (inches): n/a Wetland Hydrology Present?
Yes
No
Water Table Present? Yes No Depth (inches): None to 12
Saturation Present? (includes capillary fringe)
Yes No Depth (inches): None to 12
Describe Recorded Data (stream gauge, monitoring well, aerial photos, previous inspections), if available:
Remarks:
Project Site: San Francisquito Creek Flood Protection Project

US Army Corps of Engineers Arid West – Version 2.0 (modified)
WETLAND DETERMINATION DATA FORM – Arid West Region
VEGETATION
Tree Stratum (Plot size r = 30 ft.) Absolute % Cover
Dominant Species?
Indicator Status
Dominance Test Worksheet:
1. Number of Dominant Species That Are OBL, FACW, or FAC:
1 (A) 2.
3. Total Number of Dominant Species Across All Strata:
1 (B) 4.
= Total Cover Percent of Dominant Species That Are OBL, FACW, or FAC:
100 (A/B) Sapling/Shrub Stratum (Plot size r = 5 ft.)
1. Prevalence Index Worksheet:
2. Total % Cover of: Multiply by:
3. OBL species x1 =
4. FACW species x2 =
5. FAC species x3 =
= Total Cover FACU species x4 =
Herb Stratum (Plot size r = 5 ft.) UPL species x5 =
1. Salicornia virginica 65 Y OBL Column Totals: (A) (B)
2. Prevalence Index = B/A =
3. Hydrophytic Vegetation Indicators:
4. X Dominance Test is >50%
5. Prevalence Index is <3.01
6.
Morphological Adaptations1 (Provide supporting data in Remarks or on a separate sheet) 7.
8. Problematic Hydrophytic Vegetation1 (Explain)
65 = Total Cover
1Indicators of hydric soil and wetland hydrology must be present, unless disturbed or problematic.
Woody Vine Stratum (Plot size r = 30 ft.)
1.
2.
Hydrophytic Vegetation Present? Yes No
= Total Cover
% Bare Ground in Herb Stratum 35 % Cover of Biotic Crust 0
Remarks:
Project Site: San Francisquito Creek Flood Protection Project City/County: East Palo Alto/San Mateo Sampling Point: 24
Applicant/Owner: San Francisquito Creek Joint Powers Authority State: CA Sampling Date: July 7, 2010
Investigator(s): Butterworth, Valerius Section, Township, Range: Photo No:
Landform (hillslope, terrace, etc.): Diked tidal marsh Land Surface Shape (concave, convex, planar):
Concave Slope (%): 1
Subregion (LRR): C Lat: Long: Datum:
Soil Map Unit Name: (no mapping data available) NWI classification:
Are climatic / hydrologic conditions on the site typical for this time of year? Yes No (If no, explain in Remarks.)
Are Vegetation , Soil , Or Hydrology , significantly disturbed? Are “Normal Circumstances” present? Yes No
Are Vegetation , Soil , Or Hydrology , naturally problematic? (If needed, explain any answers in Remarks.)
SUMMARY OF FINDINGS – Attach site map showing sampling point locations, transects, important features, etc.
Hydrophytic Vegetation Present? Yes No
Is the Sampling Area within a Wetland? Yes No Hydric Soil Present? Yes No
Wetland Hydrology Present? Yes No
Remarks:

US Army Corps of Engineers Arid West – Version 2.0 (modified)
SOIL Sampling Point: 24
Profile Description: (Describe to the depth needed to document the indicator or confirm the absence of indicators.)
Depth Matrix Redox Features
(inches) Color (moist) % Color (Moist) % Type1 Loc2 Texture Horizon Remarks
0-17 10YR4/1 65 5YR4/6 35 C M sic A
1Type: C= Concentration, D=Depletion, RM=Reduced Matrix, CS=Covered or Coated Sand Grains. 2Location: PL=Pore Lining, LRC=Living Root Channel, M=Matrix.
Hydric Soil Indicators: (Applicable to all LRRs, unless otherwise noted.) Indicators for Problematic Hydric Soils3:
Histosol (A1) Sandy Redox (S5) 1 cm Muck (A9) (LRR C)
Histic Epipedon (A2) Stripped Matrix (S6) 2 cm Muck (A10) (LRR B)
Black Histic (A3) Loamy Mucky Mineral (F1) Reduced Vertic (F18)
Hydrogen Sulfide (A4) Loamy Gleyed Matrix (F2) Red Parent Material (TF2)
Stratified Layers (A5) (LRR C) Depleted Matrix (F3) Other (Explain in Remarks)
1 cm Muck (A9) (LRR D) Redox Dark Surface (F6)
3Indicators of hydrophytic vegetation and wetland hydrology must be present.
Depleted Below Dark Surface (A11) Depleted Dark Surface (F7)
Thick Dark Surface (A12) Redox Depressions (F8)
Sandy Mucky Mineral (S1) Vernal Pools (F9)
Sandy Gleyed Matrix (S4)
Restrictive Layer (if present):
Hydric Soils Present? Yes No
Type:
Depth (Inches):
Remarks:
HYDROLOGY Wetland Hydrology Indicators:
Primary Indicators (any one indicator is sufficient) Secondary Indicators (2 or more required)
Surface Water (A1) Salt Crust (B11) Water Marks (B1) (Riverine)
High Water Table (A2) Biotic Crust (B12) Sediment Deposits (B2) (Riverine)
Saturation (A3) Aquatic Invertebrates (B13) Drift Deposits (B3) (Riverine)
Water Marks (B1) (Nonriverine) Hydrogen Sulfide Odor (C1) Drainage Patterns (B10)
Sediment Deposits (B2) (Nonriverine) Oxidized Rhizospheres along Living Roots (C3) Dry-Season Water Table (C2)
Drift Deposits (B3) (Nonriverine) Presence of Reduced Iron (C4) Crayfish Burrows (C8)
Surface Soil Cracks (B6) Recent Iron Reduction in Tilled Soils (C6) Saturation Visible on Aerial Imagery (C9)
Inundation Visible on Aerial Imagery (B7) Thin Muck Surface (C7) Shallow Aquitard (D3)
Water-Stained Leaves (B9) Other (Explain in Remarks) FAC-Neutral Test (D5)
Field Observations:
Surface Water Present? Yes No Depth (inches): n/a Wetland Hydrology Present?
Yes
No
Water Table Present? Yes No Depth (inches): None to 17
Saturation Present? (includes capillary fringe)
Yes No Depth (inches): None to 17
Describe Recorded Data (stream gauge, monitoring well, aerial photos, previous inspections), if available:
Remarks:
Project Site: San Francisquito Creek Flood Protection Project

US Army Corps of Engineers Arid West – Version 2.0 (modified)
WETLAND DETERMINATION DATA FORM – Arid West Region
VEGETATION
Tree Stratum (Plot size r = 30 ft.) Absolute % Cover
Dominant Species?
Indicator Status
Dominance Test Worksheet:
1. Number of Dominant Species That Are OBL, FACW, or FAC:
1 (A) 2.
3. Total Number of Dominant Species Across All Strata:
1 (B) 4.
= Total Cover Percent of Dominant Species That Are OBL, FACW, or FAC:
100 (A/B) Sapling/Shrub Stratum (Plot size r = 5 ft.)
1. Prevalence Index Worksheet:
2. Total % Cover of: Multiply by:
3. OBL species x1 =
4. FACW species x2 =
5. FAC species x3 =
= Total Cover FACU species x4 =
Herb Stratum (Plot size r = 5 ft.) UPL species x5 =
1. Salicornia virginica 100 Y OBL Column Totals: (A) (B)
2. Prevalence Index = B/A =
3. Hydrophytic Vegetation Indicators:
4. X Dominance Test is >50%
5. Prevalence Index is <3.01
6.
Morphological Adaptations1 (Provide supporting data in Remarks or on a separate sheet) 7.
8. Problematic Hydrophytic Vegetation1 (Explain)
100 = Total Cover
1Indicators of hydric soil and wetland hydrology must be present, unless disturbed or problematic.
Woody Vine Stratum (Plot size r = 30 ft.)
1.
2.
Hydrophytic Vegetation Present? Yes No
= Total Cover
% Bare Ground in Herb Stratum 10 % Cover of Biotic Crust 0
Remarks:
Project Site: San Francisquito Creek Flood Protection Project City/County: East Palo Alto/San Mateo Sampling Point: 25
Applicant/Owner: San Francisquito Creek Joint Powers Authority State: CA Sampling Date: July 7, 2010
Investigator(s): Butterworth, Valerius Section, Township, Range: Photo No:
Landform (hillslope, terrace, etc.): Diked tidal marsh Land Surface Shape (concave, convex, planar):
Planar Slope (%): 2-5
Subregion (LRR): C Lat: Long: Datum:
Soil Map Unit Name: (no mapping data available) NWI classification:
Are climatic / hydrologic conditions on the site typical for this time of year? Yes No (If no, explain in Remarks.)
Are Vegetation , Soil , Or Hydrology , significantly disturbed? Are “Normal Circumstances” present? Yes No
Are Vegetation , Soil , Or Hydrology , naturally problematic? (If needed, explain any answers in Remarks.)
SUMMARY OF FINDINGS – Attach site map showing sampling point locations, transects, important features, etc.
Hydrophytic Vegetation Present? Yes No
Is the Sampling Area within a Wetland? Yes No Hydric Soil Present? Yes No
Wetland Hydrology Present? Yes No
Remarks:

US Army Corps of Engineers Arid West – Version 2.0 (modified)
SOIL Sampling Point: 25
Profile Description: (Describe to the depth needed to document the indicator or confirm the absence of indicators.)
Depth Matrix Redox Features
(inches) Color (moist) % Color (Moist) % Type1 Loc2 Texture Horizon Remarks
0-5 10YR3/1 100 vgrl Fill
5-12 10YR3/2 85 7.5YR4/6 15 C PL c Ab
1Type: C= Concentration, D=Depletion, RM=Reduced Matrix, CS=Covered or Coated Sand Grains. 2Location: PL=Pore Lining, LRC=Living Root Channel, M=Matrix.
Hydric Soil Indicators: (Applicable to all LRRs, unless otherwise noted.) Indicators for Problematic Hydric Soils3:
Histosol (A1) Sandy Redox (S5) 1 cm Muck (A9) (LRR C)
Histic Epipedon (A2) Stripped Matrix (S6) 2 cm Muck (A10) (LRR B)
Black Histic (A3) Loamy Mucky Mineral (F1) Reduced Vertic (F18)
Hydrogen Sulfide (A4) Loamy Gleyed Matrix (F2) Red Parent Material (TF2)
Stratified Layers (A5) (LRR C) Depleted Matrix (F3) Other (Explain in Remarks)
1 cm Muck (A9) (LRR D) Redox Dark Surface (F6)
3Indicators of hydrophytic vegetation and wetland hydrology must be present.
Depleted Below Dark Surface (A11) Depleted Dark Surface (F7)
Thick Dark Surface (A12) Redox Depressions (F8)
Sandy Mucky Mineral (S1) Vernal Pools (F9)
Sandy Gleyed Matrix (S4)
Restrictive Layer (if present):
Hydric Soils Present? Yes No
Type:
Depth (Inches):
Remarks:
HYDROLOGY Wetland Hydrology Indicators:
Primary Indicators (any one indicator is sufficient) Secondary Indicators (2 or more required)
Surface Water (A1) Salt Crust (B11) Water Marks (B1) (Riverine)
High Water Table (A2) Biotic Crust (B12) Sediment Deposits (B2) (Riverine)
Saturation (A3) Aquatic Invertebrates (B13) Drift Deposits (B3) (Riverine)
Water Marks (B1) (Nonriverine) Hydrogen Sulfide Odor (C1) Drainage Patterns (B10)
Sediment Deposits (B2) (Nonriverine) Oxidized Rhizospheres along Living Roots (C3) Dry-Season Water Table (C2)
Drift Deposits (B3) (Nonriverine) Presence of Reduced Iron (C4) Crayfish Burrows (C8)
Surface Soil Cracks (B6) Recent Iron Reduction in Tilled Soils (C6) Saturation Visible on Aerial Imagery (C9)
Inundation Visible on Aerial Imagery (B7) Thin Muck Surface (C7) Shallow Aquitard (D3)
Water-Stained Leaves (B9) Other (Explain in Remarks) FAC-Neutral Test (D5)
Field Observations:
Surface Water Present? Yes No Depth (inches): n/a Wetland Hydrology Present?
Yes
No
Water Table Present? Yes No Depth (inches): None to 12
Saturation Present? (includes capillary fringe)
Yes No Depth (inches): None to 12
Describe Recorded Data (stream gauge, monitoring well, aerial photos, previous inspections), if available:
Remarks:
Project Site: San Francisquito Creek Flood Protection Project

US Army Corps of Engineers Arid West – Version 2.0 (modified)
WETLAND DETERMINATION DATA FORM – Arid West Region
VEGETATION
Tree Stratum (Plot size r = 30 ft.) Absolute % Cover
Dominant Species?
Indicator Status
Dominance Test Worksheet:
1. Number of Dominant Species That Are OBL, FACW, or FAC:
1 (A) 2.
3. Total Number of Dominant Species Across All Strata:
1 (B) 4.
= Total Cover Percent of Dominant Species That Are OBL, FACW, or FAC:
100 (A/B) Sapling/Shrub Stratum (Plot size r = 5 ft.)
1. Prevalence Index Worksheet:
2. Total % Cover of: Multiply by:
3. OBL species x1 =
4. FACW species x2 =
5. FAC species x3 =
= Total Cover FACU species x4 =
Herb Stratum (Plot size r = 5 ft.) UPL species x5 =
1. Salicornia virginica 100 Y OBL Column Totals: (A) (B)
2. Prevalence Index = B/A =
3. Hydrophytic Vegetation Indicators:
4. X Dominance Test is >50%
5. Prevalence Index is <3.01
6.
Morphological Adaptations1 (Provide supporting data in Remarks or on a separate sheet) 7.
8. Problematic Hydrophytic Vegetation1 (Explain)
100 = Total Cover
1Indicators of hydric soil and wetland hydrology must be present, unless disturbed or problematic.
Woody Vine Stratum (Plot size r = 30 ft.)
1.
2.
Hydrophytic Vegetation Present? Yes No
= Total Cover
% Bare Ground in Herb Stratum 10 % Cover of Biotic Crust 0
Remarks:
Project Site: San Francisquito Creek Flood Protection Project City/County: East Palo Alto/San Mateo Sampling Point: 26
Applicant/Owner: San Francisquito Creek Joint Powers Authority State: CA Sampling Date: July 7, 2010
Investigator(s): Butterworth, Valerius Section, Township, Range: Photo No:
Landform (hillslope, terrace, etc.): Diked tidal marsh Land Surface Shape (concave, convex, planar):
Planar Slope (%): 2
Subregion (LRR): C Lat: Long: Datum:
Soil Map Unit Name: (no mapping data available) NWI classification:
Are climatic / hydrologic conditions on the site typical for this time of year? Yes No (If no, explain in Remarks.)
Are Vegetation , Soil , Or Hydrology , significantly disturbed? Are “Normal Circumstances” present? Yes No
Are Vegetation , Soil , Or Hydrology , naturally problematic? (If needed, explain any answers in Remarks.)
SUMMARY OF FINDINGS – Attach site map showing sampling point locations, transects, important features, etc.
Hydrophytic Vegetation Present? Yes No
Is the Sampling Area within a Wetland? Yes No Hydric Soil Present? Yes No
Wetland Hydrology Present? Yes No
Remarks:
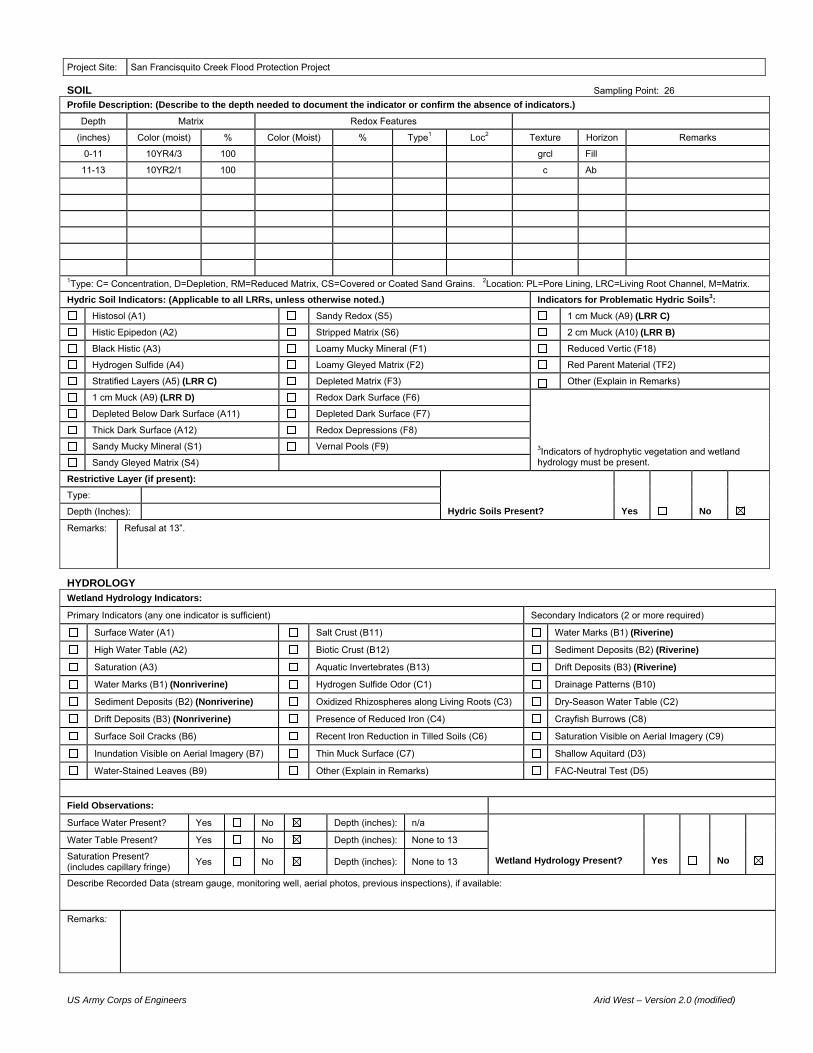
US Army Corps of Engineers Arid West – Version 2.0 (modified)
SOIL Sampling Point: 26
Profile Description: (Describe to the depth needed to document the indicator or confirm the absence of indicators.)
Depth Matrix Redox Features
(inches) Color (moist) % Color (Moist) % Type1 Loc2 Texture Horizon Remarks
0-11 10YR4/3 100 grcl Fill
11-13 10YR2/1 100 c Ab
1Type: C= Concentration, D=Depletion, RM=Reduced Matrix, CS=Covered or Coated Sand Grains. 2Location: PL=Pore Lining, LRC=Living Root Channel, M=Matrix.
Hydric Soil Indicators: (Applicable to all LRRs, unless otherwise noted.) Indicators for Problematic Hydric Soils3:
Histosol (A1) Sandy Redox (S5) 1 cm Muck (A9) (LRR C)
Histic Epipedon (A2) Stripped Matrix (S6) 2 cm Muck (A10) (LRR B)
Black Histic (A3) Loamy Mucky Mineral (F1) Reduced Vertic (F18)
Hydrogen Sulfide (A4) Loamy Gleyed Matrix (F2) Red Parent Material (TF2)
Stratified Layers (A5) (LRR C) Depleted Matrix (F3) Other (Explain in Remarks)
1 cm Muck (A9) (LRR D) Redox Dark Surface (F6)
3Indicators of hydrophytic vegetation and wetland hydrology must be present.
Depleted Below Dark Surface (A11) Depleted Dark Surface (F7)
Thick Dark Surface (A12) Redox Depressions (F8)
Sandy Mucky Mineral (S1) Vernal Pools (F9)
Sandy Gleyed Matrix (S4)
Restrictive Layer (if present):
Hydric Soils Present? Yes No
Type:
Depth (Inches):
Remarks: Refusal at 13”.
HYDROLOGY Wetland Hydrology Indicators:
Primary Indicators (any one indicator is sufficient) Secondary Indicators (2 or more required)
Surface Water (A1) Salt Crust (B11) Water Marks (B1) (Riverine)
High Water Table (A2) Biotic Crust (B12) Sediment Deposits (B2) (Riverine)
Saturation (A3) Aquatic Invertebrates (B13) Drift Deposits (B3) (Riverine)
Water Marks (B1) (Nonriverine) Hydrogen Sulfide Odor (C1) Drainage Patterns (B10)
Sediment Deposits (B2) (Nonriverine) Oxidized Rhizospheres along Living Roots (C3) Dry-Season Water Table (C2)
Drift Deposits (B3) (Nonriverine) Presence of Reduced Iron (C4) Crayfish Burrows (C8)
Surface Soil Cracks (B6) Recent Iron Reduction in Tilled Soils (C6) Saturation Visible on Aerial Imagery (C9)
Inundation Visible on Aerial Imagery (B7) Thin Muck Surface (C7) Shallow Aquitard (D3)
Water-Stained Leaves (B9) Other (Explain in Remarks) FAC-Neutral Test (D5)
Field Observations:
Surface Water Present? Yes No Depth (inches): n/a Wetland Hydrology Present?
Yes
No
Water Table Present? Yes No Depth (inches): None to 13
Saturation Present? (includes capillary fringe)
Yes No Depth (inches): None to 13
Describe Recorded Data (stream gauge, monitoring well, aerial photos, previous inspections), if available:
Remarks:
Project Site: San Francisquito Creek Flood Protection Project

US Army Corps of Engineers Arid West – Version 2.0 (modified)
WETLAND DETERMINATION DATA FORM – Arid West Region
VEGETATION
Tree Stratum (Plot size r = 30 ft.) Absolute % Cover
Dominant Species?
Indicator Status
Dominance Test Worksheet:
1. Number of Dominant Species That Are OBL, FACW, or FAC:
2 (A) 2.
3. Total Number of Dominant Species Across All Strata:
2 (B) 4.
= Total Cover Percent of Dominant Species That Are OBL, FACW, or FAC:
100 (A/B) Sapling/Shrub Stratum (Plot size r = 5 ft.)
1. Prevalence Index Worksheet:
2. Total % Cover of: Multiply by:
3. OBL species x1 =
4. FACW species x2 =
5. FAC species x3 =
= Total Cover FACU species x4 =
Herb Stratum (Plot size r = 5 ft.) UPL species x5 =
1. Salicornia virginica 60 Y OBL Column Totals: (A) (B)
2. Parapholis strigosa (?) 20 Y OBL Prevalence Index = B/A =
3. Hydrophytic Vegetation Indicators:
4. X Dominance Test is >50%
5. Prevalence Index is <3.01
6.
Morphological Adaptations1 (Provide supporting data in Remarks or on a separate sheet) 7.
8. Problematic Hydrophytic Vegetation1 (Explain)
80 = Total Cover
1Indicators of hydric soil and wetland hydrology must be present, unless disturbed or problematic.
Woody Vine Stratum (Plot size r = 30 ft.)
1.
2.
Hydrophytic Vegetation Present? Yes No
= Total Cover
% Bare Ground in Herb Stratum 20 % Cover of Biotic Crust 0
Remarks:
Project Site: San Francisquito Creek Flood Protection Project City/County: East Palo Alto/San Mateo Sampling Point: 27
Applicant/Owner: San Francisquito Creek Joint Powers Authority State: CA Sampling Date: July 7, 2010
Investigator(s): Butterworth, Valerius Section, Township, Range: Photo No: 0183
Landform (hillslope, terrace, etc.): Diked tidal marsh Land Surface Shape (concave, convex, planar):
Planar Slope (%): 0-2
Subregion (LRR): C Lat: Long: Datum:
Soil Map Unit Name: (no mapping data available) NWI classification:
Are climatic / hydrologic conditions on the site typical for this time of year? Yes No (If no, explain in Remarks.)
Are Vegetation , Soil , Or Hydrology , significantly disturbed? Are “Normal Circumstances” present? Yes No
Are Vegetation , Soil , Or Hydrology , naturally problematic? (If needed, explain any answers in Remarks.)
SUMMARY OF FINDINGS – Attach site map showing sampling point locations, transects, important features, etc.
Hydrophytic Vegetation Present? Yes No
Is the Sampling Area within a Wetland? Yes No Hydric Soil Present? Yes No
Wetland Hydrology Present? Yes No
Remarks:

US Army Corps of Engineers Arid West – Version 2.0 (modified)
SOIL Sampling Point: 27
Profile Description: (Describe to the depth needed to document the indicator or confirm the absence of indicators.)
Depth Matrix Redox Features
(inches) Color (moist) % Color (Moist) % Type1 Loc2 Texture Horizon Remarks
0-3 10YR4/2 90 7.5YR4/6 10 C M, PL sic A1
3-20 10YR4/1 80 7.5YR4/6 20 C M sic A2
1Type: C= Concentration, D=Depletion, RM=Reduced Matrix, CS=Covered or Coated Sand Grains. 2Location: PL=Pore Lining, LRC=Living Root Channel, M=Matrix.
Hydric Soil Indicators: (Applicable to all LRRs, unless otherwise noted.) Indicators for Problematic Hydric Soils3:
Histosol (A1) Sandy Redox (S5) 1 cm Muck (A9) (LRR C)
Histic Epipedon (A2) Stripped Matrix (S6) 2 cm Muck (A10) (LRR B)
Black Histic (A3) Loamy Mucky Mineral (F1) Reduced Vertic (F18)
Hydrogen Sulfide (A4) Loamy Gleyed Matrix (F2) Red Parent Material (TF2)
Stratified Layers (A5) (LRR C) Depleted Matrix (F3) Other (Explain in Remarks)
1 cm Muck (A9) (LRR D) Redox Dark Surface (F6)
3Indicators of hydrophytic vegetation and wetland hydrology must be present.
Depleted Below Dark Surface (A11) Depleted Dark Surface (F7)
Thick Dark Surface (A12) Redox Depressions (F8)
Sandy Mucky Mineral (S1) Vernal Pools (F9)
Sandy Gleyed Matrix (S4)
Restrictive Layer (if present):
Hydric Soils Present? Yes No
Type:
Depth (Inches):
Remarks:
HYDROLOGY Wetland Hydrology Indicators:
Primary Indicators (any one indicator is sufficient) Secondary Indicators (2 or more required)
Surface Water (A1) Salt Crust (B11) Water Marks (B1) (Riverine)
High Water Table (A2) Biotic Crust (B12) Sediment Deposits (B2) (Riverine)
Saturation (A3) Aquatic Invertebrates (B13) Drift Deposits (B3) (Riverine)
Water Marks (B1) (Nonriverine) Hydrogen Sulfide Odor (C1) Drainage Patterns (B10)
Sediment Deposits (B2) (Nonriverine) Oxidized Rhizospheres along Living Roots (C3) Dry-Season Water Table (C2)
Drift Deposits (B3) (Nonriverine) Presence of Reduced Iron (C4) Crayfish Burrows (C8)
Surface Soil Cracks (B6) Recent Iron Reduction in Tilled Soils (C6) Saturation Visible on Aerial Imagery (C9)
Inundation Visible on Aerial Imagery (B7) Thin Muck Surface (C7) Shallow Aquitard (D3)
Water-Stained Leaves (B9) Other (Explain in Remarks) FAC-Neutral Test (D5)
Field Observations:
Surface Water Present? Yes No Depth (inches): n/a Wetland Hydrology Present?
Yes
No
Water Table Present? Yes No Depth (inches): None to 20
Saturation Present? (includes capillary fringe)
Yes No Depth (inches): None to 20
Describe Recorded Data (stream gauge, monitoring well, aerial photos, previous inspections), if available:
Remarks:
Project Site: San Francisquito Creek Flood Protection Project
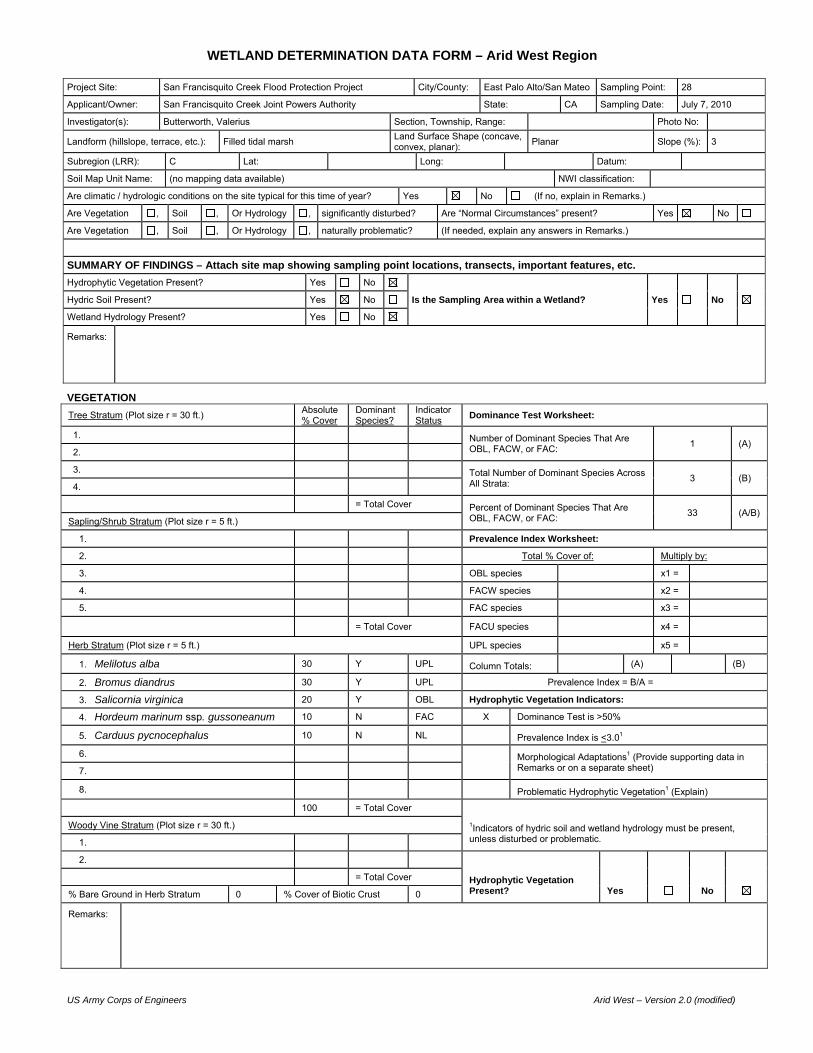
US Army Corps of Engineers Arid West – Version 2.0 (modified)
WETLAND DETERMINATION DATA FORM – Arid West Region
VEGETATION
Tree Stratum (Plot size r = 30 ft.) Absolute % Cover
Dominant Species?
Indicator Status
Dominance Test Worksheet:
1. Number of Dominant Species That Are OBL, FACW, or FAC:
1 (A) 2.
3. Total Number of Dominant Species Across All Strata:
3 (B) 4.
= Total Cover Percent of Dominant Species That Are OBL, FACW, or FAC:
33 (A/B) Sapling/Shrub Stratum (Plot size r = 5 ft.)
1. Prevalence Index Worksheet:
2. Total % Cover of: Multiply by:
3. OBL species x1 =
4. FACW species x2 =
5. FAC species x3 =
= Total Cover FACU species x4 =
Herb Stratum (Plot size r = 5 ft.) UPL species x5 =
1. Melilotus alba 30 Y UPL Column Totals: (A) (B)
2. Bromus diandrus 30 Y UPL Prevalence Index = B/A =
3. Salicornia virginica 20 Y OBL Hydrophytic Vegetation Indicators:
4. Hordeum marinum ssp. gussoneanum 10 N FAC X Dominance Test is >50%
5. Carduus pycnocephalus 10 N NL Prevalence Index is <3.01
6.
Morphological Adaptations1 (Provide supporting data in Remarks or on a separate sheet) 7.
8. Problematic Hydrophytic Vegetation1 (Explain)
100 = Total Cover
1Indicators of hydric soil and wetland hydrology must be present, unless disturbed or problematic.
Woody Vine Stratum (Plot size r = 30 ft.)
1.
2.
Hydrophytic Vegetation Present? Yes No
= Total Cover
% Bare Ground in Herb Stratum 0 % Cover of Biotic Crust 0
Remarks:
Project Site: San Francisquito Creek Flood Protection Project City/County: East Palo Alto/San Mateo Sampling Point: 28
Applicant/Owner: San Francisquito Creek Joint Powers Authority State: CA Sampling Date: July 7, 2010
Investigator(s): Butterworth, Valerius Section, Township, Range: Photo No:
Landform (hillslope, terrace, etc.): Filled tidal marsh Land Surface Shape (concave, convex, planar):
Planar Slope (%): 3
Subregion (LRR): C Lat: Long: Datum:
Soil Map Unit Name: (no mapping data available) NWI classification:
Are climatic / hydrologic conditions on the site typical for this time of year? Yes No (If no, explain in Remarks.)
Are Vegetation , Soil , Or Hydrology , significantly disturbed? Are “Normal Circumstances” present? Yes No
Are Vegetation , Soil , Or Hydrology , naturally problematic? (If needed, explain any answers in Remarks.)
SUMMARY OF FINDINGS – Attach site map showing sampling point locations, transects, important features, etc.
Hydrophytic Vegetation Present? Yes No
Is the Sampling Area within a Wetland? Yes No Hydric Soil Present? Yes No
Wetland Hydrology Present? Yes No
Remarks:

US Army Corps of Engineers Arid West – Version 2.0 (modified)
SOIL Sampling Point: 28
Profile Description: (Describe to the depth needed to document the indicator or confirm the absence of indicators.)
Depth Matrix Redox Features
(inches) Color (moist) % Color (Moist) % Type1 Loc2 Texture Horizon Remarks
0-2 10YR3/1 100 l Fill 1
2-9 10YR3/2 85 7.5YR3/4 15 C M cl Fill 2
9-21 10YR3/1 70 7.5YR4/6 30 C M c Ab
1Type: C= Concentration, D=Depletion, RM=Reduced Matrix, CS=Covered or Coated Sand Grains. 2Location: PL=Pore Lining, LRC=Living Root Channel, M=Matrix.
Hydric Soil Indicators: (Applicable to all LRRs, unless otherwise noted.) Indicators for Problematic Hydric Soils3:
Histosol (A1) Sandy Redox (S5) 1 cm Muck (A9) (LRR C)
Histic Epipedon (A2) Stripped Matrix (S6) 2 cm Muck (A10) (LRR B)
Black Histic (A3) Loamy Mucky Mineral (F1) Reduced Vertic (F18)
Hydrogen Sulfide (A4) Loamy Gleyed Matrix (F2) Red Parent Material (TF2)
Stratified Layers (A5) (LRR C) Depleted Matrix (F3) Other (Explain in Remarks)
1 cm Muck (A9) (LRR D) Redox Dark Surface (F6)
3Indicators of hydrophytic vegetation and wetland hydrology must be present.
Depleted Below Dark Surface (A11) Depleted Dark Surface (F7)
Thick Dark Surface (A12) Redox Depressions (F8)
Sandy Mucky Mineral (S1) Vernal Pools (F9)
Sandy Gleyed Matrix (S4)
Restrictive Layer (if present):
Hydric Soils Present? Yes Q
Type:
Depth (Inches):
Remarks:
HYDROLOGY Wetland Hydrology Indicators:
Primary Indicators (any one indicator is sufficient) Secondary Indicators (2 or more required)
Surface Water (A1) Salt Crust (B11) Water Marks (B1) (Riverine)
High Water Table (A2) Biotic Crust (B12) Sediment Deposits (B2) (Riverine)
Saturation (A3) Aquatic Invertebrates (B13) Drift Deposits (B3) (Riverine)
Water Marks (B1) (Nonriverine) Hydrogen Sulfide Odor (C1) Drainage Patterns (B10)
Sediment Deposits (B2) (Nonriverine) Oxidized Rhizospheres along Living Roots (C3) Dry-Season Water Table (C2)
Drift Deposits (B3) (Nonriverine) Presence of Reduced Iron (C4) Crayfish Burrows (C8)
Surface Soil Cracks (B6) Recent Iron Reduction in Tilled Soils (C6) Saturation Visible on Aerial Imagery (C9)
Inundation Visible on Aerial Imagery (B7) Thin Muck Surface (C7) Shallow Aquitard (D3)
Water-Stained Leaves (B9) Other (Explain in Remarks) FAC-Neutral Test (D5)
Field Observations:
Surface Water Present? Yes No Depth (inches): n/a Wetland Hydrology Present?
Yes
No
Water Table Present? Yes No Depth (inches): None to 21
Saturation Present? (includes capillary fringe)
Yes No Depth (inches): None to 21
Describe Recorded Data (stream gauge, monitoring well, aerial photos, previous inspections), if available:
Remarks:
Project Site: San Francisquito Creek Flood Protection Project

US Army Corps of Engineers Arid West – Version 2.0 (modified)
WETLAND DETERMINATION DATA FORM – Arid West Region
VEGETATION
Tree Stratum (Plot size r = 30 ft.) Absolute % Cover
Dominant Species?
Indicator Status
Dominance Test Worksheet:
1. Number of Dominant Species That Are OBL, FACW, or FAC:
1 (A) 2.
3. Total Number of Dominant Species Across All Strata:
1 (B) 4.
= Total Cover Percent of Dominant Species That Are OBL, FACW, or FAC:
100 (A/B) Sapling/Shrub Stratum (Plot size r = 5 ft.)
1. Prevalence Index Worksheet:
2. Total % Cover of: Multiply by:
3. OBL species x1 =
4. FACW species x2 =
5. FAC species x3 =
= Total Cover FACU species x4 =
Herb Stratum (Plot size r = 5 ft.) UPL species x5 =
1. Salicornia virginica 100 Y OBL Column Totals: (A) (B)
2. Prevalence Index = B/A =
3. Hydrophytic Vegetation Indicators:
4. X Dominance Test is >50%
5. Prevalence Index is <3.01
6.
Morphological Adaptations1 (Provide supporting data in Remarks or on a separate sheet) 7.
8. Problematic Hydrophytic Vegetation1 (Explain)
100 = Total Cover
1Indicators of hydric soil and wetland hydrology must be present, unless disturbed or problematic.
Woody Vine Stratum (Plot size r = 30 ft.)
1.
2.
Hydrophytic Vegetation Present? Yes No
= Total Cover
% Bare Ground in Herb Stratum 0 % Cover of Biotic Crust 0
Remarks:
Project Site: San Francisquito Creek Flood Protection Project City/County: East Palo Alto/San Mateo Sampling Point: 29
Applicant/Owner: San Francisquito Creek Joint Powers Authority State: CA Sampling Date: July 7, 2010
Investigator(s): Butterworth, Valerius Section, Township, Range: Photo No:
Landform (hillslope, terrace, etc.): Salt marsh Land Surface Shape (concave, convex, planar):
Planar Slope (%): 0
Subregion (LRR): C Lat: Long: Datum:
Soil Map Unit Name: Novato clay, 0 to 1 percent slopes (117) NWI classification:
Are climatic / hydrologic conditions on the site typical for this time of year? Yes No (If no, explain in Remarks.)
Are Vegetation , Soil , Or Hydrology , significantly disturbed? Are “Normal Circumstances” present? Yes No
Are Vegetation , Soil , Or Hydrology , naturally problematic? (If needed, explain any answers in Remarks.)
SUMMARY OF FINDINGS – Attach site map showing sampling point locations, transects, important features, etc.
Hydrophytic Vegetation Present? Yes No
Is the Sampling Area within a Wetland? Yes No Hydric Soil Present? Yes No
Wetland Hydrology Present? Yes No
Remarks:

US Army Corps of Engineers Arid West – Version 2.0 (modified)
SOIL Sampling Point: 29
Profile Description: (Describe to the depth needed to document the indicator or confirm the absence of indicators.)
Depth Matrix Redox Features
(inches) Color (moist) % Color (Moist) % Type1 Loc2 Texture Horizon Remarks
0-5 10YR3/2 80 7.5YR4/4 20 C M sic A
5-19 10YR4/1 sic Bg
1Type: C= Concentration, D=Depletion, RM=Reduced Matrix, CS=Covered or Coated Sand Grains. 2Location: PL=Pore Lining, LRC=Living Root Channel, M=Matrix.
Hydric Soil Indicators: (Applicable to all LRRs, unless otherwise noted.) Indicators for Problematic Hydric Soils3:
Histosol (A1) Sandy Redox (S5) 1 cm Muck (A9) (LRR C)
Histic Epipedon (A2) Stripped Matrix (S6) 2 cm Muck (A10) (LRR B)
Black Histic (A3) Loamy Mucky Mineral (F1) Reduced Vertic (F18)
Hydrogen Sulfide (A4) Loamy Gleyed Matrix (F2) Red Parent Material (TF2)
Stratified Layers (A5) (LRR C) Depleted Matrix (F3) Other (Explain in Remarks)
1 cm Muck (A9) (LRR D) Redox Dark Surface (F6)
3Indicators of hydrophytic vegetation and wetland hydrology must be present.
Depleted Below Dark Surface (A11) Depleted Dark Surface (F7)
Thick Dark Surface (A12) Redox Depressions (F8)
Sandy Mucky Mineral (S1) Vernal Pools (F9)
Sandy Gleyed Matrix (S4)
Restrictive Layer (if present):
Hydric Soils Present? Yes No
Type:
Depth (Inches):
Remarks:
HYDROLOGY Wetland Hydrology Indicators:
Primary Indicators (any one indicator is sufficient) Secondary Indicators (2 or more required)
Surface Water (A1) Salt Crust (B11) Water Marks (B1) (Riverine)
High Water Table (A2) Biotic Crust (B12) Sediment Deposits (B2) (Riverine)
Saturation (A3) Aquatic Invertebrates (B13) Drift Deposits (B3) (Riverine)
Water Marks (B1) (Nonriverine) Hydrogen Sulfide Odor (C1) Drainage Patterns (B10)
Sediment Deposits (B2) (Nonriverine) Oxidized Rhizospheres along Living Roots (C3) Dry-Season Water Table (C2)
Drift Deposits (B3) (Nonriverine) Presence of Reduced Iron (C4) Crayfish Burrows (C8)
Surface Soil Cracks (B6) Recent Iron Reduction in Tilled Soils (C6) Saturation Visible on Aerial Imagery (C9)
Inundation Visible on Aerial Imagery (B7) Thin Muck Surface (C7) Shallow Aquitard (D3)
Water-Stained Leaves (B9) Other (Explain in Remarks) FAC-Neutral Test (D5)
Field Observations:
Surface Water Present? Yes No Depth (inches): n/a Wetland Hydrology Present?
Yes
No
Water Table Present? Yes No Depth (inches): 10 *
Saturation Present? (includes capillary fringe)
Yes No Depth (inches): 3
Describe Recorded Data (stream gauge, monitoring well, aerial photos, previous inspections), if available:
Remarks: * Not yet stabilized.
Project Site: San Francisquito Creek Flood Protection Project

US Army Corps of Engineers Arid West – Version 2.0 (modified)
WETLAND DETERMINATION DATA FORM – Arid West Region
VEGETATION
Tree Stratum (Plot size r = 30 ft.) Absolute % Cover
Dominant Species?
Indicator Status
Dominance Test Worksheet:
1. Number of Dominant Species That Are OBL, FACW, or FAC:
2 (A) 2.
3. Total Number of Dominant Species Across All Strata:
2 (B) 4.
= Total Cover Percent of Dominant Species That Are OBL, FACW, or FAC:
100 (A/B) Sapling/Shrub Stratum (Plot size r = 5 ft.)
1. Prevalence Index Worksheet:
2. Total % Cover of: Multiply by:
3. OBL species x1 =
4. FACW species x2 =
5. FAC species x3 =
= Total Cover FACU species x4 =
Herb Stratum (Plot size r = 5 ft.) UPL species x5 =
1. Frankenia salina 60 Y FACW Column Totals: (A) (B)
2. Salicornia virginica 20 Y OBL Prevalence Index = B/A =
3. Bromus diandrus 10 N UPL Hydrophytic Vegetation Indicators:
4. Lolium multiflorum [L. perenne] 5 N FAC X Dominance Test is >50%
5. Brassica nigra 5 N NL Prevalence Index is <3.01
6.
Morphological Adaptations1 (Provide supporting data in Remarks or on a separate sheet) 7.
8. Problematic Hydrophytic Vegetation1 (Explain)
100 = Total Cover
1Indicators of hydric soil and wetland hydrology must be present, unless disturbed or problematic.
Woody Vine Stratum (Plot size r = 30 ft.)
1.
2.
Hydrophytic Vegetation Present? Yes No
= Total Cover
% Bare Ground in Herb Stratum 0 % Cover of Biotic Crust 0
Remarks:
Project Site: San Francisquito Creek Flood Protection Project City/County: East Palo Alto/San Mateo Sampling Point: 30
Applicant/Owner: San Francisquito Creek Joint Powers Authority State: CA Sampling Date: July 7, 2010
Investigator(s): Butterworth, Valerius Section, Township, Range: Photo No:
Landform (hillslope, terrace, etc.): Side slope levee Land Surface Shape (concave, convex, planar):
Planar Slope (%): 15
Subregion (LRR): C Lat: Long: Datum:
Soil Map Unit Name: Novato clay, 0 to 1 percent slopes (117) NWI classification:
Are climatic / hydrologic conditions on the site typical for this time of year? Yes No (If no, explain in Remarks.)
Are Vegetation , Soil , Or Hydrology , significantly disturbed? Are “Normal Circumstances” present? Yes No
Are Vegetation , Soil , Or Hydrology , naturally problematic? (If needed, explain any answers in Remarks.)
SUMMARY OF FINDINGS – Attach site map showing sampling point locations, transects, important features, etc.
Hydrophytic Vegetation Present? Yes No
Is the Sampling Area within a Wetland? Yes No Hydric Soil Present? Yes No
Wetland Hydrology Present? Yes No
Remarks:

US Army Corps of Engineers Arid West – Version 2.0 (modified)
SOIL Sampling Point: 30
Profile Description: (Describe to the depth needed to document the indicator or confirm the absence of indicators.)
Depth Matrix Redox Features
(inches) Color (moist) % Color (Moist) % Type1 Loc2 Texture Horizon Remarks
0-15 10YR3/2 100 c Fill
15-21 10YR3/1 90 7.5YR4/6 10 C PL c Ab
1Type: C= Concentration, D=Depletion, RM=Reduced Matrix, CS=Covered or Coated Sand Grains. 2Location: PL=Pore Lining, LRC=Living Root Channel, M=Matrix.
Hydric Soil Indicators: (Applicable to all LRRs, unless otherwise noted.) Indicators for Problematic Hydric Soils3:
Histosol (A1) Sandy Redox (S5) 1 cm Muck (A9) (LRR C)
Histic Epipedon (A2) Stripped Matrix (S6) 2 cm Muck (A10) (LRR B)
Black Histic (A3) Loamy Mucky Mineral (F1) Reduced Vertic (F18)
Hydrogen Sulfide (A4) Loamy Gleyed Matrix (F2) Red Parent Material (TF2)
Stratified Layers (A5) (LRR C) Depleted Matrix (F3) Other (Explain in Remarks)
1 cm Muck (A9) (LRR D) Redox Dark Surface (F6)
3Indicators of hydrophytic vegetation and wetland hydrology must be present.
Depleted Below Dark Surface (A11) Depleted Dark Surface (F7)
Thick Dark Surface (A12) Redox Depressions (F8)
Sandy Mucky Mineral (S1) Vernal Pools (F9)
Sandy Gleyed Matrix (S4)
Restrictive Layer (if present):
Hydric Soils Present? Yes No
Type:
Depth (Inches):
Remarks:
HYDROLOGY Wetland Hydrology Indicators:
Primary Indicators (any one indicator is sufficient) Secondary Indicators (2 or more required)
Surface Water (A1) Salt Crust (B11) Water Marks (B1) (Riverine)
High Water Table (A2) Biotic Crust (B12) Sediment Deposits (B2) (Riverine)
Saturation (A3) Aquatic Invertebrates (B13) Drift Deposits (B3) (Riverine)
Water Marks (B1) (Nonriverine) Hydrogen Sulfide Odor (C1) Drainage Patterns (B10)
Sediment Deposits (B2) (Nonriverine) Oxidized Rhizospheres along Living Roots (C3) Dry-Season Water Table (C2)
Drift Deposits (B3) (Nonriverine) Presence of Reduced Iron (C4) Crayfish Burrows (C8)
Surface Soil Cracks (B6) Recent Iron Reduction in Tilled Soils (C6) Saturation Visible on Aerial Imagery (C9)
Inundation Visible on Aerial Imagery (B7) Thin Muck Surface (C7) Shallow Aquitard (D3)
Water-Stained Leaves (B9) Other (Explain in Remarks) FAC-Neutral Test (D5)
Field Observations:
Surface Water Present? Yes No Depth (inches): n/a Wetland Hydrology Present?
Yes
No
Water Table Present? Yes No Depth (inches): None to 21
Saturation Present? (includes capillary fringe)
Yes No Depth (inches): None to 21
Describe Recorded Data (stream gauge, monitoring well, aerial photos, previous inspections), if available:
Remarks:
Project Site: San Francisquito Creek Flood Protection Project

US Army Corps of Engineers Arid West – Version 2.0 (modified)
WETLAND DETERMINATION DATA FORM – Arid West Region
VEGETATION
Tree Stratum (Plot size r = 30 ft.) Absolute % Cover
Dominant Species?
Indicator Status
Dominance Test Worksheet:
1. Number of Dominant Species That Are OBL, FACW, or FAC:
1 (A) 2.
3. Total Number of Dominant Species Across All Strata:
1 (B) 4.
= Total Cover Percent of Dominant Species That Are OBL, FACW, or FAC:
100 (A/B) Sapling/Shrub Stratum (Plot size r = 5 ft.)
1. Prevalence Index Worksheet:
2. Total % Cover of: Multiply by:
3. OBL species x1 =
4. FACW species x2 =
5. FAC species x3 =
= Total Cover FACU species x4 =
Herb Stratum (Plot size r = 5 ft.) UPL species x5 =
1. Salicornia virginica 100 Y OBL Column Totals: (A) (B)
2. Prevalence Index = B/A =
3. Hydrophytic Vegetation Indicators:
4. X Dominance Test is >50%
5. Prevalence Index is <3.01
6.
Morphological Adaptations1 (Provide supporting data in Remarks or on a separate sheet) 7.
8. Problematic Hydrophytic Vegetation1 (Explain)
100 = Total Cover
1Indicators of hydric soil and wetland hydrology must be present, unless disturbed or problematic.
Woody Vine Stratum (Plot size r = 30 ft.)
1.
2.
Hydrophytic Vegetation Present? Yes No
= Total Cover
% Bare Ground in Herb Stratum 0 % Cover of Biotic Crust 0
Remarks:
Project Site: San Francisquito Creek Flood Protection Project City/County: East Palo Alto/San Mateo Sampling Point: 31
Applicant/Owner: San Francisquito Creek Joint Powers Authority State: CA Sampling Date: July 7, 2010
Investigator(s): Butterworth, Valerius Section, Township, Range: Photo No:
Landform (hillslope, terrace, etc.): Salt marsh Land Surface Shape (concave, convex, planar):
Planar Slope (%): 0
Subregion (LRR): C Lat: Long: Datum:
Soil Map Unit Name: Novato clay, 0 to 1 percent slopes (117) NWI classification:
Are climatic / hydrologic conditions on the site typical for this time of year? Yes No (If no, explain in Remarks.)
Are Vegetation , Soil , Or Hydrology , significantly disturbed? Are “Normal Circumstances” present? Yes No
Are Vegetation , Soil , Or Hydrology , naturally problematic? (If needed, explain any answers in Remarks.)
SUMMARY OF FINDINGS – Attach site map showing sampling point locations, transects, important features, etc.
Hydrophytic Vegetation Present? Yes No
Is the Sampling Area within a Wetland? Yes No Hydric Soil Present? Yes No
Wetland Hydrology Present? Yes No
Remarks:
SM-8

US Army Corps of Engineers Arid West – Version 2.0 (modified)
SOIL Sampling Point: 31
Profile Description: (Describe to the depth needed to document the indicator or confirm the absence of indicators.)
Depth Matrix Redox Features
(inches) Color (moist) % Color (Moist) % Type1 Loc2 Texture Horizon Remarks
0-7 10YR4/1 80 5YR4/4 20 C M sic A
7-14 10YR4/1 100 Bg
1Type: C= Concentration, D=Depletion, RM=Reduced Matrix, CS=Covered or Coated Sand Grains. 2Location: PL=Pore Lining, LRC=Living Root Channel, M=Matrix.
Hydric Soil Indicators: (Applicable to all LRRs, unless otherwise noted.) Indicators for Problematic Hydric Soils3:
Histosol (A1) Sandy Redox (S5) 1 cm Muck (A9) (LRR C)
Histic Epipedon (A2) Stripped Matrix (S6) 2 cm Muck (A10) (LRR B)
Black Histic (A3) Loamy Mucky Mineral (F1) Reduced Vertic (F18)
Hydrogen Sulfide (A4) Loamy Gleyed Matrix (F2) Red Parent Material (TF2)
Stratified Layers (A5) (LRR C) Depleted Matrix (F3) Other (Explain in Remarks)
1 cm Muck (A9) (LRR D) Redox Dark Surface (F6)
3Indicators of hydrophytic vegetation and wetland hydrology must be present.
Depleted Below Dark Surface (A11) Depleted Dark Surface (F7)
Thick Dark Surface (A12) Redox Depressions (F8)
Sandy Mucky Mineral (S1) Vernal Pools (F9)
Sandy Gleyed Matrix (S4)
Restrictive Layer (if present):
Hydric Soils Present? Yes No
Type:
Depth (Inches):
Remarks:
HYDROLOGY Wetland Hydrology Indicators:
Primary Indicators (any one indicator is sufficient) Secondary Indicators (2 or more required)
Surface Water (A1) Salt Crust (B11) Water Marks (B1) (Riverine)
High Water Table (A2) Biotic Crust (B12) Sediment Deposits (B2) (Riverine)
Saturation (A3) Aquatic Invertebrates (B13) Drift Deposits (B3) (Riverine)
Water Marks (B1) (Nonriverine) Hydrogen Sulfide Odor (C1) Drainage Patterns (B10)
Sediment Deposits (B2) (Nonriverine) Oxidized Rhizospheres along Living Roots (C3) Dry-Season Water Table (C2)
Drift Deposits (B3) (Nonriverine) Presence of Reduced Iron (C4) Crayfish Burrows (C8)
Surface Soil Cracks (B6) Recent Iron Reduction in Tilled Soils (C6) Saturation Visible on Aerial Imagery (C9)
Inundation Visible on Aerial Imagery (B7) Thin Muck Surface (C7) Shallow Aquitard (D3)
Water-Stained Leaves (B9) Other (Explain in Remarks) FAC-Neutral Test (D5)
Field Observations:
Surface Water Present? Yes No Depth (inches): n/a Wetland Hydrology Present?
Yes
No
Water Table Present? Yes No Depth (inches): 10
Saturation Present? (includes capillary fringe)
Yes No Depth (inches): 6”
Describe Recorded Data (stream gauge, monitoring well, aerial photos, previous inspections), if available:
Remarks: Water in pit not yet stabilized.
Project Site: San Francisquito Creek Flood Protection Project

US Army Corps of Engineers Arid West – Version 2.0 (modified)
WETLAND DETERMINATION DATA FORM – Arid West Region
VEGETATION
Tree Stratum (Plot size r = 30 ft.) Absolute % Cover
Dominant Species?
Indicator Status
Dominance Test Worksheet:
1. Number of Dominant Species That Are OBL, FACW, or FAC:
1 (A) 2.
3. Total Number of Dominant Species Across All Strata:
2 (B) 4.
= Total Cover Percent of Dominant Species That Are OBL, FACW, or FAC:
50 (A/B) Sapling/Shrub Stratum (Plot size r = 5 ft.)
1. Prevalence Index Worksheet:
2. Total % Cover of: Multiply by:
3. OBL species x1 =
4. FACW species x2 =
5. FAC species x3 =
= Total Cover FACU species x4 =
Herb Stratum (Plot size r = 5 ft.) UPL species x5 =
1. Frankenia salina 50 Y FACW Column Totals: (A) (B)
2. Bromus diandrus 10 N UPL Prevalence Index = B/A =
3. Mesembryanthemum nodiflorum 20 Y NL Hydrophytic Vegetation Indicators:
4. Vulpia myuros 10 N FACU X Dominance Test is >50%
5. Brassica nigra 10 N NL Prevalence Index is <3.01
6.
Morphological Adaptations1 (Provide supporting data in Remarks or on a separate sheet) 7.
8. Problematic Hydrophytic Vegetation1 (Explain)
100 = Total Cover
1Indicators of hydric soil and wetland hydrology must be present, unless disturbed or problematic.
Woody Vine Stratum (Plot size r = 30 ft.)
1.
2.
Hydrophytic Vegetation Present? Yes No
= Total Cover
% Bare Ground in Herb Stratum 10 % Cover of Biotic Crust 0
Remarks:
Project Site: San Francisquito Creek Flood Protection Project City/County: East Palo Alto/San Mateo Sampling Point: 32
Applicant/Owner: San Francisquito Creek Joint Powers Authority State: CA Sampling Date: July 7, 2010
Investigator(s): Butterworth, Valerius Section, Township, Range: Photo No:
Landform (hillslope, terrace, etc.): Levee side slope Land Surface Shape (concave, convex, planar):
Planar Slope (%): 40
Subregion (LRR): C Lat: Long: Datum:
Soil Map Unit Name: Novato clay, 0 to 1 percent slopes (117) NWI classification:
Are climatic / hydrologic conditions on the site typical for this time of year? Yes No (If no, explain in Remarks.)
Are Vegetation , Soil , Or Hydrology , significantly disturbed? Are “Normal Circumstances” present? Yes No
Are Vegetation , Soil , Or Hydrology , naturally problematic? (If needed, explain any answers in Remarks.)
SUMMARY OF FINDINGS – Attach site map showing sampling point locations, transects, important features, etc.
Hydrophytic Vegetation Present? Yes No
Is the Sampling Area within a Wetland? Yes No Hydric Soil Present? Yes No
Wetland Hydrology Present? Yes No
Remarks:

US Army Corps of Engineers Arid West – Version 2.0 (modified)
SOIL Sampling Point: 32
Profile Description: (Describe to the depth needed to document the indicator or confirm the absence of indicators.)
Depth Matrix Redox Features
(inches) Color (moist) % Color (Moist) % Type1 Loc2 Texture Horizon Remarks
0-11 10YR5/2 100 sic Fill 1
11-18 10YR4/2 90 7.5YR4/4 10 C M c Fill 2
1Type: C= Concentration, D=Depletion, RM=Reduced Matrix, CS=Covered or Coated Sand Grains. 2Location: PL=Pore Lining, LRC=Living Root Channel, M=Matrix.
Hydric Soil Indicators: (Applicable to all LRRs, unless otherwise noted.) Indicators for Problematic Hydric Soils3:
Histosol (A1) Sandy Redox (S5) 1 cm Muck (A9) (LRR C)
Histic Epipedon (A2) Stripped Matrix (S6) 2 cm Muck (A10) (LRR B)
Black Histic (A3) Loamy Mucky Mineral (F1) Reduced Vertic (F18)
Hydrogen Sulfide (A4) Loamy Gleyed Matrix (F2) Red Parent Material (TF2)
Stratified Layers (A5) (LRR C) Depleted Matrix (F3) Other (Explain in Remarks)
1 cm Muck (A9) (LRR D) Redox Dark Surface (F6)
3Indicators of hydrophytic vegetation and wetland hydrology must be present.
Depleted Below Dark Surface (A11) Depleted Dark Surface (F7)
Thick Dark Surface (A12) Redox Depressions (F8)
Sandy Mucky Mineral (S1) Vernal Pools (F9)
Sandy Gleyed Matrix (S4)
Restrictive Layer (if present):
Hydric Soils Present? Yes No
Type:
Depth (Inches):
Remarks: Redox apparently formed in dredged source material; not diagnostic.
HYDROLOGY Wetland Hydrology Indicators:
Primary Indicators (any one indicator is sufficient) Secondary Indicators (2 or more required)
Surface Water (A1) Salt Crust (B11) Water Marks (B1) (Riverine)
High Water Table (A2) Biotic Crust (B12) Sediment Deposits (B2) (Riverine)
Saturation (A3) Aquatic Invertebrates (B13) Drift Deposits (B3) (Riverine)
Water Marks (B1) (Nonriverine) Hydrogen Sulfide Odor (C1) Drainage Patterns (B10)
Sediment Deposits (B2) (Nonriverine) Oxidized Rhizospheres along Living Roots (C3) Dry-Season Water Table (C2)
Drift Deposits (B3) (Nonriverine) Presence of Reduced Iron (C4) Crayfish Burrows (C8)
Surface Soil Cracks (B6) Recent Iron Reduction in Tilled Soils (C6) Saturation Visible on Aerial Imagery (C9)
Inundation Visible on Aerial Imagery (B7) Thin Muck Surface (C7) Shallow Aquitard (D3)
Water-Stained Leaves (B9) Other (Explain in Remarks) FAC-Neutral Test (D5)
Field Observations:
Surface Water Present? Yes No Depth (inches): n/a Wetland Hydrology Present?
Yes
No
Water Table Present? Yes No Depth (inches): None to 18
Saturation Present? (includes capillary fringe)
Yes No Depth (inches): None to 18
Describe Recorded Data (stream gauge, monitoring well, aerial photos, previous inspections), if available:
Remarks:
Project Site: San Francisquito Creek Flood Protection Project

US Army Corps of Engineers Arid West – Version 2.0 (modified)
WETLAND DETERMINATION DATA FORM – Arid West Region
VEGETATION
Tree Stratum (Plot size r = 30 ft.) Absolute % Cover
Dominant Species?
Indicator Status
Dominance Test Worksheet:
1. Number of Dominant Species That Are OBL, FACW, or FAC:
1 (A) 2.
3. Total Number of Dominant Species Across All Strata:
1 (B) 4.
= Total Cover Percent of Dominant Species That Are OBL, FACW, or FAC:
100 (A/B) Sapling/Shrub Stratum (Plot size r = 5 ft.)
1. Prevalence Index Worksheet:
2. Total % Cover of: Multiply by:
3. OBL species x1 =
4. FACW species x2 =
5. FAC species x3 =
= Total Cover FACU species x4 =
Herb Stratum (Plot size r = 5 ft.) UPL species x5 =
1. Salicornia virginica 100 Y OBL Column Totals: (A) (B)
2. Prevalence Index = B/A =
3. Hydrophytic Vegetation Indicators:
4. X Dominance Test is >50%
5. Prevalence Index is <3.01
6.
Morphological Adaptations1 (Provide supporting data in Remarks or on a separate sheet) 7.
8. Problematic Hydrophytic Vegetation1 (Explain)
100 = Total Cover
1Indicators of hydric soil and wetland hydrology must be present, unless disturbed or problematic.
Woody Vine Stratum (Plot size r = 30 ft.)
1.
2.
Hydrophytic Vegetation Present? Yes No
= Total Cover
% Bare Ground in Herb Stratum 20 % Cover of Biotic Crust 0
Remarks:
Project Site: San Francisquito Creek Flood Protection Project City/County: East Palo Alto/San Mateo Sampling Point: 33
Applicant/Owner: San Francisquito Creek Joint Powers Authority State: CA Sampling Date: July 8, 2010
Investigator(s): Butterworth, Valerius Section, Township, Range: Photo No:
Landform (hillslope, terrace, etc.): Diked tidal marsh Land Surface Shape (concave, convex, planar):
Planar/Concave Slope (%): 0
Subregion (LRR): C Lat: Long: Datum:
Soil Map Unit Name: (no mapping data available) NWI classification:
Are climatic / hydrologic conditions on the site typical for this time of year? Yes No (If no, explain in Remarks.)
Are Vegetation , Soil , Or Hydrology , significantly disturbed? Are “Normal Circumstances” present? Yes No
Are Vegetation , Soil , Or Hydrology , naturally problematic? (If needed, explain any answers in Remarks.)
SUMMARY OF FINDINGS – Attach site map showing sampling point locations, transects, important features, etc.
Hydrophytic Vegetation Present? Yes No
Is the Sampling Area within a Wetland? Yes No Hydric Soil Present? Yes No
Wetland Hydrology Present? Yes No
Remarks:

US Army Corps of Engineers Arid West – Version 2.0 (modified)
SOIL Sampling Point: 33
Profile Description: (Describe to the depth needed to document the indicator or confirm the absence of indicators.)
Depth Matrix Redox Features
(inches) Color (moist) % Color (Moist) % Type1 Loc2 Texture Horizon Remarks
0-9 10YR4/2 70 5YR4/6 30 C M sic A
9-14 Gley 1 2.5/N 100 c Bg
1Type: C= Concentration, D=Depletion, RM=Reduced Matrix, CS=Covered or Coated Sand Grains. 2Location: PL=Pore Lining, LRC=Living Root Channel, M=Matrix.
Hydric Soil Indicators: (Applicable to all LRRs, unless otherwise noted.) Indicators for Problematic Hydric Soils3:
Histosol (A1) Sandy Redox (S5) 1 cm Muck (A9) (LRR C)
Histic Epipedon (A2) Stripped Matrix (S6) 2 cm Muck (A10) (LRR B)
Black Histic (A3) Loamy Mucky Mineral (F1) Reduced Vertic (F18)
Hydrogen Sulfide (A4) Loamy Gleyed Matrix (F2) Red Parent Material (TF2)
Stratified Layers (A5) (LRR C) Depleted Matrix (F3) Other (Explain in Remarks)
1 cm Muck (A9) (LRR D) Redox Dark Surface (F6)
3Indicators of hydrophytic vegetation and wetland hydrology must be present.
Depleted Below Dark Surface (A11) Depleted Dark Surface (F7)
Thick Dark Surface (A12) Redox Depressions (F8)
Sandy Mucky Mineral (S1) Vernal Pools (F9)
Sandy Gleyed Matrix (S4)
Restrictive Layer (if present):
Hydric Soils Present? Yes No
Type:
Depth (Inches):
Remarks:
HYDROLOGY Wetland Hydrology Indicators:
Primary Indicators (any one indicator is sufficient) Secondary Indicators (2 or more required)
Surface Water (A1) Salt Crust (B11) Water Marks (B1) (Riverine)
High Water Table (A2) Biotic Crust (B12) Sediment Deposits (B2) (Riverine)
Saturation (A3) Aquatic Invertebrates (B13) Drift Deposits (B3) (Riverine)
Water Marks (B1) (Nonriverine) Hydrogen Sulfide Odor (C1) Drainage Patterns (B10)
Sediment Deposits (B2) (Nonriverine) Oxidized Rhizospheres along Living Roots (C3) Dry-Season Water Table (C2)
Drift Deposits (B3) (Nonriverine) Presence of Reduced Iron (C4) Crayfish Burrows (C8)
Surface Soil Cracks (B6) Recent Iron Reduction in Tilled Soils (C6) Saturation Visible on Aerial Imagery (C9)
Inundation Visible on Aerial Imagery (B7) Thin Muck Surface (C7) Shallow Aquitard (D3)
Water-Stained Leaves (B9) Other (Explain in Remarks) FAC-Neutral Test (D5)
Field Observations:
Surface Water Present? Yes No Depth (inches): n/a Wetland Hydrology Present?
Yes
No
Water Table Present? Yes No Depth (inches): 14 *
Saturation Present? (includes capillary fringe)
Yes No Depth (inches): 12
Describe Recorded Data (stream gauge, monitoring well, aerial photos, previous inspections), if available:
Remarks: * Water level not yet stabilized.
Project Site: San Francisquito Creek Flood Protection Project
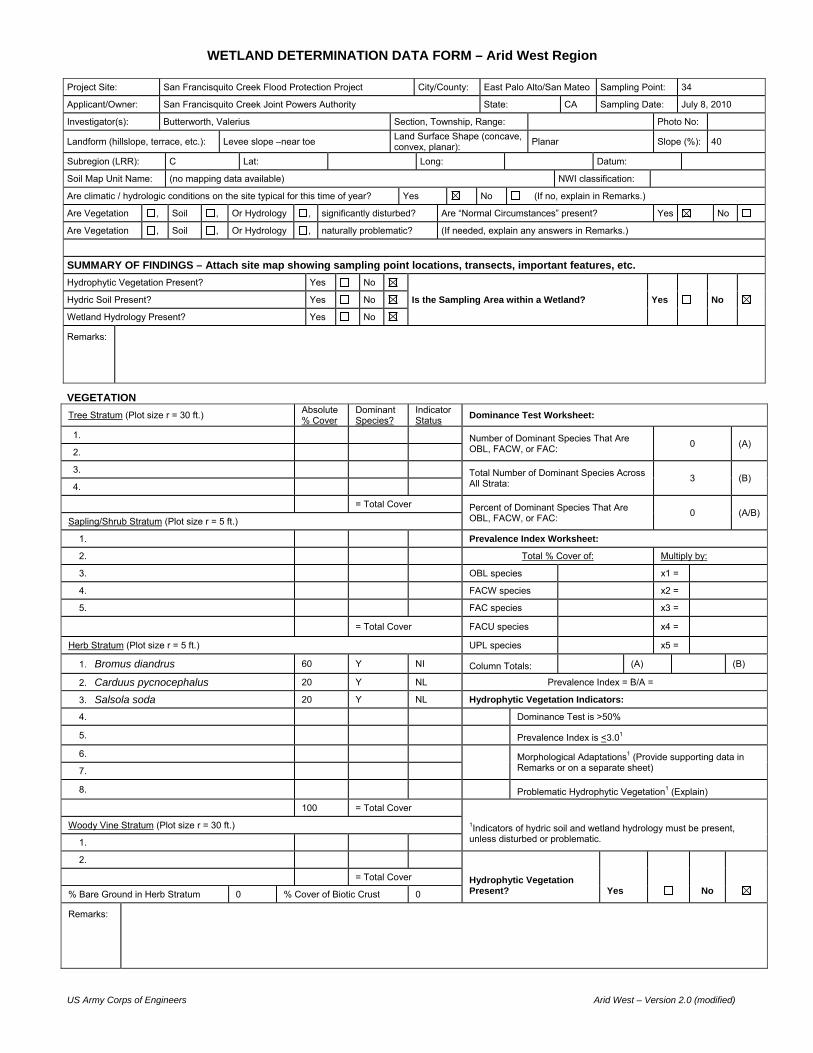
US Army Corps of Engineers Arid West – Version 2.0 (modified)
WETLAND DETERMINATION DATA FORM – Arid West Region
VEGETATION
Tree Stratum (Plot size r = 30 ft.) Absolute % Cover
Dominant Species?
Indicator Status
Dominance Test Worksheet:
1. Number of Dominant Species That Are OBL, FACW, or FAC:
0 (A) 2.
3. Total Number of Dominant Species Across All Strata:
3 (B) 4.
= Total Cover Percent of Dominant Species That Are OBL, FACW, or FAC:
0 (A/B) Sapling/Shrub Stratum (Plot size r = 5 ft.)
1. Prevalence Index Worksheet:
2. Total % Cover of: Multiply by:
3. OBL species x1 =
4. FACW species x2 =
5. FAC species x3 =
= Total Cover FACU species x4 =
Herb Stratum (Plot size r = 5 ft.) UPL species x5 =
1. Bromus diandrus 60 Y NI Column Totals: (A) (B)
2. Carduus pycnocephalus 20 Y NL Prevalence Index = B/A =
3. Salsola soda 20 Y NL Hydrophytic Vegetation Indicators:
4. Dominance Test is >50%
5. Prevalence Index is <3.01
6.
Morphological Adaptations1 (Provide supporting data in Remarks or on a separate sheet) 7.
8. Problematic Hydrophytic Vegetation1 (Explain)
100 = Total Cover
1Indicators of hydric soil and wetland hydrology must be present, unless disturbed or problematic.
Woody Vine Stratum (Plot size r = 30 ft.)
1.
2.
Hydrophytic Vegetation Present? Yes No
= Total Cover
% Bare Ground in Herb Stratum 0 % Cover of Biotic Crust 0
Remarks:
Project Site: San Francisquito Creek Flood Protection Project City/County: East Palo Alto/San Mateo Sampling Point: 34
Applicant/Owner: San Francisquito Creek Joint Powers Authority State: CA Sampling Date: July 8, 2010
Investigator(s): Butterworth, Valerius Section, Township, Range: Photo No:
Landform (hillslope, terrace, etc.): Levee slope –near toe Land Surface Shape (concave, convex, planar):
Planar Slope (%): 40
Subregion (LRR): C Lat: Long: Datum:
Soil Map Unit Name: (no mapping data available) NWI classification:
Are climatic / hydrologic conditions on the site typical for this time of year? Yes No (If no, explain in Remarks.)
Are Vegetation , Soil , Or Hydrology , significantly disturbed? Are “Normal Circumstances” present? Yes No
Are Vegetation , Soil , Or Hydrology , naturally problematic? (If needed, explain any answers in Remarks.)
SUMMARY OF FINDINGS – Attach site map showing sampling point locations, transects, important features, etc.
Hydrophytic Vegetation Present? Yes No
Is the Sampling Area within a Wetland? Yes No Hydric Soil Present? Yes No
Wetland Hydrology Present? Yes No
Remarks:

US Army Corps of Engineers Arid West – Version 2.0 (modified)
SOIL Sampling Point: 34
Profile Description: (Describe to the depth needed to document the indicator or confirm the absence of indicators.)
Depth Matrix Redox Features
(inches) Color (moist) % Color (Moist) % Type1 Loc2 Texture Horizon Remarks
0-8 10YR3/2 100 cl Fill
1Type: C= Concentration, D=Depletion, RM=Reduced Matrix, CS=Covered or Coated Sand Grains. 2Location: PL=Pore Lining, LRC=Living Root Channel, M=Matrix.
Hydric Soil Indicators: (Applicable to all LRRs, unless otherwise noted.) Indicators for Problematic Hydric Soils3:
Histosol (A1) Sandy Redox (S5) 1 cm Muck (A9) (LRR C)
Histic Epipedon (A2) Stripped Matrix (S6) 2 cm Muck (A10) (LRR B)
Black Histic (A3) Loamy Mucky Mineral (F1) Reduced Vertic (F18)
Hydrogen Sulfide (A4) Loamy Gleyed Matrix (F2) Red Parent Material (TF2)
Stratified Layers (A5) (LRR C) Depleted Matrix (F3) Other (Explain in Remarks)
1 cm Muck (A9) (LRR D) Redox Dark Surface (F6)
3Indicators of hydrophytic vegetation and wetland hydrology must be present.
Depleted Below Dark Surface (A11) Depleted Dark Surface (F7)
Thick Dark Surface (A12) Redox Depressions (F8)
Sandy Mucky Mineral (S1) Vernal Pools (F9)
Sandy Gleyed Matrix (S4)
Restrictive Layer (if present):
Hydric Soils Present? Yes No
Type:
Depth (Inches):
Remarks:
HYDROLOGY Wetland Hydrology Indicators:
Primary Indicators (any one indicator is sufficient) Secondary Indicators (2 or more required)
Surface Water (A1) Salt Crust (B11) Water Marks (B1) (Riverine)
High Water Table (A2) Biotic Crust (B12) Sediment Deposits (B2) (Riverine)
Saturation (A3) Aquatic Invertebrates (B13) Drift Deposits (B3) (Riverine)
Water Marks (B1) (Nonriverine) Hydrogen Sulfide Odor (C1) Drainage Patterns (B10)
Sediment Deposits (B2) (Nonriverine) Oxidized Rhizospheres along Living Roots (C3) Dry-Season Water Table (C2)
Drift Deposits (B3) (Nonriverine) Presence of Reduced Iron (C4) Crayfish Burrows (C8)
Surface Soil Cracks (B6) Recent Iron Reduction in Tilled Soils (C6) Saturation Visible on Aerial Imagery (C9)
Inundation Visible on Aerial Imagery (B7) Thin Muck Surface (C7) Shallow Aquitard (D3)
Water-Stained Leaves (B9) Other (Explain in Remarks) FAC-Neutral Test (D5)
Field Observations:
Surface Water Present? Yes No Depth (inches): n/a Wetland Hydrology Present?
Yes
No
Water Table Present? Yes No Depth (inches): None to 8
Saturation Present? (includes capillary fringe)
Yes No Depth (inches): None to 8
Describe Recorded Data (stream gauge, monitoring well, aerial photos, previous inspections), if available:
Remarks:
Project Site: San Francisquito Creek Flood Protection Project
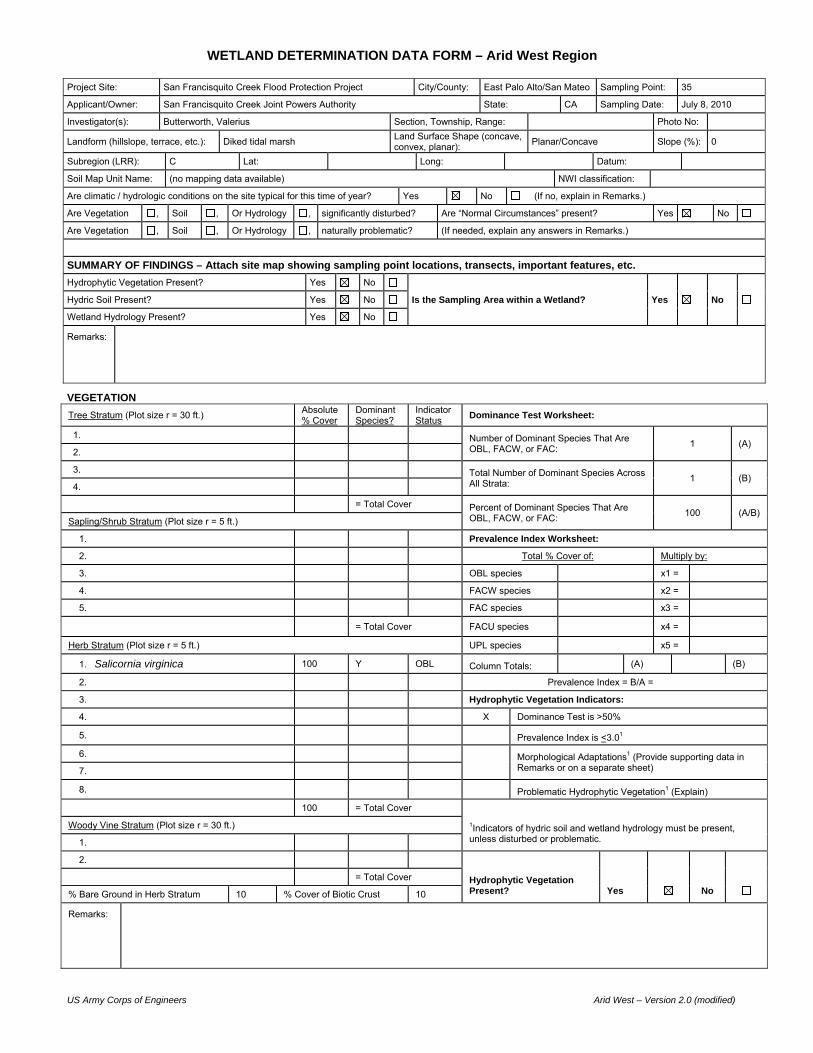
US Army Corps of Engineers Arid West – Version 2.0 (modified)
WETLAND DETERMINATION DATA FORM – Arid West Region
VEGETATION
Tree Stratum (Plot size r = 30 ft.) Absolute % Cover
Dominant Species?
Indicator Status
Dominance Test Worksheet:
1. Number of Dominant Species That Are OBL, FACW, or FAC:
1 (A) 2.
3. Total Number of Dominant Species Across All Strata:
1 (B) 4.
= Total Cover Percent of Dominant Species That Are OBL, FACW, or FAC:
100 (A/B) Sapling/Shrub Stratum (Plot size r = 5 ft.)
1. Prevalence Index Worksheet:
2. Total % Cover of: Multiply by:
3. OBL species x1 =
4. FACW species x2 =
5. FAC species x3 =
= Total Cover FACU species x4 =
Herb Stratum (Plot size r = 5 ft.) UPL species x5 =
1. Salicornia virginica 100 Y OBL Column Totals: (A) (B)
2. Prevalence Index = B/A =
3. Hydrophytic Vegetation Indicators:
4. X Dominance Test is >50%
5. Prevalence Index is <3.01
6.
Morphological Adaptations1 (Provide supporting data in Remarks or on a separate sheet) 7.
8. Problematic Hydrophytic Vegetation1 (Explain)
100 = Total Cover
1Indicators of hydric soil and wetland hydrology must be present, unless disturbed or problematic.
Woody Vine Stratum (Plot size r = 30 ft.)
1.
2.
Hydrophytic Vegetation Present? Yes No
= Total Cover
% Bare Ground in Herb Stratum 10 % Cover of Biotic Crust 10
Remarks:
Project Site: San Francisquito Creek Flood Protection Project City/County: East Palo Alto/San Mateo Sampling Point: 35
Applicant/Owner: San Francisquito Creek Joint Powers Authority State: CA Sampling Date: July 8, 2010
Investigator(s): Butterworth, Valerius Section, Township, Range: Photo No:
Landform (hillslope, terrace, etc.): Diked tidal marsh Land Surface Shape (concave, convex, planar):
Planar/Concave Slope (%): 0
Subregion (LRR): C Lat: Long: Datum:
Soil Map Unit Name: (no mapping data available) NWI classification:
Are climatic / hydrologic conditions on the site typical for this time of year? Yes No (If no, explain in Remarks.)
Are Vegetation , Soil , Or Hydrology , significantly disturbed? Are “Normal Circumstances” present? Yes No
Are Vegetation , Soil , Or Hydrology , naturally problematic? (If needed, explain any answers in Remarks.)
SUMMARY OF FINDINGS – Attach site map showing sampling point locations, transects, important features, etc.
Hydrophytic Vegetation Present? Yes No
Is the Sampling Area within a Wetland? Yes No Hydric Soil Present? Yes No
Wetland Hydrology Present? Yes No
Remarks:

US Army Corps of Engineers Arid West – Version 2.0 (modified)
SOIL Sampling Point: 35
Profile Description: (Describe to the depth needed to document the indicator or confirm the absence of indicators.)
Depth Matrix Redox Features
(inches) Color (moist) % Color (Moist) % Type1 Loc2 Texture Horizon Remarks
0-12 10YR4/1 60 2.5YR4/8 25 C M, PL sic A
5YR4/6 15 C M, PL
12-17 10YR4/1 100 c Bg
1Type: C= Concentration, D=Depletion, RM=Reduced Matrix, CS=Covered or Coated Sand Grains. 2Location: PL=Pore Lining, LRC=Living Root Channel, M=Matrix.
Hydric Soil Indicators: (Applicable to all LRRs, unless otherwise noted.) Indicators for Problematic Hydric Soils3:
Histosol (A1) Sandy Redox (S5) 1 cm Muck (A9) (LRR C)
Histic Epipedon (A2) Stripped Matrix (S6) 2 cm Muck (A10) (LRR B)
Black Histic (A3) Loamy Mucky Mineral (F1) Reduced Vertic (F18)
Hydrogen Sulfide (A4) Loamy Gleyed Matrix (F2) Red Parent Material (TF2)
Stratified Layers (A5) (LRR C) Depleted Matrix (F3) Other (Explain in Remarks)
1 cm Muck (A9) (LRR D) Redox Dark Surface (F6)
3Indicators of hydrophytic vegetation and wetland hydrology must be present.
Depleted Below Dark Surface (A11) Depleted Dark Surface (F7)
Thick Dark Surface (A12) Redox Depressions (F8)
Sandy Mucky Mineral (S1) Vernal Pools (F9)
Sandy Gleyed Matrix (S4)
Restrictive Layer (if present):
Hydric Soils Present? Yes No
Type:
Depth (Inches):
Remarks:
HYDROLOGY Wetland Hydrology Indicators:
Primary Indicators (any one indicator is sufficient) Secondary Indicators (2 or more required)
Surface Water (A1) Salt Crust (B11) Water Marks (B1) (Riverine)
High Water Table (A2) Biotic Crust (B12) Sediment Deposits (B2) (Riverine)
Saturation (A3) Aquatic Invertebrates (B13) Drift Deposits (B3) (Riverine)
Water Marks (B1) (Nonriverine) Hydrogen Sulfide Odor (C1) Drainage Patterns (B10)
Sediment Deposits (B2) (Nonriverine) Oxidized Rhizospheres along Living Roots (C3) Dry-Season Water Table (C2)
Drift Deposits (B3) (Nonriverine) Presence of Reduced Iron (C4) Crayfish Burrows (C8)
Surface Soil Cracks (B6) Recent Iron Reduction in Tilled Soils (C6) Saturation Visible on Aerial Imagery (C9)
Inundation Visible on Aerial Imagery (B7) Thin Muck Surface (C7) Shallow Aquitard (D3)
Water-Stained Leaves (B9) Other (Explain in Remarks) FAC-Neutral Test (D5)
Field Observations:
Surface Water Present? Yes No Depth (inches): n/a Wetland Hydrology Present?
Yes
No
Water Table Present? Yes No Depth (inches): None to 17
Saturation Present? (includes capillary fringe)
Yes No Depth (inches): None to 17
Describe Recorded Data (stream gauge, monitoring well, aerial photos, previous inspections), if available:
Remarks:
Project Site: San Francisquito Creek Flood Protection Project

US Army Corps of Engineers Arid West – Version 2.0 (modified)
WETLAND DETERMINATION DATA FORM – Arid West Region
VEGETATION
Tree Stratum (Plot size r = 30 ft.) Absolute % Cover
Dominant Species?
Indicator Status
Dominance Test Worksheet:
1. Number of Dominant Species That Are OBL, FACW, or FAC:
1 (A) 2.
3. Total Number of Dominant Species Across All Strata:
2 (B) 4.
= Total Cover Percent of Dominant Species That Are OBL, FACW, or FAC:
50 (A/B) Sapling/Shrub Stratum (Plot size r = 5 ft.)
1. Prevalence Index Worksheet:
2. Total % Cover of: Multiply by:
3. OBL species x1 =
4. FACW species x2 =
5. FAC species x3 =
= Total Cover FACU species x4 =
Herb Stratum (Plot size r = 5 ft.) UPL species x5 =
1. Bromus diandrus 50 Y NI Column Totals: (A) (B)
2. Frankenia salina 20 Y FACW Prevalence Index = B/A =
3. Carduus pycnocephalus 10 N NL Hydrophytic Vegetation Indicators:
4. Distichlis spicata 10 N FACW Dominance Test is >50%
5. Prevalence Index is <3.01
6.
Morphological Adaptations1 (Provide supporting data in Remarks or on a separate sheet) 7.
8. Problematic Hydrophytic Vegetation1 (Explain)
90 = Total Cover
1Indicators of hydric soil and wetland hydrology must be present, unless disturbed or problematic.
Woody Vine Stratum (Plot size r = 30 ft.)
1.
2.
Hydrophytic Vegetation Present? Yes No
= Total Cover
% Bare Ground in Herb Stratum 10 % Cover of Biotic Crust 0
Remarks:
Project Site: San Francisquito Creek Flood Protection Project City/County: East Palo Alto/San Mateo Sampling Point: 36
Applicant/Owner: San Francisquito Creek Joint Powers Authority State: CA Sampling Date: July 8, 2010
Investigator(s): Butterworth, Valerius Section, Township, Range: Photo No:
Landform (hillslope, terrace, etc.): Levee slope near toe Land Surface Shape (concave, convex, planar):
Planar Slope (%): 40
Subregion (LRR): C Lat: Long: Datum:
Soil Map Unit Name: (no mapping data available) NWI classification:
Are climatic / hydrologic conditions on the site typical for this time of year? Yes No (If no, explain in Remarks.)
Are Vegetation , Soil , Or Hydrology , significantly disturbed? Are “Normal Circumstances” present? Yes No
Are Vegetation , Soil , Or Hydrology , naturally problematic? (If needed, explain any answers in Remarks.)
SUMMARY OF FINDINGS – Attach site map showing sampling point locations, transects, important features, etc.
Hydrophytic Vegetation Present? Yes No
Is the Sampling Area within a Wetland? Yes No Hydric Soil Present? Yes No
Wetland Hydrology Present? Yes No
Remarks:

US Army Corps of Engineers Arid West – Version 2.0 (modified)
SOIL Sampling Point: 36
Profile Description: (Describe to the depth needed to document the indicator or confirm the absence of indicators.)
Depth Matrix Redox Features
(inches) Color (moist) % Color (Moist) % Type1 Loc2 Texture Horizon Remarks
0-9 10YR3/2 100 sl Fill 1
9-21 10YR4/2 85 7.5YR4/6 15 C M sl & sic Fill 2
1Type: C= Concentration, D=Depletion, RM=Reduced Matrix, CS=Covered or Coated Sand Grains. 2Location: PL=Pore Lining, LRC=Living Root Channel, M=Matrix.
Hydric Soil Indicators: (Applicable to all LRRs, unless otherwise noted.) Indicators for Problematic Hydric Soils3:
Histosol (A1) Sandy Redox (S5) 1 cm Muck (A9) (LRR C)
Histic Epipedon (A2) Stripped Matrix (S6) 2 cm Muck (A10) (LRR B)
Black Histic (A3) Loamy Mucky Mineral (F1) Reduced Vertic (F18)
Hydrogen Sulfide (A4) Loamy Gleyed Matrix (F2) Red Parent Material (TF2)
Stratified Layers (A5) (LRR C) Depleted Matrix (F3) Other (Explain in Remarks)
1 cm Muck (A9) (LRR D) Redox Dark Surface (F6)
3Indicators of hydrophytic vegetation and wetland hydrology must be present.
Depleted Below Dark Surface (A11) Depleted Dark Surface (F7)
Thick Dark Surface (A12) Redox Depressions (F8)
Sandy Mucky Mineral (S1) Vernal Pools (F9)
Sandy Gleyed Matrix (S4)
Restrictive Layer (if present):
Hydric Soils Present? Yes No
Type:
Depth (Inches):
Remarks: Redox too deep to meet criteria for indicators.
HYDROLOGY Wetland Hydrology Indicators:
Primary Indicators (any one indicator is sufficient) Secondary Indicators (2 or more required)
Surface Water (A1) Salt Crust (B11) Water Marks (B1) (Riverine)
High Water Table (A2) Biotic Crust (B12) Sediment Deposits (B2) (Riverine)
Saturation (A3) Aquatic Invertebrates (B13) Drift Deposits (B3) (Riverine)
Water Marks (B1) (Nonriverine) Hydrogen Sulfide Odor (C1) Drainage Patterns (B10)
Sediment Deposits (B2) (Nonriverine) Oxidized Rhizospheres along Living Roots (C3) Dry-Season Water Table (C2)
Drift Deposits (B3) (Nonriverine) Presence of Reduced Iron (C4) Crayfish Burrows (C8)
Surface Soil Cracks (B6) Recent Iron Reduction in Tilled Soils (C6) Saturation Visible on Aerial Imagery (C9)
Inundation Visible on Aerial Imagery (B7) Thin Muck Surface (C7) Shallow Aquitard (D3)
Water-Stained Leaves (B9) Other (Explain in Remarks) FAC-Neutral Test (D5)
Field Observations:
Surface Water Present? Yes No Depth (inches): n/a Wetland Hydrology Present?
Yes
No
Water Table Present? Yes No Depth (inches): None to 21
Saturation Present? (includes capillary fringe)
Yes No Depth (inches): None to 21
Describe Recorded Data (stream gauge, monitoring well, aerial photos, previous inspections), if available:
Remarks:
Project Site: San Francisquito Creek Flood Protection Project

US Army Corps of Engineers Arid West – Version 2.0 (modified)
WETLAND DETERMINATION DATA FORM – Arid West Region
VEGETATION
Tree Stratum (Plot size r = 30 ft.) Absolute % Cover
Dominant Species?
Indicator Status
Dominance Test Worksheet:
1. Number of Dominant Species That Are OBL, FACW, or FAC:
1 (A) 2.
3. Total Number of Dominant Species Across All Strata:
1 (B) 4.
= Total Cover Percent of Dominant Species That Are OBL, FACW, or FAC:
100 (A/B) Sapling/Shrub Stratum (Plot size r = 5 ft.)
1. Prevalence Index Worksheet:
2. Total % Cover of: Multiply by:
3. OBL species x1 =
4. FACW species x2 =
5. FAC species x3 =
= Total Cover FACU species x4 =
Herb Stratum (Plot size r = 5 ft.) UPL species x5 =
1. Salicornia virginica 100 Y OBL Column Totals: (A) (B)
2. Prevalence Index = B/A =
3. Hydrophytic Vegetation Indicators:
4. X Dominance Test is >50%
5. Prevalence Index is <3.01
6.
Morphological Adaptations1 (Provide supporting data in Remarks or on a separate sheet) 7.
8. Problematic Hydrophytic Vegetation1 (Explain)
100 = Total Cover
1Indicators of hydric soil and wetland hydrology must be present, unless disturbed or problematic.
Woody Vine Stratum (Plot size r = 30 ft.)
1.
2.
Hydrophytic Vegetation Present? Yes No
= Total Cover
% Bare Ground in Herb Stratum 10 % Cover of Biotic Crust 0
Remarks:
Project Site: San Francisquito Creek Flood Protection Project City/County: East Palo Alto/San Mateo Sampling Point: 37
Applicant/Owner: San Francisquito Creek Joint Powers Authority State: CA Sampling Date: July 8, 2010
Investigator(s): Butterworth, Valerius Section, Township, Range: Photo No:
Landform (hillslope, terrace, etc.): Salt marsh Land Surface Shape (concave, convex, planar):
Planar Slope (%): 0
Subregion (LRR): C Lat: Long: Datum:
Soil Map Unit Name: (no mapping data available) NWI classification:
Are climatic / hydrologic conditions on the site typical for this time of year? Yes No (If no, explain in Remarks.)
Are Vegetation , Soil , Or Hydrology , significantly disturbed? Are “Normal Circumstances” present? Yes No
Are Vegetation , Soil , Or Hydrology , naturally problematic? (If needed, explain any answers in Remarks.)
SUMMARY OF FINDINGS – Attach site map showing sampling point locations, transects, important features, etc.
Hydrophytic Vegetation Present? Yes No
Is the Sampling Area within a Wetland? Yes No Hydric Soil Present? Yes No
Wetland Hydrology Present? Yes No
Remarks:

US Army Corps of Engineers Arid West – Version 2.0 (modified)
SOIL Sampling Point: 37
Profile Description: (Describe to the depth needed to document the indicator or confirm the absence of indicators.)
Depth Matrix Redox Features
(inches) Color (moist) % Color (Moist) % Type1 Loc2 Texture Horizon Remarks
0-7 10YR3/2 75 5YR4/6 25 C M sic A
7-15 10YR4/1 100 sic Bg
1Type: C= Concentration, D=Depletion, RM=Reduced Matrix, CS=Covered or Coated Sand Grains. 2Location: PL=Pore Lining, LRC=Living Root Channel, M=Matrix.
Hydric Soil Indicators: (Applicable to all LRRs, unless otherwise noted.) Indicators for Problematic Hydric Soils3:
Histosol (A1) Sandy Redox (S5) 1 cm Muck (A9) (LRR C)
Histic Epipedon (A2) Stripped Matrix (S6) 2 cm Muck (A10) (LRR B)
Black Histic (A3) Loamy Mucky Mineral (F1) Reduced Vertic (F18)
Hydrogen Sulfide (A4) Loamy Gleyed Matrix (F2) Red Parent Material (TF2)
Stratified Layers (A5) (LRR C) Depleted Matrix (F3) Other (Explain in Remarks)
1 cm Muck (A9) (LRR D) Redox Dark Surface (F6)
3Indicators of hydrophytic vegetation and wetland hydrology must be present.
Depleted Below Dark Surface (A11) Depleted Dark Surface (F7)
Thick Dark Surface (A12) Redox Depressions (F8)
Sandy Mucky Mineral (S1) Vernal Pools (F9)
Sandy Gleyed Matrix (S4)
Restrictive Layer (if present):
Hydric Soils Present? Yes No
Type:
Depth (Inches):
Remarks:
HYDROLOGY Wetland Hydrology Indicators:
Primary Indicators (any one indicator is sufficient) Secondary Indicators (2 or more required)
Surface Water (A1) Salt Crust (B11) Water Marks (B1) (Riverine)
High Water Table (A2) Biotic Crust (B12) Sediment Deposits (B2) (Riverine)
Saturation (A3) Aquatic Invertebrates (B13) Drift Deposits (B3) (Riverine)
Water Marks (B1) (Nonriverine) Hydrogen Sulfide Odor (C1) Drainage Patterns (B10)
Sediment Deposits (B2) (Nonriverine) Oxidized Rhizospheres along Living Roots (C3) Dry-Season Water Table (C2)
Drift Deposits (B3) (Nonriverine) Presence of Reduced Iron (C4) Crayfish Burrows (C8)
Surface Soil Cracks (B6) Recent Iron Reduction in Tilled Soils (C6) Saturation Visible on Aerial Imagery (C9)
Inundation Visible on Aerial Imagery (B7) Thin Muck Surface (C7) Shallow Aquitard (D3)
Water-Stained Leaves (B9) Other (Explain in Remarks) FAC-Neutral Test (D5)
Field Observations:
Surface Water Present? Yes No Depth (inches): n/a Wetland Hydrology Present?
Yes
No
Water Table Present? Yes No Depth (inches): 11
Saturation Present? (includes capillary fringe)
Yes No Depth (inches): 8
Describe Recorded Data (stream gauge, monitoring well, aerial photos, previous inspections), if available:
Remarks: Water in pit not yet stabilized.
Project Site: San Francisquito Creek Flood Protection Project
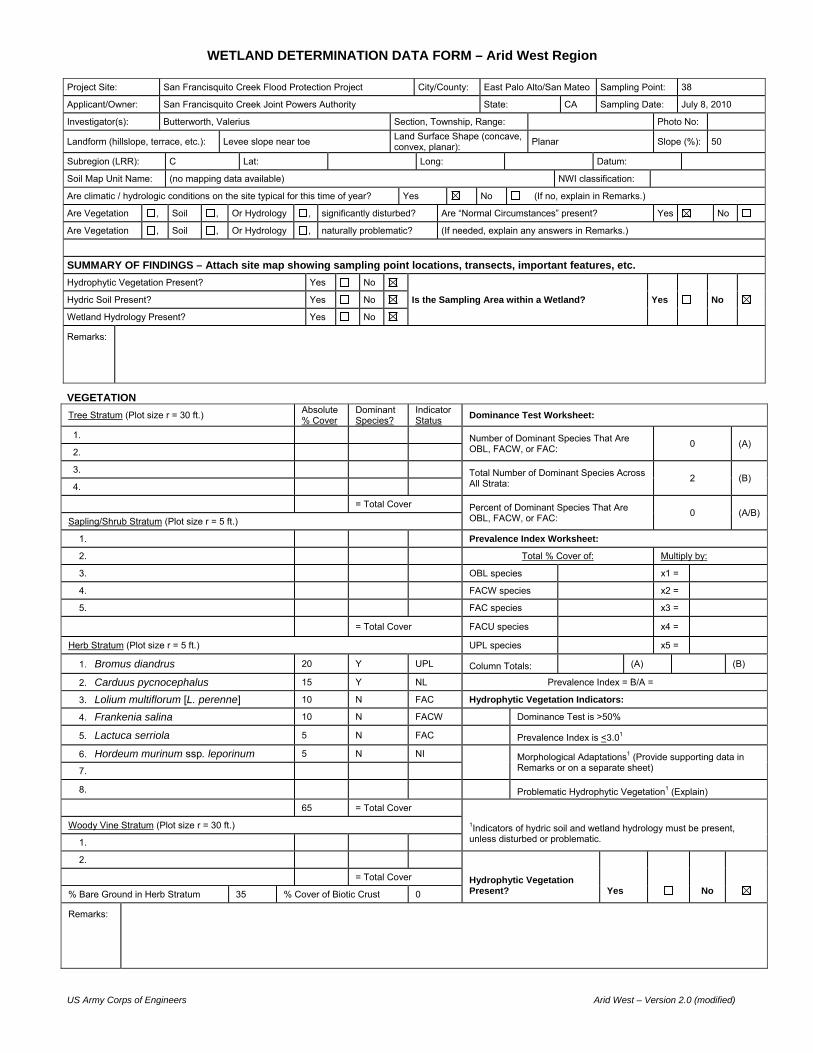
US Army Corps of Engineers Arid West – Version 2.0 (modified)
WETLAND DETERMINATION DATA FORM – Arid West Region
VEGETATION
Tree Stratum (Plot size r = 30 ft.) Absolute % Cover
Dominant Species?
Indicator Status
Dominance Test Worksheet:
1. Number of Dominant Species That Are OBL, FACW, or FAC:
0 (A) 2.
3. Total Number of Dominant Species Across All Strata:
2 (B) 4.
= Total Cover Percent of Dominant Species That Are OBL, FACW, or FAC:
0 (A/B) Sapling/Shrub Stratum (Plot size r = 5 ft.)
1. Prevalence Index Worksheet:
2. Total % Cover of: Multiply by:
3. OBL species x1 =
4. FACW species x2 =
5. FAC species x3 =
= Total Cover FACU species x4 =
Herb Stratum (Plot size r = 5 ft.) UPL species x5 =
1. Bromus diandrus 20 Y UPL Column Totals: (A) (B)
2. Carduus pycnocephalus 15 Y NL Prevalence Index = B/A =
3. Lolium multiflorum [L. perenne] 10 N FAC Hydrophytic Vegetation Indicators:
4. Frankenia salina 10 N FACW Dominance Test is >50%
5. Lactuca serriola 5 N FAC Prevalence Index is <3.01
6. Hordeum murinum ssp. leporinum 5 N NI
Morphological Adaptations1 (Provide supporting data in Remarks or on a separate sheet) 7.
8. Problematic Hydrophytic Vegetation1 (Explain)
65 = Total Cover
1Indicators of hydric soil and wetland hydrology must be present, unless disturbed or problematic.
Woody Vine Stratum (Plot size r = 30 ft.)
1.
2.
Hydrophytic Vegetation Present? Yes No
= Total Cover
% Bare Ground in Herb Stratum 35 % Cover of Biotic Crust 0
Remarks:
Project Site: San Francisquito Creek Flood Protection Project City/County: East Palo Alto/San Mateo Sampling Point: 38
Applicant/Owner: San Francisquito Creek Joint Powers Authority State: CA Sampling Date: July 8, 2010
Investigator(s): Butterworth, Valerius Section, Township, Range: Photo No:
Landform (hillslope, terrace, etc.): Levee slope near toe Land Surface Shape (concave, convex, planar):
Planar Slope (%): 50
Subregion (LRR): C Lat: Long: Datum:
Soil Map Unit Name: (no mapping data available) NWI classification:
Are climatic / hydrologic conditions on the site typical for this time of year? Yes No (If no, explain in Remarks.)
Are Vegetation , Soil , Or Hydrology , significantly disturbed? Are “Normal Circumstances” present? Yes No
Are Vegetation , Soil , Or Hydrology , naturally problematic? (If needed, explain any answers in Remarks.)
SUMMARY OF FINDINGS – Attach site map showing sampling point locations, transects, important features, etc.
Hydrophytic Vegetation Present? Yes No
Is the Sampling Area within a Wetland? Yes No Hydric Soil Present? Yes No
Wetland Hydrology Present? Yes No
Remarks:

US Army Corps of Engineers Arid West – Version 2.0 (modified)
SOIL Sampling Point: 38
Profile Description: (Describe to the depth needed to document the indicator or confirm the absence of indicators.)
Depth Matrix Redox Features
(inches) Color (moist) % Color (Moist) % Type1 Loc2 Texture Horizon Remarks
0-14 10YR4/2 100 cl Fill
1Type: C= Concentration, D=Depletion, RM=Reduced Matrix, CS=Covered or Coated Sand Grains. 2Location: PL=Pore Lining, LRC=Living Root Channel, M=Matrix.
Hydric Soil Indicators: (Applicable to all LRRs, unless otherwise noted.) Indicators for Problematic Hydric Soils3:
Histosol (A1) Sandy Redox (S5) 1 cm Muck (A9) (LRR C)
Histic Epipedon (A2) Stripped Matrix (S6) 2 cm Muck (A10) (LRR B)
Black Histic (A3) Loamy Mucky Mineral (F1) Reduced Vertic (F18)
Hydrogen Sulfide (A4) Loamy Gleyed Matrix (F2) Red Parent Material (TF2)
Stratified Layers (A5) (LRR C) Depleted Matrix (F3) Other (Explain in Remarks)
1 cm Muck (A9) (LRR D) Redox Dark Surface (F6)
3Indicators of hydrophytic vegetation and wetland hydrology must be present.
Depleted Below Dark Surface (A11) Depleted Dark Surface (F7)
Thick Dark Surface (A12) Redox Depressions (F8)
Sandy Mucky Mineral (S1) Vernal Pools (F9)
Sandy Gleyed Matrix (S4)
Restrictive Layer (if present):
Hydric Soils Present? Yes No
Type:
Depth (Inches):
Remarks:
HYDROLOGY Wetland Hydrology Indicators:
Primary Indicators (any one indicator is sufficient) Secondary Indicators (2 or more required)
Surface Water (A1) Salt Crust (B11) Water Marks (B1) (Riverine)
High Water Table (A2) Biotic Crust (B12) Sediment Deposits (B2) (Riverine)
Saturation (A3) Aquatic Invertebrates (B13) Drift Deposits (B3) (Riverine)
Water Marks (B1) (Nonriverine) Hydrogen Sulfide Odor (C1) Drainage Patterns (B10)
Sediment Deposits (B2) (Nonriverine) Oxidized Rhizospheres along Living Roots (C3) Dry-Season Water Table (C2)
Drift Deposits (B3) (Nonriverine) Presence of Reduced Iron (C4) Crayfish Burrows (C8)
Surface Soil Cracks (B6) Recent Iron Reduction in Tilled Soils (C6) Saturation Visible on Aerial Imagery (C9)
Inundation Visible on Aerial Imagery (B7) Thin Muck Surface (C7) Shallow Aquitard (D3)
Water-Stained Leaves (B9) Other (Explain in Remarks) FAC-Neutral Test (D5)
Field Observations:
Surface Water Present? Yes No Depth (inches): n/a Wetland Hydrology Present?
Yes
No
Water Table Present? Yes No Depth (inches): None to 14
Saturation Present? (includes capillary fringe)
Yes No Depth (inches): None to 14
Describe Recorded Data (stream gauge, monitoring well, aerial photos, previous inspections), if available:
Remarks:
Project Site: San Francisquito Creek Flood Protection Project

US Army Corps of Engineers Arid West – Version 2.0 (modified)
WETLAND DETERMINATION DATA FORM – Arid West Region
VEGETATION
Tree Stratum (Plot size r = 30 ft.) Absolute % Cover
Dominant Species?
Indicator Status
Dominance Test Worksheet:
1. Number of Dominant Species That Are OBL, FACW, or FAC:
1 (A) 2.
3. Total Number of Dominant Species Across All Strata:
1 (B) 4.
= Total Cover Percent of Dominant Species That Are OBL, FACW, or FAC:
100 (A/B) Sapling/Shrub Stratum (Plot size r = 5 ft.)
1. Prevalence Index Worksheet:
2. Total % Cover of: Multiply by:
3. OBL species x1 =
4. FACW species x2 =
5. FAC species x3 =
= Total Cover FACU species x4 =
Herb Stratum (Plot size r = 5 ft.) UPL species x5 =
1. Salicornia virginica 90 Y OBL Column Totals: (A) (B)
2. Frankenia salina 10 N FACW Prevalence Index = B/A =
3. Elytrigia sp. 10 N NL Hydrophytic Vegetation Indicators:
4. Dominance Test is >50%
5. Prevalence Index is <3.01
6.
Morphological Adaptations1 (Provide supporting data in Remarks or on a separate sheet) 7.
8. Problematic Hydrophytic Vegetation1 (Explain)
110 = Total Cover
1Indicators of hydric soil and wetland hydrology must be present, unless disturbed or problematic.
Woody Vine Stratum (Plot size r = 30 ft.)
1.
2.
Hydrophytic Vegetation Present? Yes No
= Total Cover
% Bare Ground in Herb Stratum 10 % Cover of Biotic Crust 0
Remarks:
Project Site: San Francisquito Creek Flood Protection Project City/County: East Palo Alto/San Mateo Sampling Point: 39
Applicant/Owner: San Francisquito Creek Joint Powers Authority State: CA Sampling Date: July 8, 2010
Investigator(s): Butterworth, Valerius Section, Township, Range: Photo No:
Landform (hillslope, terrace, etc.): Bench Land Surface Shape (concave, convex, planar):
Planar/Concave Slope (%): 0
Subregion (LRR): C Lat: Long: Datum:
Soil Map Unit Name: (no mapping data available) NWI classification:
Are climatic / hydrologic conditions on the site typical for this time of year? Yes No (If no, explain in Remarks.)
Are Vegetation , Soil , Or Hydrology , significantly disturbed? Are “Normal Circumstances” present? Yes No
Are Vegetation , Soil , Or Hydrology , naturally problematic? (If needed, explain any answers in Remarks.)
SUMMARY OF FINDINGS – Attach site map showing sampling point locations, transects, important features, etc.
Hydrophytic Vegetation Present? Yes No
Is the Sampling Area within a Wetland? Yes No Hydric Soil Present? Yes No
Wetland Hydrology Present? Yes No
Remarks:
Data point located in trough-like area, which is the lowest point along bench on east side of creek. Trough is approximately one-foot lower than remainder of bench-like area. Drift line is inboard of bench at outer edge of Spartina. Bank is vertical and higher than opposite bank.

US Army Corps of Engineers Arid West – Version 2.0 (modified)
SOIL Sampling Point: 39
Profile Description: (Describe to the depth needed to document the indicator or confirm the absence of indicators.)
Depth Matrix Redox Features
(inches) Color (moist) % Color (Moist) % Type1 Loc2 Texture Horizon Remarks
0-13 10YR3/1 100 cl A
13-22 10YR4/1 75 10YR4/6 25 C M c B
1Type: C= Concentration, D=Depletion, RM=Reduced Matrix, CS=Covered or Coated Sand Grains. 2Location: PL=Pore Lining, LRC=Living Root Channel, M=Matrix.
Hydric Soil Indicators: (Applicable to all LRRs, unless otherwise noted.) Indicators for Problematic Hydric Soils3:
Histosol (A1) Sandy Redox (S5) 1 cm Muck (A9) (LRR C)
Histic Epipedon (A2) Stripped Matrix (S6) 2 cm Muck (A10) (LRR B)
Black Histic (A3) Loamy Mucky Mineral (F1) Reduced Vertic (F18)
Hydrogen Sulfide (A4) Loamy Gleyed Matrix (F2) Red Parent Material (TF2)
Stratified Layers (A5) (LRR C) Depleted Matrix (F3) Other (Explain in Remarks)
1 cm Muck (A9) (LRR D) Redox Dark Surface (F6)
3Indicators of hydrophytic vegetation and wetland hydrology must be present.
Depleted Below Dark Surface (A11) Depleted Dark Surface (F7)
Thick Dark Surface (A12) Redox Depressions (F8)
Sandy Mucky Mineral (S1) Vernal Pools (F9)
Sandy Gleyed Matrix (S4)
Restrictive Layer (if present):
Hydric Soils Present? Yes No
Type:
Depth (Inches):
Remarks: Redox is too deep to be diagnostic.
HYDROLOGY Wetland Hydrology Indicators:
Primary Indicators (any one indicator is sufficient) Secondary Indicators (2 or more required)
Surface Water (A1) Salt Crust (B11) Water Marks (B1) (Riverine)
High Water Table (A2) Biotic Crust (B12) Sediment Deposits (B2) (Riverine)
Saturation (A3) Aquatic Invertebrates (B13) Drift Deposits (B3) (Riverine)
Water Marks (B1) (Nonriverine) Hydrogen Sulfide Odor (C1) Drainage Patterns (B10)
Sediment Deposits (B2) (Nonriverine) Oxidized Rhizospheres along Living Roots (C3) Dry-Season Water Table (C2)
Drift Deposits (B3) (Nonriverine) Presence of Reduced Iron (C4) Crayfish Burrows (C8)
Surface Soil Cracks (B6) Recent Iron Reduction in Tilled Soils (C6) Saturation Visible on Aerial Imagery (C9)
Inundation Visible on Aerial Imagery (B7) Thin Muck Surface (C7) Shallow Aquitard (D3)
Water-Stained Leaves (B9) Other (Explain in Remarks) FAC-Neutral Test (D5)
Field Observations:
Surface Water Present? Yes No Depth (inches): n/a Wetland Hydrology Present?
Yes
No
Water Table Present? Yes No Depth (inches): None to 22
Saturation Present? (includes capillary fringe)
Yes No Depth (inches): None to 22
Describe Recorded Data (stream gauge, monitoring well, aerial photos, previous inspections), if available:
Remarks:
Project Site: San Francisquito Creek Flood Protection Project

US Army Corps of Engineers Arid West – Version 2.0 (modified)
WETLAND DETERMINATION DATA FORM – Arid West Region
VEGETATION
Tree Stratum (Plot size r = 30 ft.) Absolute % Cover
Dominant Species?
Indicator Status
Dominance Test Worksheet:
1. Number of Dominant Species That Are OBL, FACW, or FAC:
2 (A) 2.
3. Total Number of Dominant Species Across All Strata:
2 (B) 4.
= Total Cover Percent of Dominant Species That Are OBL, FACW, or FAC:
100 (A/B) Sapling/Shrub Stratum (Plot size r = 5 ft.)
1. Prevalence Index Worksheet:
2. Total % Cover of: Multiply by:
3. OBL species x1 =
4. FACW species x2 =
5. FAC species x3 =
= Total Cover FACU species x4 =
Herb Stratum (Plot size r = 5 ft.) UPL species x5 =
1. Spartina foliosa 80 Y OBL Column Totals: (A) (B)
2. Salicornia virginica 20 Y OBL Prevalence Index = B/A =
3. Hydrophytic Vegetation Indicators:
4. X Dominance Test is >50%
5. Prevalence Index is <3.01
6.
Morphological Adaptations1 (Provide supporting data in Remarks or on a separate sheet) 7.
8. Problematic Hydrophytic Vegetation1 (Explain)
100 = Total Cover
1Indicators of hydric soil and wetland hydrology must be present, unless disturbed or problematic.
Woody Vine Stratum (Plot size r = 30 ft.)
1.
2.
Hydrophytic Vegetation Present? Yes No
= Total Cover
% Bare Ground in Herb Stratum 10 % Cover of Biotic Crust 0
Remarks:
Project Site: San Francisquito Creek Flood Protection Project City/County: East Palo Alto/San Mateo Sampling Point: 40
Applicant/Owner: San Francisquito Creek Joint Powers Authority State: CA Sampling Date: July 8, 2010
Investigator(s): Butterworth, Valerius Section, Township, Range: Photo No:
Landform (hillslope, terrace, etc.): Salt marsh Land Surface Shape (concave, convex, planar):
Planar Slope (%): 0
Subregion (LRR): C Lat: Long: Datum:
Soil Map Unit Name: (no mapping data available) NWI classification:
Are climatic / hydrologic conditions on the site typical for this time of year? Yes No (If no, explain in Remarks.)
Are Vegetation , Soil , Or Hydrology , significantly disturbed? Are “Normal Circumstances” present? Yes No
Are Vegetation , Soil , Or Hydrology , naturally problematic? (If needed, explain any answers in Remarks.)
SUMMARY OF FINDINGS – Attach site map showing sampling point locations, transects, important features, etc.
Hydrophytic Vegetation Present? Yes No
Is the Sampling Area within a Wetland? Yes No Hydric Soil Present? Yes No
Wetland Hydrology Present? Yes No
Remarks:
Below MHW.

US Army Corps of Engineers Arid West – Version 2.0 (modified)
SOIL Sampling Point: 40
Profile Description: (Describe to the depth needed to document the indicator or confirm the absence of indicators.)
Depth Matrix Redox Features
(inches) Color (moist) % Color (Moist) % Type1 Loc2 Texture Horizon Remarks
0-16 10YR4/1 85 5YR4/6 15 C M sl A
1Type: C= Concentration, D=Depletion, RM=Reduced Matrix, CS=Covered or Coated Sand Grains. 2Location: PL=Pore Lining, LRC=Living Root Channel, M=Matrix.
Hydric Soil Indicators: (Applicable to all LRRs, unless otherwise noted.) Indicators for Problematic Hydric Soils3:
Histosol (A1) Sandy Redox (S5) 1 cm Muck (A9) (LRR C)
Histic Epipedon (A2) Stripped Matrix (S6) 2 cm Muck (A10) (LRR B)
Black Histic (A3) Loamy Mucky Mineral (F1) Reduced Vertic (F18)
Hydrogen Sulfide (A4) Loamy Gleyed Matrix (F2) Red Parent Material (TF2)
Stratified Layers (A5) (LRR C) Depleted Matrix (F3) Other (Explain in Remarks)
1 cm Muck (A9) (LRR D) Redox Dark Surface (F6)
3Indicators of hydrophytic vegetation and wetland hydrology must be present.
Depleted Below Dark Surface (A11) Depleted Dark Surface (F7)
Thick Dark Surface (A12) Redox Depressions (F8)
Sandy Mucky Mineral (S1) Vernal Pools (F9)
Sandy Gleyed Matrix (S4)
Restrictive Layer (if present):
Hydric Soils Present? Yes No
Type:
Depth (Inches):
Remarks:
HYDROLOGY Wetland Hydrology Indicators:
Primary Indicators (any one indicator is sufficient) Secondary Indicators (2 or more required)
Surface Water (A1) Salt Crust (B11) Water Marks (B1) (Riverine)
High Water Table (A2) Biotic Crust (B12) Sediment Deposits (B2) (Riverine)
Saturation (A3) Aquatic Invertebrates (B13) Drift Deposits (B3) (Riverine)
Water Marks (B1) (Nonriverine) Hydrogen Sulfide Odor (C1) Drainage Patterns (B10)
Sediment Deposits (B2) (Nonriverine) Oxidized Rhizospheres along Living Roots (C3) Dry-Season Water Table (C2)
Drift Deposits (B3) (Nonriverine) Presence of Reduced Iron (C4) Crayfish Burrows (C8)
Surface Soil Cracks (B6) Recent Iron Reduction in Tilled Soils (C6) Saturation Visible on Aerial Imagery (C9)
Inundation Visible on Aerial Imagery (B7) Thin Muck Surface (C7) Shallow Aquitard (D3)
Water-Stained Leaves (B9) Other (Explain in Remarks) FAC-Neutral Test (D5)
Field Observations:
Surface Water Present? Yes No Depth (inches): n/a Wetland Hydrology Present?
Yes
No
Water Table Present? Yes No Depth (inches): None to 16
Saturation Present? (includes capillary fringe)
Yes No Depth (inches): None to 16
Describe Recorded Data (stream gauge, monitoring well, aerial photos, previous inspections), if available:
Remarks:
Project Site: San Francisquito Creek Flood Protection Project
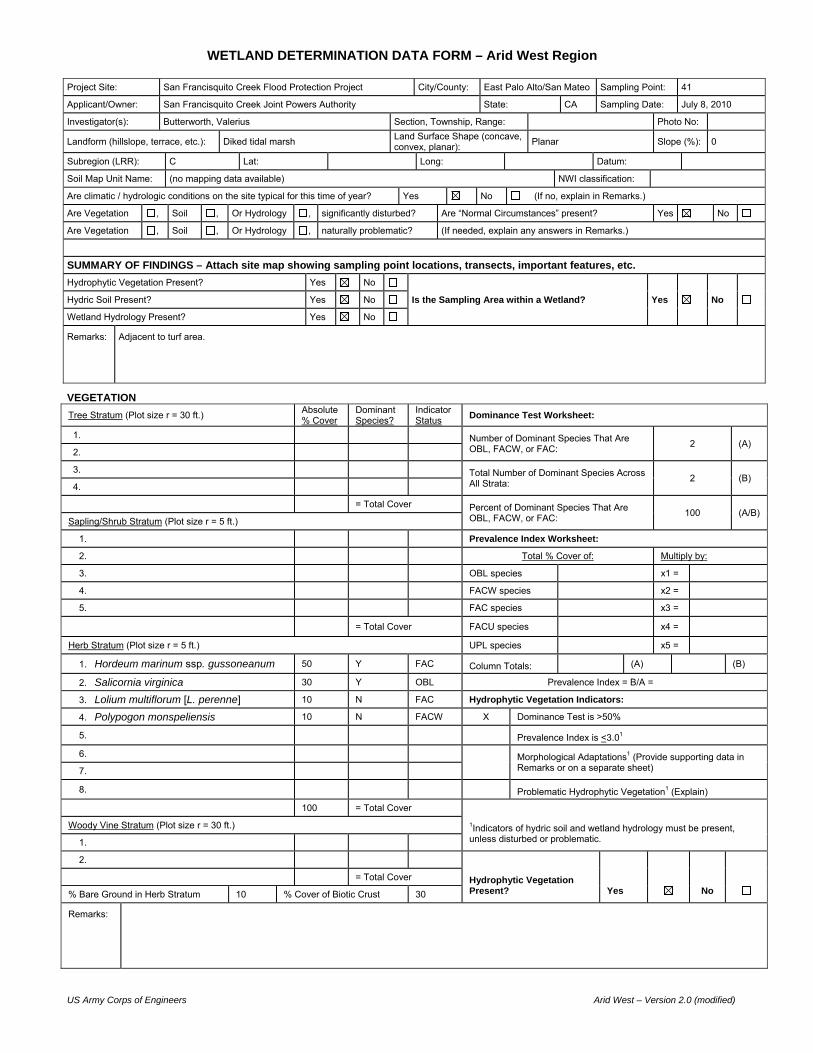
US Army Corps of Engineers Arid West – Version 2.0 (modified)
WETLAND DETERMINATION DATA FORM – Arid West Region
VEGETATION
Tree Stratum (Plot size r = 30 ft.) Absolute % Cover
Dominant Species?
Indicator Status
Dominance Test Worksheet:
1. Number of Dominant Species That Are OBL, FACW, or FAC:
2 (A) 2.
3. Total Number of Dominant Species Across All Strata:
2 (B) 4.
= Total Cover Percent of Dominant Species That Are OBL, FACW, or FAC:
100 (A/B) Sapling/Shrub Stratum (Plot size r = 5 ft.)
1. Prevalence Index Worksheet:
2. Total % Cover of: Multiply by:
3. OBL species x1 =
4. FACW species x2 =
5. FAC species x3 =
= Total Cover FACU species x4 =
Herb Stratum (Plot size r = 5 ft.) UPL species x5 =
1. Hordeum marinum ssp. gussoneanum 50 Y FAC Column Totals: (A) (B)
2. Salicornia virginica 30 Y OBL Prevalence Index = B/A =
3. Lolium multiflorum [L. perenne] 10 N FAC Hydrophytic Vegetation Indicators:
4. Polypogon monspeliensis 10 N FACW X Dominance Test is >50%
5. Prevalence Index is <3.01
6.
Morphological Adaptations1 (Provide supporting data in Remarks or on a separate sheet) 7.
8. Problematic Hydrophytic Vegetation1 (Explain)
100 = Total Cover
1Indicators of hydric soil and wetland hydrology must be present, unless disturbed or problematic.
Woody Vine Stratum (Plot size r = 30 ft.)
1.
2.
Hydrophytic Vegetation Present? Yes No
= Total Cover
% Bare Ground in Herb Stratum 10 % Cover of Biotic Crust 30
Remarks:
Project Site: San Francisquito Creek Flood Protection Project City/County: East Palo Alto/San Mateo Sampling Point: 41
Applicant/Owner: San Francisquito Creek Joint Powers Authority State: CA Sampling Date: July 8, 2010
Investigator(s): Butterworth, Valerius Section, Township, Range: Photo No:
Landform (hillslope, terrace, etc.): Diked tidal marsh Land Surface Shape (concave, convex, planar):
Planar Slope (%): 0
Subregion (LRR): C Lat: Long: Datum:
Soil Map Unit Name: (no mapping data available) NWI classification:
Are climatic / hydrologic conditions on the site typical for this time of year? Yes No (If no, explain in Remarks.)
Are Vegetation , Soil , Or Hydrology , significantly disturbed? Are “Normal Circumstances” present? Yes No
Are Vegetation , Soil , Or Hydrology , naturally problematic? (If needed, explain any answers in Remarks.)
SUMMARY OF FINDINGS – Attach site map showing sampling point locations, transects, important features, etc.
Hydrophytic Vegetation Present? Yes No
Is the Sampling Area within a Wetland? Yes No Hydric Soil Present? Yes No
Wetland Hydrology Present? Yes No
Remarks:
Adjacent to turf area.

US Army Corps of Engineers Arid West – Version 2.0 (modified)
SOIL Sampling Point: 41
Profile Description: (Describe to the depth needed to document the indicator or confirm the absence of indicators.)
Depth Matrix Redox Features
(inches) Color (moist) % Color (Moist) % Type1 Loc2 Texture Horizon Remarks
0-6 10YR4/1 85 7.5YR4/6 15 C PL, M sicl A
6-14 10YR4/3 100 cl B
1Type: C= Concentration, D=Depletion, RM=Reduced Matrix, CS=Covered or Coated Sand Grains. 2Location: PL=Pore Lining, LRC=Living Root Channel, M=Matrix.
Hydric Soil Indicators: (Applicable to all LRRs, unless otherwise noted.) Indicators for Problematic Hydric Soils3:
Histosol (A1) Sandy Redox (S5) 1 cm Muck (A9) (LRR C)
Histic Epipedon (A2) Stripped Matrix (S6) 2 cm Muck (A10) (LRR B)
Black Histic (A3) Loamy Mucky Mineral (F1) Reduced Vertic (F18)
Hydrogen Sulfide (A4) Loamy Gleyed Matrix (F2) Red Parent Material (TF2)
Stratified Layers (A5) (LRR C) Depleted Matrix (F3) Other (Explain in Remarks)
1 cm Muck (A9) (LRR D) Redox Dark Surface (F6)
3Indicators of hydrophytic vegetation and wetland hydrology must be present.
Depleted Below Dark Surface (A11) Depleted Dark Surface (F7)
Thick Dark Surface (A12) Redox Depressions (F8)
Sandy Mucky Mineral (S1) Vernal Pools (F9)
Sandy Gleyed Matrix (S4)
Restrictive Layer (if present):
Hydric Soils Present? Yes No
Type:
Depth (Inches):
Remarks:
HYDROLOGY Wetland Hydrology Indicators:
Primary Indicators (any one indicator is sufficient) Secondary Indicators (2 or more required)
Surface Water (A1) Salt Crust (B11) Water Marks (B1) (Riverine)
High Water Table (A2) Biotic Crust (B12) Sediment Deposits (B2) (Riverine)
Saturation (A3) Aquatic Invertebrates (B13) Drift Deposits (B3) (Riverine)
Water Marks (B1) (Nonriverine) Hydrogen Sulfide Odor (C1) Drainage Patterns (B10)
Sediment Deposits (B2) (Nonriverine) Oxidized Rhizospheres along Living Roots (C3) Dry-Season Water Table (C2)
Drift Deposits (B3) (Nonriverine) Presence of Reduced Iron (C4) Crayfish Burrows (C8)
Surface Soil Cracks (B6) Recent Iron Reduction in Tilled Soils (C6) Saturation Visible on Aerial Imagery (C9)
Inundation Visible on Aerial Imagery (B7) Thin Muck Surface (C7) Shallow Aquitard (D3)
Water-Stained Leaves (B9) Other (Explain in Remarks) FAC-Neutral Test (D5)
Field Observations:
Surface Water Present? Yes No Depth (inches): n/a Wetland Hydrology Present?
Yes
No
Water Table Present? Yes No Depth (inches): None to 14
Saturation Present? (includes capillary fringe)
Yes No Depth (inches): None to 14
Describe Recorded Data (stream gauge, monitoring well, aerial photos, previous inspections), if available:
Remarks:
Project Site: San Francisquito Creek Flood Protection Project
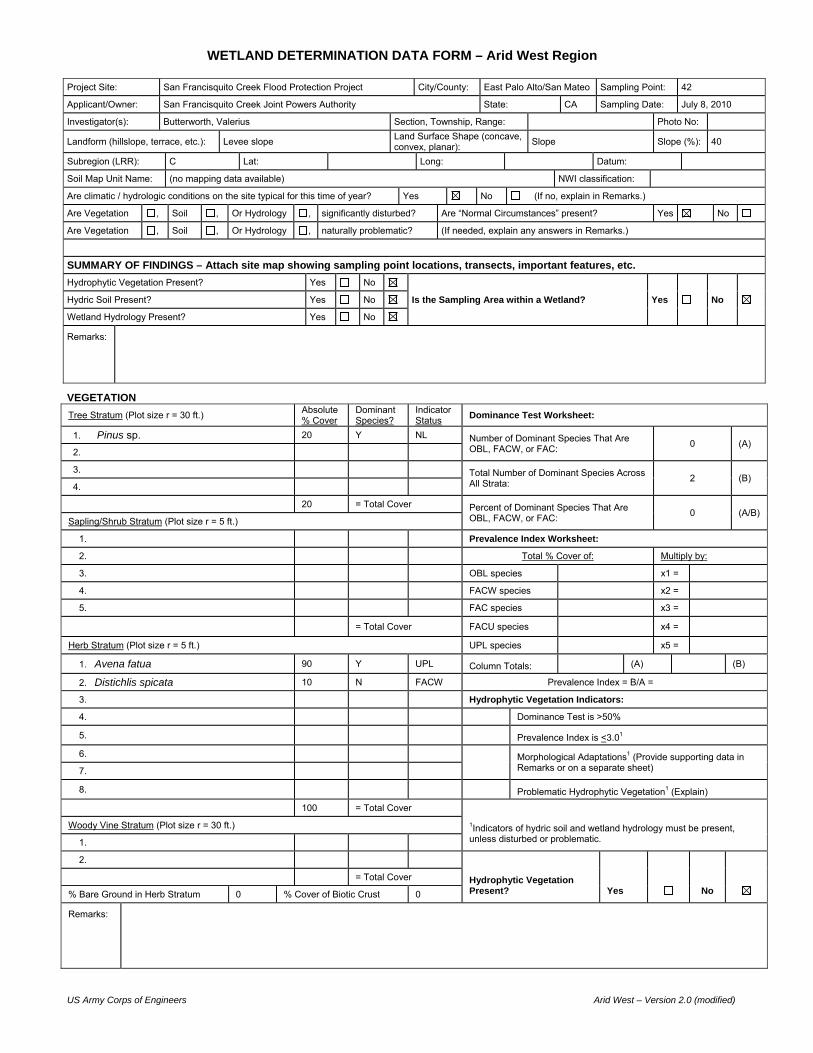
US Army Corps of Engineers Arid West – Version 2.0 (modified)
WETLAND DETERMINATION DATA FORM – Arid West Region
VEGETATION
Tree Stratum (Plot size r = 30 ft.) Absolute % Cover
Dominant Species?
Indicator Status
Dominance Test Worksheet:
1. Pinus sp. 20 Y NL Number of Dominant Species That Are OBL, FACW, or FAC:
0 (A) 2.
3. Total Number of Dominant Species Across All Strata:
2 (B) 4.
20 = Total Cover Percent of Dominant Species That Are OBL, FACW, or FAC:
0 (A/B) Sapling/Shrub Stratum (Plot size r = 5 ft.)
1. Prevalence Index Worksheet:
2. Total % Cover of: Multiply by:
3. OBL species x1 =
4. FACW species x2 =
5. FAC species x3 =
= Total Cover FACU species x4 =
Herb Stratum (Plot size r = 5 ft.) UPL species x5 =
1. Avena fatua 90 Y UPL Column Totals: (A) (B)
2. Distichlis spicata 10 N FACW Prevalence Index = B/A =
3. Hydrophytic Vegetation Indicators:
4. Dominance Test is >50%
5. Prevalence Index is <3.01
6.
Morphological Adaptations1 (Provide supporting data in Remarks or on a separate sheet) 7.
8. Problematic Hydrophytic Vegetation1 (Explain)
100 = Total Cover
1Indicators of hydric soil and wetland hydrology must be present, unless disturbed or problematic.
Woody Vine Stratum (Plot size r = 30 ft.)
1.
2.
Hydrophytic Vegetation Present? Yes No
= Total Cover
% Bare Ground in Herb Stratum 0 % Cover of Biotic Crust 0
Remarks:
Project Site: San Francisquito Creek Flood Protection Project City/County: East Palo Alto/San Mateo Sampling Point: 42
Applicant/Owner: San Francisquito Creek Joint Powers Authority State: CA Sampling Date: July 8, 2010
Investigator(s): Butterworth, Valerius Section, Township, Range: Photo No:
Landform (hillslope, terrace, etc.): Levee slope Land Surface Shape (concave, convex, planar):
Slope Slope (%): 40
Subregion (LRR): C Lat: Long: Datum:
Soil Map Unit Name: (no mapping data available) NWI classification:
Are climatic / hydrologic conditions on the site typical for this time of year? Yes No (If no, explain in Remarks.)
Are Vegetation , Soil , Or Hydrology , significantly disturbed? Are “Normal Circumstances” present? Yes No
Are Vegetation , Soil , Or Hydrology , naturally problematic? (If needed, explain any answers in Remarks.)
SUMMARY OF FINDINGS – Attach site map showing sampling point locations, transects, important features, etc.
Hydrophytic Vegetation Present? Yes No
Is the Sampling Area within a Wetland? Yes No Hydric Soil Present? Yes No
Wetland Hydrology Present? Yes No
Remarks:

US Army Corps of Engineers Arid West – Version 2.0 (modified)
SOIL Sampling Point: 42
Profile Description: (Describe to the depth needed to document the indicator or confirm the absence of indicators.)
Depth Matrix Redox Features
(inches) Color (moist) % Color (Moist) % Type1 Loc2 Texture Horizon Remarks
0-11 10YR3/2 100 grcl Fill
1Type: C= Concentration, D=Depletion, RM=Reduced Matrix, CS=Covered or Coated Sand Grains. 2Location: PL=Pore Lining, LRC=Living Root Channel, M=Matrix.
Hydric Soil Indicators: (Applicable to all LRRs, unless otherwise noted.) Indicators for Problematic Hydric Soils3:
Histosol (A1) Sandy Redox (S5) 1 cm Muck (A9) (LRR C)
Histic Epipedon (A2) Stripped Matrix (S6) 2 cm Muck (A10) (LRR B)
Black Histic (A3) Loamy Mucky Mineral (F1) Reduced Vertic (F18)
Hydrogen Sulfide (A4) Loamy Gleyed Matrix (F2) Red Parent Material (TF2)
Stratified Layers (A5) (LRR C) Depleted Matrix (F3) Other (Explain in Remarks)
1 cm Muck (A9) (LRR D) Redox Dark Surface (F6)
3Indicators of hydrophytic vegetation and wetland hydrology must be present.
Depleted Below Dark Surface (A11) Depleted Dark Surface (F7)
Thick Dark Surface (A12) Redox Depressions (F8)
Sandy Mucky Mineral (S1) Vernal Pools (F9)
Sandy Gleyed Matrix (S4)
Restrictive Layer (if present):
Hydric Soils Present? Yes No
Type:
Depth (Inches):
Remarks: Refusal at 13”.
HYDROLOGY Wetland Hydrology Indicators:
Primary Indicators (any one indicator is sufficient) Secondary Indicators (2 or more required)
Surface Water (A1) Salt Crust (B11) Water Marks (B1) (Riverine)
High Water Table (A2) Biotic Crust (B12) Sediment Deposits (B2) (Riverine)
Saturation (A3) Aquatic Invertebrates (B13) Drift Deposits (B3) (Riverine)
Water Marks (B1) (Nonriverine) Hydrogen Sulfide Odor (C1) Drainage Patterns (B10)
Sediment Deposits (B2) (Nonriverine) Oxidized Rhizospheres along Living Roots (C3) Dry-Season Water Table (C2)
Drift Deposits (B3) (Nonriverine) Presence of Reduced Iron (C4) Crayfish Burrows (C8)
Surface Soil Cracks (B6) Recent Iron Reduction in Tilled Soils (C6) Saturation Visible on Aerial Imagery (C9)
Inundation Visible on Aerial Imagery (B7) Thin Muck Surface (C7) Shallow Aquitard (D3)
Water-Stained Leaves (B9) Other (Explain in Remarks) FAC-Neutral Test (D5)
Field Observations:
Surface Water Present? Yes No Depth (inches): n/a Wetland Hydrology Present?
Yes
No
Water Table Present? Yes No Depth (inches): None to 11
Saturation Present? (includes capillary fringe)
Yes No Depth (inches): None to 11
Describe Recorded Data (stream gauge, monitoring well, aerial photos, previous inspections), if available:
Remarks:
Project Site: San Francisquito Creek Flood Protection Project

US Army Corps of Engineers Arid West – Version 2.0 (modified)
WETLAND DETERMINATION DATA FORM – Arid West Region
VEGETATION
Tree Stratum (Plot size r = 30 ft.) Absolute % Cover
Dominant Species?
Indicator Status
Dominance Test Worksheet:
1. Number of Dominant Species That Are OBL, FACW, or FAC:
1 (A) 2.
3. Total Number of Dominant Species Across All Strata:
1 (B) 4.
= Total Cover Percent of Dominant Species That Are OBL, FACW, or FAC:
100 (A/B) Sapling/Shrub Stratum (Plot size r = 5 ft.)
1. Prevalence Index Worksheet:
2. Total % Cover of: Multiply by:
3. OBL species x1 =
4. FACW species x2 =
5. FAC species x3 =
= Total Cover FACU species x4 =
Herb Stratum (Plot size r = 5 ft.) UPL species x5 =
1. Cynodon dactylon 95 Y FAC Column Totals: (A) (B)
2. Rumex crispus 5 N FACW Prevalence Index = B/A =
3. Unknown turf grass 2 N undet. Hydrophytic Vegetation Indicators:
4. X Dominance Test is >50% see remarks
5. Prevalence Index is <3.01
6.
Morphological Adaptations1 (Provide supporting data in Remarks or on a separate sheet) 7.
8. Problematic Hydrophytic Vegetation1 (Explain)
102 = Total Cover
1Indicators of hydric soil and wetland hydrology must be present, unless disturbed or problematic.
Woody Vine Stratum (Plot size r = 30 ft.)
1.
2.
Hydrophytic Vegetation Present? Yes No
= Total Cover
% Bare Ground in Herb Stratum 0 % Cover of Biotic Crust 0
Remarks:
Sampling point taken on irrigated fairway of golf course; supplemental water may influence vegetation that grows in the area
Project Site: San Francisquito Creek Flood Protection Project City/County: East Palo Alto/San Mateo Sampling Point: 43
Applicant/Owner: San Francisquito Creek Joint Powers Authority State: CA Sampling Date: February 22, 2012
Investigator(s): Butterworth, Brimacombe Section, Township, Range: Photo No:
Landform (hillslope, terrace, etc.): filled tidal marsh Land Surface Shape (concave, convex, planar):
convex Slope (%): 5
Subregion (LRR): C Lat: Long: Datum:
Soil Map Unit Name: Aquic Xerofluvents, bay mud substratum, 0 to 2 percent slopes (120) NWI classification:
Are climatic / hydrologic conditions on the site typical for this time of year? Yes No (If no, explain in Remarks.)
Are Vegetation , Soil , Or Hydrology , significantly disturbed? Are “Normal Circumstances” present? Yes No
Are Vegetation , Soil , Or Hydrology naturally problematic? (If needed, explain any answers in Remarks.)
SUMMARY OF FINDINGS – Attach site map showing sampling point locations, transects, important features, etc.
Hydrophytic Vegetation Present? Yes No
Is the Sampling Area within a Wetland? Yes No Hydric Soil Present? Yes No
Wetland Hydrology Present? Yes No
Remarks:
At 35% of average annual precipitation to date.

US Army Corps of Engineers Arid West – Version 2.0 (modified)
SOIL Sampling Point: 43
Profile Description: (Describe to the depth needed to document the indicator or confirm the absence of indicators.)
Depth Matrix Redox Features
(inches) Color (moist) % Color (Moist) % Type1 Loc2 Texture Horizon Remarks
0-9 10YR3/2 100 l Fill 1
9-21 10YR3/2 100 cl Fill 2
1Type: C= Concentration, D=Depletion, RM=Reduced Matrix, CS=Covered or Coated Sand Grains. 2Location: PL=Pore Lining, LRC=Living Root Channel, M=Matrix.
Hydric Soil Indicators: (Applicable to all LRRs, unless otherwise noted.) Indicators for Problematic Hydric Soils3:
Histosol (A1) Sandy Redox (S5) 1 cm Muck (A9) (LRR C)
Histic Epipedon (A2) Stripped Matrix (S6) 2 cm Muck (A10) (LRR B)
Black Histic (A3) Loamy Mucky Mineral (F1) Reduced Vertic (F18)
Hydrogen Sulfide (A4) Loamy Gleyed Matrix (F2) Red Parent Material (TF2)
Stratified Layers (A5) (LRR C) Depleted Matrix (F3) Other (Explain in Remarks)
1 cm Muck (A9) (LRR D) Redox Dark Surface (F6)
3Indicators of hydrophytic vegetation and wetland hydrology must be present.
Depleted Below Dark Surface (A11) Depleted Dark Surface (F7)
Thick Dark Surface (A12) Redox Depressions (F8)
Sandy Mucky Mineral (S1) Vernal Pools (F9)
Sandy Gleyed Matrix (S4)
Restrictive Layer (if present):
Hydric Soils Present? Yes No
Type:
Depth (Inches):
Remarks: Soil consists of fill material
HYDROLOGY Wetland Hydrology Indicators:
Primary Indicators (any one indicator is sufficient) Secondary Indicators (2 or more required)
Surface Water (A1) Salt Crust (B11) Water Marks (B1) (Riverine)
High Water Table (A2) Biotic Crust (B12) Sediment Deposits (B2) (Riverine)
Saturation (A3) Aquatic Invertebrates (B13) Drift Deposits (B3) (Riverine)
Water Marks (B1) (Nonriverine) Hydrogen Sulfide Odor (C1) Drainage Patterns (B10)
Sediment Deposits (B2) (Nonriverine) Oxidized Rhizospheres along Living Roots (C3) Dry-Season Water Table (C2)
Drift Deposits (B3) (Nonriverine) Presence of Reduced Iron (C4) Crayfish Burrows (C8)
Surface Soil Cracks (B6) Recent Iron Reduction in Tilled Soils (C6) Saturation Visible on Aerial Imagery (C9)
Inundation Visible on Aerial Imagery (B7) Thin Muck Surface (C7) Shallow Aquitard (D3)
Water-Stained Leaves (B9) Other (Explain in Remarks) FAC-Neutral Test (D5)
Field Observations:
Surface Water Present? Yes No Depth (inches): n/a Wetland Hydrology Present?
Yes
No
Water Table Present? Yes No Depth (inches): None to 21
Saturation Present? (includes capillary fringe)
Yes No Depth (inches): None to 21
Describe Recorded Data (stream gauge, monitoring well, aerial photos, previous inspections), if available:
Remarks:
Project Site: San Francisquito Creek Flood Protection Project
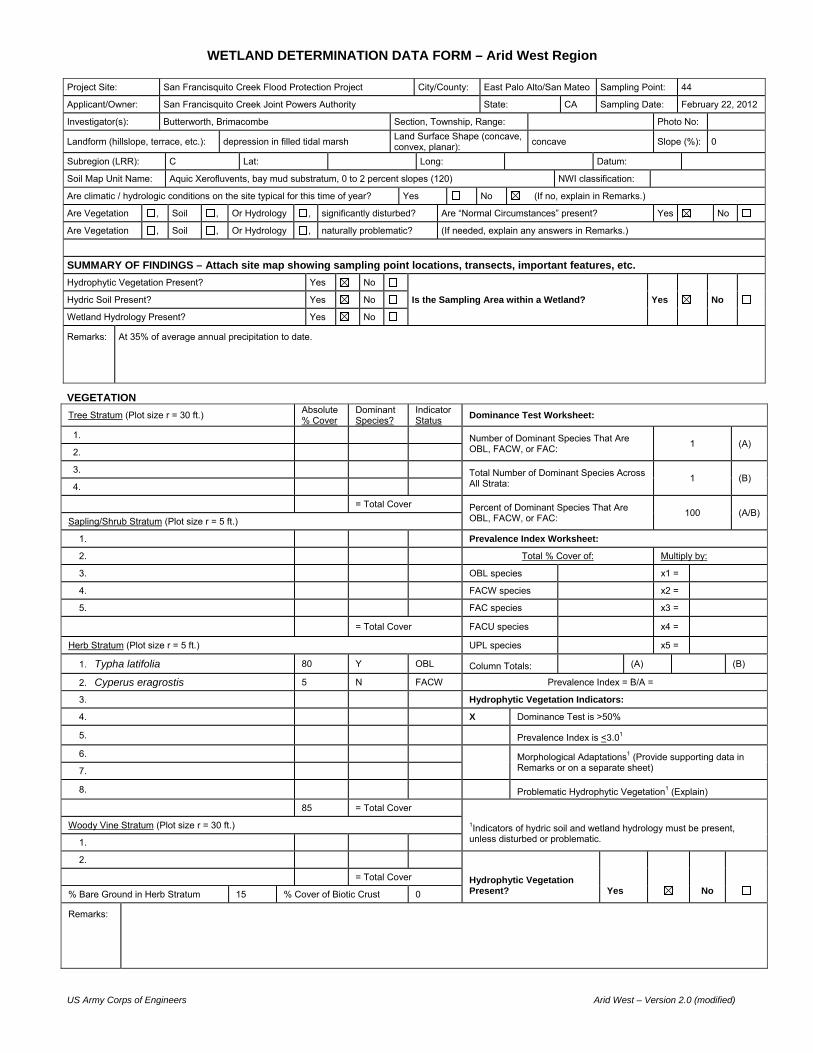
US Army Corps of Engineers Arid West – Version 2.0 (modified)
WETLAND DETERMINATION DATA FORM – Arid West Region
VEGETATION
Tree Stratum (Plot size r = 30 ft.) Absolute % Cover
Dominant Species?
Indicator Status
Dominance Test Worksheet:
1. Number of Dominant Species That Are OBL, FACW, or FAC:
1 (A) 2.
3. Total Number of Dominant Species Across All Strata:
1 (B) 4.
= Total Cover Percent of Dominant Species That Are OBL, FACW, or FAC:
100 (A/B) Sapling/Shrub Stratum (Plot size r = 5 ft.)
1. Prevalence Index Worksheet:
2. Total % Cover of: Multiply by:
3. OBL species x1 =
4. FACW species x2 =
5. FAC species x3 =
= Total Cover FACU species x4 =
Herb Stratum (Plot size r = 5 ft.) UPL species x5 =
1. Typha latifolia 80 Y OBL Column Totals: (A) (B)
2. Cyperus eragrostis 5 N FACW Prevalence Index = B/A =
3. Hydrophytic Vegetation Indicators:
4. X Dominance Test is >50%
5. Prevalence Index is <3.01
6.
Morphological Adaptations1 (Provide supporting data in Remarks or on a separate sheet) 7.
8. Problematic Hydrophytic Vegetation1 (Explain)
85 = Total Cover
1Indicators of hydric soil and wetland hydrology must be present, unless disturbed or problematic.
Woody Vine Stratum (Plot size r = 30 ft.)
1.
2.
Hydrophytic Vegetation Present? Yes No
= Total Cover
% Bare Ground in Herb Stratum 15 % Cover of Biotic Crust 0
Remarks:
Project Site: San Francisquito Creek Flood Protection Project City/County: East Palo Alto/San Mateo Sampling Point: 44
Applicant/Owner: San Francisquito Creek Joint Powers Authority State: CA Sampling Date: February 22, 2012
Investigator(s): Butterworth, Brimacombe Section, Township, Range: Photo No:
Landform (hillslope, terrace, etc.): depression in filled tidal marsh Land Surface Shape (concave, convex, planar):
concave Slope (%): 0
Subregion (LRR): C Lat: Long: Datum:
Soil Map Unit Name: Aquic Xerofluvents, bay mud substratum, 0 to 2 percent slopes (120) NWI classification:
Are climatic / hydrologic conditions on the site typical for this time of year? Yes No (If no, explain in Remarks.)
Are Vegetation , Soil , Or Hydrology , significantly disturbed? Are “Normal Circumstances” present? Yes No
Are Vegetation , Soil , Or Hydrology , naturally problematic? (If needed, explain any answers in Remarks.)
SUMMARY OF FINDINGS – Attach site map showing sampling point locations, transects, important features, etc.
Hydrophytic Vegetation Present? Yes No
Is the Sampling Area within a Wetland? Yes No Hydric Soil Present? Yes No
Wetland Hydrology Present? Yes No
Remarks:
At 35% of average annual precipitation to date.

US Army Corps of Engineers Arid West – Version 2.0 (modified)
SOIL Sampling Point: 44
Profile Description: (Describe to the depth needed to document the indicator or confirm the absence of indicators.)
Depth Matrix Redox Features
(inches) Color (moist) % Color (Moist) % Type1 Loc2 Texture Horizon Remarks
0-5 5Y 2.5/1 100 l A
5-11 Gley 1 3/10Y 100 l Bg
1Type: C= Concentration, D=Depletion, RM=Reduced Matrix, CS=Covered or Coated Sand Grains. 2Location: PL=Pore Lining, LRC=Living Root Channel, M=Matrix.
Hydric Soil Indicators: (Applicable to all LRRs, unless otherwise noted.) Indicators for Problematic Hydric Soils3:
Histosol (A1) Sandy Redox (S5) 1 cm Muck (A9) (LRR C)
Histic Epipedon (A2) Stripped Matrix (S6) 2 cm Muck (A10) (LRR B)
Black Histic (A3) Loamy Mucky Mineral (F1) Reduced Vertic (F18)
Hydrogen Sulfide (A4) Loamy Gleyed Matrix (F2) Red Parent Material (TF2)
Stratified Layers (A5) (LRR C) Depleted Matrix (F3) Other (Explain in Remarks)
1 cm Muck (A9) (LRR D) Redox Dark Surface (F6)
3Indicators of hydrophytic vegetation and wetland hydrology must be present.
Depleted Below Dark Surface (A11) Depleted Dark Surface (F7)
Thick Dark Surface (A12) Redox Depressions (F8)
Sandy Mucky Mineral (S1) Vernal Pools (F9)
Sandy Gleyed Matrix (S4)
Restrictive Layer (if present):
Hydric Soils Present? Yes No
Type:
Depth (Inches):
Remarks:
HYDROLOGY Wetland Hydrology Indicators:
Primary Indicators (any one indicator is sufficient) Secondary Indicators (2 or more required)
Surface Water (A1) Salt Crust (B11) Water Marks (B1) (Riverine)
High Water Table (A2) Biotic Crust (B12) Sediment Deposits (B2) (Riverine)
Saturation (A3) Aquatic Invertebrates (B13) Drift Deposits (B3) (Riverine)
Water Marks (B1) (Nonriverine) Hydrogen Sulfide Odor (C1) Drainage Patterns (B10)
Sediment Deposits (B2) (Nonriverine) Oxidized Rhizospheres along Living Roots (C3) Dry-Season Water Table (C2)
Drift Deposits (B3) (Nonriverine) Presence of Reduced Iron (C4) Crayfish Burrows (C8)
Surface Soil Cracks (B6) Recent Iron Reduction in Tilled Soils (C6) Saturation Visible on Aerial Imagery (C9)
Inundation Visible on Aerial Imagery (B7) Thin Muck Surface (C7) Shallow Aquitard (D3)
Water-Stained Leaves (B9) Other (Explain in Remarks) FAC-Neutral Test (D5)
Field Observations:
Surface Water Present? Yes No Depth (inches): n/a Wetland Hydrology Present?
Yes
No
Water Table Present? Yes No Depth (inches): at 5”
Saturation Present? (includes capillary fringe)
Yes No Depth (inches): at 4”
Describe Recorded Data (stream gauge, monitoring well, aerial photos, previous inspections), if available:
Remarks:
Project Site: San Francisquito Creek Flood Protection Project
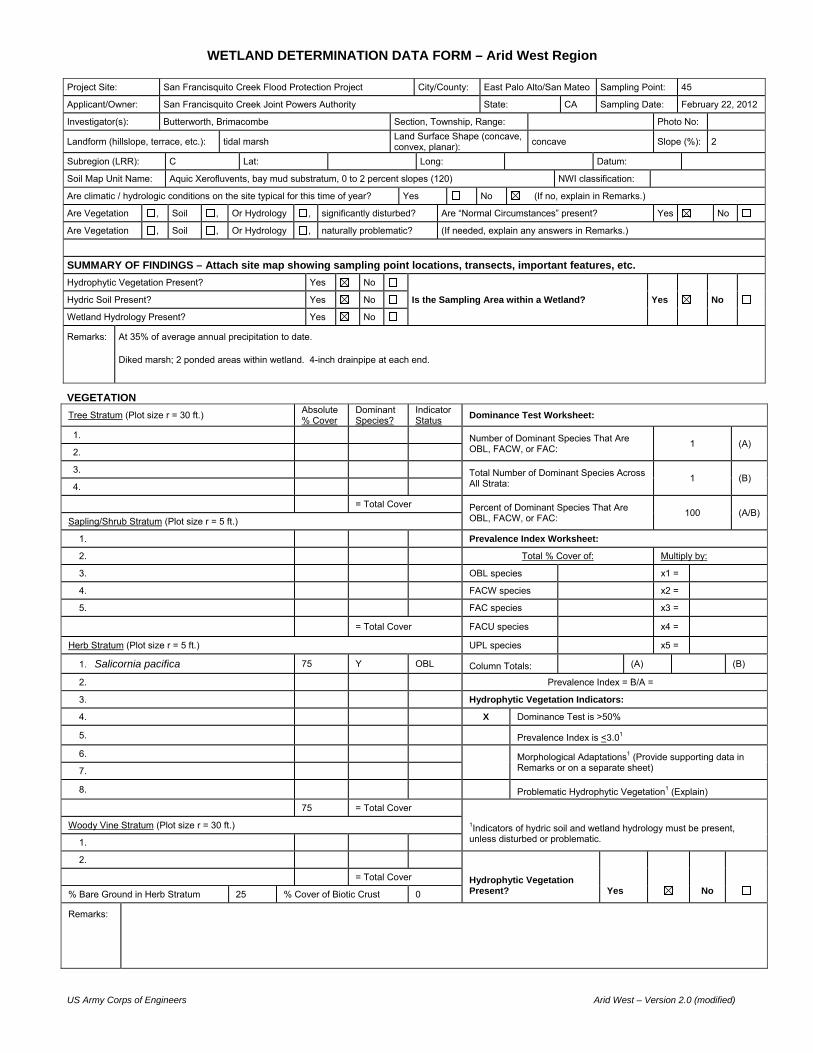
US Army Corps of Engineers Arid West – Version 2.0 (modified)
WETLAND DETERMINATION DATA FORM – Arid West Region
VEGETATION
Tree Stratum (Plot size r = 30 ft.) Absolute % Cover
Dominant Species?
Indicator Status
Dominance Test Worksheet:
1. Number of Dominant Species That Are OBL, FACW, or FAC:
1 (A) 2.
3. Total Number of Dominant Species Across All Strata:
1 (B) 4.
= Total Cover Percent of Dominant Species That Are OBL, FACW, or FAC:
100 (A/B) Sapling/Shrub Stratum (Plot size r = 5 ft.)
1. Prevalence Index Worksheet:
2. Total % Cover of: Multiply by:
3. OBL species x1 =
4. FACW species x2 =
5. FAC species x3 =
= Total Cover FACU species x4 =
Herb Stratum (Plot size r = 5 ft.) UPL species x5 =
1. Salicornia pacifica 75 Y OBL Column Totals: (A) (B)
2. Prevalence Index = B/A =
3. Hydrophytic Vegetation Indicators:
4. X Dominance Test is >50%
5. Prevalence Index is <3.01
6.
Morphological Adaptations1 (Provide supporting data in Remarks or on a separate sheet) 7.
8. Problematic Hydrophytic Vegetation1 (Explain)
75 = Total Cover
1Indicators of hydric soil and wetland hydrology must be present, unless disturbed or problematic.
Woody Vine Stratum (Plot size r = 30 ft.)
1.
2.
Hydrophytic Vegetation Present? Yes No
= Total Cover
% Bare Ground in Herb Stratum 25 % Cover of Biotic Crust 0
Remarks:
Project Site: San Francisquito Creek Flood Protection Project City/County: East Palo Alto/San Mateo Sampling Point: 45
Applicant/Owner: San Francisquito Creek Joint Powers Authority State: CA Sampling Date: February 22, 2012
Investigator(s): Butterworth, Brimacombe Section, Township, Range: Photo No:
Landform (hillslope, terrace, etc.): tidal marsh Land Surface Shape (concave, convex, planar):
concave Slope (%): 2
Subregion (LRR): C Lat: Long: Datum:
Soil Map Unit Name: Aquic Xerofluvents, bay mud substratum, 0 to 2 percent slopes (120) NWI classification:
Are climatic / hydrologic conditions on the site typical for this time of year? Yes No (If no, explain in Remarks.)
Are Vegetation , Soil , Or Hydrology , significantly disturbed? Are “Normal Circumstances” present? Yes No
Are Vegetation , Soil , Or Hydrology , naturally problematic? (If needed, explain any answers in Remarks.)
SUMMARY OF FINDINGS – Attach site map showing sampling point locations, transects, important features, etc.
Hydrophytic Vegetation Present? Yes No
Is the Sampling Area within a Wetland? Yes No Hydric Soil Present? Yes No
Wetland Hydrology Present? Yes No
Remarks:
At 35% of average annual precipitation to date. Diked marsh; 2 ponded areas within wetland. 4-inch drainpipe at each end.

US Army Corps of Engineers Arid West – Version 2.0 (modified)
SOIL Sampling Point: 45
Profile Description: (Describe to the depth needed to document the indicator or confirm the absence of indicators.)
Depth Matrix Redox Features
(inches) Color (moist) % Color (Moist) % Type1 Loc2 Texture Horizon Remarks
0-6 10YR4/2 100 grl Fill 1
6-8 7.5YR 3/2 100 grcl Fill 2
8+ Refusal by high gravel content
1Type: C= Concentration, D=Depletion, RM=Reduced Matrix, CS=Covered or Coated Sand Grains. 2Location: PL=Pore Lining, LRC=Living Root Channel, M=Matrix.
Hydric Soil Indicators: (Applicable to all LRRs, unless otherwise noted.) Indicators for Problematic Hydric Soils3:
Histosol (A1) Sandy Redox (S5) 1 cm Muck (A9) (LRR C)
Histic Epipedon (A2) Stripped Matrix (S6) 2 cm Muck (A10) (LRR B)
Black Histic (A3) Loamy Mucky Mineral (F1) Reduced Vertic (F18)
Hydrogen Sulfide (A4) Loamy Gleyed Matrix (F2) Red Parent Material (TF2)
Stratified Layers (A5) (LRR C) Depleted Matrix (F3) Other (Explain in Remarks)
1 cm Muck (A9) (LRR D) Redox Dark Surface (F6)
3Indicators of hydrophytic vegetation and wetland hydrology must be present.
Depleted Below Dark Surface (A11) Depleted Dark Surface (F7)
Thick Dark Surface (A12) Redox Depressions (F8)
Sandy Mucky Mineral (S1) Vernal Pools (F9)
Sandy Gleyed Matrix (S4)
Restrictive Layer (if present):
Hydric Soils Present? Yes No
Type:
Depth (Inches):
Remarks: Fill material with low organic matter content and recent deposition appear to prevent formation of redox features.
HYDROLOGY Wetland Hydrology Indicators:
Primary Indicators (any one indicator is sufficient) Secondary Indicators (2 or more required)
Surface Water (A1) Salt Crust (B11) Water Marks (B1) (Riverine)
High Water Table (A2) Biotic Crust (B12) Sediment Deposits (B2) (Riverine)
Saturation (A3) Aquatic Invertebrates (B13) Drift Deposits (B3) (Riverine)
Water Marks (B1) (Nonriverine) Hydrogen Sulfide Odor (C1) Drainage Patterns (B10)
Sediment Deposits (B2) (Nonriverine) Oxidized Rhizospheres along Living Roots (C3) Dry-Season Water Table (C2)
Drift Deposits (B3) (Nonriverine) Presence of Reduced Iron (C4) Crayfish Burrows (C8)
Surface Soil Cracks (B6) Recent Iron Reduction in Tilled Soils (C6) Saturation Visible on Aerial Imagery (C9)
Inundation Visible on Aerial Imagery (B7) Thin Muck Surface (C7) Shallow Aquitard (D3)
Water-Stained Leaves (B9) Other (Explain in Remarks) FAC-Neutral Test (D5)
Field Observations:
Surface Water Present? Yes No Depth (inches): n/a Wetland Hydrology Present?
Yes
No
Water Table Present? Yes No Depth (inches): None to 8”
Saturation Present? (includes capillary fringe)
Yes No Depth (inches): None to 8”
Describe Recorded Data (stream gauge, monitoring well, aerial photos, previous inspections), if available:
Remarks:
Project Site: San Francisquito Creek Flood Protection Project
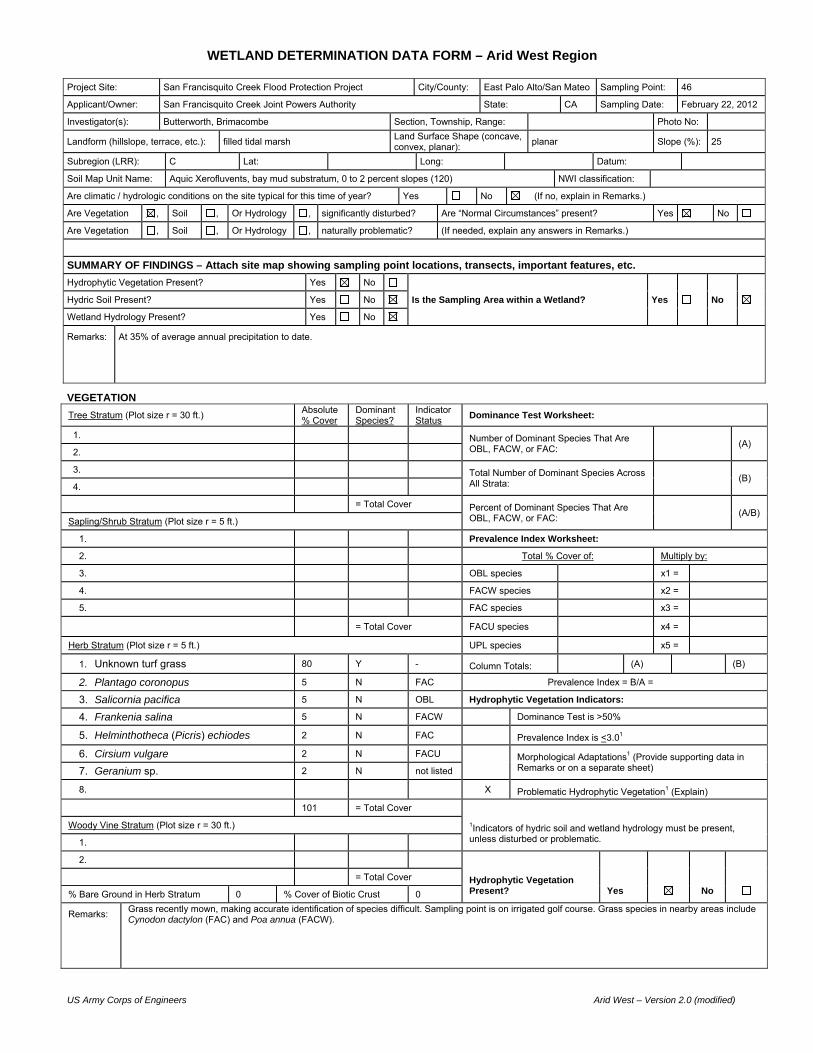
US Army Corps of Engineers Arid West – Version 2.0 (modified)
WETLAND DETERMINATION DATA FORM – Arid West Region
VEGETATION
Tree Stratum (Plot size r = 30 ft.) Absolute % Cover
Dominant Species?
Indicator Status
Dominance Test Worksheet:
1. Number of Dominant Species That Are OBL, FACW, or FAC:
(A) 2.
3. Total Number of Dominant Species Across All Strata:
(B) 4.
= Total Cover Percent of Dominant Species That Are OBL, FACW, or FAC:
(A/B) Sapling/Shrub Stratum (Plot size r = 5 ft.)
1. Prevalence Index Worksheet:
2. Total % Cover of: Multiply by:
3. OBL species x1 =
4. FACW species x2 =
5. FAC species x3 =
= Total Cover FACU species x4 =
Herb Stratum (Plot size r = 5 ft.) UPL species x5 =
1. Unknown turf grass 80 Y - Column Totals: (A) (B)
2. Plantago coronopus 5 N FAC Prevalence Index = B/A =
3. Salicornia pacifica 5 N OBL Hydrophytic Vegetation Indicators:
4. Frankenia salina 5 N FACW Dominance Test is >50%
5. Helminthotheca (Picris) echiodes 2 N FAC Prevalence Index is <3.01
6. Cirsium vulgare 2 N FACU
Morphological Adaptations1 (Provide supporting data in Remarks or on a separate sheet) 7. Geranium sp. 2 N not listed
8. X Problematic Hydrophytic Vegetation1 (Explain)
101 = Total Cover
1Indicators of hydric soil and wetland hydrology must be present, unless disturbed or problematic.
Woody Vine Stratum (Plot size r = 30 ft.)
1.
2.
Hydrophytic Vegetation Present? Yes No
= Total Cover
% Bare Ground in Herb Stratum 0 % Cover of Biotic Crust 0
Remarks: Grass recently mown, making accurate identification of species difficult. Sampling point is on irrigated golf course. Grass species in nearby areas include Cynodon dactylon (FAC) and Poa annua (FACW).
Project Site: San Francisquito Creek Flood Protection Project City/County: East Palo Alto/San Mateo Sampling Point: 46
Applicant/Owner: San Francisquito Creek Joint Powers Authority State: CA Sampling Date: February 22, 2012
Investigator(s): Butterworth, Brimacombe Section, Township, Range: Photo No:
Landform (hillslope, terrace, etc.): filled tidal marsh Land Surface Shape (concave, convex, planar):
planar Slope (%): 25
Subregion (LRR): C Lat: Long: Datum:
Soil Map Unit Name: Aquic Xerofluvents, bay mud substratum, 0 to 2 percent slopes (120) NWI classification:
Are climatic / hydrologic conditions on the site typical for this time of year? Yes No (If no, explain in Remarks.)
Are Vegetation , Soil , Or Hydrology , significantly disturbed? Are “Normal Circumstances” present? Yes No
Are Vegetation , Soil , Or Hydrology , naturally problematic? (If needed, explain any answers in Remarks.)
SUMMARY OF FINDINGS – Attach site map showing sampling point locations, transects, important features, etc.
Hydrophytic Vegetation Present? Yes No
Is the Sampling Area within a Wetland? Yes No Hydric Soil Present? Yes No
Wetland Hydrology Present? Yes No
Remarks:
At 35% of average annual precipitation to date.

US Army Corps of Engineers Arid West – Version 2.0 (modified)
SOIL Sampling Point: 46
Profile Description: (Describe to the depth needed to document the indicator or confirm the absence of indicators.)
Depth Matrix Redox Features
(inches) Color (moist) % Color (Moist) % Type1 Loc2 Texture Horizon Remarks
0-7 10YR 3/2 100 grl Fill 1
7-13 10YR 3/2 100 grc Fill 2
13-14 7.5YR 3/2 100 grc Fill 3
1Type: C= Concentration, D=Depletion, RM=Reduced Matrix, CS=Covered or Coated Sand Grains. 2Location: PL=Pore Lining, LRC=Living Root Channel, M=Matrix.
Hydric Soil Indicators: (Applicable to all LRRs, unless otherwise noted.) Indicators for Problematic Hydric Soils3:
Histosol (A1) Sandy Redox (S5) 1 cm Muck (A9) (LRR C)
Histic Epipedon (A2) Stripped Matrix (S6) 2 cm Muck (A10) (LRR B)
Black Histic (A3) Loamy Mucky Mineral (F1) Reduced Vertic (F18)
Hydrogen Sulfide (A4) Loamy Gleyed Matrix (F2) Red Parent Material (TF2)
Stratified Layers (A5) (LRR C) Depleted Matrix (F3) Other (Explain in Remarks)
1 cm Muck (A9) (LRR D) Redox Dark Surface (F6)
3Indicators of hydrophytic vegetation and wetland hydrology must be present.
Depleted Below Dark Surface (A11) Depleted Dark Surface (F7)
Thick Dark Surface (A12) Redox Depressions (F8)
Sandy Mucky Mineral (S1) Vernal Pools (F9)
Sandy Gleyed Matrix (S4)
Restrictive Layer (if present):
Hydric Soils Present? Yes No
Type:
Depth (Inches):
Remarks: Fill material
HYDROLOGY Wetland Hydrology Indicators:
Primary Indicators (any one indicator is sufficient) Secondary Indicators (2 or more required)
Surface Water (A1) Salt Crust (B11) Water Marks (B1) (Riverine)
High Water Table (A2) Biotic Crust (B12) Sediment Deposits (B2) (Riverine)
Saturation (A3) Aquatic Invertebrates (B13) Drift Deposits (B3) (Riverine)
Water Marks (B1) (Nonriverine) Hydrogen Sulfide Odor (C1) Drainage Patterns (B10)
Sediment Deposits (B2) (Nonriverine) Oxidized Rhizospheres along Living Roots (C3) Dry-Season Water Table (C2)
Drift Deposits (B3) (Nonriverine) Presence of Reduced Iron (C4) Crayfish Burrows (C8)
Surface Soil Cracks (B6) Recent Iron Reduction in Tilled Soils (C6) Saturation Visible on Aerial Imagery (C9)
Inundation Visible on Aerial Imagery (B7) Thin Muck Surface (C7) Shallow Aquitard (D3)
Water-Stained Leaves (B9) Other (Explain in Remarks) FAC-Neutral Test (D5)
Field Observations:
Surface Water Present? Yes No Depth (inches): n/a Wetland Hydrology Present?
Yes
No
Water Table Present? Yes No Depth (inches): None to 14
Saturation Present? (includes capillary fringe)
Yes No Depth (inches): None to 14
Describe Recorded Data (stream gauge, monitoring well, aerial photos, previous inspections), if available:
Remarks:
Project Site: San Francisquito Creek Flood Protection Project
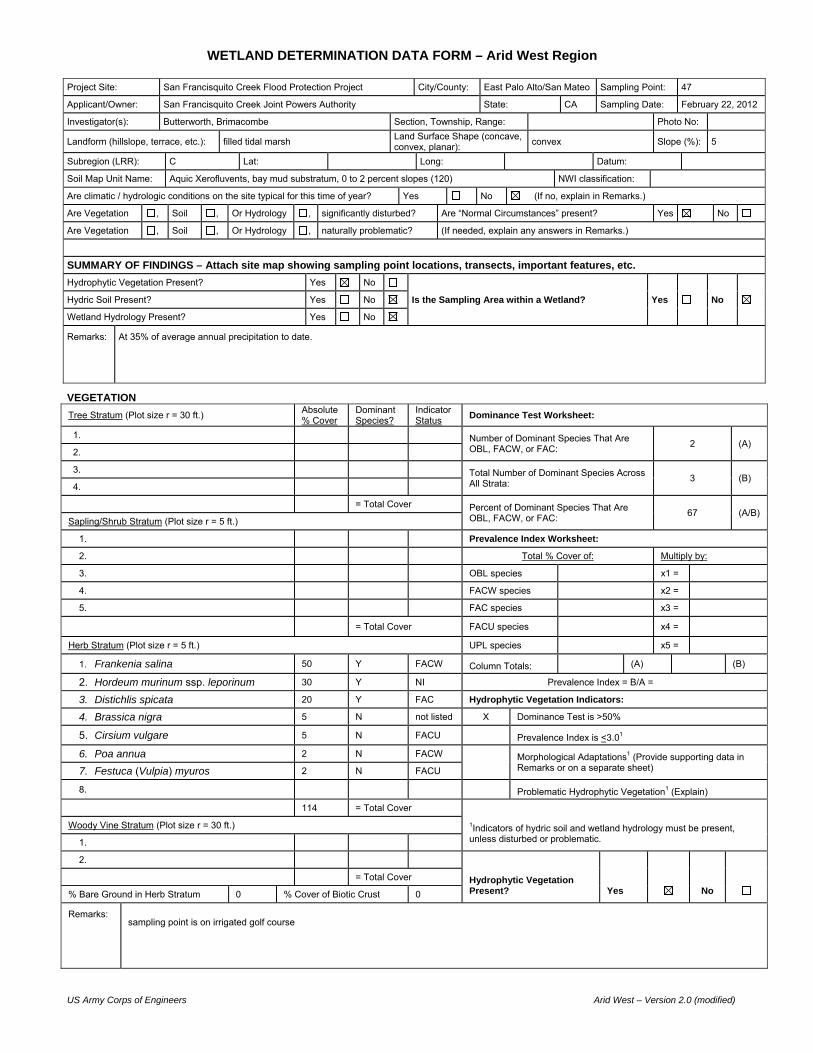
US Army Corps of Engineers Arid West – Version 2.0 (modified)
WETLAND DETERMINATION DATA FORM – Arid West Region
VEGETATION
Tree Stratum (Plot size r = 30 ft.) Absolute % Cover
Dominant Species?
Indicator Status
Dominance Test Worksheet:
1. Number of Dominant Species That Are OBL, FACW, or FAC:
2 (A) 2.
3. Total Number of Dominant Species Across All Strata:
3 (B) 4.
= Total Cover Percent of Dominant Species That Are OBL, FACW, or FAC:
67 (A/B) Sapling/Shrub Stratum (Plot size r = 5 ft.)
1. Prevalence Index Worksheet:
2. Total % Cover of: Multiply by:
3. OBL species x1 =
4. FACW species x2 =
5. FAC species x3 =
= Total Cover FACU species x4 =
Herb Stratum (Plot size r = 5 ft.) UPL species x5 =
1. Frankenia salina 50 Y FACW Column Totals: (A) (B)
2. Hordeum murinum ssp. leporinum 30 Y NI Prevalence Index = B/A =
3. Distichlis spicata 20 Y FAC Hydrophytic Vegetation Indicators:
4. Brassica nigra 5 N not listed X Dominance Test is >50%
5. Cirsium vulgare 5 N FACU Prevalence Index is <3.01
6. Poa annua 2 N FACW
Morphological Adaptations1 (Provide supporting data in Remarks or on a separate sheet) 7. Festuca (Vulpia) myuros 2 N FACU
8. Problematic Hydrophytic Vegetation1 (Explain)
114 = Total Cover
1Indicators of hydric soil and wetland hydrology must be present, unless disturbed or problematic.
Woody Vine Stratum (Plot size r = 30 ft.)
1.
2.
Hydrophytic Vegetation Present? Yes No
= Total Cover
% Bare Ground in Herb Stratum 0 % Cover of Biotic Crust 0
Remarks:
sampling point is on irrigated golf course
Project Site: San Francisquito Creek Flood Protection Project City/County: East Palo Alto/San Mateo Sampling Point: 47
Applicant/Owner: San Francisquito Creek Joint Powers Authority State: CA Sampling Date: February 22, 2012
Investigator(s): Butterworth, Brimacombe Section, Township, Range: Photo No:
Landform (hillslope, terrace, etc.): filled tidal marsh Land Surface Shape (concave, convex, planar):
convex Slope (%): 5
Subregion (LRR): C Lat: Long: Datum:
Soil Map Unit Name: Aquic Xerofluvents, bay mud substratum, 0 to 2 percent slopes (120) NWI classification:
Are climatic / hydrologic conditions on the site typical for this time of year? Yes No (If no, explain in Remarks.)
Are Vegetation , Soil , Or Hydrology , significantly disturbed? Are “Normal Circumstances” present? Yes No
Are Vegetation , Soil , Or Hydrology , naturally problematic? (If needed, explain any answers in Remarks.)
SUMMARY OF FINDINGS – Attach site map showing sampling point locations, transects, important features, etc.
Hydrophytic Vegetation Present? Yes No
Is the Sampling Area within a Wetland? Yes No Hydric Soil Present? Yes No
Wetland Hydrology Present? Yes No
Remarks:
At 35% of average annual precipitation to date.

US Army Corps of Engineers Arid West – Version 2.0 (modified)
SOIL Sampling Point: 47
Profile Description: (Describe to the depth needed to document the indicator or confirm the absence of indicators.)
Depth Matrix Redox Features
(inches) Color (moist) % Color (Moist) % Type1 Loc2 Texture Horizon Remarks
0-4 7.5YR 3/1 30 l Fill 1
and 2.5Y 3/2 70 cl Fill 1
4-17 10YR 3/2 100 cl Fill 2
17-23 10YR 4/1 80 5YR3/4 20 C M l Fill 3
1Type: C= Concentration, D=Depletion, RM=Reduced Matrix, CS=Covered or Coated Sand Grains. 2Location: PL=Pore Lining, LRC=Living Root Channel, M=Matrix.
Hydric Soil Indicators: (Applicable to all LRRs, unless otherwise noted.) Indicators for Problematic Hydric Soils3:
Histosol (A1) Sandy Redox (S5) 1 cm Muck (A9) (LRR C)
Histic Epipedon (A2) Stripped Matrix (S6) 2 cm Muck (A10) (LRR B)
Black Histic (A3) Loamy Mucky Mineral (F1) Reduced Vertic (F18)
Hydrogen Sulfide (A4) Loamy Gleyed Matrix (F2) Red Parent Material (TF2)
Stratified Layers (A5) (LRR C) Depleted Matrix (F3) Other (Explain in Remarks)
1 cm Muck (A9) (LRR D) Redox Dark Surface (F6)
3Indicators of hydrophytic vegetation and wetland hydrology must be present.
Depleted Below Dark Surface (A11) Depleted Dark Surface (F7)
Thick Dark Surface (A12) Redox Depressions (F8)
Sandy Mucky Mineral (S1) Vernal Pools (F9)
Sandy Gleyed Matrix (S4)
Restrictive Layer (if present):
Hydric Soils Present? Yes No
Type:
Depth (Inches):
Remarks:
HYDROLOGY Wetland Hydrology Indicators:
Primary Indicators (any one indicator is sufficient) Secondary Indicators (2 or more required)
Surface Water (A1) Salt Crust (B11) Water Marks (B1) (Riverine)
High Water Table (A2) Biotic Crust (B12) Sediment Deposits (B2) (Riverine)
Saturation (A3) Aquatic Invertebrates (B13) Drift Deposits (B3) (Riverine)
Water Marks (B1) (Nonriverine) Hydrogen Sulfide Odor (C1) Drainage Patterns (B10)
Sediment Deposits (B2) (Nonriverine) Oxidized Rhizospheres along Living Roots (C3) Dry-Season Water Table (C2)
Drift Deposits (B3) (Nonriverine) Presence of Reduced Iron (C4) Crayfish Burrows (C8)
Surface Soil Cracks (B6) Recent Iron Reduction in Tilled Soils (C6) Saturation Visible on Aerial Imagery (C9)
Inundation Visible on Aerial Imagery (B7) Thin Muck Surface (C7) Shallow Aquitard (D3)
Water-Stained Leaves (B9) Other (Explain in Remarks) FAC-Neutral Test (D5)
Field Observations:
Surface Water Present? Yes No Depth (inches): n/a Wetland Hydrology Present?
Yes
No
Water Table Present? Yes No Depth (inches): None to 23
Saturation Present? (includes capillary fringe)
Yes No Depth (inches): None to 23
Describe Recorded Data (stream gauge, monitoring well, aerial photos, previous inspections), if available:
Remarks:
Project Site: San Francisquito Creek Flood Protection Project

US Army Corps of Engineers Arid West – Version 2.0 (modified)
WETLAND DETERMINATION DATA FORM – Arid West Region
VEGETATION
Tree Stratum (Plot size r = 30 ft.) Absolute % Cover
Dominant Species?
Indicator Status
Dominance Test Worksheet:
1. Number of Dominant Species That Are OBL, FACW, or FAC:
2 (A) 2.
3. Total Number of Dominant Species Across All Strata:
3 (B) 4.
= Total Cover Percent of Dominant Species That Are OBL, FACW, or FAC:
67 (A/B) Sapling/Shrub Stratum (Plot size r = 5 ft.)
1. Prevalence Index Worksheet:
2. Total % Cover of: Multiply by:
3. OBL species x1 =
4. FACW species x2 =
5. FAC species x3 =
= Total Cover FACU species x4 =
Herb Stratum (Plot size r = 5 ft.) UPL species x5 =
1. Salicornia pacifica 60 Y OBL Column Totals: (A) (B)
2. Distichlis spicata 35 Y FACW Prevalence Index = B/A =
3. Frankenia salina 10 N FACW Hydrophytic Vegetation Indicators:
4. X Dominance Test is >50%
5. Prevalence Index is <3.01
6.
Morphological Adaptations1 (Provide supporting data in Remarks or on a separate sheet) 7.
8. Problematic Hydrophytic Vegetation1 (Explain)
105 = Total Cover
1Indicators of hydric soil and wetland hydrology must be present, unless disturbed or problematic.
Woody Vine Stratum (Plot size r = 30 ft.)
1.
2.
Hydrophytic Vegetation Present? Yes No
= Total Cover
% Bare Ground in Herb Stratum 5 % Cover of Biotic Crust 0
Remarks:
Project Site: San Francisquito Creek Flood Protection Project City/County: East Palo Alto/San Mateo Sampling Point: 48
Applicant/Owner: San Francisquito Creek Joint Powers Authority State: CA Sampling Date: February 22, 2012
Investigator(s): Butterworth, Brimacombe Section, Township, Range: Photo No:
Landform (hillslope, terrace, etc.): channel in filled tidal marsh Land Surface Shape (concave, convex, planar):
convex Slope (%): 1
Subregion (LRR): C Lat: Long: Datum:
Soil Map Unit Name: Aquic Xerofluvents, bay mud substratum, 0 to 2 percent slopes (120) NWI classification:
Are climatic / hydrologic conditions on the site typical for this time of year? Yes No (If no, explain in Remarks.)
Are Vegetation , Soil , Or Hydrology , significantly disturbed? Are “Normal Circumstances” present? Yes No
Are Vegetation , Soil , Or Hydrology , naturally problematic? (If needed, explain any answers in Remarks.)
SUMMARY OF FINDINGS – Attach site map showing sampling point locations, transects, important features, etc.
Hydrophytic Vegetation Present? Yes No
Is the Sampling Area within a Wetland? Yes No Hydric Soil Present? Yes No
Wetland Hydrology Present? Yes No
Remarks:
At 35% of average annual precipitation to date.

US Army Corps of Engineers Arid West – Version 2.0 (modified)
SOIL Sampling Point: 48
Profile Description: (Describe to the depth needed to document the indicator or confirm the absence of indicators.)
Depth Matrix Redox Features
(inches) Color (moist) % Color (Moist) % Type1 Loc2 Texture Horizon Remarks
0-10 10YR 3/2 85 7.5YR4/6 15 C M sicl A native soil
10-14 10YR 3/2 100 sicl Bw native soil
1Type: C= Concentration, D=Depletion, RM=Reduced Matrix, CS=Covered or Coated Sand Grains. 2Location: PL=Pore Lining, LRC=Living Root Channel, M=Matrix.
Hydric Soil Indicators: (Applicable to all LRRs, unless otherwise noted.) Indicators for Problematic Hydric Soils3:
Histosol (A1) Sandy Redox (S5) 1 cm Muck (A9) (LRR C)
Histic Epipedon (A2) Stripped Matrix (S6) 2 cm Muck (A10) (LRR B)
Black Histic (A3) Loamy Mucky Mineral (F1) Reduced Vertic (F18)
Hydrogen Sulfide (A4) Loamy Gleyed Matrix (F2) Red Parent Material (TF2)
Stratified Layers (A5) (LRR C) Depleted Matrix (F3) Other (Explain in Remarks)
1 cm Muck (A9) (LRR D) Redox Dark Surface (F6)
3Indicators of hydrophytic vegetation and wetland hydrology must be present.
Depleted Below Dark Surface (A11) Depleted Dark Surface (F7)
Thick Dark Surface (A12) Redox Depressions (F8)
Sandy Mucky Mineral (S1) Vernal Pools (F9)
Sandy Gleyed Matrix (S4)
Restrictive Layer (if present):
Hydric Soils Present? Yes No
Type:
Depth (Inches):
Remarks:
HYDROLOGY Wetland Hydrology Indicators:
Primary Indicators (any one indicator is sufficient) Secondary Indicators (2 or more required)
Surface Water (A1) Salt Crust (B11) Water Marks (B1) (Riverine)
High Water Table (A2) Biotic Crust (B12) Sediment Deposits (B2) (Riverine)
Saturation (A3) Aquatic Invertebrates (B13) Drift Deposits (B3) (Riverine)
Water Marks (B1) (Nonriverine) Hydrogen Sulfide Odor (C1) Drainage Patterns (B10)
Sediment Deposits (B2) (Nonriverine) Oxidized Rhizospheres along Living Roots (C3) Dry-Season Water Table (C2)
Drift Deposits (B3) (Nonriverine) Presence of Reduced Iron (C4) Crayfish Burrows (C8)
Surface Soil Cracks (B6) Recent Iron Reduction in Tilled Soils (C6) Saturation Visible on Aerial Imagery (C9)
Inundation Visible on Aerial Imagery (B7) Thin Muck Surface (C7) Shallow Aquitard (D3)
Water-Stained Leaves (B9) Other (Explain in Remarks) FAC-Neutral Test (D5)
Field Observations:
Surface Water Present? Yes No Depth (inches): n/a Wetland Hydrology Present?
Yes
No
Water Table Present? Yes No Depth (inches): at 3”
Saturation Present? (includes capillary fringe)
Yes No Depth (inches): at 2”
Describe Recorded Data (stream gauge, monitoring well, aerial photos, previous inspections), if available:
Remarks:
Project Site: San Francisquito Creek Flood Protection Project
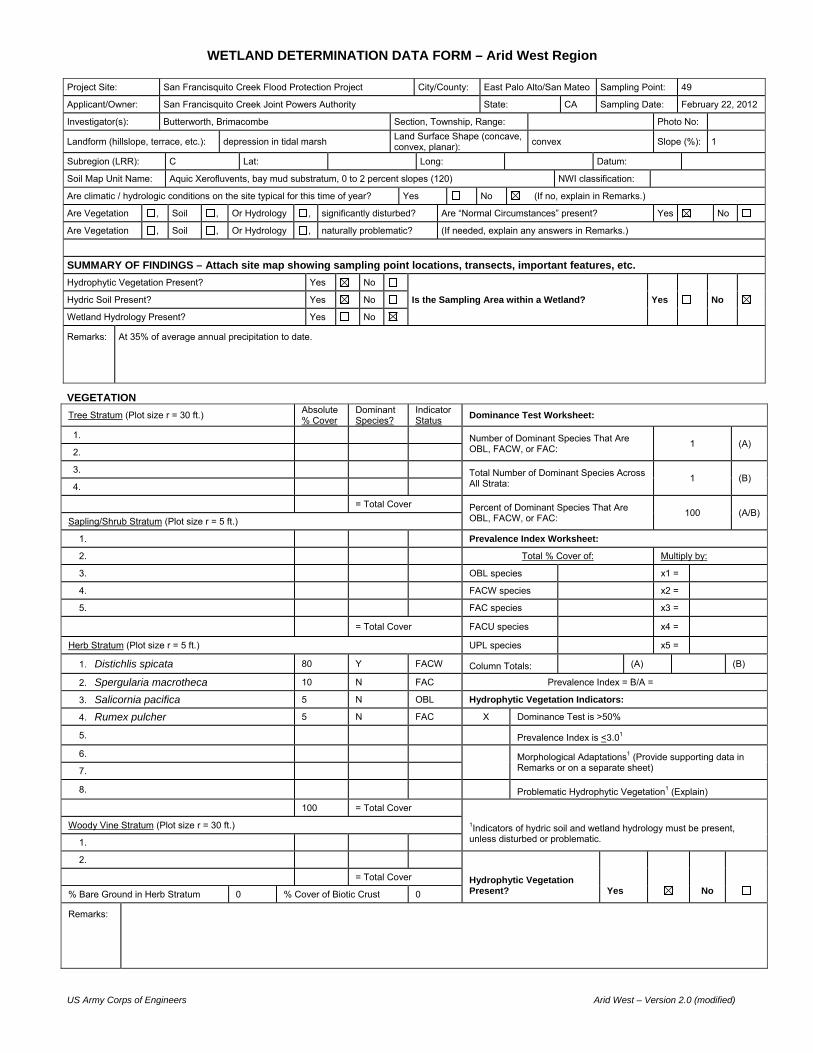
US Army Corps of Engineers Arid West – Version 2.0 (modified)
WETLAND DETERMINATION DATA FORM – Arid West Region
VEGETATION
Tree Stratum (Plot size r = 30 ft.) Absolute % Cover
Dominant Species?
Indicator Status
Dominance Test Worksheet:
1. Number of Dominant Species That Are OBL, FACW, or FAC:
1 (A) 2.
3. Total Number of Dominant Species Across All Strata:
1 (B) 4.
= Total Cover Percent of Dominant Species That Are OBL, FACW, or FAC:
100 (A/B) Sapling/Shrub Stratum (Plot size r = 5 ft.)
1. Prevalence Index Worksheet:
2. Total % Cover of: Multiply by:
3. OBL species x1 =
4. FACW species x2 =
5. FAC species x3 =
= Total Cover FACU species x4 =
Herb Stratum (Plot size r = 5 ft.) UPL species x5 =
1. Distichlis spicata 80 Y FACW Column Totals: (A) (B)
2. Spergularia macrotheca 10 N FAC Prevalence Index = B/A =
3. Salicornia pacifica 5 N OBL Hydrophytic Vegetation Indicators:
4. Rumex pulcher 5 N FAC X Dominance Test is >50%
5. Prevalence Index is <3.01
6.
Morphological Adaptations1 (Provide supporting data in Remarks or on a separate sheet) 7.
8. Problematic Hydrophytic Vegetation1 (Explain)
100 = Total Cover
1Indicators of hydric soil and wetland hydrology must be present, unless disturbed or problematic.
Woody Vine Stratum (Plot size r = 30 ft.)
1.
2.
Hydrophytic Vegetation Present? Yes No
= Total Cover
% Bare Ground in Herb Stratum 0 % Cover of Biotic Crust 0
Remarks:
Project Site: San Francisquito Creek Flood Protection Project City/County: East Palo Alto/San Mateo Sampling Point: 49
Applicant/Owner: San Francisquito Creek Joint Powers Authority State: CA Sampling Date: February 22, 2012
Investigator(s): Butterworth, Brimacombe Section, Township, Range: Photo No:
Landform (hillslope, terrace, etc.): depression in tidal marsh Land Surface Shape (concave, convex, planar):
convex Slope (%): 1
Subregion (LRR): C Lat: Long: Datum:
Soil Map Unit Name: Aquic Xerofluvents, bay mud substratum, 0 to 2 percent slopes (120) NWI classification:
Are climatic / hydrologic conditions on the site typical for this time of year? Yes No (If no, explain in Remarks.)
Are Vegetation , Soil , Or Hydrology , significantly disturbed? Are “Normal Circumstances” present? Yes No
Are Vegetation , Soil , Or Hydrology , naturally problematic? (If needed, explain any answers in Remarks.)
SUMMARY OF FINDINGS – Attach site map showing sampling point locations, transects, important features, etc.
Hydrophytic Vegetation Present? Yes No
Is the Sampling Area within a Wetland? Yes No Hydric Soil Present? Yes No
Wetland Hydrology Present? Yes No
Remarks:
At 35% of average annual precipitation to date.

US Army Corps of Engineers Arid West – Version 2.0 (modified)
SOIL Sampling Point: 49
Profile Description: (Describe to the depth needed to document the indicator or confirm the absence of indicators.)
Depth Matrix Redox Features
(inches) Color (moist) % Color (Moist) % Type1 Loc2 Texture Horizon Remarks
0-8 10YR 3/2 100 sic A
8-22 10YR 3/2 75 7.5YR3/4 25 C M c Bw
1Type: C= Concentration, D=Depletion, RM=Reduced Matrix, CS=Covered or Coated Sand Grains. 2Location: PL=Pore Lining, LRC=Living Root Channel, M=Matrix.
Hydric Soil Indicators: (Applicable to all LRRs, unless otherwise noted.) Indicators for Problematic Hydric Soils3:
Histosol (A1) Sandy Redox (S5) 1 cm Muck (A9) (LRR C)
Histic Epipedon (A2) Stripped Matrix (S6) 2 cm Muck (A10) (LRR B)
Black Histic (A3) Loamy Mucky Mineral (F1) Reduced Vertic (F18)
Hydrogen Sulfide (A4) Loamy Gleyed Matrix (F2) Red Parent Material (TF2)
Stratified Layers (A5) (LRR C) Depleted Matrix (F3) Other (Explain in Remarks)
1 cm Muck (A9) (LRR D) Redox Dark Surface (F6)
3Indicators of hydrophytic vegetation and wetland hydrology must be present.
Depleted Below Dark Surface (A11) Depleted Dark Surface (F7)
Thick Dark Surface (A12) Redox Depressions (F8)
Sandy Mucky Mineral (S1) Vernal Pools (F9)
Sandy Gleyed Matrix (S4)
Restrictive Layer (if present):
Hydric Soils Present? Yes Q
Type:
Depth (Inches):
Remarks:
Appears to be mostly native soil
HYDROLOGY Wetland Hydrology Indicators:
Primary Indicators (any one indicator is sufficient) Secondary Indicators (2 or more required)
Surface Water (A1) Salt Crust (B11) Water Marks (B1) (Riverine)
High Water Table (A2) Biotic Crust (B12) Sediment Deposits (B2) (Riverine)
Saturation (A3) Aquatic Invertebrates (B13) Drift Deposits (B3) (Riverine)
Water Marks (B1) (Nonriverine) Hydrogen Sulfide Odor (C1) Drainage Patterns (B10)
Sediment Deposits (B2) (Nonriverine) Oxidized Rhizospheres along Living Roots (C3) Dry-Season Water Table (C2)
Drift Deposits (B3) (Nonriverine) Presence of Reduced Iron (C4) Crayfish Burrows (C8)
Surface Soil Cracks (B6) Recent Iron Reduction in Tilled Soils (C6) Saturation Visible on Aerial Imagery (C9)
Inundation Visible on Aerial Imagery (B7) Thin Muck Surface (C7) Shallow Aquitard (D3)
Water-Stained Leaves (B9) Other (Explain in Remarks) FAC-Neutral Test (D5)
Field Observations:
Surface Water Present? Yes No Depth (inches): n/a Wetland Hydrology Present?
Yes
No
Water Table Present? Yes No Depth (inches): None to 22
Saturation Present? (includes capillary fringe)
Yes No Depth (inches): None to 22
Describe Recorded Data (stream gauge, monitoring well, aerial photos, previous inspections), if available:
Remarks:
Project Site: San Francisquito Creek Flood Protection Project

Appendix E Representative Photographs
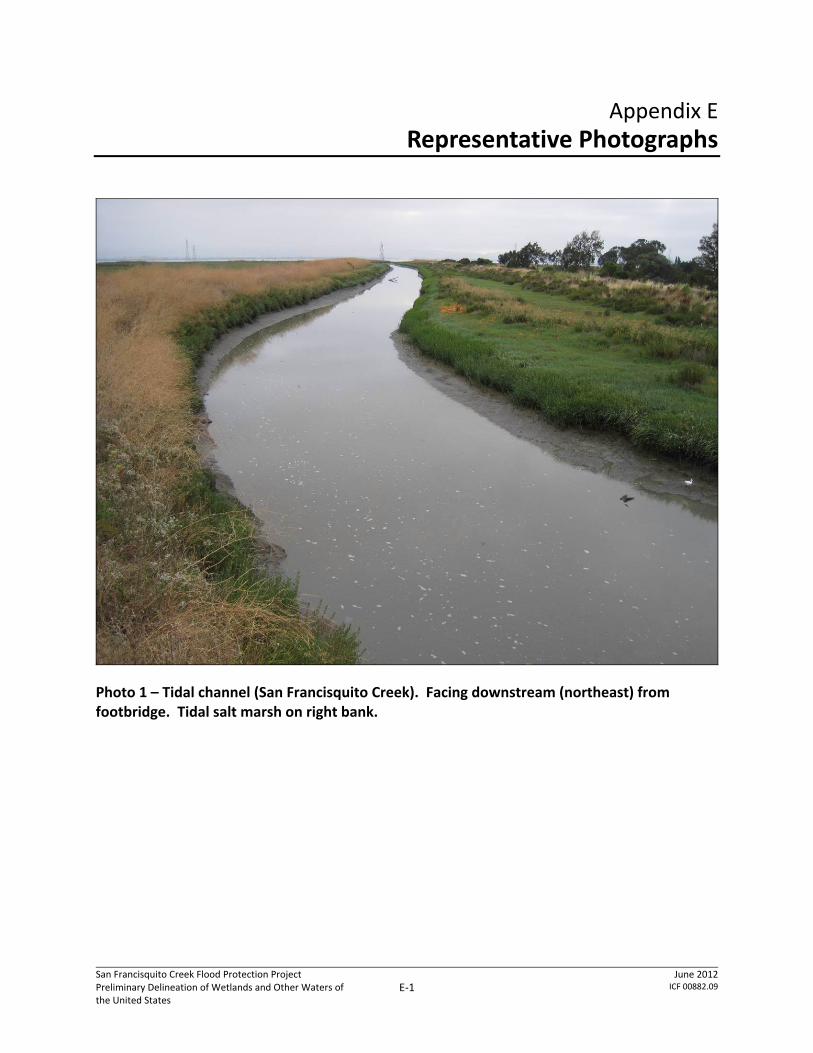
San Francisquito Creek Flood Protection Project Preliminary Delineation of Wetlands and Other Waters of the United States
E‐1 June 2012
ICF 00882.09
Appendix E Representative Photographs
Photo 1 – Tidal channel (San Francisquito Creek). Facing downstream (northeast) from footbridge. Tidal salt marsh on right bank.

San Francisquito Creek Joint Powers Authority Appendix E
San Francisquito Creek Flood Protection Project Preliminary Delineation of Wetlands and Other Waters of the United States
E‐2 June 2012
ICF 00882.09
Photo 2 – Tidal salt marsh. Facing northeast at Data Point 19, with toe of levee in foreground.
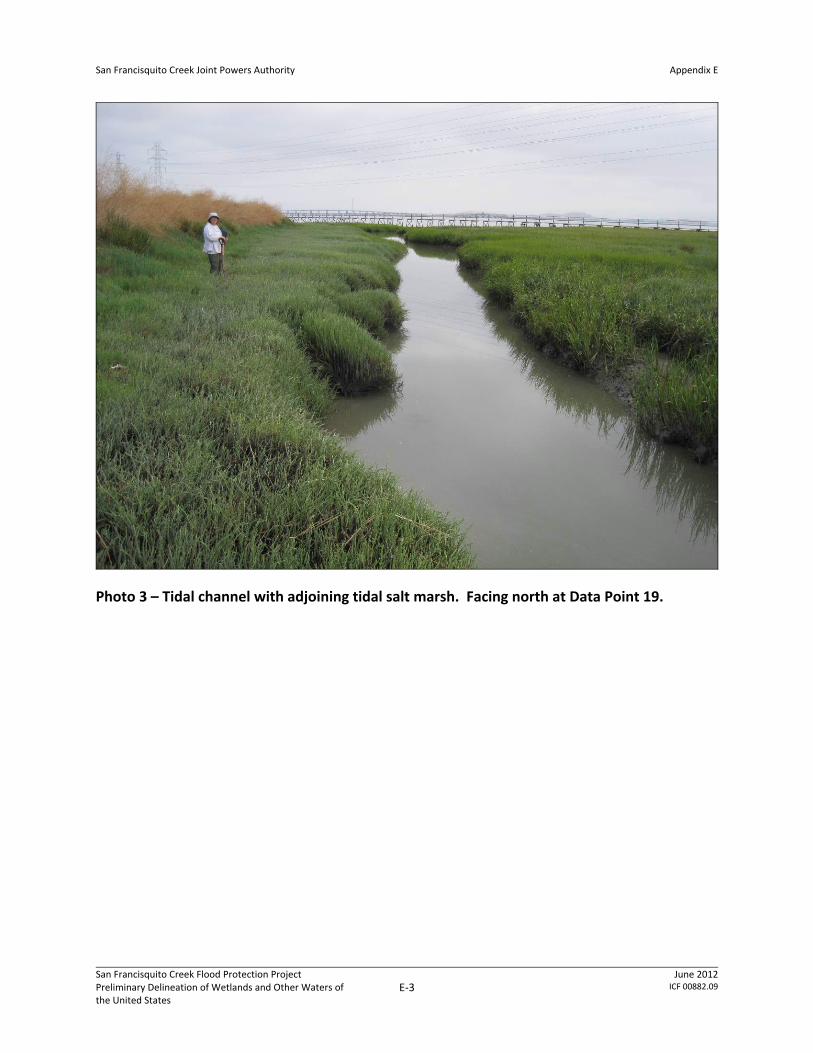
San Francisquito Creek Joint Powers Authority Appendix E
San Francisquito Creek Flood Protection Project Preliminary Delineation of Wetlands and Other Waters of the United States
E‐3 June 2012
ICF 00882.09
Photo 3 – Tidal channel with adjoining tidal salt marsh. Facing north at Data Point 19.
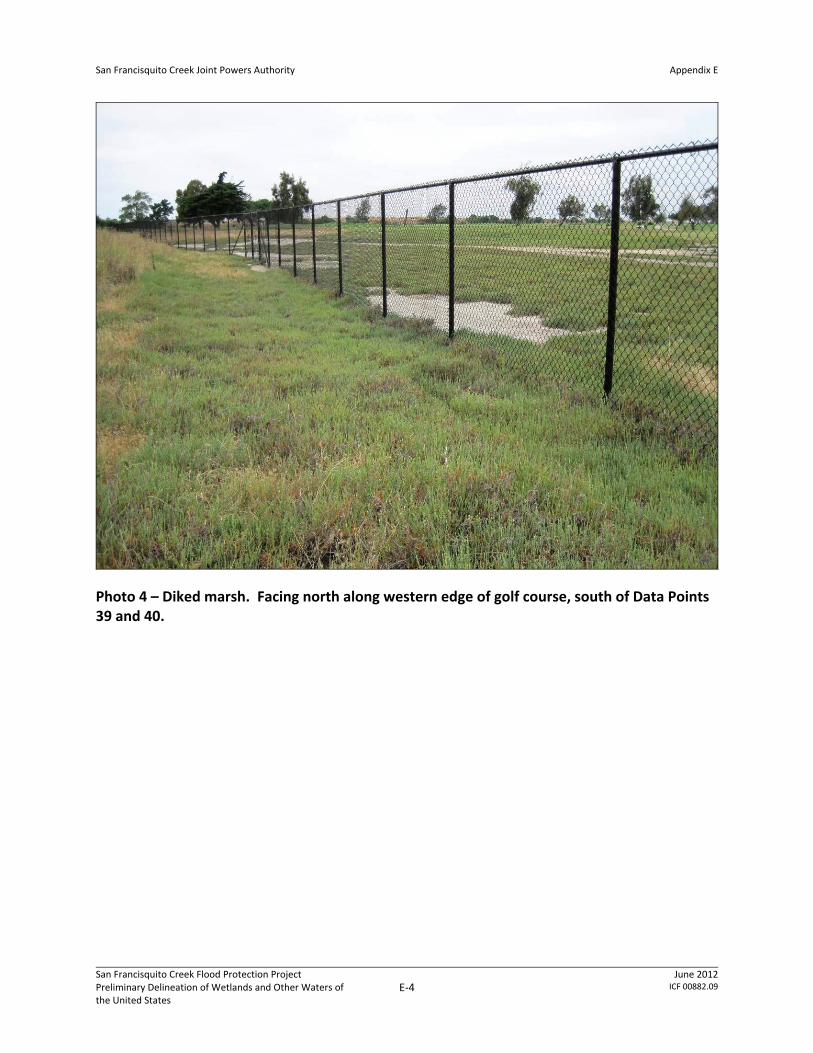
San Francisquito Creek Joint Powers Authority Appendix E
San Francisquito Creek Flood Protection Project Preliminary Delineation of Wetlands and Other Waters of the United States
E‐4 June 2012
ICF 00882.09
Photo 4 – Diked marsh. Facing north along western edge of golf course, south of Data Points 39 and 40.

San Francisquito Creek Joint Powers Authority Appendix E
San Francisquito Creek Flood Protection Project Preliminary Delineation of Wetlands and Other Waters of the United States
E‐5 June 2012
ICF 00882.09
Photo 5 – Tidal pan. Facing north, in Faber Tract.
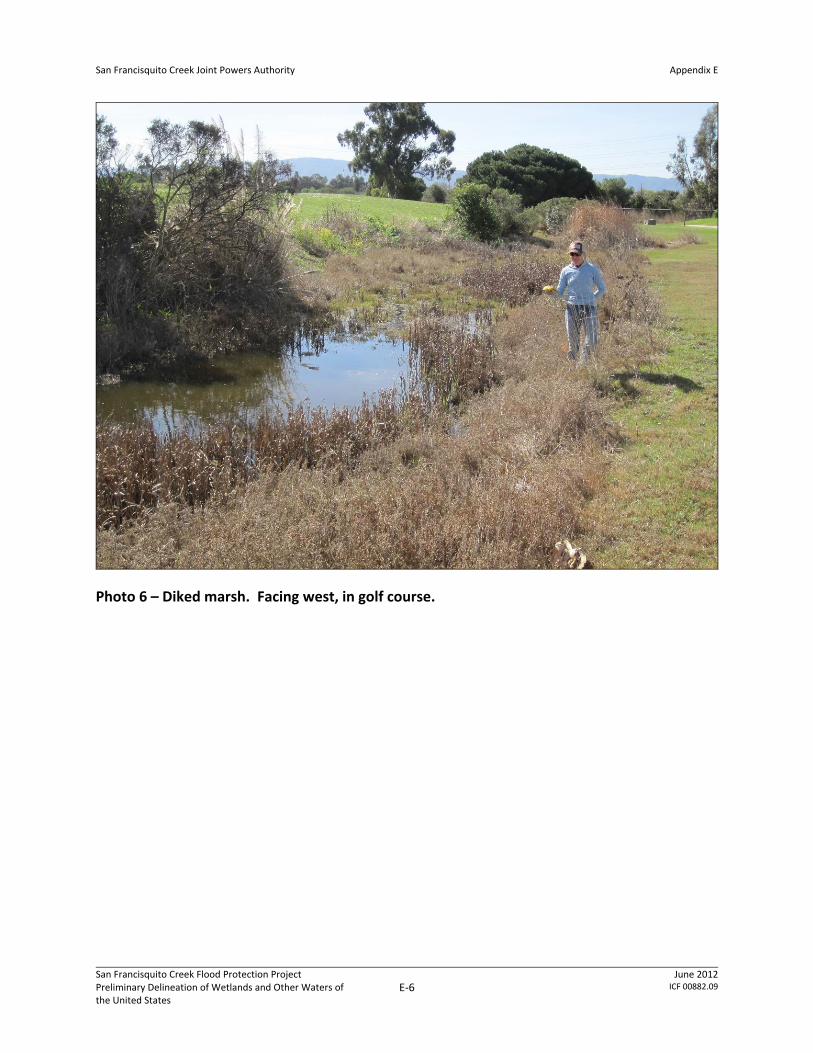
San Francisquito Creek Joint Powers Authority Appendix E
San Francisquito Creek Flood Protection Project Preliminary Delineation of Wetlands and Other Waters of the United States
E‐6 June 2012
ICF 00882.09
Photo 6 – Diked marsh. Facing west, in golf course.

Exhibit A Delineation Maps

Sheet 1
Sheet 2
Palo AltoGolf Course
PaloAlto
Airport
SouthSan
FranciscoBay
F A B E R T R A C T
SA
N
F R A N C I S Q U I T O C R E E K
F R I E N D S H I P B R I D G E
C I T Y O F P A L O A L T OP U M P S T A T I O N
L A U M E I S T E R T R A C T
TSM 4
TSM 8
TSM 8
TC 1
TC 2
TSM 1
TSM 7
TSM 6
TSM 5
TC 1
DM7
DM 5
TSM 9
TSM 9
DM 8
DM 1
DM2
DM 4
DM 6
DM 9
TP 1
TP 2
TP 3
TSM 9
TSM 9
TSM 9
DM11
DM12
DM 13
DM 13
DM 13
DM 13
DM 13
dp47dp48
dp49
dp7dp8
dp13dp14
dp15
dp16
dp17dp18
dp19dp20
dp21dp22
dp23dp24
dp25
dp26
dp27dp28
dp29dp30
dp31
dp32
dp33dp34
dp35dp36
dp37
dp38
dp39dp40
12"Culvert
10"Culvert
10"Culvert
18"Culvert
±
1 inch = 100 feet
Aerial Source:Microsoft Corportaion
Bing Maps, 2010
0 100 20050
Feet
REVISIONS BY:
DELINEATED BY: Joel Butterworth, Jane Valerius, Karen BrimacombeDRAWN BY: Cyrus Hiatt, Heather White, Sacha Selim
U.S. ARMY CORPS OF ENGINEERS REGULATORY FILE#:VERIFIED BY: TBD
DATEMARCH 13, 2012
San FrancisquitoJoint PowersAuthority1231 Hoover StreetMenlo Park, CA 94025(650) 561-4580
Prepared by: Prepared for:
ICF International75 East Santa Clara StreetSuite 300San Jose, CA 95113 (408) 216-2815
DM 1……….0.53DM 2……….0.22DM 3……….0.03DM 4……….0.02DM 5……….0.05DM 6……….0.11DM 7……….0.02DM 8……….1.33DM 9……….0.68DM 10..…….0.80DM 11..…….0.24DM 12..…….0.10DM 13..…….0.21
FM 1………....0.19FM 2………....0.14
TSM 1……….1.99TSM 3……….0.08TSM 4……….81.09TSM 5……….13.80TSM 6……….0.04TSM 7……….1.58TSM 8……….9.98TSM 9……….3.39TSM 10……...0.11TSM 11……...0.09TSM 12……...0.12
Other Waters.................................................................23.88 Acres
Tidal Salt Marsh.............................112.26 Acres
Tidal Pan...........................................0.37 Acres
Freshwater Pond...............................1.13 Acres
Tidal Channel and Bay Waters........22.38 Acres
Matchline
Delineation Data Point
Delineation Study Area Boundary
\\icf
-hq\
epi-k
\Pro
ject
s_1\
Join
tPow
ersA
utho
rity\
0088
2_09
\map
doc\
wet
land
_del
inea
tion\
Wet
land
Del
inea
tion.
mxd
HW
(09-
03-1
0)
Mean High Water and High TideLine (approx. 7 ft. NAVD 88)
All elevation databased on NAVD 88.
DELINEATION OF WETLANDS AND OTHER WATERSOF THE UNITED STATES
SAN FRANCISQUITO CREEK FLOOD PROTECTION PROJECTSAN MATEO AND SANTA CLARA COUNTIES, CALIFORNIA
EXHIBIT ADelineation Map
Sheet 1 of 2
POTENTIAL WETLANDS AND OTHER WATERS OF THE UNITED STATES
Wetlands....................................................................116.93 Acres
Diked Marsh......................................4.34 Acres
Freshwater Marsh.............................0.33 Acres
Wetlands and Other Waters.................................................140.81 Acres
FP 1...……….1.13
TC 1……….0.55TC 1……….0.02TC 2……….21.82
TP 1……….0.02TP 2……….0.13TP 3……….0.22
Culvert
Note: Mean High Water (6.544 feet NAVD 88) and High Tide Line (7.034 feet NAVD 88)are both represented by the 7.0 foot NAVD 88 contour. This contour is shown only
in the tidally-influenced parts of the delineation study area.
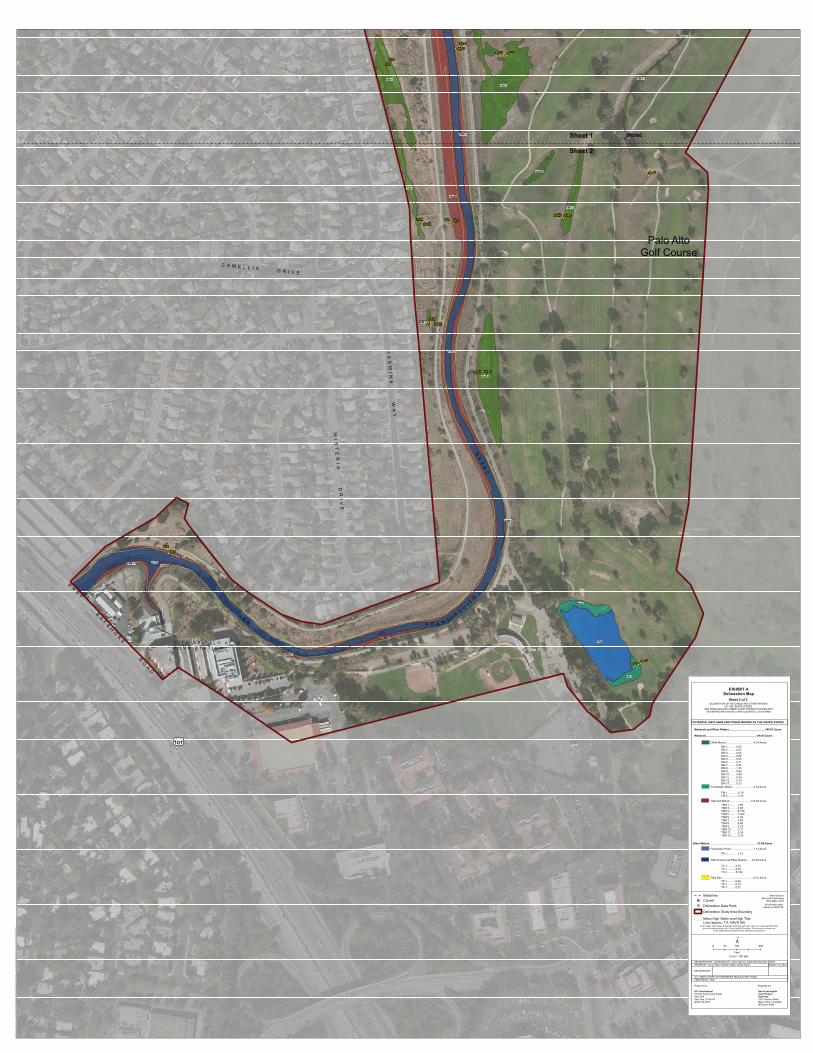
Sheet 1
Sheet 2
£¤101
Palo AltoGolf Course
SA
N F R A N C I S
QU
I TO
C
RE
EK
EA
ST
BA
YS
HO
RE
RO
AD
C A M E L L I A D R I V E
JA
SM
IN
E
WA
Y
WI
ST
ER
IA
D
RI
VE
C I T Y O F P A L O A L T OP U M P S T A T I O N
TC 2TSM 12TSM 11
TSM 10
TSM 11
TSM 1
TSM 9
TSM 9
TSM 9
DM 8
TSM 3
DM 1
DM 2
DM 3
FM 1
FP 1
DM 10
DM 11
DM 12
DM 13
FM 2
DM 13
dp43dp44
dp45dp46
dp49
dp3dp4
dp5dp6
dp7dp8
dp9dp10
dp11dp12
dp27dp28
dp39dp40
dp41dp42
12"Culvert
±
1 inch = 100 feet
Aerial Source:Microsoft Corportaion
Bing Maps, 2010
0 100 20050
Feet
REVISIONS BY:
DELINEATED BY: Joel Butterworth, Jane Valerius, Karen BrimacombeDRAWN BY: Cyrus Hiatt, Heather White, Sacha Selim
U.S. ARMY CORPS OF ENGINEERS REGULATORY FILE#:VERIFIED BY: TBD
DATEMARCH 13, 2012
San FrancisquitoJoint PowersAuthority1231 Hoover StreetMenlo Park, CA 94025(650) 561-4580
Prepared by: Prepared for:
ICF International75 East Santa Clara StreetSuite 300San Jose, CA 95113 (408) 216-2815
DM 1……….0.53DM 2……….0.22DM 3……….0.03DM 4……….0.02DM 5……….0.05DM 6……….0.11DM 7……….0.02DM 8……….1.33DM 9……….0.68DM 10..…….0.80DM 11..…….0.24DM 12..…….0.10DM 13..…….0.21
FM 1………....0.19FM 2………....0.14
TSM 1……….1.99TSM 3……….0.08TSM 4……….81.09TSM 5……….13.80TSM 6……….0.04TSM 7……….1.58TSM 8……….9.98TSM 9……….3.39TSM 10……...0.11TSM 11……...0.09TSM 12……...0.12
Other Waters.................................................................23.88 Acres
Tidal Salt Marsh.............................112.26 Acres
Tidal Pan...........................................0.37 Acres
Freshwater Pond...............................1.13 Acres
Tidal Channel and Bay Waters........22.38 Acres
Matchline
Delineation Data Point
Delineation Study Area Boundary
\\icf
-hq\
epi-k
\Pro
ject
s_1\
Join
tPow
ersA
utho
rity\
0088
2_09
\map
doc\
wet
land
_del
inea
tion\
Wet
land
Del
inea
tion.
mxd
HW
(09-
03-1
0)
Mean High Water and High TideLine (approx. 7 ft. NAVD 88)
All elevation databased on NAVD 88.
DELINEATION OF WETLANDS AND OTHER WATERSOF THE UNITED STATES
SAN FRANCISQUITO CREEK FLOOD PROTECTION PROJECTSAN MATEO AND SANTA CLARA COUNTIES, CALIFORNIA
EXHIBIT ADelineation Map
Sheet 2 of 2
POTENTIAL WETLANDS AND OTHER WATERS OF THE UNITED STATES
Wetlands....................................................................116.93 Acres
Diked Marsh......................................4.34 Acres
Freshwater Marsh.............................0.33 Acres
Wetlands and Other Waters.................................................140.81 Acres
FP 1...……….1.13
TC 1……….0.55TC 1……….0.02TC 2……….21.82
TP 1……….0.02TP 2……….0.13TP 3……….0.22
Culvert
Note: Mean High Water (6.544 feet NAVD 88) and High Tide Line (7.034 feet NAVD 88)are both represented by the 7.0 foot NAVD 88 contour. This contour is shown only
in the tidally-influenced parts of the delineation study area.