preliminary regulatory impact analysis of proposed ... · preliminary regulatory impact analysis....
TRANSCRIPT

DEPARTMENT OF HEALTH AND HUMAN SERVICESFood and Drug Administration
Safety and Effectiveness of Consumer Antiseptics; Topical Antimicrobial Drug
Products for Over-the-Counter Human Use; Proposed Amendment of the Tentative Final
Monograph
Docket No. FDA-1975-N-0012 (formerly Docket No. 1975N-0183H)
Preliminary Regulatory Impact AnalysisInitial Regulatory Flexibility Analysis
Unfunded Mandates Reform Act Analysis
Economics StaffOffice of Planning
Office of Policy and PlanningOffice of the Commissioner

2
I. Introduction and Summary
A. Introduction
B. Summary of Costs and Benefits
II. Preliminary Regulatory Impact Analysis
A. Background
B. Need for Regulation
C. Purpose of this Rule
D. Baseline Conditions
1. Active Ingredients in Currently Marketed OTC Consumer Antiseptic Hand and Body Washes
2. Number of Affected Products in the Current Market for OTC Consumer Antiseptic Hand and Body Washes
3. Aggregate Production Volume of Antiseptic Active Ingredients
4. Antiseptic Active Ingredient Usage in Consumer Antibacterial Soaps
E. Benefits of the Proposed Rule
F. Costs of the Proposed Rule
1. Relabeling Costs
2. Reformulation Costs
3. Cost of Conducting Tests and Studies Associated with the Proposed Data Requirements or Obtaining an NDA
a. Unit Costs of Conducting Non-clinical Studies to Establish GRAS
b. Costs of Conducting Clinical Studies to Establish GRAS
c. Costs of Conducting Clinical and Non-Clinical Studies to Establish GRAE
d. Summary of Costs for Conducting Safety and Effectiveness Studies

3
4. Summary of Total Costs
G. Alternatives
H. Cost-Effectiveness
III. Initial Regulatory Flexibility Analysis
A. Description and Number of Affected Small Entities
B. Description of the Potential Impacts of the Proposed Rule on Small Entities
C. Alternative for Regulatory Relief
1. Exemption for Small Businesses
2. Longer Compliance Period for Small Businesses
IV. References

4
I. Introduction and Summary
A. Introduction
FDA has examined the impacts of the proposed rule under Executive Order 12866 and Executive Order 13563. Executive Orders 12866 and 13563 direct Agencies to assess all costs and benefits of available regulatory alternatives and, when regulation is necessary, to select regulatory approaches that maximize net benefits (including potential economic, environmental, public health and safety, and other advantages; distributive impacts; and equity). This proposed rule would be an economically significant regulatory action as defined by Executive Order 12866.
The Regulatory Flexibility Act requires Agencies to analyze regulatory options that would minimize any significant impact of a rule on small entities. This proposed rule would have a significant economic impact on a substantial number of small entities.
Section 202(a) of the Unfunded Mandates Reform Act of 1995 requires that Agencies prepare a written statement, which includes an assessment of anticipated costs and benefits, before proposing "any rule that includes any Federal mandate that may result in the expenditure by State, local, and tribal governments, in the aggregate, or by the private sector, of $100,000,000 or more (adjusted annually for inflation) in any one year." The current threshold after adjustment for inflation is $141 million, using the most current (2012) Implicit Price Deflator for the Gross Domestic Product. FDA expects this proposed rule to result in a 1-year expenditure that would meet or exceed this amount.
B. Summary of Costs and Benefits
The costs and benefits of the proposed rule are summarized in the table below, entitled Economic Data: Costs and Benefits Statement. As the table shows, the primary estimated benefits come from reduced exposure to antiseptic active ingredients by 2.2 million pounds per year. Using the primary estimates, the combined total consists of a reduction in triclosan exposure by 799,426 pounds per year, triclocarban exposure by 1.4 million pounds per year, chloroxylenol exposure by 231.9 pounds per year, and benzalkonium chloride by 63.8 pounds per year. Limitations in the available data characterizing the health effects resulting from widespread long-term exposure to such ingredients prevent us from translating the estimated reduced exposure into monetary equivalents of health effects.
The primary estimate of costs annualized over 10 years is approximately $23.6 million at a 3 percent discount rate and $28.6 million at a 7 percent discount rate. These costs consist of total one-time costs of relabeling and reformulation ranging from $112.2 to $368.8 million. Under the proposed rule, we estimate that each pound of reduced exposure to antiseptic active ingredients would cost $3.86 to $43.67 at a 3 percent discount rate and $4.69 to $53.04 at a 7 percent discount rate.

5
Economic Data: Costs and Benefits Statement
Category Primary Estimate
Low Estimate
High Estimate
UnitsNotesYear
DollarsDiscount Rate
PeriodCovered
Benefits
Annualized 7% Annual Monetized $millions/year
3% Annual
Annualized 2,198,033 989,922 3,406,145 7% Annual Reduced antiseptic active ingredient exposure (in pounds)Quantified 2,198,033 989,922 3,406,145 3% Annual
Qualitative
Costs
Annualized $28.6 $16.0 $52.5 2010 7% Annual Annualized costs of relabeling and reformulation. Range of estimates captures uncertainty.
Monetized $millions/year
$23.6 $13.2 $43.2 2010 3% Annual
Annualized 7% Quantified 3% Qualitative
Transfers
Federal Annualized
7% None.
Monetized $millions/year
3%
From/To From: To:Other Annualized
7%
Monetized $millions/year
3%
From/To From: To:
Effects
State, Local, or Tribal Government: Not applicable
Small Business: Annual cost per affected small entity estimated as $0.01-$0.04 million, which would represent 0.04-0.13 percent of annual shipments.
Wages: No estimated effect
Growth: No estimated effect

6
II. Preliminary Regulatory Impact Analysis A. Background
Antiseptic washes (or more commonly known as “antibacterial soaps”) are intended to be used with water to cleanse hands or the entire body. They are marketed in several formulations: liquids, foams, gels, and bars. While antibacterial soaps were introduced over fifty years ago, more recently their use expanded rapidly beyond the hospital and institutional settings. A physician-performed survey of national chain, regional grocery, and internet stores found that 76 percent of liquid soaps and 29 percent of bar soaps that were marketed contained the active ingredients triclosan or triclocarban (Ref. R1).
Along with the proliferation of antibacterial soaps, other personal care products
containing antiseptic active ingredients have become much more prevalent for everyday use. In the mid-1990s, the number of antibacterial products available to the general population was estimated to be only a few dozen, but within a few years grew quickly to over 700 (Ref. R2). For example, many personal hygiene products contain the antiseptic active ingredient triclosan (Refs. R4, R5, R6). In addition to FDA-regulated uses, some antiseptic agents, such as triclosan, are also registered with the Environmental Protection Agency (EPA) as pesticides and are often applied to industrial equipment, textiles, and plastics as material preservatives (Ref. R4).
Since the development of the over-the-counter (OTC) generally recognized as
safe and effective (GRAS/E) conditions for antiseptic active ingredients in the 1994 tentative final monograph or proposed rule (the 1994 TFM) (59 FR 31402), there have been several important scientific developments that affect the safety evaluation for these products. Because the rapid expansion of antiseptic active ingredients in a variety of settings was not anticipated, the proposed conditions for GRAS/E in the 1994 TFM did not account for the potential health risks that could result from widespread, long-term exposure. Likewise, considerations for effectiveness requirements were not made in the context of widespread, long-term exposure, in settings where the risk of infection is relatively low.
In recent years, the scientific knowledge regarding the impact of widespread
antiseptic use has evolved. Antibacterial soaps may be used on a daily basis by consumers over the course of a lifetime. Potential damage to human health, resulting from use of consumer antiseptic hand and body washes, may occur due to extended exposure to antiseptic active ingredients and may be difficult to link to a particular product.
Associated with the overall upward marketing trend of products (including
products not regulated by FDA) containing antiseptic active ingredients, new studies indicate that there has been an increase in the level of aggregate exposure to certain antiseptic active ingredients. In contrast to exposure levels thought to exist when the 1994 TFM was proposed, systemic exposure to antiseptic active ingredients is much

7
higher today. Only recently, the National Health and Nutrition Examination Survey (NHANES) began collecting bio-monitoring data on triclosan to quantify aggregate exposure. In a U.S. representative subsample of NHANES 2003-2004, researchers found measurable urinary triclosan levels which, while not exceeding toxic thresholds, reflect exposure in 75 percent of the population (Refs. R7, R8, R9). The amount of triclosan found in urine samples collected from 2005 to 2006 was 42 percent higher than the amount found in the 2003-2004 samples (Ref. R8). In the most recent assessment, triclosan has been found at relatively consistent levels in urine samples collected from a since sampling began in 2003 (Ref. R30).
While the evidence associating long-term exposure to washes containing
antiseptic active ingredients with adverse health effects is inconclusive at best, evaluations by FDA and the Nonprescription Drugs Advisory Committee identified several potential risks (Ref. R31). Specifically, certain antiseptic active ingredients may show hormonal effects or contribute to the development of bacterial resistance. Laboratory studies suggest that triclosan and other antiseptic active ingredients may contribute to antibacterial resistance to clinically important antibiotics (Ref. R10).
Animal studies also suggest that consumer antiseptic active ingredients, such as
triclosan and triclocarban, could potentially have hormonal effects on thyroid, reproductive, growth, or developmental systems (Refs. R32 through R41). A hormonally active compound is a chemical that interferes with the production, release, transport, metabolism, binding, activity, or elimination of natural hormones, which can lead to adverse effects on the reproductive system and development (Ref. R42). Certain subpopulations, including children and developing fetuses, are potentially more sensitive to exposure and are at greater risk for adverse health effects. Hormonal effects, in general, may lead to adverse health effects that vary widely, including breast cancer, endometrial cancer, testicular cancer, ovarian cancer, prostate cancer, endometriosis, infertility, thyroid disorders, and male reproductive tract abnormalities (Refs. R11, R12). We note, however, that these specific outcomes represent more extreme toxic effects and that the majority of antiseptic active ingredients have never been evaluated for these specific adverse health effects.
Furthermore, FDA’s review of the available published literature and data
determined that there is insufficient evidence to demonstrate a health benefit from use of antibacterial soap over plain soap and water in reducing the incidence of disease in the consumer setting. The previously proposed effectiveness standards in the 1994 TFM were intended to demonstrate efficacy in high-risk settings for healthcare uses, based on the assumption that reductions in bacteria left on skin treated with antiseptic active ingredient correspond to reductions in infection rates or the transmission of disease. Because there is relatively low risk for infection in the consumer setting, the use of surrogate endpoints alone do not show there is a clinically meaningful benefit from the use of antibacterial soaps compared to plain soap and water. Taken together, these recent scientific developments have prompted the need to re-evaluate safety and effectiveness requirements that take into account how antibacterial soaps are currently used by the general consumer population.

8
B. Need for Regulation
This regulation addresses the market failure arising from inadequate information on the potential health risks associated with daily use of antibacterial soaps and the effectiveness of these products relative to plain soap and water. As discussed in previous sections, most antiseptic active ingredients have not been shown to be safe for this use, not effective for this use, or both. This proposed rule would respond to our obligation to ensure that drugs are both safe and effective (21 CFR 330.10(a)(4)).
Hand and body wash products containing antiseptic active ingredients
differentiate themselves from plain soap in their antibacterial labeling claims. The purpose behind the distinctive labeling as an antiseptic drug is to convey information about an added health benefit relative to plain soap and water. In the consumer setting antibacterial soaps have not been shown to reduce the incidence of infection or disease and there are unresolved safety considerations regarding long-term daily use, as discussed in previous sections.
Despite the lack of evidence demonstrating safety and effectiveness of
antibacterial soaps in the consumer setting, demand for these products has continued to grow. The level of information currently utilized by consumers may be less than optimal because of consumer perceptions that soaps labeled as antibacterial may be superior to plain soap (Ref. R13). As long as the private marginal cost of gathering safety and effectiveness information exceeds the private marginal benefit, there is insufficient incentive for producers or any particular entity to undertake studies in the absence of regulation. In this case, due to market failure arising from inadequate information, manufacturers may behave strategically by making antibacterial claims in order to avoid losing sales to their competitors.1 Because it would be time-consuming and resource intensive to generate the evidence needed to make informed choices, private market incentives are insufficient to provide adequate assurances of safety and effectiveness. Under these circumstances, where it is difficult for consumers to evaluate complex information about products or services, regulation is needed to ensure that minimum standards are met.
A body of research has established that for many environmental toxins, there can
be a long latency period between exposure and any potential adverse health effects. Unintended negative effects on public health as a result of widespread use of antiseptic active ingredients, such as potential bacterial resistance , could also impose costs on society that are most likely external to the production and consumption decisions in the current market for consumer antiseptic hand and body wash, which only account for private costs and private benefits. These potential negative externalities would represent an additional well-established market failure that provides an economic rationale for
1 Such a situation can be characterized as a prisoner’s dilemma, in which each decision-making party, when acting independently, has an incentive to make choices that harm other parties, thus leading to an outcome that is suboptimal for all the decision-makers.
9
regulation. An externality is defined as a cost or benefit resulting from an action that is borne or received by parties not directly involved. In the case of widespread antiseptic active ingredient use, a negative externality may arise because some of the costs—for example, the costs associated with a possible increased prevalence of bacterial resistant infections—are external to those who may benefit from their use.
C. Purpose of this Rule
The objective of this proposed rule is to bring up to date the conditions under which OTC consumer antiseptic hand and body washes are generally recognized as safe and effective (GRAS/E). This regulatory action provides a level of assurance of safety and effectiveness that would not otherwise occur in the existing market for consumer antiseptic washes.
The proposed rule would require all consumer hand and body washes containing
any antiseptic active ingredient to provide a clinically meaningful benefit over plain soap and water. Those products that have not been shown through clinical outcome studies to reduce disease transmission or the number of infections in a population compared to plain soap and water would not be considered GRAE. The rule would also require those products to demonstrate safety under revised standards for GRAS consideration. For each active ingredient, a GRAS determination must be supported by all of the following studies: human pharmacokinetic studies; absorption, distribution, metabolism, and excretion (ADME) studies in animals, toxicokinetic, reproductive toxicity, and carcinogenicity studies in animals; data to characterize potential hormonal effects; and an evaluation of the potential to cause bacterial resistance. Results of some tests for some active ingredients are already available.
Based on the available data and studies, FDA finds that all of the over-the-counter
antiseptic hand and body washes marketed for consumer use fail to meet the standards for GRAS/E classification proposed in the 1994 TFM and this document. If there are inadequate data or studies meeting the proposed requirements and the proposed rule becomes final, then continued marketing of consumer antiseptic washes containing the affected active ingredients would require that manufacturers obtain an approved new drug application (NDA). Alternatively, current manufacturers of consumer antiseptic hand and body washes could comply with the final rule by reformulating those products to remove the antiseptic active ingredients and marketing them as plain soap.
Manufacturers also may seek to continue marketing these products without
reformulation by relabeling them. However, manufacturers would not be able to make claims that would cause the products to be a drug under the FD&C Act. For example, manufacturers may remove all claims for the prevention or mitigation of disease and seek to market the products as plain soap for cosmetic use. Manufacturers also may seek to relabel these products as healthcare personnel hand washes, for which permissible claims would be limited to those that would be consistent with the 1994 TFM until the TFM is amended or finalized with respect to healthcare personnel hand washes. We note that under the 1994 TFM, the active ingredients that are a part of the proposed consumer wash

10
rule are not proposed to be GRAS/E. Thus, manufacturers of healthcare personnel hand washes using non-GRAS/E active ingredients would assume the risk of having to reformulate or cease marketing if the relevant provisions of the 1994 TFM are finalized in their current form.
Although these options (relabeling without removing antiseptic active ingredients
as either cosmetic deodorant soap or healthcare personnel antiseptic hand wash) would be an unintended consequence of the proposed rule, such a reaction may occur as manufacturers re-position themselves in the marketplace. In recognition of the potential for manufacturers to react in this way, we include a discussion of the effects resulting from the possibility of relabeling products for other uses without removal of the antiseptic active ingredient. It is unclear whether such a strategy would be profitable for manufacturers. The discussion of this potential reaction by manufacturers does not take into consideration FDA’s position and possible response to relabeling products without removing the antiseptic active ingredients not shown to be GRAS/E. D. Baseline Conditions
The effects of the proposed rule are estimated relative to a baseline. The baseline represents the state of the world in absence of the proposed regulatory action. In our analysis, we describe baseline conditions in terms of the projected market for consumer antiseptic wash products and aggregate exposure to antiseptic active ingredients linked to consumer antiseptic washes. It would be a reasonable assumption that if there were no changes to the proposed monograph conditions for OTC consumer antiseptic wash products, future use of consumer antiseptic wash products and exposure to antiseptic active ingredients could be approximated by current levels.
1. Active Ingredients in Currently Marketed OTC Consumer Antiseptic Hand and
Body Washes
If finalized, the proposed rule would classify all OTC consumer hand or body washes containing any antiseptic active ingredient as nonmonograph. However, our analysis of the current market finds that the majority of the affected products contain either triclosan or triclocarban. In determining the distribution of antiseptic active ingredients across affected products, we used data from A.C. Nielsen, which provides nationally representative sales information from drugstores, supermarkets, and mass merchandisers (excluding Walmart). At the time of this analysis, the most recently available data reflect sales of hand and body wash products for the last 52 weeks ending on September 5, 2009. While the A.C. Nielsen data does not include information on active ingredients contained in products, we are able to identify antiseptic soaps and body washes from those products that include “antibacterial” in the name or part of the product description. Additional information was gathered from extensive internet searches to determine active ingredients associated with specific universal product codes (UPCs), representing individual products, packages, and sizes. For most nationally branded products, ingredient listings were available on the manufacturer’s or other online retailer’s website.

11
Based on a search of 725 individual UPCs, categorized as antibacterial hand or
body wash in A.C. Nielsen, we identified active ingredients for approximately 40 percent of 585 antibacterial liquid, gel, and foam soaps and 72 percent of 140 antibacterial bar soaps. A summary of the active ingredients found in our survey of antibacterial soaps is reported in Table E1. Approximately 93 percent of antibacterial liquid soaps contained triclosan as the active ingredient and 85 percent of antibacterial bar soaps contained triclocarban as the active ingredient. As a percentage of annual total equivalent (16 oz.) unit sales, we estimate those containing triclosan constitute 99.8 percent of antibacterial liquid soap sales and those containing triclocarban constitute 99 percent of antibacterial bar soap sales. The survey suggests chloroxylenol, benzalkonium chloride, phenoxyethanol, and a few natural ingredients, such as tea tree oil, are far less common than triclosan and triclocarban as active ingredients in consumer antibacterial soaps.
Table E1. Estimated Distribution of Active Ingredients in Consumer Antiseptic Hand and Body Washes by Product Form
Antiseptic Active Ingredient
Liquid, Gel, and Foam Bar
Percent of UPCs
Percent of Total
Equivalent (16 oz.) Units Sold
Percent of UPCs
Percent of Total
Equivalent (16 oz.) Units
Sold Triclosan 93.1 99.8 7.9 0.98 Triclocarban 0 0 85.1 99.01 Chloroxylenol 1.7 0.01 4.0 0.01 Benzalkonium Chloride 0.4 0.0 0 0 Phenoxyethanol 0.4 0 0 0"Natural" Ingredients 3.9 0.2 3.0 0.002
Total 100 100 100 100May not sum due to rounding.
2. Number of Affected Products in the Current Market for OTC Consumer Antiseptic Hand and Body Washes
According to the 2009 A.C. Nielsen sales data, total sales for our sample of 725 affected UPCs were $286 million. However, there are likely affected products that we were unable to identify as antibacterial and affected products not captured in the A.C. Nielsen data, such as sales from warehouses, internet, and other specialty outlets. To account for underrepresentation as recommended and adopted in the RTI Labeling Cost Model Report for this product category, we apply an adjustment factor of 3.1 to the raw UPC counts, formulas, annual unit sales, and annual dollar sales to obtain estimates representing the entire market of affected products (Ref. R3). The adjustment factor is based on the assumption that consumer antibacterial soaps are sold in a similar range of outlets and retailers as dietary supplements, for which sales represented by A.C. Nielsen was estimated as 32.5 percent of total sales from all sources. The dietary supplement adjustment factor provides a reasonable approximation because our adjusted estimates of

12
sales are similar in order of magnitude to industry estimates (Refs. R25 and R26) Given that there is uncertainty in estimating the size of the consumer antibacterial soap market, we invite comment supported by data on this assumption.
Correcting for underrepresentation in our base sample, we estimate there are
approximately 2,200 affected UPCs with total annual sales of approximately $886.1 million in the current market for OTC consumer antiseptic hand and body washes. Table E2 shows the estimated size of the affected OTC market for consumer antibacterial soaps assuming the distribution of product characteristics in the base sample is proportional to that of the population of the affected products. We request comments supported by detailed data on these estimates.
Table E2. Estimated Total Number of Affected Products
Antiseptic Hand and Body Washes
by Dosage Form Number of
UPCs Total Dollar Sales (in millions) for 52 weeks Ending in September 5, 2009
Liquid, Gel, and Foam 1,800 $566.1
Bar 400 $320.0 Total 2,200 $886.1
Note: Numbers may not sum due to rounding.
3. Aggregate Production Volume of Antiseptic Active Ingredients
We lack the data needed to quantify the relationship between exposure from consumer antiseptic hand and body wash use and potential adverse health outcomes. Furthermore, we lack certainty regarding the relationship between exposure and adverse health outcomes.
Without such data, we cannot estimate a baseline level of risk associated with
consumer antiseptic use. Instead, we estimate production volume of the corresponding antiseptic active ingredients as an intermediate measure of baseline risk resulting from consumer antibacterial soap use. Estimated ranges for the annual volume of antiseptic active ingredients produced are based on data from EPA’s Inventory Update Reporting (IUR) program and represent production volumes for all uses.
The IUR program, which began in 1986, requires manufacturers and importers to report annual production amounts of chemical substances exceeding a certain threshold at a particular site. The original program set the trigger reporting amount at 10,000 pounds and required reports every four years. New regulations implemented in 2006 raised the threshold to 25,000 pounds and lengthened the reporting intervals to every five years. These data may underestimate actual total production of certain chemicals if there are a substantial number of sites with production or import volumes below the reporting threshold.
Of the affected antiseptic active ingredients that were queried in the IUR database, we were able to find estimates on aggregate production volumes for triclosan,

13
triclocarban, and chloroxylenol only. However, based on the distribution of active ingredients in currently marketed consumer antibacterial soaps, most exposure to antiseptic active ingredients from the affected products would come from triclosan and triclocarban. The estimated ranges of triclosan, triclocarban, and chloroxylenol production are reported in Table E3.
According to the publicly available data, the range for aggregate production
volume of triclosan was between 1 and 10 million pounds in 1998, while no reports were provided in 2002. Aggregate production volume of triclocarban was between 0.5 and 1 million pounds in 1998, increasing to between 1 and 10 million pounds in 2002. The most recently available data report that aggregate national production volume of triclocarban was less than 500,000 pounds. No reports were provided for triclosan and chloroxylenol in 2006. The absence of reports in certain years may reflect a change in production or import patterns rather than an overall decline in actual total production and imported volume. If a substantially large number of sites produce or import amounts below the reporting threshold, we may underestimate actual total production and import volumes.
Table E3. Aggregate Production Volume Range in Pounds
Chemical CAS No. 1986 1990 1994 1998 2002 2006 Triclosan 3380-34-5 10K -
500K 10K - 500K
>500K - 1M
>1M - 10M
No Reports
No Reports
Triclocarban 101-20-2 10K - 500K
>1M - 10M
>1M - 10M
>500K - 1M
>1M - 10M
< 500K
Chloroxylenol 88-04-0 10K - 500K
10K - 500K
No Reports
10K - 500K
No Reports
No Reports
Source: EPA Inventory Update Reporting Data
To our knowledge these data represent the best publicly available information characterizing aggregate production volume of the affected active ingredients, but we recognize several limitations. Because production data are not tracked systematically elsewhere, it is not possible for FDA to estimate the magnitude of unreported production and imported amounts. Furthermore, the IUR data lack specific detail on end-uses of manufactured and imported chemicals. From these data alone, we are unable to ascertain the share of the reported amounts attributable to consumer antiseptic hand and body wash uses.
Defining usage more broadly, there is a general consensus that, although
antiseptic active ingredients fall under both FDA and EPA jurisdiction, most of these chemicals are primarily used in FDA-regulated products (Ref. R4). Specifically, over 95 percent of the uses of triclosan, the most common antiseptic active ingredient, are in consumer products that are washed down the drain (Refs. R6, R14). Based on the concentration of antimicrobials found in wastewater systems between 2002 and 2004, it was estimated that at least 300,000 kg (or 661,387 pounds) of triclosan per year and at

14
least 330,000 kg (or 727,526 pounds) of triclocarban per year are used in personal care products (Ref. R15).
For comparison, we also reviewed the available information quantifying the
extent of antiseptic active ingredient use in other countries. In its assessment of triclosan uses in the E.U., the Scientific Committee on Consumer Products (SCCP) reports patterns similar to the U.S. The total quantity of triclosan used was approximately 450 tons (or 992,080 pounds) in 2006, with 85 percent used in personal care products, 5 percent in textiles, and 10 percent in plastics and food contact materials (Ref. R16). We lack data characterizing patterns and extent of use regarding other antiseptic active ingredients in non-personal care products.
4. Antiseptic Active Ingredient Usage in Consumer Antibacterial Soaps
To obtain baseline estimates of the annual amount of antiseptic active ingredients used specifically for marketed products affected by this rule, we begin by distributing our estimated total annual equivalent (16 oz.) unit sales of antibacterial liquid and bar soaps proportionally across the distribution of identified antiseptic active ingredients. Note that we collectively refer to liquid, gel, and foam dosage forms as liquid. Table E4 shows the estimated annual consumption of antibacterial liquid and bar soaps, expressed in common units and disaggregated by antiseptic active ingredient.
Table E4
Antiseptic Active Ingredient Total Equivalent Unit (16 oz.) Sales for 52 weeks Ending inSeptember 5, 2009
Liquid BarTriclosan 277,000,000 1,000,000 Triclocarban 0 140,000,000 Chloroxylenol 38,000 11,000Benzalkonium Chloride 14,000 0 Phenoxyethanol 3,000 0 "Natural" Ingredients 577,000 3,000 Total 278,000,000 141,000,000 Note: Numbers may not sum due to rounding.
By standardizing sales units, we can approximate the equivalent annual consumption of antibacterial soaps, in which liquid dosage forms are expressed in volume (liters) and bars are expressed in weight (pounds). We estimate annual consumption of liquid soap containing triclosan to be approximately 131 million liters (277.0 million 16 oz. units x 0.473 liters per 16 oz.) and bar soaps containing triclocarban
to be approximately 140 million pounds. Table E5 shows the full set of estimated annualsoap consumption for each category of antiseptic active ingredient.

15
Table E5
Antiseptic Active Ingredient
Estimated Annual Consumption of Antibacterial Soaps by Dosage Form (in liters or pounds)
Liquid (in liters)
Bar (in pounds)
Triclosan 131,000,000 1,000,000 Triclocarban 0 140,000,000 Chloroxylenol 18,000 11,000 Benzalkonium Chloride 6,000 0 Phenoxyethanol 1,000 0 "Natural" Ingredients 273,000 3,000 Total 132,000,000 141,000,000
Note: Numbers may not sum due to rounding.
The next step in translating consumption of antibacterial soaps into annual usage of antiseptic active ingredients requires estimating concentration levels in marketed products. Combining published estimates along with data from FDA’s Drug Listing system, we estimate the concentration level range for each identified antiseptic active ingredient. Concentration is expressed as weight per unit of volume (w/v) for liquid soaps and weight per unit of weight (w/w) for bar soaps. The concentration level of triclosan typically found in consumer antibacterial liquid soaps ranges from 0.1 percent (or 0.001 g/mL) to approximately 0.5 percent (or 0.005 g/mL) (Ref. R9). We assume that the concentration level of triclosan found in bar soaps falls within a similar range as liquid soaps. Triclocarban, however, is an antiseptic active ingredient used in bar soaps only, and in concentration levels usually between 0.5 percent (or 0.005 g/g) and 1.5 percent (or 0.015 g/g) (Ref. R17). Chloroxylenol and benzalkonium chloride are marketed as antiseptic active ingredients primarily in liquid soaps in concentration levels from 0.1 percent to 0.8 percent. We do not attempt to estimate the concentration levels for the remaining identified active antiseptic ingredients categorized as “natural” or phenoxyethanol because we do not have enough reliable information. In Table E6, we show a summary of the ranges and midpoint between the low and high estimates of antiseptic active ingredient concentration levels identified in marketed consumer antibacterial soaps, as well as the marketed dosage forms associated with each ingredient found in our analysis.
Table E6
Antiseptic Active Ingredient Estimated Concentration Level
(in w/v or w/w) Dosage Form Marketed
Low Midpoint High Liquid BarTriclosan 0.1% 0.3% 0.5% X X Triclocarban 0.5% 1.0% 1.5% X Chloroxylenol 0.1% 0.5% 0.8% X X Benzalkonium Chloride 0.1% 0.5% 0.8% X Phenoxyethanol No information to estimate X "Natural" Ingredients X X
16
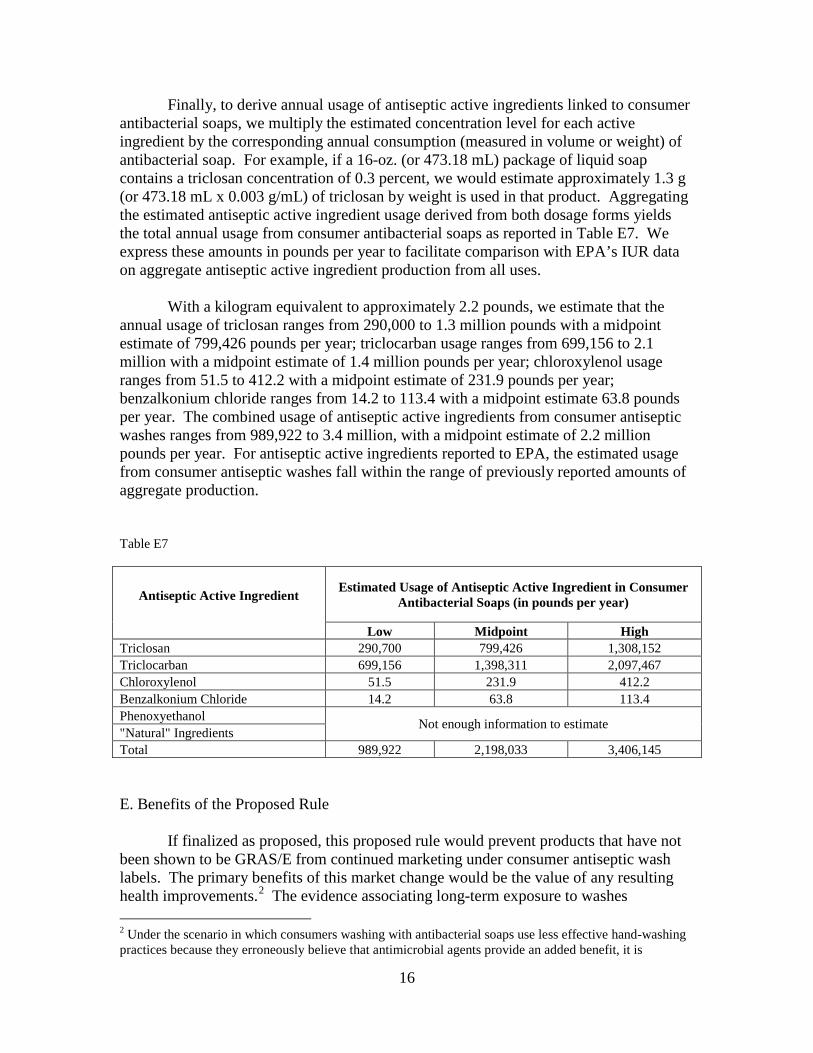
Finally, to derive annual usage of antiseptic active ingredients linked to consumer antibacterial soaps, we multiply the estimated concentration level for each active ingredient by the corresponding annual consumption (measured in volume or weight) of antibacterial soap. For example, if a 16-oz. (or 473.18 mL) package of liquid soap contains a triclosan concentration of 0.3 percent, we would estimate approximately 1.3 g (or 473.18 mL x 0.003 g/mL) of triclosan by weight is used in that product. Aggregating the estimated antiseptic active ingredient usage derived from both dosage forms yields the total annual usage from consumer antibacterial soaps as reported in Table E7. We express these amounts in pounds per year to facilitate comparison with EPA’s IUR data on aggregate antiseptic active ingredient production from all uses.
With a kilogram equivalent to approximately 2.2 pounds, we estimate that the
annual usage of triclosan ranges from 290,000 to 1.3 million pounds with a midpoint estimate of 799,426 pounds per year; triclocarban usage ranges from 699,156 to 2.1 million with a midpoint estimate of 1.4 million pounds per year; chloroxylenol usage ranges from 51.5 to 412.2 with a midpoint estimate of 231.9 pounds per year; benzalkonium chloride ranges from 14.2 to 113.4 with a midpoint estimate 63.8 pounds per year. The combined usage of antiseptic active ingredients from consumer antiseptic washes ranges from 989,922 to 3.4 million, with a midpoint estimate of 2.2 million pounds per year. For antiseptic active ingredients reported to EPA, the estimated usage from consumer antiseptic washes fall within the range of previously reported amounts of aggregate production.
Table E7
Antiseptic Active Ingredient
Estimated Usage of Antiseptic Active Ingredient in Consumer Antibacterial Soaps (in pounds per year)
Low Midpoint High Triclosan 290,700 799,426 1,308,152 Triclocarban 699,156 1,398,311 2,097,467 Chloroxylenol 51.5 231.9 412.2 Benzalkonium Chloride 14.2 63.8 113.4 Phenoxyethanol Not enough information to estimate "Natural" Ingredients Total 989,922 2,198,033 3,406,145
E. Benefits of the Proposed Rule
If finalized as proposed, this proposed rule would prevent products that have not been shown to be GRAS/E from continued marketing under consumer antiseptic wash labels. The primary benefits of this market change would be the value of any resulting health improvements.2 The evidence associating long-term exposure to washes 2 Under the scenario in which consumers washing with antibacterial soaps use less effective hand-washing practices because they erroneously believe that antimicrobial agents provide an added benefit, it is

theoretically possible that this rule could generate health benefits in the form of reduced infections if it leads to better hygiene practices. However, we do not have any evidence to address these potential effects and request comment. 3 To put the reduction of antiseptic ingredients into perspective, we estimate that approximately 30 million pounds of antimicrobial active ingredients per year are sold for use in food-producing animals and over 7 million pounds of antibiotics per year are sold for human use (Refs. R27 and R28). Considering only uses that we can quantify, antiseptic active ingredients in consumer washes contribute roughly 3 to 8 percent [= 1/(30+7+1) to 3/(30+7+3)] of overall usage of antimicrobials.
17
containing antiseptic active ingredients with adverse health effects is inconclusive so far. Therefore, we lack certainty that there is a relationship between exposure and adverse health outcomes. In addition to the lack of certainty that there is a relationship between exposure and adverse health outcomes, quantifying the benefits of health improvements typically requires identification of specific physical endpoints, a dose-response analysis, exposure analysis, and risk characterization. In characterizing risk, data from the dose-response and exposure analyses are integrated to estimate the expected level of risk posed in the particular scenario being examined. The change in risk associated with this proposed rule would come from the effects of the reduction in exposure to products not shown to be GRAS/E.
It is difficult to quantify the value of a health risk reduction because we do not
have data on the adverse health effects caused by the widespread use of consumer antiseptic active ingredients. As an intermediate measure, however, we estimate the reduction in exposure to certain antiseptic active ingredients found in consumer antiseptic washes. The benefit resulting from the rule would be the reduction in the potential risks (related to both safety and efficacy) associated with widespread use of antiseptic active ingredients in consumer hand and body washes. If the level of exposure to consumer antiseptic active ingredients is correlated with risks to public health discussed in previous sections, the potential public health benefit of the rule would be the value of avoided health damages as a result of reduced exposure to potentially harmful ingredients found in consumer antiseptic hand and body washes.
While we cannot estimate the potential reductions in adverse health outcomes,
any change away from the widespread use of antiseptic active ingredients should reduce any risk associated with exposure to those ingredients, resulting in positive public health benefits. Using the midpoint estimates of antiseptic active ingredient usage from consumer antiseptic washes to proxy for exposure, we estimate combined antiseptic active ingredient exposure could be reduced by 2.2 million pounds per year; the combined total consists of a reduction in triclosan exposure by 799,426 pounds per year, triclocarban exposure by 1.4 million pounds per year, chloroxylenol exposure by 231.9 pounds per year, and benzalkonium chloride by 63.8 pounds per year.3 F. Costs of the Proposed Rule
The costs of the rule are determined by how manufacturers react to the proposed conditions for GRAS/E status of consumer antiseptic washes. We expect manufacturers, distributors, relabelers, and repackers of consumer antiseptic hand and body wash

18
products may react in a number of ways, each associated with different costs. In response to the proposed rule, it would be plausible for firms to react in a number of ways, which could include reformulating the affected products as non-antimicrobial soap by removing the antiseptic active ingredient, relabeling without reformulation, conducting the testing required under this proposed rule, or obtaining an approved new drug application (NDA) to continue marketing for consumer antiseptic wash use, which would require conducting the same testing required under this proposed rule. The overall costs and potential health effects generated by this rule would depend both on how manufacturers choose among various options to comply and how consumers would react to those changes in marketed products. The possible reactions by any individual manufacturer, and the private costs and benefits experienced by the manufacturer as a direct result of that reaction (as opposed to indirect impacts resulting from rule-induced changes in the market as a whole), are presented in Table E8; also appearing in the table are the implications for consumers of the various potential manufacturer reactions.
Table E8. Manufacturer Potential Reactions to the Proposed Rule, Associated Private Benefits and Costs (Independent of Potential Offsetting Replacement Revenue*), and Implications for Consumers
Potential Reaction to the Proposed Rule
Private Benefits to the
Manufacturer
Private Costs to the Manufacturer
Implications for Consumers
Relabel and reformulateproduct
- Ongoing cost savings due to discontinued use of antimicrobial ingredients
- Relabeling costs - Potential for reduced sales and thus reduced profit due to
loss of “antibacterial” claim inmarketing * - Upfront reformulation costs - Increased use of other ingredients to replace antimicrobial agents
-Exposure to active ingredients reduced by the amount currently used in reformulated products (i.e., if all manufacturers reformulated their products, estimates in Benefits section would be achieved).
Discontinue product - Reduced sales revenue and thus reduced profit *
-Exposure to active ingredients reduced by the amount currently used in discontinued products (i.e., if all manufacturers discontinued their products, estimates in Benefits section would be achieved).
Conduct studies to establish GRAS/E or support NDA
- Potential marketing exclusivity (NDA only, if approved)
- Safety and effectiveness testing costs (perhaps incurred multiple times if multiple manufacturers pursue NDAs) - User fees (NDA only)
- Estimates in Benefits section overstate reduction in exposure brought about by the proposed rule by the amount of active ingredients used in products, if approved.
Potential Reaction to the Proposed Rule
Private Benefits to the
Manufacturer
Private Costs to the Manufacturer
Implications for Consumers
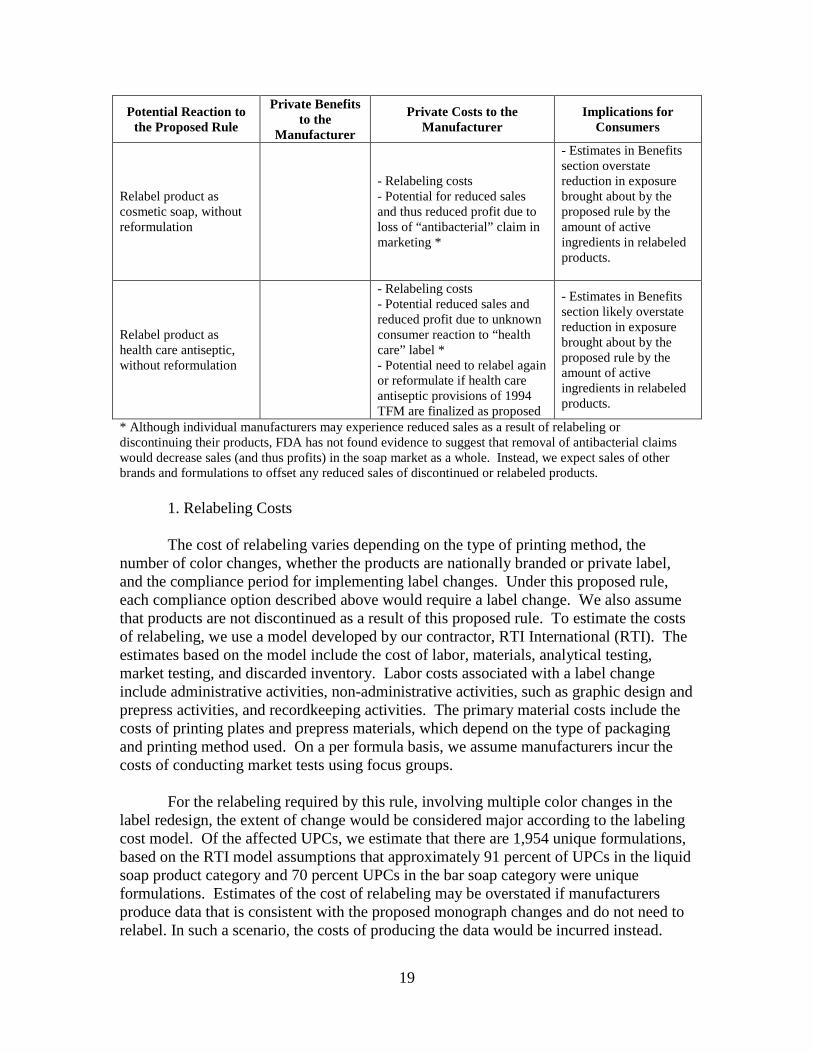
Relabel product as cosmetic soap, without
reformulation
- Relabeling costs - Potential for reduced sales and thus reduced profit due to loss of “antibacterial” claim in marketing *
- Estimates in Benefits section overstate reduction in exposure brought about by the proposed rule by the amount of active ingredients in relabeled products.
Relabel product as health care antiseptic, without reformulation
- Relabeling costs - Potential reduced sales and reduced profit due to unknown consumer reaction to “health care” label * - Potential need to relabel again or reformulate if health care antiseptic provisions of 1994 TFM are finalized as proposed
- Estimates in Benefits section likely overstate reduction in exposure brought about by the proposed rule by the amount of active ingredients in relabeled products.
* Although individual manufacturers may experience reduced sales as a result of relabeling or discontinuing their products, FDA has not found evidence to suggest that removal of antibacterial claims would decrease sales (and thus profits) in the soap market as a whole. Instead, we expect sales of other brands and formulations to offset any reduced sales of discontinued or relabeled products.
1. Relabeling Costs
The cost of relabeling varies depending on the type of printing method, the number of color changes, whether the products are nationally branded or private label, and the compliance period for implementing label changes. Under this proposed rule, each compliance option described above would require a label change. We also assume that products are not discontinued as a result of this proposed rule. To estimate the costs of relabeling, we use a model developed by our contractor, RTI International (RTI). The estimates based on the model include the cost of labor, materials, analytical testing, market testing, and discarded inventory. Labor costs associated with a label change include administrative activities, non-administrative activities, such as graphic design and prepress activities, and recordkeeping activities. The primary material costs include the costs of printing plates and prepress materials, which depend on the type of packaging and printing method used. On a per formula basis, we assume manufacturers incur the costs of conducting market tests using focus groups.
For the relabeling required by this rule, involving multiple color changes in the label redesign, the extent of change would be considered major according to the labeling cost model. Of the affected UPCs, we estimate that there are 1,954 unique formulations, based on the RTI model assumptions that approximately 91 percent of UPCs in the liquid soap product category and 70 percent UPCs in the bar soap category were unique formulations. Estimates of the cost of relabeling may be overstated if manufacturers produce data that is consistent with the proposed monograph changes and do not need to relabel. In such a scenario, the costs of producing the data would be incurred instead.
19
20
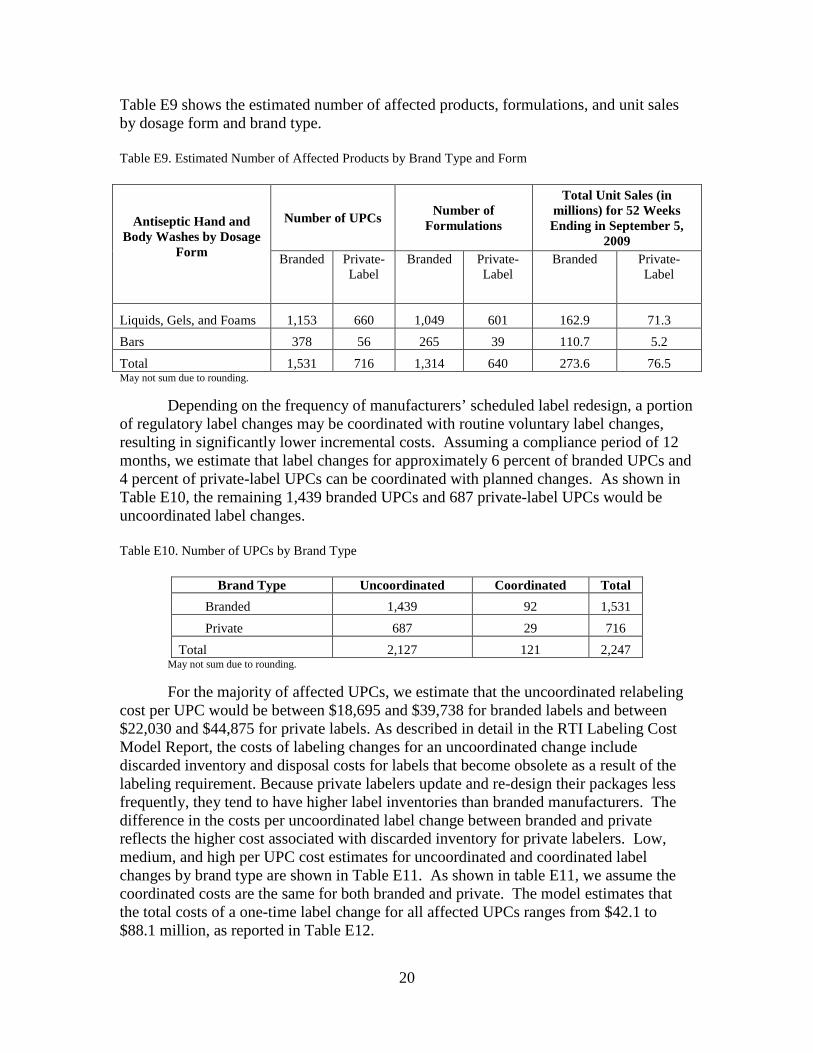
Table E9 shows the estimated number of affected products, formulations, and unit sales by dosage form and brand type.
Table E9. Estimated Number of Affected Products by Brand Type and Form
Antiseptic Hand and Body Washes by Dosage
Form
Number of UPCs Number of Formulations
Total Unit Sales (in millions) for 52 Weeks Ending in September 5,
2009 Branded Private-
LabelBranded Private-
Label Branded Private-
Label
Liquids, Gels, and Foams 1,153 660 1,049 601 162.9 71.3 Bars 378 56 265 39 110.7 5.2 Total 1,531 716 1,314 640 273.6 76.5 May not sum due to rounding.
Depending on the frequency of manufacturers’ scheduled label redesign, a portion of regulatory label changes may be coordinated with routine voluntary label changes, resulting in significantly lower incremental costs. Assuming a compliance period of 12 months, we estimate that label changes for approximately 6 percent of branded UPCs and 4 percent of private-label UPCs can be coordinated with planned changes. As shown in Table E10, the remaining 1,439 branded UPCs and 687 private-label UPCs would be uncoordinated label changes.
Table E10. Number of UPCs by Brand Type
Brand Type Uncoordinated Coordinated Total Branded 1,439 92 1,531 Private 687 29 716
Total 2,127 121 2,247 May not sum due to rounding.
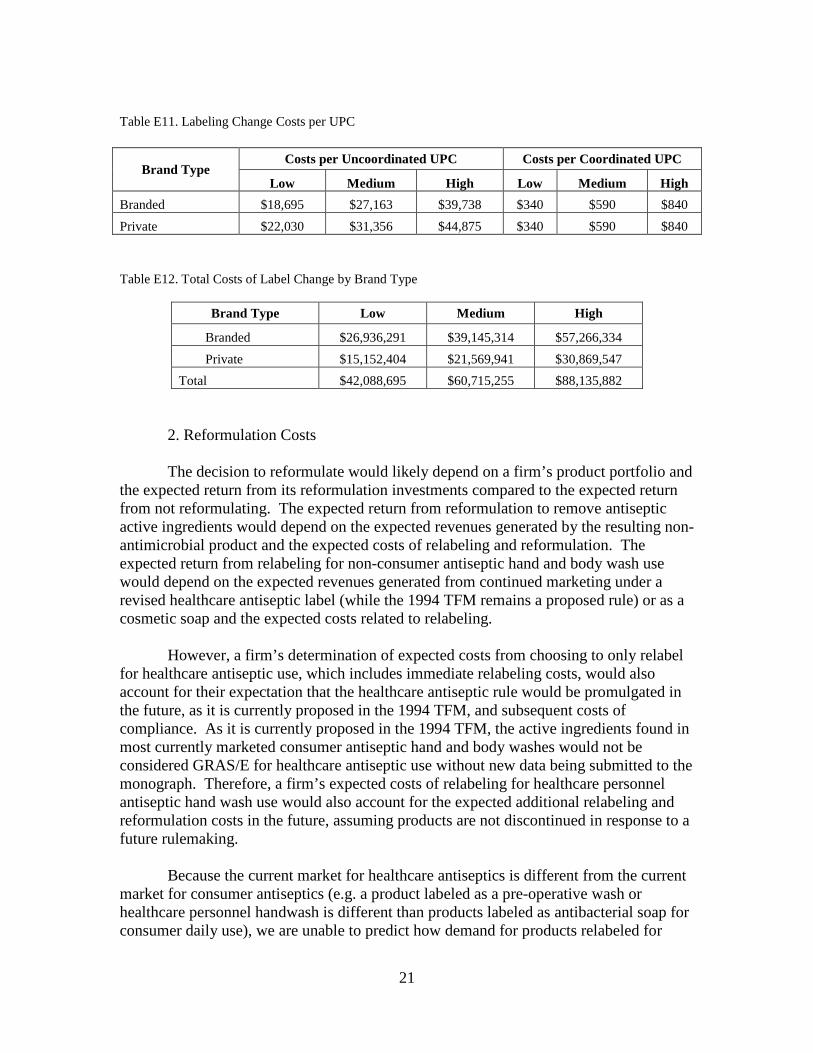
For the majority of affected UPCs, we estimate that the uncoordinated relabeling cost per UPC would be between $18,695 and $39,738 for branded labels and between $22,030 and $44,875 for private labels. As described in detail in the RTI Labeling Cost Model Report, the costs of labeling changes for an uncoordinated change include discarded inventory and disposal costs for labels that become obsolete as a result of the labeling requirement. Because private labelers update and re-design their packages less frequently, they tend to have higher label inventories than branded manufacturers. The difference in the costs per uncoordinated label change between branded and private reflects the higher cost associated with discarded inventory for private labelers. Low, medium, and high per UPC cost estimates for uncoordinated and coordinated label changes by brand type are shown in Table E11. As shown in table E11, we assume the coordinated costs are the same for both branded and private. The model estimates that the total costs of a one-time label change for all affected UPCs ranges from $42.1 to $88.1 million, as reported in Table E12.
21
Table E11. Labeling Change Costs per UPC
Brand Type Costs per Uncoordinated UPC Costs per Coordinated UPC
Low Medium High Low Medium HighBranded $18,695 $27,163 $39,738 $340 $590 $840Private $22,030 $31,356 $44,875 $340 $590 $840
Table E12. Total Costs of Label Change by Brand Type
Brand Type Low Medium High
Branded $26,936,291 $39,145,314 $57,266,334Private $15,152,404 $21,569,941 $30,869,547
Total $42,088,695 $60,715,255 $88,135,882
2. Reformulation Costs
The decision to reformulate would likely depend on a firm’s product portfolio and the expected return from its reformulation investments compared to the expected return from not reformulating. The expected return from reformulation to remove antiseptic active ingredients would depend on the expected revenues generated by the resulting non-antimicrobial product and the expected costs of relabeling and reformulation. The expected return from relabeling for non-consumer antiseptic hand and body wash use would depend on the expected revenues generated from continued marketing under a revised healthcare antiseptic label (while the 1994 TFM remains a proposed rule) or as a cosmetic soap and the expected costs related to relabeling.
However, a firm’s determination of expected costs from choosing to only relabel
for healthcare antiseptic use, which includes immediate relabeling costs, would also account for their expectation that the healthcare antiseptic rule would be promulgated in the future, as it is currently proposed in the 1994 TFM, and subsequent costs of compliance. As it is currently proposed in the 1994 TFM, the active ingredients found in most currently marketed consumer antiseptic hand and body washes would not be considered GRAS/E for healthcare antiseptic use without new data being submitted to the monograph. Therefore, a firm’s expected costs of relabeling for healthcare personnel antiseptic hand wash use would also account for the expected additional relabeling and reformulation costs in the future, assuming products are not discontinued in response to a future rulemaking.
Because the current market for healthcare antiseptics is different from the current
market for consumer antiseptics (e.g. a product labeled as a pre-operative wash or healthcare personnel handwash is different than products labeled as antibacterial soap for consumer daily use), we are unable to predict how demand for products relabeled for
4
22
healthcare antiseptic use would differ from current demand for consumer antiseptic hand and body wash. The difficulty in estimating changes in consumer behavior contributes to the difficulty in predicting the strategy that maximizes each firm’s expected return. Due to uncertainty in how manufacturers would respond, we establish the range of plausible costs associated with reformulation.
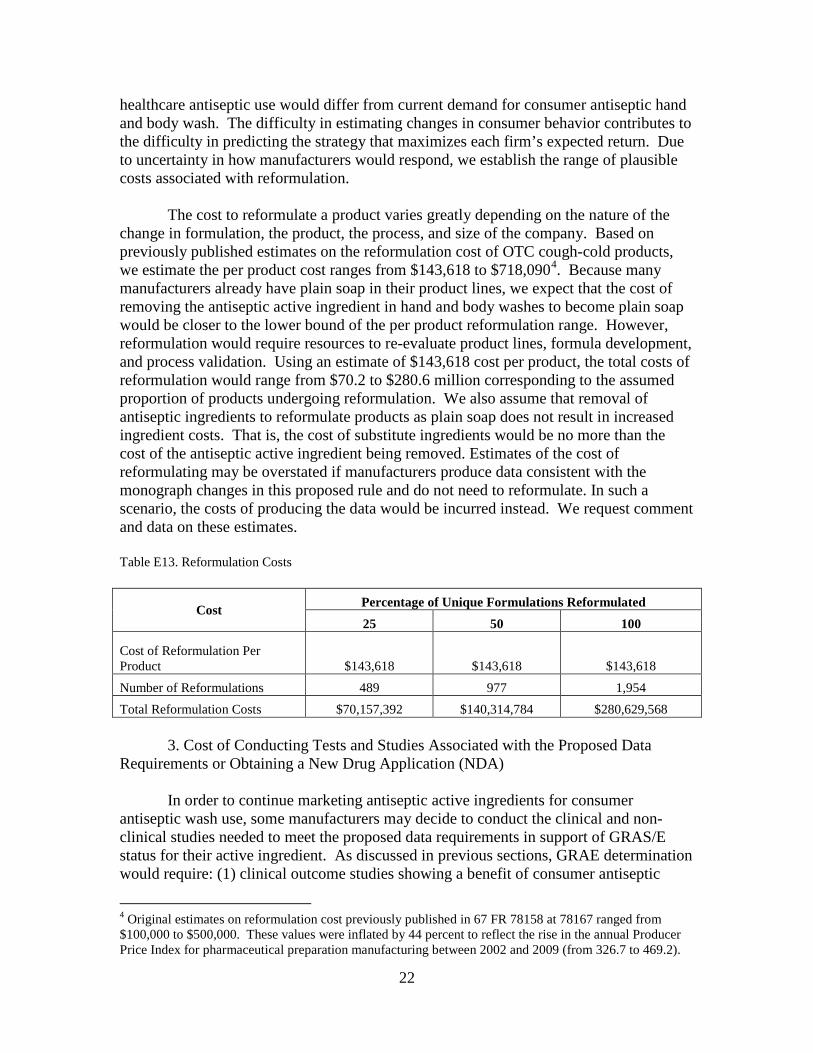
. Because many manufacturers already have plain soap in their product lines, we expect that the cost of removing the antiseptic active ingredient in hand and body washes to become plain soap would be closer to the lower bound of the per product reformulation range. However, reformulation would require resources to re-evaluate product lines, formula development, and process validation. Using an estimate of $143,618 cost per product, the total costs of reformulation would range from $70.2 to $280.6 million corresponding to the assumed proportion of products undergoing reformulation. We also assume that removal of antiseptic ingredients to reformulate products as plain soap does not result in increased ingredient costs. That is, the cost of substitute ingredients would be no more than the cost of the antiseptic active ingredient being removed. Estimates of the cost of reformulating may be overstated if manufacturers produce data consistent with the monograph changes in this proposed rule and do not need to reformulate. In such a scenario, the costs of producing the data would be incurred instead. We request comment and data on these estimates.
The cost to reformulate a product varies greatly depending on the nature of the change in formulation, the product, the process, and size of the company. Based on previously published estimates on the reformulation cost of OTC cough-cold products, we estimate the per product cost ranges from $143,618 to $718,090
Table E13. Reformulation Costs
Cost Percentage of Unique Formulations Reformulated 25 50 100
Cost of Reformulation Per Product $143,618 $143,618 $143,618Number of Reformulations 489 977 1,954 Total Reformulation Costs $70,157,392 $140,314,784 $280,629,568
3. Cost of Conducting Tests and Studies Associated with the Proposed Data Requirements or Obtaining a New Drug Application (NDA)
In order to continue marketing antiseptic active ingredients for consumer antiseptic wash use, some manufacturers may decide to conduct the clinical and non-clinical studies needed to meet the proposed data requirements in support of GRAS/E status for their active ingredient. As discussed in previous sections, GRAE determination would require: (1) clinical outcome studies showing a benefit of consumer antiseptic
4 Original estimates on reformulation cost previously published in 67 FR 78158 at 78167 ranged from $100,000 to $500,000. These values were inflated by 44 percent to reflect the rise in the annual Producer Price Index for pharmaceutical preparation manufacturing between 2002 and 2009 (from 326.7 to 469.2).

23
washes over and above washing with plain soap and (2) non-clinical studies verifying antiseptic activity (i.e. in vitro data from time-kill studies).
For GRAS determination, the clinical and non-clinical studies that would be
required vary by active ingredient, depending on whether there exist adequate data to demonstrate a particular aspect of safety. As discussed in previous sections, the scope of required safety data would include: (1) data from pre-clinical pharmacokinetic studies that describe the Absorption, Distribution, Metabolism, and Excretion (ADME) from both oral and dermal administration in animal models, (2) data from human pharmacokinetic studies describing the ADME properties of a drug via dermal administration using multiple formulations under maximum use conditions, (3) data from developmental and reproductive toxicity (DART) studies, (4) oral carcinogenicity study, (5) dermal carcinogenicity study, (6) a battery of studies to characterize potential hormonal effects (from in vitro assays to long-term multi-generational studies), and (7) data to evaluate development of resistance.
As described in this proposed rule, the safety and effectiveness data required to
support GRAS/E determination would be the same as those required for an approved NDA. While there would be associated NDA user fees costs as well, which are approximately $1.4 million in FY 2010 for each application containing clinical data, sponsors of an approved NDA would receive marketing exclusivity. During a period of exclusivity, profit is expected to be higher than it would be otherwise when there are competing firms in the market place. Therefore, the likelihood that the necessary effectiveness and safety studies are conducted would be greater under the scenario in which manufacturers decide to submit an accompanying NDA, rather than providing the same data in support of OTC monograph status, as the advantage of marketing exclusivity increases the potential for recovery of incurred costs. The potential gain would also be greatest for products approved for specific indications of use with few substitutes available. In addition to the cost to manufacturers of preparing and submitting an NDA, the submission of an NDA would also generate incremental review costs to FDA. The most recent available data based on standard costs published by FDA indicate that in FY 2012 the average cost to FDA for reviewing an NDA with clinical data (for a non-new molecular entity) is approximately $1.9 million (Ref. 29).
Estimating the costs of conducting the proposed clinical and non-clinical studies
is difficult because there are numerous variables that impact the cost of such studies. Some of the variables include: study design, study setting, study size, complexity of the study design, and logistics of study conduct. In the context of drug development, estimates on the costs vary widely in the literature. According to one study, the expected out-of-pocket cost for an average drug during the clinical period is approximately $75 million (Ref. R18). In other studies, the estimated cost of safety and efficacy studies was reported to range from $1 million to $7.5 million, while the pharmaceutical industry has estimated the cost to range from $5 million to over $35 million (Ref. R19). Because precise data on study costs are not publicly available, it is difficult to determine the

24
representativeness of drug development costs in comparison to study costs related to antiseptic washes.
To estimate the total costs of conducting clinical and non-clinical studies that
would be needed to generate the required safety and effectiveness data, we begin by estimating a unit cost for each type of study and test described in the proposed rule.
a. Unit Costs of Conducting Non-clinical Studies to Establish GRAS Due to lack of available detailed data on the testing costs proposed by this rule,
we estimate the cost of non-clinical safety studies based on published cost estimates of representative antimicrobial testing required for certain pesticides by the EPA (Refs. R20, R21). Non-clinical testing costs vary across laboratories depending on the method and study protocol. Unit testing cost estimates are derived by averaging estimates of high and low cost study protocols provided by surveyed laboratories. Study protocols are based on guidelines developed by EPA’s Office of Pesticide Prevention and Toxic Substances (OPPTS) for use in testing the health effects of pesticides and toxic substances.
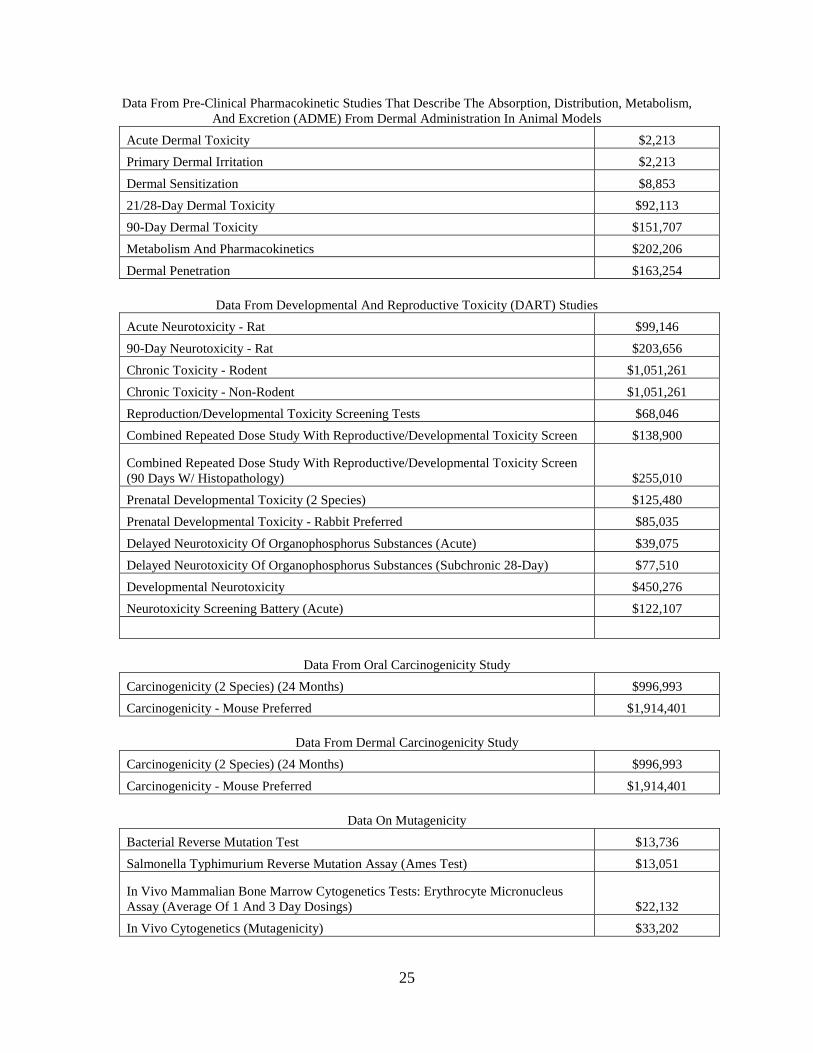
In Table E14, we show a series of estimated testing costs, updated to 2010 dollars,
as reasonable approximations of the costs to fulfill each category of non-clinical safety data requirements proposed by this rule. The estimated testing costs associated with all non-clinical safety data requirements omit the costs corresponding to evaluating the development of resistance. We omit resistance testing costs because we lack data on which to base these estimates and it is not possible to generalize these costs across ingredients. While there would be inherent variation in testing costs, we recognize there may be additional uncertainty generated by extrapolating cost estimates for certain data requirements based on EPA testing requirements. Therefore, we request comment supported by data on our assumptions, as well as information on the costs of conducting the studies needed to evaluate development of resistance. If each test listed in Table E14 were conducted, the estimated cost would be approximately $12.1 million.
Table E14- Estimated Cost Per Study Associated With Non-Clinical Safety Data Requirements (in 2010 dollars)
Data From Pre-Clinical Pharmacokinetic Studies That Describe The Absorption, Distribution, Metabolism, And Excretion (ADME) From Oral Administration In Animal Models
Acute Oral Toxicity $8,352 Repeated Dose 28-Day Oral Toxicity Study In Rodents $58,014 90-Day Oral Toxicity $153,24490-Day Oral Toxicity - Nonrodent $244,608
Metabolism And Pharmacokinetics $202,206
25
Data From Pre-Clinical Pharmacokinetic Studies That Describe The Absorption, Distribution, Metabolism, And Excretion (ADME) From Dermal Administration In Animal Models
Acute Dermal Toxicity $2,213 Primary Dermal Irritation $2,213
Dermal Sensitization $8,853 21/28-Day Dermal Toxicity $92,113 90-Day Dermal Toxicity $151,707 Metabolism And Pharmacokinetics $202,206
Dermal Penetration $163,254
Data From Developmental And Reproductive Toxicity (DART) Studies Acute Neurotoxicity - Rat $99,146 90-Day Neurotoxicity - Rat $203,656Chronic Toxicity - Rodent $1,051,261
Chronic Toxicity - Non-Rodent $1,051,261 Reproduction/Developmental Toxicity Screening Tests $68,046 Combined Repeated Dose Study With Reproductive/Developmental Toxicity Screen $138,900
Combined Repeated Dose Study With Reproductive/Developmental Toxicity Screen (90 Days W/ Histopathology) $255,010Prenatal Developmental Toxicity (2 Species) $125,480Prenatal Developmental Toxicity - Rabbit Preferred $85,035
Delayed Neurotoxicity Of Organophosphorus Substances (Acute) $39,075 Delayed Neurotoxicity Of Organophosphorus Substances (Subchronic 28-Day) $77,510 Developmental Neurotoxicity $450,276Neurotoxicity Screening Battery (Acute) $122,107
Data From Oral Carcinogenicity Study Carcinogenicity (2 Species) (24 Months) $996,993 Carcinogenicity - Mouse Preferred $1,914,401
Data From Dermal Carcinogenicity Study
Carcinogenicity (2 Species) (24 Months) $996,993
Carcinogenicity - Mouse Preferred $1,914,401
Data On Mutagenicity Bacterial Reverse Mutation Test $13,736 Salmonella Typhimurium Reverse Mutation Assay (Ames Test) $13,051
In Vivo Mammalian Bone Marrow Cytogenetics Tests: Erythrocyte Micronucleus Assay (Average Of 1 And 3 Day Dosings) $22,132 In Vivo Cytogenetics (Mutagenicity) $33,202

26
In Vivo Mammalian Bone Marrow Cytogenetics Tests: Erythrocyte Micronucleus Assay (Average Of 1 And 3 Day Dosings) $22,132 Unscheduled DNA Synthesis In Mammalian Cells In Culture $22,855
Data Required For Characterizing Potential Hormonal Effects
Reproduction and Developmental Toxicity Screening Tests $68,046 Combined Repeated Dose Study With Reproductive/Developmental Toxicity Screen $138,900
Combined Repeated Dose Study With Reproductive/Developmental Toxicity Screen (90 Days With Histopathology) $255,010 Reproduction/Fertility Effects (2-Generation Reproduction) $662,392
Data Required To Evaluate Development Of Resistance
No Data Available To Estimate Costs b. Costs of Conducting Clinical Studies to Establish GRAS In addition to non-clinical data requirements for active ingredients seeking GRAS
status, data from human pharmacokinetic (PK) studies describing the ADME properties of a drug via dermal administration using multiple formulations under maximum use conditions would be required. The required studies to demonstrate safety would be similar to the studies required as part of an NDA. The costs of human pharmacokinetic studies vary considerably and detailed data on costs are not publicly available. One estimate suggests that each human pharmacokinetic study may cost $250,000 to $750,000 per age group (Ref. R19). Another study reports low, median, and high cost estimates for multi-dose pharmacokinetic studies (Ref. R22). Cost factors included: coordinating center costs, sponsor management costs, site payments, and central lab payments. Updated to 2010 dollars, the cost per trial for a multi-dose PK study cost estimates range from $725,734 to $23.2 million.
c. Costs of Conducting Clinical and Non-Clinical Studies to Establish GRAE The rule proposes that both data from clinical outcome studies and data from in
vitro studies would be needed to establish GRAE status. Clinical outcome studies to support GRAE status would require at least two study arms, a test product arm and a placebo or plain soap arm. We would also require two adequate and well-controlled effectiveness studies. We lack precise data on the cost of clinical outcome studies specific to the kind described in this proposed rule. However, a reasonable approximation may be the estimated cost of efficacy studies conducted for drug development. Updated to 2010 dollars, estimates of efficacy studies range from $1.96 million to $14.3 million per trial (Ref. R22). The proposed requirement for two effectiveness studies would imply a cost ranging from $3.92 to $ $28.6 million.
The rule proposes that, in addition to data from clinical outcome studies, data
verifying antiseptic activity from in vitro testing would be required. Based on estimates submitted by industry in response to the 1994 TFM, the costs to conduct the necessary

27
time-kill studies would range from $916,257 to $3.98 million, updating to 2010 dollars (Refs. R23, R24).
d. Summary of Costs for Conducting Safety and Effectiveness Studies We summarize the estimated full range of costs to conduct the safety and
effectiveness studies in Table E15. Excluding the costs of conducting studies to evaluate the development of resistance, the cost of satisfying all the data requirements would range from $17.7 million to $68.0 million. The total costs of conducting safety and effectiveness studies would be estimated as the cost per study multiplied by the number of studies that would be conducted; however, we lack sufficient information to be able to estimate the number of sponsors that would opt to conduct the necessary clinical trials or who would submit NDAs for these products.
Table E15. Summary of Safety and Effectiveness Study Costs (in 2010 dollars)
Costs Low Estimate Medium Estimate High Estimate
Non-Clinical Safety Testing
Pre-clinical PK studies that describe the Absorption, Distribution, Metabolism, and Excretion (ADME) from oral administration in animal models $666,425 $666,425 $666,425Pre-clinical PK studies that describe the Absorption, Distribution, Metabolism, and Excretion (ADME) from dermal administration in animal models $622,559 $622,559 $622,559 Developmental and reproductive toxicity (DART) studies $3,766,762 $3,766,762 $3,766,762 Oral carcinogenicity study $2,911,393 $2,911,393 $2,911,393 Dermal carcinogenicity study $2,911,393 $2,911,393 $2,911,393 Mutagenicity $127,108 $127,108 $127,108Data for Characterizing Potential Hormonal Effects $1,124,348 $1,124,348 $1,124,348 Data Required to Evaluate Development of Resistance
Not Estimated Not Estimated Not Estimated
Total Non-clinical Testing Costs (not including resistance testing) $12,129,989 $12,129,989 $12,129,989 Clinical Safety Studies $725,734 $2,542,114 $23,202,190Clinical Outcome Effectiveness Studies $3,918,581 $14,308,034 $28,656,974

Costs Low Estimate Medium Estimate High EstimateNon-Clinical Effectiveness Studies $916,257 $3,983,724 Total s $17,690,561 $28,980,137 $67,972,877
4. Summary of Total Costs A summary of the total one-time costs and annualized value of those costs is
presented in Table E16. There are no expected additional annual costs. The total one-time costs of relabeling and reformulation would range from $112.2 to $368.8 million. Annualizing the costs at a 3 percent discount rate over 10 years would result in annualized costs ranging from $13.2 to $43.2 million and from $16.0 to $52.5 million at a 7 percent discount rate.
Because of the number of variables that influence the cost of doing clinical and
safety studies and because we have no way to estimate the number of manufacturers that would choose to seek NDA approval for their products, we lack sufficient information to estimate these costs of the proposed rule. We therefore include only the estimated costs per sponsor in Table E16.
Table E16. Cost Summary for 12-month Compliance Period
Total Costs (in million dollars)
One-Time CostsAnnualized Costs Over a 10-Year Period
3% Discount Rate 7% Discount RateLow Med. High Low Med. High Low Med. High
Relabeling $42.1 $60.7 $88.1 $4.9 $7.1 $10.3 $6.0 $8.6 $12.5 Reformulation $70.2 $140.3 $280.6 $8.2 $16.4 $32.9 $10.0 $20.0 $40.0 Subtotal $112.2 $201.0 $368.8 $13.2 $23.6 $43.2 $16.0 $28.6 $52.5 Safety and Effectiveness Study Costs per ingredient (excluding resistance testing) $17.7 $29.0 $68.0 $2.1 $3.4 $8.0 $2.5 $4.1 $9.7 Totals may not sum due to rounding.
G. Alternatives
In our analysis of alternatives, we compare the effects of the proposed rule to two otherwise identical rules: one with a 6-month and another with an 18-month compliance period. The main impact of changing the compliance period is on the total costs of relabeling. We assume that relabeling required by the rule cannot be coordinated with any planned revisions for compliance periods under 1 year. Therefore, all label changes would incur the full per product redesign costs. Reducing the compliance period by 6 months would increase the cost of relabeling by $10.1 to $61.4 million. It would also move all costs up by about 6 months. We account for this by compounding the present
28
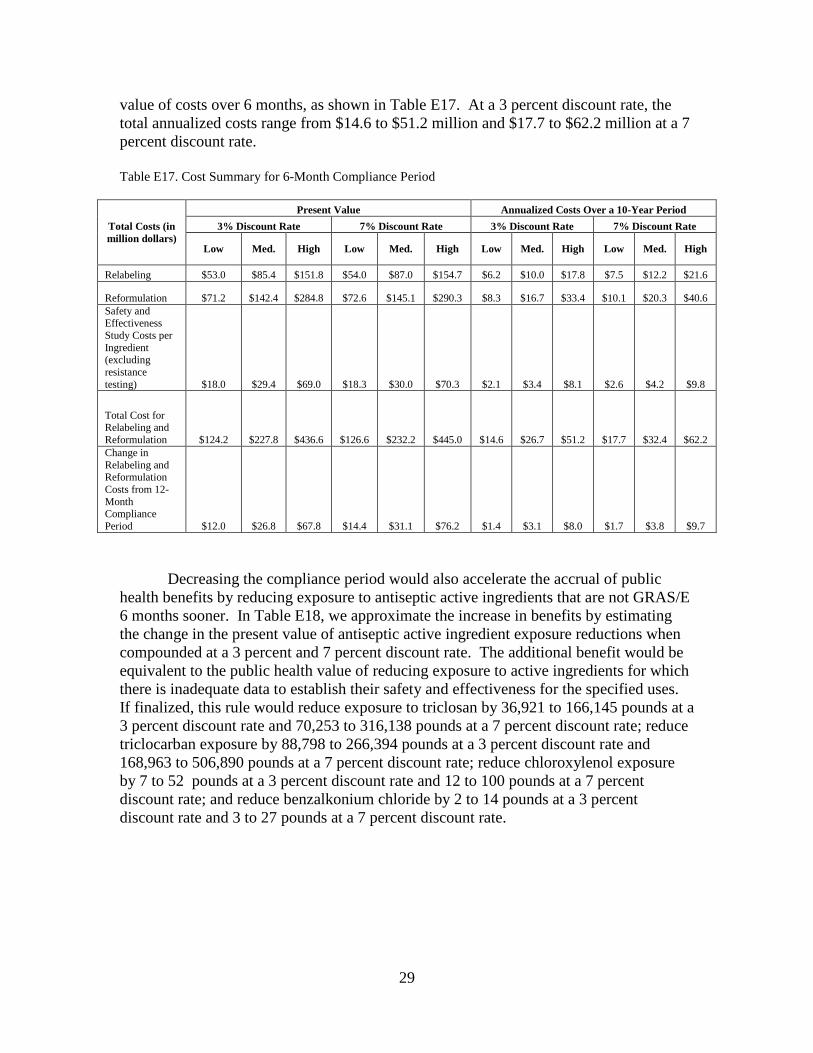
29
value of costs over 6 months, as shown in Table E17. At a 3 percent discount rate, the total annualized costs range from $14.6 to $51.2 million and $17.7 to $62.2 million at a 7 percent discount rate. Table E17. Cost Summary for 6-Month Compliance Period
Total Costs (in million dollars)
Present Value Annualized Costs Over a 10-Year Period3% Discount Rate 7% Discount Rate 3% Discount Rate 7% Discount Rate
Low Med. High Low Med. High Low Med. High Low Med. High
Relabeling $53.0 $85.4 $151.8 $54.0 $87.0 $154.7 $6.2 $10.0 $17.8 $7.5 $12.2 $21.6
Reformulation $71.2 $142.4 $284.8 $72.6 $145.1 $290.3 $8.3 $16.7 $33.4 $10.1 $20.3 $40.6 Safety and Effectiveness Study Costs per Ingredient (excluding resistance testing) $18.0 $29.4 $69.0 $18.3 $30.0 $70.3 $2.1 $3.4 $8.1 $2.6 $4.2 $9.8
Total Cost for Relabeling and Reformulation $124.2 $227.8 $436.6 $126.6 $232.2 $445.0 $14.6 $26.7 $51.2 $17.7 $32.4 $62.2 Change in Relabeling and Reformulation Costs from 12-Month Compliance Period $12.0 $26.8 $67.8 $14.4 $31.1 $76.2 $1.4 $3.1 $8.0 $1.7 $3.8 $9.7
Decreasing the compliance period would also accelerate the accrual of public health benefits by reducing exposure to antiseptic active ingredients that are not GRAS/E 6 months sooner. In Table E18, we approximate the increase in benefits by estimating the change in the present value of antiseptic active ingredient exposure reductions when compounded at a 3 percent and 7 percent discount rate. The additional benefit would be equivalent to the public health value of reducing exposure to active ingredients for which there is inadequate data to establish their safety and effectiveness for the specified uses. If finalized, this rule would reduce exposure to triclosan by 36,921 to 166,145 pounds at a 3 percent discount rate and 70,253 to 316,138 pounds at a 7 percent discount rate; reduce triclocarban exposure by 88,798 to 266,394 pounds at a 3 percent discount rate and 168,963 to 506,890 pounds at a 7 percent discount rate; reduce chloroxylenol exposure by 7 to 52 pounds at a 3 percent discount rate and 12 to 100 pounds at a 7 percent discount rate; and reduce benzalkonium chloride by 2 to 14 pounds at a 3 percent discount rate and 3 to 27 pounds at a 7 percent discount rate.

30
Table E18. Potential Reduction in Exposures (in pounds)
Reduction 6-Month Compliance Period
Change from 12-Month Compliance Period
Present value- 3% Present value-7%
Present value- 3% Present value-7%
Reduced Triclosan Exposure
2,516,651 to 11,324,947
2,112,008 to 9,504,050 36,921 to 166,145 70,253 to 316,138
Reduced Triclocarban Exposure
6,052,741 to 18,158,213
5,079,543 to 15,238,621 88,798 to 266,394
168,963 to 506,890
Reduced Chloroxylenol Exposure 446 to 3,569 374 to 2,995 7 to 52 12 to 100Reduced Benzalkonium Chloride Exposure 123 to 982 103 to 824 2 to 14 3 to 27
Totals 8,569,963 to 29,487,714
7,192,030 to 24,746,492
125,728 to 432,606
239,232 to 823,155
By allowing firms to comply within 18 months of a final rule, we assume that 12-18 percent of labels can coincide with routine label changes, reducing total one-time costs associated with relabeling by $15.9 to $33 million. Extending the compliance period to 18 months would also delay all costs by about 6 months. We account for this by discounting the present value of costs an extra 9 months, as shown in Table E19. Under this scenario, we estimate total annualized costs range from $11.1 to $38.8 million at a 3 percent discount rate and $13.5 to $47.1 million at a 7 percent discount rate.
Table E19. Cost Summary for 18-Month Compliance Period
Costs Present Value Annualized Costs Over a 10-Year Period 3% Discount Rate 7% Discount Rate 3% Discount Rate 7% Discount Rate
Total Costs (in million dollars) Low Med. High Low Med. High Low Med. High Low Med. HighRelabeling $25.8 $37.4 $54.4 $25.4 $36.7 $53.3 $3.0 $4.4 $6.4 $3.7 $5.3 $7.7 Reformulation $69.1 $138.3 $276.5 $67.8 $135.6 $271.3 $8.1 $16.2 $32.4 $9.8 $19.7 $39.4 Safety and Effectiveness Study Costs per Ingredient (excluding resistance testing) $17.4 $28.6 $67.0 $17.1 $28.0 $65.7 $2.0 $3.3 $7.9 $2.5 $4.1 $9.5
Total Cost for Relabeling and Reformulation $95.0 $175.6 $330.9 $93.2 $172.3 $324.6 $11.1 $20.6 $38.8 $13.5 $25.0 $47.1

Costs Present Value Annualized Costs Over a 10-Year Period3% Discount Rate 7% Discount Rate 3% Discount Rate 7% Discount Rate
Change in Relabeling and Reformulation Costs from 12-Month Compliance Period -$17.3 -$25.4 -$37.9 -$19.1 -$28.7 -$44.1 -$2.0 -$3.0 -$4.4 -$2.5 -$3.6 -$5.4
The effect of extending the compliance period to 18 months would be a decrease in potential public health benefits resulting from prolonged exposure to antiseptic active ingredients that are not GRAS/E by 6 months. Discounting the present value of antiseptic active ingredient exposure reductions at 3 percent and 7 percent, we estimate the decrease in public health benefits as the value of increased exposure to triclosan by 36,379.4 to 163,707.7 pounds at a 3 percent discount rate and 67,915.9 to 305,622.2 pounds at a 7 percent discount rate; increased exposure to triclocarban by 87,495.3 to 262,485.9 pounds at a 3 percent discount rate and 163,343.1 to 490,029.1 pounds at a 7 percent discount rate; increased exposure to chloroxylenol by 6.4 to 51.6 pounds at a 3 percent discount rate and 12.0 to 96.3 pounds at a 7 percent discount rate, and increased exposure to benzalkonium chloride by 1.8 to 14.2 pounds at a 3 percent discount rate and 3.3 to 26.5 pounds at a 7 percent discount rate. These estimates are shown in Table E20.
Table E20. Potential Reduction in Exposures (in pounds)
Reductions 18-Month Compliance Period Change from 12-Month Compliance
PeriodPresent value- 3% Present value-7% Present value- 3% Present value-7%
Reduced Triclosan Exposure
2,443,351 to 10,995,094
1,973,839 to 8,882,290
-36379.4 to -163707.7
-67915.9 to -305622.2
Reduced Triclocarban Exposure
5,876,447 to 17,629,333
4,747,236 to 14,241,701
-87495.3 to -262485.9
-163343.1 to -490029.1
Reduced Chloroxylenol Exposure 433 to 3,465 350 to 2,799 -6.4 to -51.6 -12.0 to -96.3Reduced Benzalkonium Chloride Exposure 119 to 953 96 to 770 -1.8 to -14.2 -3.3 to -26.5
Total 8,320,352 to 28,628,848
6,721,523 to 23,127,563
-123883.0 to -426259.4
-231274.5 to -795774.2
Table E21 summarizes the present value of reductions in exposure to antiseptic active ingredients and costs under each compliance period considered under the regulatory alternatives section.

32
Table E21. Summary of Benefits and Costs Under Regulatory Alternatives
Compliance Period Present Value of Total Reduction in Exposure (in million pounds)
Present Value of Total Relabeling and Reformulation Costs (in
$million)3% Discount
Rate 7% Discount
Rate 3% Discount
Rate 7% Discount
Rate 6-Month 8.6 to 29.5 7.2 to 24.7 $124.2 to $436.6 $126.6 to $445.0 12-Month (Proposed rule) 8.4 to 29.1 7.0 to 23.9 $112.2 to $368.8 $112.2 to $368.8 18-Month 8.3 to 28.6 6.7 to 23.1 $95.0 to $330.9 $93.2 to $324.6
H. Cost-Effectiveness
We measure the effectiveness of the proposed rule as the total reduction in exposure to antiseptic active ingredients linked to consumer antiseptic washes. We compared the present value of costs, shown in Table E21, to the present value of reduced exposures for 3 percent discount rate and 7 percent discount rate to estimate the cost per pound of reduced exposure to antiseptic active ingredients under the proposed rule and the two regulatory alternatives. As shown in Table E22, under the proposed rule, we estimate that each pound of reduced exposure to antiseptic active ingredients would increase costs by $3.86 to $43.67 at a 3 percent discount rate and $4.69 to $53.04 at a 7 percent discount rate.
Table E22. Cost-Effectiveness Under Alternative Compliance Periods (in $ per pound of antiseptic active ingredient reduced)
Compliance Period
3% Discount Rate 7% Discount Rate Low Med. High Low Med. High
6-Month $4.21 $11.97 $50.95 $5.12 $14.54 $61.8812-Month (Proposed rule) $3.86 $10.72 $43.67 $4.69 $13.02 $53.0418-Month $3.32 $9.51 $39.77 $4.03 $11.54 $48.30
III. Initial Regulatory Flexibility Analysis
The Regulatory Flexibility Act requires agencies to prepare an initial regulatory flexibility analysis if a proposed rule would have a significant effect on a substantial number of small entities. We expect this proposed rule to have a significant effect on a substantial number of small entities. Consequently, this analysis, together with other relevant sections of this document, serves as the Initial Regulatory Flexibility Analysis, as required under the Regulatory Flexibility Act.
A. Description and Number of Affected Small Entities
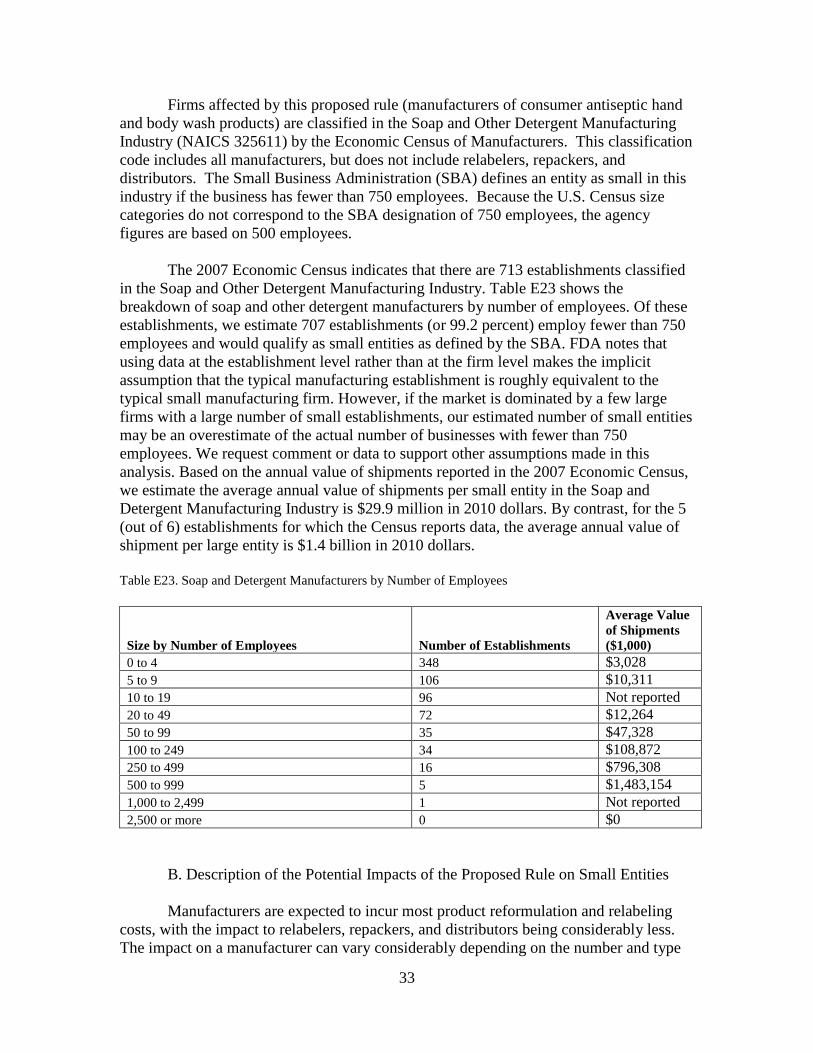
33
Firms affected by this proposed rule (manufacturers of consumer antiseptic hand and body wash products) are classified in the Soap and Other Detergent Manufacturing Industry (NAICS 325611) by the Economic Census of Manufacturers. This classification code includes all manufacturers, but does not include relabelers, repackers, and distributors. The Small Business Administration (SBA) defines an entity as small in this industry if the business has fewer than 750 employees. Because the U.S. Census size categories do not correspond to the SBA designation of 750 employees, the agency figures are based on 500 employees.
The 2007 Economic Census indicates that there are 713 establishments classified
in the Soap and Other Detergent Manufacturing Industry. Table E23 shows the breakdown of soap and other detergent manufacturers by number of employees. Of these establishments, we estimate 707 establishments (or 99.2 percent) employ fewer than 750 employees and would qualify as small entities as defined by the SBA. FDA notes that using data at the establishment level rather than at the firm level makes the implicit assumption that the typical manufacturing establishment is roughly equivalent to the typical small manufacturing firm. However, if the market is dominated by a few large firms with a large number of small establishments, our estimated number of small entities may be an overestimate of the actual number of businesses with fewer than 750 employees. We request comment or data to support other assumptions made in this analysis. Based on the annual value of shipments reported in the 2007 Economic Census, we estimate the average annual value of shipments per small entity in the Soap and Detergent Manufacturing Industry is $29.9 million in 2010 dollars. By contrast, for the 5 (out of 6) establishments for which the Census reports data, the average annual value of shipment per large entity is $1.4 billion in 2010 dollars.
Table E23. Soap and Detergent Manufacturers by Number of Employees
Size by Number of Employees Number of Establishments
Average Value of Shipments ($1,000)
0 to 4 348 $3,028 5 to 9 106 $10,311 10 to 19 96 Not reported 20 to 49 72 $12,264 50 to 99 35 $47,328 100 to 249 34 $108,872 250 to 499 16 $796,308 500 to 999 5 $1,483,154 1,000 to 2,499 1 Not reported 2,500 or more 0 $0
B. Description of the Potential Impacts of the Proposed Rule on Small Entities Manufacturers are expected to incur most product reformulation and relabeling
costs, with the impact to relabelers, repackers, and distributors being considerably less. The impact on a manufacturer can vary considerably depending on the number and type

34
of products it produces. For this analysis, we examine the brands of affected UPCs listed in the A.C. Nielsen data to estimate the proportion of products sold by large companies and conservatively assume that the remaining products, including private label products, are manufactured by small companies. Estimating that approximately 63 percent of affected products are produced by small entities, we assume rule-induced costs of relabeling and reformulation borne by small entities are proportional. Assuming these costs are distributed equally, we estimate that the average one-time cost of compliance for a small business ranges from $0.10 million to $0.33 million, which would be approximately 0.33 percent to 1.10 percent of the average annual value of shipments for a small business. Table E24 shows the summary of the estimated costs for small entities.
Table E24. Summary of Costs for Small Entities Under 12-Month Compliance Period (proposed rule) (in $millions)
Costs Present Value Annualized Costs Over a 10-Year Period
3% Discount Rate 7% Discount Rate 3% Discount Rate 7% Discount Rate Low Med. High Low Med. High Low Med. High Low Med. High
Total costs of relabeling and reformulation for small entities $70.7 $126.6 $232.3 $70.7 $126.6 $232.3 $8.3 $14.8 $27.2 $10.1 $18.0 $33.1 Average compliance cost per small entity $0.10 $0.18 $0.33 $0.10 $0.18 $0.33 $0.01 $0.02 $0.04 $0.01 $0.03 $0.05Cost as a percent of average annual value of shipments per entity 0.33% 0.60% 1.10% 0.33% 0.60% 1.10% 0.04% 0.07% 0.13% 0.05% 0.09% 0.16%
C. Alternatives for Regulatory Relief
1. Exemption for Small Businesses
The exemption of small businesses from the provisions of the rule would provide regulatory relief. Table E24 of this document shows that small businesses are expected to bear total one-time costs of about $70.7 million to $232.3 million as a result of this rule, an average of $0.10 million to $0.33 million per small business. As a first approximation, then, exempting small businesses would reduce the burden by an average of $0.10 million to $0.33 million per small business.
FDA believes that exempting small businesses would not be desirable. Because
99.2 percent of the consumer antiseptic wash industry are classified as small by the Small Business Administration, if small businesses were exempted, most of the potential benefits from the rule would not be realized.
2. Longer Compliance Period for Small Businesses
Longer compliance periods provide regulatory relief for small businesses. Extending the compliance period to 18 months would lead to an average one-time cost
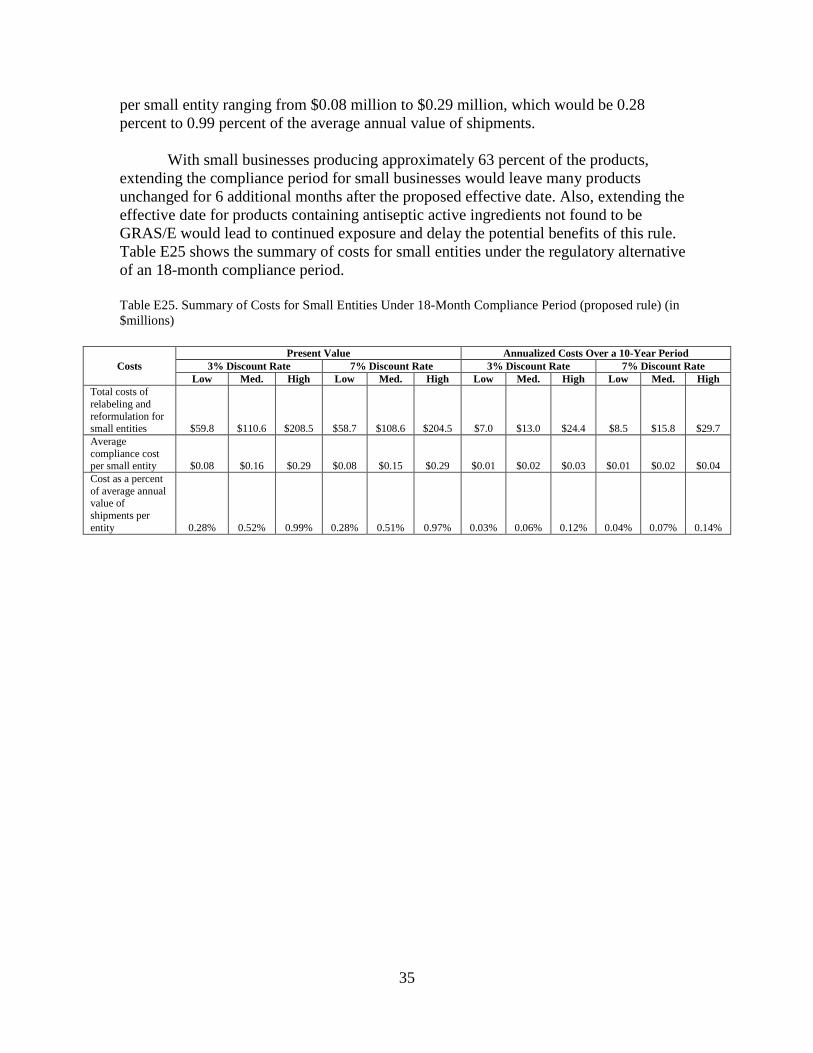
35
per small entity ranging from $0.08 million to $0.29 million, which would be 0.28 percent to 0.99 percent of the average annual value of shipments.
With small businesses producing approximately 63 percent of the products,
extending the compliance period for small businesses would leave many products unchanged for 6 additional months after the proposed effective date. Also, extending the effective date for products containing antiseptic active ingredients not found to be GRAS/E would lead to continued exposure and delay the potential benefits of this rule. Table E25 shows the summary of costs for small entities under the regulatory alternative of an 18-month compliance period.
Table E25. Summary of Costs for Small Entities Under 18-Month Compliance Period (proposed rule) (in $millions)
Costs Present Value Annualized Costs Over a 10-Year Period
3% Discount Rate 7% Discount Rate 3% Discount Rate 7% Discount RateLow Med. High Low Med. High Low Med. High Low Med. High
Total costs of relabeling and reformulation for small entities $59.8 $110.6 $208.5 $58.7 $108.6 $204.5 $7.0 $13.0 $24.4 $8.5 $15.8 $29.7 Average compliance cost per small entity $0.08 $0.16 $0.29 $0.08 $0.15 $0.29 $0.01 $0.02 $0.03 $0.01 $0.02 $0.04Cost as a percent of average annual value of shipments per entity 0.28% 0.52% 0.99% 0.28% 0.51% 0.97% 0.03% 0.06% 0.12% 0.04% 0.07% 0.14%
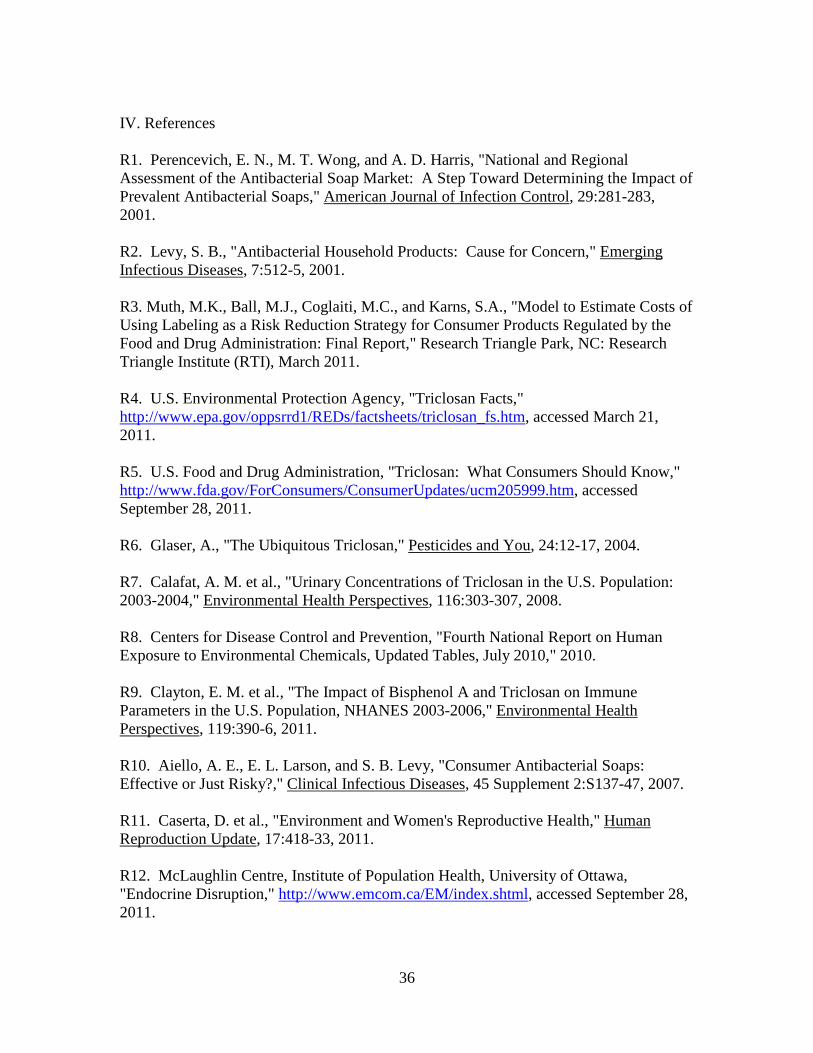
36
IV. References R1. Perencevich, E. N., M. T. Wong, and A. D. Harris, "National and Regional Assessment of the Antibacterial Soap Market: A Step Toward Determining the Impact of Prevalent Antibacterial Soaps," American Journal of Infection Control, 29:281-283, 2001. R2. Levy, S. B., "Antibacterial Household Products: Cause for Concern," Emerging Infectious Diseases, 7:512-5, 2001. R3. Muth, M.K., Ball, M.J., Coglaiti, M.C., and Karns, S.A., "Model to Estimate Costs of Using Labeling as a Risk Reduction Strategy for Consumer Products Regulated by the Food and Drug Administration: Final Report," Research Triangle Park, NC: Research Triangle Institute (RTI), March 2011. R4. U.S. Environmental Protection Agency, "Triclosan Facts," http://www.epa.gov/oppsrrd1/REDs/factsheets/triclosan_fs.htm, accessed March 21, 2011. R5. U.S. Food and Drug Administration, "Triclosan: What Consumers Should Know," http://www.fda.gov/ForConsumers/ConsumerUpdates/ucm205999.htm, accessed September 28, 2011. R6. Glaser, A., "The Ubiquitous Triclosan," Pesticides and You, 24:12-17, 2004. R7. Calafat, A. M. et al., "Urinary Concentrations of Triclosan in the U.S. Population: 2003-2004," Environmental Health Perspectives, 116:303-307, 2008. R8. Centers for Disease Control and Prevention, "Fourth National Report on Human Exposure to Environmental Chemicals, Updated Tables, July 2010," 2010. R9. Clayton, E. M. et al., "The Impact of Bisphenol A and Triclosan on Immune Parameters in the U.S. Population, NHANES 2003-2006," Environmental Health Perspectives, 119:390-6, 2011. R10. Aiello, A. E., E. L. Larson, and S. B. Levy, "Consumer Antibacterial Soaps: Effective or Just Risky?," Clinical Infectious Diseases, 45 Supplement 2:S137-47, 2007. R11. Caserta, D. et al., "Environment and Women's Reproductive Health," Human Reproduction Update, 17:418-33, 2011. R12. McLaughlin Centre, Institute of Population Health, University of Ottawa, "Endocrine Disruption," http://www.emcom.ca/EM/index.shtml, accessed September 28, 2011.

37
R13. American Cleaning Institute (ACI), "Antibacterial Soap Survey Results," http://www.cleaninginstitute.org/assets/1/AssetManager/AntibacSurveyResultsJa182011.pdf, 2010. R14. Reiss, R. et al., "An Ecological Risk Assessment for Triclosan in Lotic Systems Following Discharge from Wastewater Treatment Plants in the United States," Environmental Toxicology and Chemistry, 21:2483-2492, 2002. R15. Halden, R. U. and D. H. Paull, "Co-occurrence of Triclocarban and Triclosan in U.S. Water Resources," Environmental Science and Technology, 39:1420-1426, 2005. R16. Scientific Committee on Consumer Products (SCCP), "Opinion on Triclosan," 2009. R17. Henkel Consumer Goods Inc. and LANXESS Corp., "Background Material for the May 24, 2010, Biomonitoring California Scientific Guidance Panel Meeting," 2010. R18. DiMasi, J. A., H. G. Grabowski, and J. Vernon, "R&D Costs and Returns by Therapeutic Category," Drug Information Journal, 38:211-223, 2004. R19. U.S. General Accounting Office, "Testimony Before the Committee on Health, Education, Labor, and Pensions U.S. Senate: Pediatric Drug Research: Substantial Increase in Studies of Drugs for Some Children but Challenges Remain. GAO-01-705 T," http://www.gao.gov/new.items/d01705t.pdf, 2001. R20. U.S. Environmental Protection Agency, "Economic Analysis of the Proposed Change in Data Requirements for Antimicrobial Pesticides," 2008. R21. U.S. Environmental Protection Agency, "Economic Analysis of Expedited Significant New Use Rule for One Chemical Substance," 2009. R22. Li, J. S. et al., "Economic Return of Clinical Trials Performed Under the Pediatric Exclusivity Program," JAMA, 297:480-8, 2007. R23. Comment No. C19 in Docket No. 1975N-0183H. R24. Comment No. C25 in Docket No. 1975N-0183H. R25. Comment No. C14 in Docket No. 1975N-0183H. R26. Marchie, M. “A New Attitude: Soaps get serious: Health concerns have consumers washing up more than ever. Soap marketers offer options for a public that insists on a more thorough clean,” Household and Personal Products Industry, 2001. http://www.thefreelibrary.com/A+new+attitude%3A+soaps+get+serious%3A+health+concerns+have+consumers...-a081009074, accessed August 23, 2013.

38
R27. U.S. General Accounting Office, "Antibiotic Resistance: Data Gaps Will Remain Despite HHS Taking Steps to Improve Monitoring. GAO-11-406," http://www.gao.gov/new.items/d11406.pdf, 2011. R28. U.S. Food and Drug Administration. “2011 Summary Report on Antimicrobials Sold or Distributed for Use in Food-Producing Animals,” http://www.fda.gov/downloads/ForIndustry/UserFees/AnimalDrugUserFeeActADUFA/UCM338170.pdf, accessed August 23, 2013. R29. U.S. Food and Drug Administration. “Standard Costs for Components of the Process for the Review of Human Drug Applications,” http://www.fda.gov/ForIndustry/UserFees/PrescriptionDrugUserFee/ucm093484.htm, accessed August 23, 2013. R30. Fourth National Report on Human Exposure to Environmental Chemicals, Updated Tables, March 2013 R31. Transcript of the October 20, 2005, Meeting of the Nonprescription Drugs Advisory Committee, http://www.fda.gov/ohrms/dockets/ac/05/transcripts/2005-4184T1.pdf, 2005. R32. Chen, J. et al., "Triclocarban Enhances Testosterone Action: A New Type of Endocrine Disruptor?," Endocrinology, 149:1173-1179, 2008. R33. Crofton, K. M. et al., "Short-Term In Vivo Exposure to the Water Contaminant Triclosan: Evidence for Disruption of Thyroxine," Environmental Toxicology and Pharmacology, 24:194-197, 2007. R34. Ahn, K. C. et al., "In Vitro Biologic Activities of the Antimicrobials Triclocarban, Its Analogs, and Triclosan in Bioassay Screens: Receptor-Based Bioassay Screens," Environmental Health Perspectives, 116:1203-1210, 2008. R35. Gee, R. H. et al., "Oestrogenic and Androgenic Activity of Triclosan in Breast Cancer Cells," Journal of Applied Toxicology, 28:78-91, 2008. R36. Jacobs, M. N., G. T. Nolan, and S. R. Hood, "Lignans, Bacteriocides and Organochlorine Compounds Activate the Human Pregnane X Receptor (PXR)," Toxicology and Applied Pharmacology, 209:123-133, 2005. R37. Kumar, V., C. Balomajumder, and P. Roy, "Disruption of LH-Induced Testosterone Biosynthesis in Testicular Leydig Cells by Triclosan: Probable Mechanism of Action," Toxicology, 250:124-131, 2008. R38. Kumar, V. et al., "Alteration of Testicular Steroidogenesis and Histopathology of Reproductive System in Male Rats Treated With Triclosan," Reproductive Toxicology, 27:177-185, 2009.

39
R39. Paul, K. B. et al., "Short-term Exposure to Triclosan Decreases Thyroxine In Vivo via Upregulation of Hepatic Catabolism in Young Long-Evans Rats," Toxicological Sciences, 113:367-379, 2010.
R40. Stoker, T. E., E. K. Gibson, and L. M. Zorrilla, "Triclosan Exposure Modulates Estrogen-Dependent Responses in the Female Wistar Rat," Toxicological Sciences, 117:45-53, 2010.
R41. Zorrilla, L. M. et al., "The Effects of Triclosan on Puberty and Thyroid Hormones in Male Wistar Rats," Toxicological Sciences, 107:56-64, 2009.
R42. Diamanti-Kandarakis, E. et al., "Endocrine-Disrupting Chemicals: An Endocrine Society Scientific Statement," Endocrine Reviews, 30:293-342, 2009.