preliminary version managing capital flows and …saarcfinance.org/managingcapital.pdfpreliminary...
TRANSCRIPT
1
Preliminary Version
Managing Capital Flows and Remittances in the SAARC Region
for Safeguarding Financial Stability
This paper examines various aspects of capital flows and remittances in the context of
SAARC countries. Reflecting the heterogeneity among SAARC economies, the study finds that
the relative importance of capital flows and remittances varies from perspective of their
balance of payments. Following the methodology suggested by Calvo (1998) and used by
others, we identify phases of stops and surges for capital inflows, flights and retrenchments for
outflows of varied average duration in SAARC countries. Interestingly, capital flows do not
exhibit synchronized behavior in case of SAARC countries. Further, based on panel data
analysis, we examine the role of various pull and push factors that influence capital inflows
and outflows in SAARC countries and finds expectation of exchange rate of local currency and
public debt as statistically significant factors for explaining both inflows and outflows. By
contrast, GDP growth, political stability, trade openness and domestic interest rate do not
seem to play any role in movements in capital inflows and outflows. As regards remittances,
VECM estimates suggest that international crude oil prices and per capita income level in
major non-gulf source countries play an important role while other factors (not included in the
model) might also be at play. From financial stability perspective, the paper finds contrasting
results on the relationship of capital flows with domestic macroeconomic indicators. It also
estimates the level of intervention by SAARC central banks in domestic forex markets through
Resistance Index and extent of sterilization of foreign capital flows. The paper concludes that
capital flows differ both in terms of magnitude and duration and countries should strengthen
their domestic fundamentals to make capital flows more resilient and less volatile.
Keywords: Capital Flows, FDI, Sudden Stops, Financial Stability, Panel Data
JEL Classification: F23, F26, F43
Section I
Introduction
The rise in capital flows to emerging market economies (EMEs) in recent decades is a
reflection of the rapid expansion and integration of international capital markets, largely driven
A SAARCFINANCE Study co-authored by Shah Hussain and Rajeev Jain as Lead Researchers from the State of Bank
of Pakistan (Karachi) and the Reserve Bank of India (Mumbai), respectively. Authors thank colleagues from SAARC
central banks for providing data (Mabdul Wahab from Bangladesh Bank, Sonam Tobgye from Royal Monetary
Authority of Bhutan, Mitra Prasad Timsina from Nepal Rastra Bank, Murtaza Muzaffari from Da Afghanistan Bank,
Mariyam Rashfa from Maldives Monetary Authority and Sumila Wanaguru from Central Bank of Sri Lanka). This
paper was presented at SARRCFINANCE Governors’ Symposium at the Reserve Bank of India on May 27, 2016.
Authors thank Madhu Mohanty (BIS) and Gian Maria Milesi-Ferretti (IMF) for their comments as discussants.

2
by economic policy and structural changes, and also technological factors. Theoretically, the
favourable impact of foreign capital flows can be realised through high domestic investment
aiding the growth process in recipient economies. Further, the cross-border financial flows can
channelize resources efficiently and offer risk diversification for global investors. However,
the issue is that capital flows are rarely consistent with the precise needs of the individual
economies and have often posed challenges for central banks not only from monetary policy
perspective but also financial stability perspective albeit the nature of impact varies depending
on external openness of economies.
Thus, the issue of capital flows has generated an intense debate among economists,
highlighting its pros and cons. In case of SARRC countries, external flows occur not only
through capital flows but also remittances. In fact, for smaller SAARC economies, latter is a
dominant form of external flows due to presence of a sizable local diaspora abroad.
Furthermore, the different policy frameworks (for monetary policy and exchange rate) as well
as adoption of varied degree of capital account liberalisation, the policy challenges for policy
makers are likely to vary. Against this background, it is interesting to examine the implications
of external flows (capital flows and remittances) from the perspective of financial stability. The
objective of the paper is three-fold: First, to identify/study various episodes of external flows
and their impact on domestic variables. Second, to identify the major drivers for external flows
to SAARC countries. And third, to examine other aspects of capital flows related to financial
stability and identify policy actions that can make SAARC economies more resilient to volatile
external flows.
Accordingly, the paper is divided into seven sections (including the introductory
section). The second section will undertake a survey of literature on the issue of capital flows
both in global and SAARC context. The third section provides some stylised facts on policy
frameworks, importance of capital flows and remittances at each country level and implications
for monetary policy. Basically, this section describes the evolution of capital flows to SAARC
countries. The fourth section identifies the episodes of ‘surges’, ‘stops’, ‘flight’, and
‘retrenchment’ for capital flows in SAARC countries and implications for domestic variables
(e.g., growth, inflation, monetary conditions, exchange rate, etc). The fifth section examines
the role of ‘push’ and ‘pull’ factors for capital flows and remittances in SAARC countries using
a panel data framework for selected SAARC countries. The sixth section examines the aspects
of implications of external flows for financial stability. The last section concludes with policy
recommendations relevant for SAARC countries.
Section II
Literature Review
Implications of capital flows and remittances: The global context
The issue of capital flows is by no means new in economic literature as it has posed
macroeconomic and financial stability challenges for economies, particularly emerging market
economies (EMEs) almost on an ongoing basis. Literature recognizes the role of both global
“push” and domestic “pull” factors in determining the direction and magnitude of capital flows,

3
albeit their relative prominence may vary inter-temporally and across EMEs. From the
perspective of balance of payments, not only the direction and magnitude of capital flows are
important, the flow of remittances also plays a critical role in many small EMEs. This is
particularly so for economies in the SAARC region which has a large diaspora abroad. This
section provides an overview of extant literature focusing on determinants of capital flows and
their macroeconomic and financial stability implications.
Following the crises of the 1980s and the 1990s, various empirical studies have focused
on examining the macroeconomic challenges of increased capital flows to EMEs. The major
risks and challenges that EMEs generally face consequent to the capital flows inter alia include
currency appreciation pressures; asset price bubbles, excessive expansion of domestic bank
credit, the expansion of domestic demand, widening of current account and the risk of
overheating. These risks have the potential to induce financial and economic crisis (Reinhart
and Reinhart, 2008; Cardarelli et al, 2010; Furceri et al 2012). Mihaljek (2008) highlights the
importance of gross capital flows on at least three grounds, viz., (i) as a measure of financial
integration between EMEs and advanced economies; (ii) as a source of information for
macroeconomic analysis; and (iii), as a key source of information for financial stability
analysis. Nevertheless, whether external flows benefit the recipient economy also depends on
its ability to absorb foreign capital. This aspect has been emphasized inter alia by Prasad et al
(2006) and Farkas (2015). Prasad et al does not find growth enhancing effect of foreign capital
in non-industrial countries in the long-run due to lack of domestic absorptive capacity while
by contrast growth and foreign financing are positively correlated in industrial countries.
Farkas (2012) also supports that FDI and economic growth is shaped by absorptive capacities.
While large capital inflows beyond absorptive capacity may pose challenge in the short run by
making recipient countries vulnerable to external shocks, heightening the risks of economic
overheating, there are risks of abrupt reversals in capital inflows with implications for domestic
monetary management.
It is generally argued that the overall capital inflows matter more from macroeconomic
management perspective, the composition of capital flows is critical for monetary policy,
management of liquidity and financial stability. From monetary policy side, capital flows are
important as certain types of capital flows are more sensitive to short-term interest rates (given
exchange rate expectations), which, in turn, are highly linked to policy rates as part of the
monetary policy transmission. Capital flows are important for the management of liquidity
because the maturity or duration structure will influence the choice of instruments for
sterilisation. The composition of capital flow is critical for financial stability as it determines
how risks are shared between providers and recipients and also impacts domestic fixed capital
formation. From financial stability perspective and policy formulation on capital account
liberalization at country level, important dimensions of composition of capital flows include
(i) equity versus debt, (ii) short-term versus long-term, (iii) investment versus consumption,
(iv) foreign versus domestic currency and (v) tradables versus non-tradables. These dimensions
of capital flows reflect the quality of capital inflows and critical for determining the
vulnerability of a country to external shocks.
The past experience shows that inadequate attention to these aspects did lead to crisis
in many EMEs in 1980s and 1990s. For instance, during the early 1990s, a large volume of

4
foreign private capital, mostly in short-term and foreign currency flowed in many EMEs (e.g.,
East Asian Economies). Even though it helped in financing current account deficits, the quality
of capital flows eventually did pose financial stability concerns. Since these EMEs were
exposed to the risks of currency and maturity mismatches, in the event of a loss of confidence,
domestic issuers had to prematurely liquidate long-term assets to meet short-term repayment
pressures. It triggered and aggravated the financial crises in 1990s of many EMEs (BIS, 2009).
Given the experience, EMEs in general, including SAARC countries, have moved
cautiously towards capital account liberalization. In the pre-crisis period, both influential
academicians (Obstfeld, 1998) and multilateral agencies (e.g., IMF, World Bank) often
favoured policies for open capital account liberalization for EMEs, albeit their role in
enhancing growth was ambiguous (Prasad, 2003, Eichengreen, 2004, IMF, 2005; Ocampo et
al, 2008). It was argued that capital controls reduce the supply of capital and prevents country
achieve their potential cost by raising the cost of financing; exacerbating financial constraints
for local firms due to lack of direct access to global capital markets; making local firms less
disciplined due to absence of markets (Harrison et al., 2004; Forbes, 2003). In the post-crisis
period, however, there has been a great deal of re-thinking and debate on the appropriate policy
responses to minimize the risks of capital flows to macroeconomic and financial stability at
country-level. In practice, many EMEs used capital controls in the post-crisis period to
minimize the spillover effects on their local currencies, and pursue independent monetary
policies to curb asset bubbles and inflation. Further, a number of empirical studies also find the
use of capital controls to be effective in achieving the primary objective of financial stability
at country level (e.g., Baba and Kokenyne, 2011; Gallagher, 2011). Thus, even at multilateral
level, capital controls are now being increasingly seen as legitimate tools to promote financial
stability along with other policy options.
As one of the objectives of this paper is to assess the driving factors for capital flows
and remittances to SAARC countries, it is important to briefly highlight as to what does the
literature suggests on this issue in the global context. In fact, the debate on the role of ‘push’
and ‘pull’ factors as driving factors for global capital flows dates back to the 1990s when many
EMs liberalised their capital accounts and received substantial short-term portfolio capital
inflows and witnessed banking/financial crisis (Calvo, Leiderman, and Reinhart 1996). In the
aftermath of global financial crisis, these issues again came to the forefront as large swings in
global capital flows occurred and financial stability concerns were felt across economies
through sudden stops, surges, retrenchments, and capital flight (Reinhart and Reinhart 2009;
Cardarelli, Elekdag and Kose 2009; Forbes and Warnock 2011). The issue also assumed
importance at international forums (IMF and G-20) which debated on whether there was a need
for imposition of capital controls to deal with volatile capital flows. Highlighting the global
spillovers of unconventional monetary policies in AEs, Rajan (2015) argues that “capital flows
into recipient countries tend to increase local leverage; this is not just due to the direct effect
of cross-border banking flows but also the indirect effect, as the appreciating exchange rate and
rising asset prices, especially of real estate, make it seem that borrowers have more equity than
they really have”.
Theoretically, capital flows to any country during a period must reflect the confluence
of supply side push factors and demand side pull factors. As regards the cross-border capital

5
flows in pre-crisis period, major pull factors that made EMEs as major recipient economies
included successful price stabilisation programs, accompanied by improved fiscal policy
fundamentals and greater macroeconomic stability, high growth in EMEs, more open capital
account, etc. Similarly, among push factors, benign liquidity conditions in the global economy
influenced by monetary/fiscal policies and declining profit opportunities due to lower growth
in AEs also steered capital flows towards EMEs. While the push factors are largely beyond the
control of recipient economies, EMEs have some leeway in exercising various policy options
to alter the role of pull factors in capital flows as the domestic economic situation warrants.
Nevertheless, the relative role of pull and push factors varied across countries and periods. In
a similar vein, the remittance flows are also determined by pull and push factors. For instance,
the major push factors include the income of the migrant, interest rate in source country and
geopolitical conditions while the pull factors mainly include economic conditions in the
recipient country (e.g. more remittances during the period of low income conditions), income
is low); domestic interest rates and return on other alternative asset classes in recipient,
domestic political uncertainty.
EMEs, with high growth potential, are expected to remain as preferred destination for
capital flows. Consequently, capital flow to EMEs is likely to stay as a permanent feature of
the global financial markets. However, we all know that the costs of benefits of capital flows
have been a contentious issue among academics and policymakers. The systemic implications
of capital flows for EMEs are well recognized and whether there is crisis or not, capital flows
pose challenges for central bankers in EMEs during upswing as well downswing of the business
cycle. While at the global level, smooth financial flows are generally perceived as sign of
benign financial conditions, for individual EMEs, however, they may not always be welcome.
Capital Flows and Remittances in SAARC Countries: Literature Survey
In the context of SAARC countries, only a few country level studies exist which
examine the issue of implications of external flows for financial stability or identify the pull or
push factors for external flows. These studies have focused mainly on macroeconomic
implications of external flows rather than much attention on financial stability implications.
This sub-section presents a bird’s eye view of these country-specific studies, though limited to
major SAARC economies including India, Pakistan and Sri Lanka.
Since early 1990s, external sector developments in India have been marked by strong
capital flows. Capital inflows, which hitherto were mainly confined to official concessional
finance, picked up sharply with easing of FDI policy, permission of portfolio inflows and other
regulatory changes. Thus, capital inflows increased not only in terms of size but also in terms
of composition due to policies emphasizing a shift from predominantly official and private debt
flows to non-debt-creating flows. Since the pick-up in capital flows to India, there have been a
lot of studies that attempted to understand the precise nature of the causal relationship among
capital flows, the exchange rate, interest rates and reactions of monetary policy. Most of these
studies recognize that swings in capital flows make domestic macroeconomic and monetary
management more complex. For instance, Kohli (2001) argues that consequent to foreign
capital flows, domestic monetary expansion is difficult to monitor and if it remains unsterilized,

6
it could lead to financial stability implications through unscrupulous loans. Dua and Sen (2006)
find capital flows to be the most important factor influencing the real effective exchange of the
Indian rupee. Mohan (2007) argues that volatility in capital flows can have a significant impact
on exchange rates, domestic monetary and liquidity conditions and overall macroeconomic and
financial stability. Virmani (2007) also opines that if the medium-long term capital inflows are
in excess of the long term current account deficit, it could lead various costs, in form of the
rupee exchange rate. Kramer et al (2008) argues that even though India’s is relatively less
globalised as compared to her peer economies, global factors, e.g., capital flows, do
significantly affect domestic monetary conditions. Mohan and Kapur (2009) finds that despite
large capital flows to India since 1993-94, macroeconomic price and financial stability has
been maintained in a high growth environment through effective policy measures. Kohli (2011)
underscores the importance policy tools that have been used in case of India during various
phases of capital flows to balance objective of both exchange rate and price stability. Gupta
and Sengupta (2013) suggests that in an era of volatile capital flows, the policy makers need to
achieve a balance among diverse objectives such as robust growth rate, sustainable current
account deficit, competitive exchange rate, external capital for domestic capital formation,
moderate inflation, targeted monetary and credit growth rate, minimizing financial fragilities
and maintaining adequate reserves. Singh and Muzammil (2010) also recognizes implications
of foreign capital inflows on Indian rupee exchange rate. Analysing the taper-talk period, Basu
et al (2015) show that India, being the recipient of large capital flows in pre-taper talk period,
was adversely impacted as large and liquid financial markets were a convenient target during
period of global risk aversion and weakness in domestic macro-fundamentals also aggravated
the external vulnerability. Identifying the episodes of surges and sudden stops in both the pre-
crisis and post-crisis period, Gupta (2016) suggests that India’s monetary policy has been
influenced by the ebbs and flows of the capital inflows and shows that although price stability
and growth have taken precedence over issues related to exchange rate or capital flows in policy
rate setting, there is evidence of some accommodation in money supply during the surge and
stop episodes.
In case of Pakistan, there are few studies that examine the impact of capital flows on
exchange rate and other macroeconomic parameters such as growth and inflation. Most of these
studies have focused on phases during which Pakistan experienced unprecedented rise in
foreign exchange inflows especially through sharp rise in remittances which had implications
for conduct of monetary policy, money supply, inflationary pressure and undue appreciation of
Pakistan’s rupee. Khan (1996) argues that among external flows, remittances, FDI and resident
foreign currency deposits have been a durable source while portfolio investment, non-resident
foreign currency deposits and other short-term capital are associated with a potential risk of a
reversal of flows in a very short-term. Reversal in these flows can create a banking crisis and
lead to higher volatility in both exchange rate and interest rate. Quayyum and Khan (2003) and
Jan et al (2005) also recognize the monetary policy challenges emanating from interventions
and sterilisation policy due to high capital flows in Pakistan. Rashid (2009) finds a significant
causal relationship between foreign capital inflows and exchange rate volatility. Similarly,
finding a positive and significant effect of capital inflows on monetary expansion and inflation,
particularly during the periods of massive capital inflows from 2001 to 2007, Rashid and
7
Hussain (2010) emphasise the need to absorb the capital inflows in such a way they should
neither create an inflationary pressure in the economy nor fuel the exchange rate volatility.
Besides academic studies, monetary policy statements of the State Bank of Pakistan also do
take cognizance of implications of capital inflows on monetary and reserve money growth in
Pakistan. Ahmed (2009) finds that a sharp rise in FDI flows and remittance contributed to the
persistent overvaluation of the local currency. Similarly, Rehman et al (2010) conclude that
massive foreign direct investment inflows and workers ‘remittances have upward impact on
equilibrium real exchange rate of the Pakistan’s rupee. By using the data from 1980-2010,
Nazir et al (2012) find that external flows impact domestic inflation. In contrast to Yasmin
(2005) and Raza et al (2012) finding growth enhancing effects of foreign capital flows in
Pakistan, Ali (2014) argues that foreign capital inflows (including remittances) adversely
impacts growth in the long-run.
Being a low saving economy, foreign capital inflows assumes importance to bolster
domestic investment and hence the rate of growth. Among the few studies conducted for Sri
Lanka, Pushparajah (2009) argues that capital flows were not too large to induce any
destabilizing impact on the financial system stability and thus have not been a major challenge
for conduct of monetary management except during 1993-1994 and 2007 when there were
excessive capital flows. During these phases, the central bank responded mainly by sterilising
the impact of the inflows on monetary aggregates by raising statutory reserve ratios and open
market operations (Karunasena , 1996 and CBSL, 2007). However when external economic
conditions led to a draining of liquidity from the domestic foreign exchange market, central
bank supplied foreign exchange liquidity by intervening in forex market and reduced statutory
liquidity requirements (CBSL, 2008). However, according to Hemachandra (2012), the
restrictions on movements of foreign capital flows in Sri Lanka, particularly requirement of
prior approvals for debt capital and other capital transactions and requirement to maintain
foreign currency deposits subject to certain limits helped to minimise adverse impacts of
tightening global liquidity.
In case of Bangladesh, studies have mainly focused in examining the impact of capital
flows and remittances on growth, inflation and development (e.g., Chowdhury 2008, Roy,
2011, Kundu, 2012). However, Islam (2009) notes the implications of reserves build-up for
monetary policy. Analysing the period of global financial crisis, Mujeri and Shahiduzzaman
(2009) suggest that the financial sector was largely insulated as the spillovers through capital
flows (both portfolio and foreign direct investments) were minimal and remittances and higher
external aid flows provided a cushion to the external balance. As far as Nepal is concerned, it
was only in 1992 that FDI was allowed and repatriation to the foreign investor was permitted.
Aryal (2009) recognizes that capital flows lead to an increase in net foreign assets (NFA) which
being a part of monetary base has implications for money supply. Pant (2007) also cautioned
that policy makers in Nepal must purse liberalization of outflows and inflows in a balanced
manner so that the pressure on exchange rate and money supply could be minimized. Panday
(2012) views that remittances are vital for short-run macroeconomic stability, subsequently
supported by Budha (2015) finding that movements in NFA are largely due to the volatile large
remittance inflows, rather than capital flows. Commenting on recent rise in remittances, the
IMF in its Article IV Report on Nepal (2014) states that remittances have led to improvements

8
in living standards, but may be weakening external competitiveness. Other studies have largely
covered the issue of role of remittance in economic development of Nepal (e.g., Srivastava and
Pant 2006, Chaudhary, 2007, Shrestha 2008, Sharma and Gurung 2009, Thagunna and Acharya
2013).
Section III
Capital flows and remittances in SAARC countries: Stylised facts
Before analyzing the issue of capital flows and remittances in the context of SAARC
countries, it is important to have a broad idea on the extent of external openness in these
economies. Broadly speaking, major SAARC countries are now more liberalized and
globalized than two and half decades ago. Major SAARC economies have freed domestic
markets and institutions from controls, allowed foreign entry into the domestic markets for
financial assets; and loosened government regulation of the financial markets. Earlier these
were characterized by severe financial repression and financial markets had little freedom as
interest rates and exchange rates were administered and also neither the current nor the capital
account of the balance of payment was convertible (Goyal, 2012).
External openness, even though differs in terms of pace, extent, timing and sequencing
across major SAARC economies, they all have been prone to external developments as they
are much more open than in earlier decades. India, Pakistan and Bangladesh moved to full
current account convertibility almost around the same time during 1990s. As regards capital
account liberalization, India has adopted a gradual approach and similarly while currency
convertibility remained partial on the capital account for both Bangladesh and Pakistan, the
former retained more controls compared to latter. Bangladesh economy is virtually fully open
to non-resident for capital inflows and outflows in the equity and longer term debt markets, but
barred from investing in local short term money markets to avoid risks of volatility and
destabilization from surges of money inflows and outflows. Notwithstanding a gradual
approach towards capital account liberalization in major SAARC economies, they are still
considered as highly regulated economies by multilateral agencies. Based on IMF (2014),
Table 1 provides a synoptic view of exchange arrangements and regulatory frameworks for
current and capital transactions for SAARC countries.

9
De jure De Facto
Afghanistan Managed Floating Floating Reserve money target as nominal
anchor
Yes, currently no capital
market securities
transactions are allowed.
Bangladesh Floating Reclassified from other
managed to a stabilized
arrangement w.e.f February
2013
Monetary aggregate Yes, not fully convertible
Bhutan Conventional peg vis-à
vis Indian rupee
Conventional peg vis-à vis
Indian rupee
Exchange rate anchor vis-à-vis the
Indian rupee
Yes, all capital transactions
must be approved by the
Bhutanese Government and
RMA. No capital investment
other than FDI is allowed.
India Floating Floating Multiple Indicator Approach (1998
to February 2015)*
Yes, not fully convertible
Maldives Pegged exchange rate
within horizontal
bands (linked to
dollar).
Pegged exchange rate within
horizontal bands (linked to
dollar).
Exchange rate anchor vis-à-vis the
US dollar
Yes, not fully convertible
Nepal Conventional peg vis-à
vis Indian rupee
Conventional peg vis-à vis
Indian rupee
Exchange rate anchor vis-à-vis the
Indian rupee
Yes, not fully convertible
Pakistan Floating Other managed arrangement,
effective December 5, 2013
Multiple indicator approach. In
practice, inflation (forecast)
implicitly serves as a nominal anchor
but assessment of monetary
aggregates still serves as a useful
gauge of inflation pressure.
Yes, not fully convertible
Sri Lanka Free floating Reclassified to a stabilized from
a floating arrangement W.E.F.
Oct. 1, 2013
Monetary-targeting framework Yes, not fully convertible
Table 1: Policy Frameworks in SAARC Countries
* With agreement on Monetary Policy Framework in February 2015, flexible Inflation targeting was adopted.
Reserve Bank of India.
Source: Annual Report on Exchange Arra ngements and Exchange Restrictions 2014, IMF.
Exchange Rate ArrangementMonetary Policy FrameworkCountry
Controls on capital and
money market transactions
Since most of the SAARC economies have deficit on trade as well as current account,
remittances and external capital flows play an important role from the perspective of external
vulnerability. However, extent of dependence on foreign capital flows varies across economies.
Traditionally workers’ remittances and official flows have been the main source of inflows for
these economies, however with gradual opening-up of economies, capital inflows also
appeared in the forms of foreign currency deposits, and portfolio and direct investment in major
SAARC economies. For instance, reflecting the immigration of Pakistan labour to the Middle
East region during the oil price boom of the 1970s, remittances were a major source of external
flows but with subsequent relaxation of capital controls and the opening-up of financial sector,
external capital also flowed in the forms of private capital including foreign currency deposits,
and portfolio and direct investment. Similarly, the relative role of official flows has dwindled
in case of India and Sri Lanka.
The size of flows through both foreign capital and remittances has increased in all
SAARC countries, though the latter has grown faster than the former. Further, flows in form
of remittances have been more steady and durable than private capital flows which are often
influenced by diverse factors relating to global and domestic economy. Among SAARC

10
countries, the net private capital flows and remittances as a ratio to GDP is highest for Nepal
and lowest for Afghanistan (Chart 1). However, taking into account all sources of external
flows (i.e., net private capital flows, official flows and remittances) as ratio to GDP,
Afghanistan is the top recipient, followed by Nepal, Bhutan and Maldives while the ratio for
Bangladesh, India, Pakistan and Sri Lanka is in the range of 8 to 14 per cent (average 2009-13)
(Chart 2). It implies that in case of smaller SAARC economies, instead of private capital flows,
remittances and official flows account for a major portion of total external flows (Chart 3).
Nevertheless, in terms of absolute magnitude, India, Pakistan and Bangladesh figure among
the top recipients of external resources through capital flows and remittances (Chart 4).
Source: IMF and ADB
-5
0
5
10
15
20
25
30
35
1990 2000 2005 2008 2013
% o
f G
DP
Chart 1: Net Private Capital and
Remittance Flows to SAARC Countries
Afghanistan Bangladesh Bhutan
India Maldives Nepal
0
10
20
30
40
50
60
1990 2000 2005 2008 2013
% o
f G
DP
Chart 2: Aggregate Net Resource
Flows (incld. official flows) to SAARC
Countries
Afghanistan Bangladesh BhutanIndia Maldives NepalPakistan Sri Lanka
-5
0
5
10
15
20
25
30
35
40
45
Afg
han
ista
n
Ban
gla
des
h
Bhu
tan
Ind
ia
Mal
div
es
Nep
al
Pak
ista
n
Sri
Lan
ka
% o
f G
DP
Chart 3: Composition of Net External
Resources to SAARC Countries
(Average 2009-13)
Remittances Net Private Net Official
6.616.0
0.3
137.1
0.4 5.117.5
8.1
0
20
40
60
80
100
120
140
160
Afg
han
ista
n
Ban
gla
des
h
Bh
uta
n
India
Mal
div
es
Nep
al
Pak
ista
n
Sri
Lan
ka
US
$ B
illi
on
Chart 4: Size of Net External Resource
Flows to SAARC countries
(Average 2009-2013)

11
As far as the role of remittances and capital flows from the perspective of balance of
payments is concerned, it varies a lot across countries. As Chart 5 shows, flows through
remittances to Bangladesh are more than sufficient to finance merchandise trade deficit. In case
of Nepal, Pakistan, Sri Lanka, remittances can finance a significant part of merchandise trade
deficit. In contrast, the role of remittances in financing merchandise trade deficit is modest in
case of India and negligible in case of Afghanistan, Bhutan and Maldives. Similarly, volatility
of remittances (measured by coefficient of variation) is much smaller in low recipient countries
than bigger recipients which is above the world average (Chart 6).
Source: IFS, IMF and Remittances Database, World Bank
Likewise capital flows in major SAARC countries have remained volatile during the
period of study. Though these aspects are being examined in detail in the following sections,
the volatility in capital flows is evident from net accretion or depletions in official foreign
exchange reserves implying that net capital inflows exceeded current account deficit (CAD) in
some years and were insufficient to finance it in other years. In this context, not only a country’s
absorption capacity, which is also determined by the depth of the financial system, is critical
for mitigating the external shocks but is also important for enhancing growth effects of foreign
capital.1 Thus, unlike advanced economies, the lack of a developed financial markets limits the
policy room for central banks in sterilizing the effects of the excessive inflows which, in turn,
can raises the risk for Dutch Disease effects whereby the unsterilized inflows can lead to
currency appreciation and undermine external competitiveness. This could be true for most of
the SAARC economies. As measured by the coefficient of variation, the results in Table 2 show
that capital inflows to Afghanistan are more volatile, followed by Sri Lanka, Nepal, Pakistan,
Bangladesh, India, Bhutan and Maldives.
1 In general, the absorptive capacity generally implies the existence of various local conditions
conducive for economic growth.
6.8
137.5
3.9
42.8
0.2
96.5
69.4 72.8
0
20
40
60
80
100
120
140
160
Afg
han
ista
n
Ban
gla
des
h
Bh
uta
n
Ind
ia
Mal
div
es
Nep
al
Pak
ista
n
Sri
Lan
ka
Per
cent
Chart 5: Remittances as Ratio to
Trade Deficit (Average of 2009-14)
0
20
40
60
80
100
120
140
Mal
div
es
Afg
han
ista
n
Bh
uta
n
Sri
Lan
ka
Ind
ia
Pak
ista
n
Ban
gla
des
h
Nep
al
Per
cent
Chart 6: Volatility in Remittances in
SAARC countries during 1990-2014
(Coefficient of Variation)
World Average

12
Table 2: Flows Statistics. Quarterly Data 2002Q1 - 2014Q4
Countries Mean Maximum Minimum Coefficient of Variation
Inflows Outflows Remit Inflows Outflows Remit Inflows Outflows Remit Inflows Outflows Remit
Afg 25.2 36.0 27.1 357.9 173.2 68.3 -279.4 -107.9 2.76 520.35 201.93 60.2
Bhu 50.07 0.6 36.3 103.2 3.9 64.5 8.65 -1.7 21.3 65.75 194.80 36.1
Bang 596.9 160.3 2301.4 2644.9 1495.2 4127.0 -271.5 -438.0 764.4 106.56 172.11 48.3
India 15932.7 3814.0 11168.5 35961.4 16316.0 17992.3 -1565.9 -5223.1 3889.9 68.32 120.97 44.2
Mal 67.0 16.9 45.3 122.7 41.4 87.8 16.7 -8.1 12.6 48.02 103.58 55.9
Nepal 65.6 87.1 816.7 391.1 240.5 1717.5 -271.2 -16.8 189.2 157.00 67.98 60.5
Pak 980.3 84.6 3174.5 4627.0 887.0 5745.0 -924.0 -465.0 1405.0 121.79 357.24 38.3
SL 240.1 9.6 883.0 2131.0 390.0 1932.4 -987.6 -284.4 299.7 293.65 1702.73 55.9
Sample period for AF and Bhutan are 2008Q2 - 2014 and 2006Q1 - 2014Q4 respectively.

13
Section IV
Episodes of Surges, Sudden Stops, Flights and Retrenchments for Capital Flows in
SAARC countries
This section attempts to identify various phases of capital flow movements in SAARC
countries and classifies them into surges, stops, flights and retrenchment based on the
methodology originally suggested by Calvo (1998) and later modified and used by others
including Forbes and Warnock (2012). The concept of ‘Stops’ was originally used in the
context of net capital inflows, though with greater emphasis on changes in gross capital inflows
and outflows subsequently, various studies further extended the analysis to identify phases of
‘Surges’ (sharp increases in gross inflows), ‘Stops’ (i.e., sharp declines in gross inflows),
‘Flight’ (sharp increase in gross outflows) and ‘Retrenchment’ (i.e., sharp decreases in gross
outflows). Since this approach explains the changes in net capital flows by capturing the
behaviour of foreign and domestic investors separately, it is more relevant for countries which
are both recipient as well as source of capital flows from/for rest of the world. Even though
smaller SAARC countries are largely recipient of foreign capital flows, the concept of gross
inflows and gross outflows may be more relevant for identifying various phases for countries
like India and Pakistan.
According to the criteria suggested in literature (See Annex 1 on Methodology to
Measures Capital Flows Episodes), we construct episodes of gross inflows, gross outflows and
net inflows for SAARC countries (Annex 2.1, 2.2 and 3). As shown in Table 3, we identify
128 episodes of flows for all SAARC countries. In total SAARC economies have witnessed 25
episodes of stops and 23 episodes of surges in gross inflows and the average duration was 5.3
and 4.8 quarters respectively. Similarly, the average time for stops and surges of net inflows
is computed as 4.8 and 5.2 quarters, respectively.
Table 3: Summary Statistics for Episodes (2004 – 2014)
Inflows Outflows Net Inflows
Sto
ps
Du
rati
on
Su
rges
Du
rati
on
Fli
gh
t
Du
rati
on
Ret
ren
ch
Du
rati
on
Sto
ps
Du
rati
on
Su
rges
Du
rati
on
Overall 25 5.3 23 4.8 27 5.1 24 3.7 24 4.8 25 5.2
Afghanistan 2 3.5 3 3.0 2 5.5 2 4.0 2 3.5 2 3.5
Bangladesh 3 3.3 4 2.3 4 3.8 3 1.3 3 3.0 4 2.8
Bhutan 2 9.0 2 8.5 3 4.3 3 5.7 2 8.0 2 8.8
India 4 4.0 3 4.3 3 4.7 5 3.2 7 2.0 3 4.3
Maldives 2 11.0 4 3.3 3 9.0 2 6.5 2 11.0 3 4.0
Nepal 5 3.0 3 4.3 5 5.4 1 4.0 2 4.0 6 3.0
Pakistan 2 7.5 2 8.0 4 2.8 2 1.5 3 4.7 2 9.0
Sri Lanka 5 1.4 2 4.5 3 5.0 6 3.0 3 2.3 3 6.0
Note: Average duration is defined in terms of number of quarters.

14
As far as gross outflows are concerned, we identify 27 of flights and 24 episodes of
retrenchment with average length of 5.05 and 3.65 quarters, respectively. The size and
frequency of various phases does reflect the volatility in capital flows in the region. It appears
some SAARC economies (Pakistan, Bhutan and Maldives) face relatively more prolonged
phases of ‘stops’ and ‘surges’ than others.
The difference in frequency and duration of various phases of capital inflows and
outflows also gets confirmed from the finding that cyclical components of gross as well as net
capital inflows do not show co-movement with each other implying that cyclical behavior of
capital flows varies across SAARC countries. It means capital flows in SAARC countries are
largely affected by different dynamics rather than common shocks (Table 4 and Annex 4).2
Further, unlike the results in Forbes and Warnock (2012), we conclude two important lessons
in the context of SAARC countries. First, stop and surge episodes based on gross inflows and
net inflows report almost similar results at country level despite the fact that the former
incorporates behavior of foreign investors while the latter also includes changes in capital flows
by domestic investors; second, as corollary from the first, the role of both domestic and foreign
investors may reflect the significant impact of pull and push factors.
Section V
Capital Flows: The Impact of Pull and Push Factors
As a result of intense fluctuations in capital flows as evident from extreme episodes, an
attempt is made in this section to empirically investigate whether domestic (pull), foreign
(push) or both factors play role in determination of capital flows to SAARC countries. In order
to meet this objective, we use a large but not exhaustive list of explanatory variables available
in Ying and Kim (2001), Culha (2006) and Arias et al (2013). We analyse the impact of these
pull and push factors on gross capital inflows as percentage of GDP (GIGDP), gross capital
outflows as percentage of GDP (GOGDP) and net capital inflows as percentage of GDP
(NIGDP) in the context of SAARC countries.
2 To derive the cyclical component of gross capital inflows, gross capital outflows and net capital
inflows, the Hodrick-Prescott filter is used. Correlation matrix for gross capital outflows and net capital
flows are provided as Annex 4.
Table 4: Correlation Matrix of Cyclical Components of Gross Capital Inflows
(1995:Q1 to 2014:Q4)
LBDCY LINDCY LNPCY LPKCY LSLCY
LBDCY 1.00
LINDCY -0.01 1.00
LNPCY -0.14 -0.09 1.00
LPKCY 0.05 0.03 0.00 1.00
LSLCY 0.00 0.02 0.22* 0.05 1.00
*: A correlation coefficient of 0.185 or more is statistically significant at 5 per cent.
Note: LBD, LIND, LNP, LPK, LSL represent Bangladesh, India, Nepal, Pakistan and Sri Lanka for
which comparable quarterly data are available in IMF’s BOPS.

15
The strategy is of constructing estimable equation for each type of capital flows with
selection of explanatory factors3 in order of significant (see Annex 5 on methodology of Panel
Estimation). Using the Leamer (1985) sensitivity test, we have selected lag of the dependent
variable, appreciation expectations (NER), public debt as percentage of GDP (PDEBT),
reserves adequacy (RESAD), international stock price (FSP) and last but not the least is
international oil price (OP) as significant from the list of nine internal and four external
variables given in Annex 5 of this paper4. We also use redundant variable test for inclusion of
the relevant variables.
Tables 5, 6 and 7 report results of the estimated panel models using annual data, from
2002 to 2014, across different specifications. First column shows results from pooled Ordinary
Least Square (OLS), followed by Random Effects (RE) model and then Fixed Effects (FE) for
GIGDP, NIGDP and GOGDP. As shown in these Tables, all forms of capital flows show high
degree of inertia particularly capital outflows with significant coefficient of 0.63.
Table 5: Effects of Pull and Push Factors on Gross Capital Inflows. Results Across
Different Specifications. Annual Data 2002 – 2014. Dependent Variable: Gross
Capital Inflows as Percentage of GDP (GIGDP)
Variables Pooled OLS RE Model FE Model
GIGDP(-1) 0.44***
(0.000)
0.48***
(0.000)
0.47**
(0.003)
NER -0.08***
(0.000)
-0.05***
(0.001)
"-0.12**
(0.003)
PDEBT 0.09***
(0.000)
0.06***
(0.001)
0.05
(0.37)
RESAD -0.07*
(0.06)
-0.08**
(0.06)
FSP 0.05*
(0.04)
0.04**
(0.04)
0.05***
(0.000)
OP 0.08***
(0.000)
0.06***
(0.001)
0.08***
(0.000)
C 6.64
(0.17)
-0.79
(0.56)
2.45
(0.40)
R-squared 0.72 0.72 0.73
BP-LM Test 2.66
Hausman Test 0.00
Redundant FE test 0.44
Observations 72 72 72
No of Countries 6 6 6
Note: P-value in bracket. *Sig at 10%, **sig at 5% and ***sig at 1%
3 Leamer (1985) sensitivity test is applied for variable selection. In this analysis model with different
variables are tested and records changes in the sign and significance level of coefficient of the concerned
variable 4 Definitions of independent variables are available in Arias et al (2013).

16
Table 6: Effects of Pull and Push Factors on Gross Capital Outflows. Results Across
Different Specifications. Annual Data 2002 – 2014. Dependent Variable: Gross
Capital Outflows as Percentage of GDP (GOGDP)
Variables Pooled OLS RE Model FE Model
GIGDP(-1) 0.63***
(0.000)
0.67***
(0.000)
0.44
(0.000)
NER 0.02
(0.63)
-0.001
(0.81)
0.007
(0.62)
PDEBT -0.009
(0.19)
0.05
(0.37)
RESAD -0.008
(0.38)
-0.001
(0.81)
-0.02
(0.27)
FSP -0.007
(0.26)
0.005
(0.26)
-0.005
(0.35)
OP -0.002
(0.56)
-0.0006
(0.87)
-0.005
(0.42)
C 0.55
(0.22)
0.46
(0.26)
0.86
(0.31)
R-squared 0.65 0.64 0.71
BP-LM Test 0.006
Hausman Test 0.05
Redundant FE test 2.64**
Observations 72 72 72
No of Countries 6 6 6
Note: P-value in bracket. *Sig at 10%, **sig at 5% and ***sig at 1%
Table 7: Effects of Pull and Push Factors on Net Capital Inflows. Results Across
Different Specifications. Annual Data 2002 – 2014. Dependent Variable: Net Capital
Inflows as Percentage of GDP (NIGDP)
Variables Pooled OLS RE Model FE Model
GIGDP(-1) 0.51***
(0.000)
0.55***
(0.000)
0.51**
(0.003)
NER -0.08***
(0.001)
-0.06***
(0.003)
"-0.13**
(0.000)
PDEBT 0.09***
(0.000)
0.06***
(0.001)
0.04
(0.37)
RESAD -0.05*
(0.09)
-0.08*
(0.06)
FSP 0.05*
(0.02)
0.04**
(0.04)
0.06***
(0.001)
OP 0.07***
(0.000)
0.065***
(0.003)
0.08***
(0.001)
C -1.02
(0.49)
-1.50
(0.31)
2.78
(0.38)
R-squared 0.74 0.73 0.73
BP-LM Test 2.61
Hausman Test 0.00
Redundant FE test 0.94
Observations 72 72 72
No of Countries 6 6 6
Note: P-value in bracket. *Sig at 10%, **sig at 5% and ***sig at 1%

17
As far as pull factors are concerned, GDP growth, political stability, trade openness,
terms of trade, real exchange rate and domestic interest rate play no role in each of the three
cases. However, expectation of exchange rate appreciation (NER impacts both gross and net
capital inflows positively but does not impact outflows. The reason behind this may be
confidence, strength of economic fundamentals and high return when reverting back to the
foreign currency. Further, with expected appreciation of local currency, the cost of foreign
borrowing for domestic entities might be becoming lower and thus inducing more capital
inflows to the economy. We also conclude an interesting and unlikely result of Public Debt
(PDEBT). PDEBT has positive impact on capital inflows which may reflect the expected trust
from investors following the approval of loans from international financial institutions. In the
case of pull factors, reserves adequacy (RESAD) as percentage of GDP has negative effect on
capital inflows, belying our a priori expectation. However, the same results are concluded in
Fratzscher (2011) with explanation that countries of high reserve holdings with poorer quality
institutions suffer from larger capital outflows during crisis5 which seems to be valid for
SAARC countries where domestic institutions are still grappling with weaker institutions.
Regarding push variables, advanced economies’ GDP growth (AEGDPg) and foreign
interest rate (Libor) have insignificant impact on capital flows to and from SAARC countries.
However, foreign stock price (FSP) variable has positive effect and is in line with Arias et al
(2003) wherein co-integration and co-movements of financial markets is provided as possible
explanation. It suggests that even though SAARC economies are considered to be less
developed and not much integrated with foreign markets, capital flows are influenced by trend
in foreign markets. The last but not the least, our results show that international oil prices have
positive and significant impact on gross and net capital inflows across all specifications,
whereas, as expected, it has negative effects on gross capital outflows. Even though high oil
prices do not augur well for SAARC economies due to their high dependence on oil imports,
but these economies might be getting more capital flows as funds from oil exporting countries
are generally recycled to other EMEs as was the case during periods of oil shocks. Importantly,
some of SAARC economies are highly linked to oil producing gulf countries.
Similarly, remittances in the SAARC region are found to be pro-cyclical with respect
to income in the migrant's host country and trend in international oil prices. As data on total
remittances to SAARC region (REM), international crude oil prices (OP) and per capita income
level in major non-gulf host countries (AEPCY) for period 1975-2015 confirm the presence of
cointegration among variables6, we use vector error correction (VEC) method to estimate the
cointegrating equation. VECM estimates suggest that one per cent increase in international oil
prices leads to about 0.7 per cent increase in remittances in the region7 while the same level of
increase in per capita income in major non-gulf host countries increases remittance flows more
than proportionately (Table 8). The error correction term (ECT) is also statistically significant
describing the short-run dynamics or adjustments of the REM towards its equilibrium values.
5 The data show that Nepal and Bhutan have high reserve holdings as percentage of GDP. 6 The Augmented Dicky-Fuller test for unit root confirms all series to be I(1). 7 Broadly in line with other country-specific studies (e.g., Islam and Nasrin 2015, Naufal and Tremos
2009)

18
Importantly, these results need to be interpreted taking cognizance of the fact that in practice,
apart from these push variables, there could be other country-specific factors that might be
influencing remittances. However, due to dearth of comparable long-time series data, their
inclusion in the VECM estimation was not possible.
Table 8: Vector Error Correction Model Estimates for Remittances in SAARC Region
Variable ECT Cointegrating Equation R2
C LN(OP) LN(AEPCY)
Coeff.
(t-stat)
-0.24*
(-2.68)
1.45
0.69*
(6.11)
1.61*
(9.6)
0.30
Note: Two dummies for year 1986 and 2015 were also used as control variable.
*Statistically significant
Section VI
Flows and Financial Stability
As evident from data and extreme episodes of capital flows, volatility, not the
magnitude specifically in terms of GDP, may hamper macroeconomic and financial stability
through excessive oscillations in exchange rate and domestic credit in small economies like
SAARC countries. This section analyses the problem of financial stability beginning with brief
overview.
Financial Integration
An integrated financial market is one in which potential market participants face a
single set of rules, have equal access and are treated equally (Garcia-Herrero and Wooldridge
(2007). The authors’ approach to measuring financial integration is based on regulatory
measures, price-based measures and quantity based measures. Following this study, we
compute level of financial integration for SAARC countries based on available data in the
International Financial Statistics as provided by the IMF.
Using the Feldstein and Horioka (1980) test of relation between domestic investment
and saving, we regress gross fixed capital formation to GDP ratio over savings to GDP ratio
for our sample countries. According to this test, strong relation means low level of integration
and vice versa. The average coefficient for SAARC countries is 0.64 indicating a low degree
of financial integration as compared to 0.25 of Asian emerging economies concluded in
(Garcia-Herrero and Wooldridge (2007)8. Another measure of financial integration is the sum
of foreign assets and liabilities as percentage of GDP. As compared to other emerging and
advanced economies, the overall average value of 72 percent for SAARC countries also shows
a low level of financial integration with rest of the world.
8 The coefficient for Bangladesh, Bhutan, India, Nepal, Pakistan and Sri Lanka are 0.84, 0.54, 0.77,
0.32, 0.60 and 0.79 respectively.
19
Net Capital inflows, current account and international reserves
Besides financial integration, the use of net capital inflows depends over its two
counterparts (reserves and current account) in the balance of payments. Net capital flows are
either used for financing current account deficit or reserves accumulation. The data, over the
sample period from 2002 to 2014, show that most of the SAARC countries suffer from current
account deficits. Therefore, capital inflows in these countries are mostly used in financing
current account deficit.
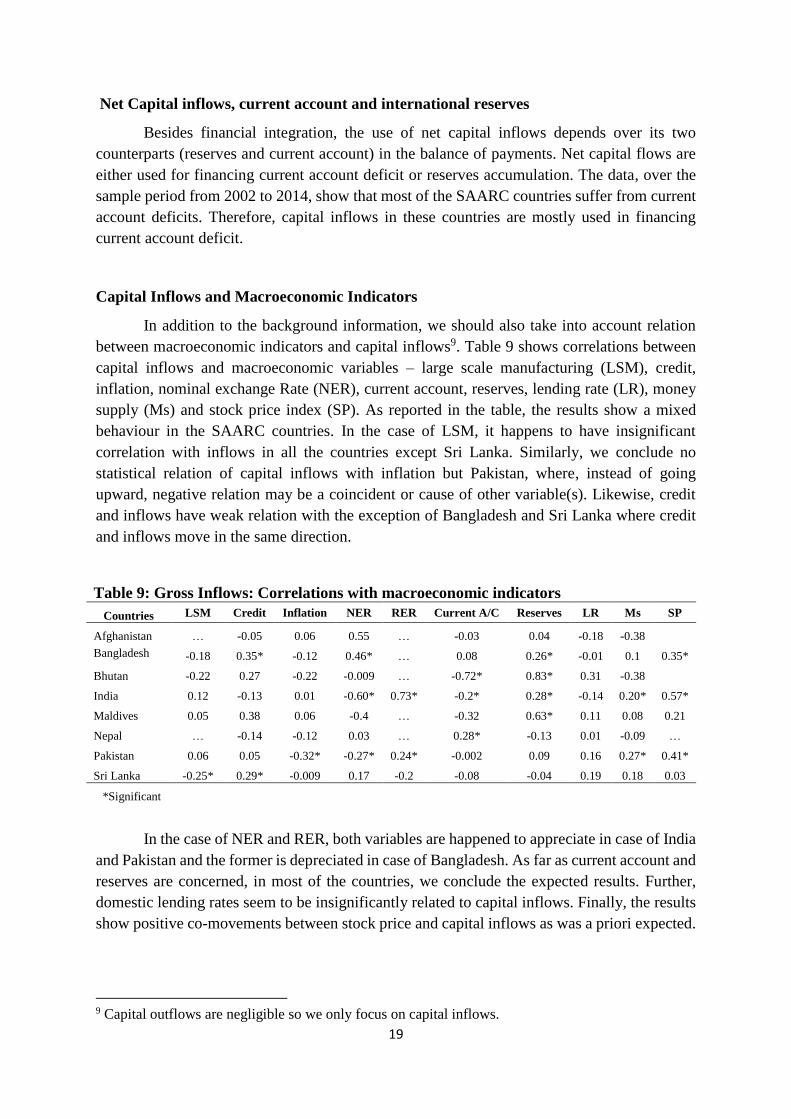
Capital Inflows and Macroeconomic Indicators
In addition to the background information, we should also take into account relation
between macroeconomic indicators and capital inflows9. Table 9 shows correlations between
capital inflows and macroeconomic variables – large scale manufacturing (LSM), credit,
inflation, nominal exchange Rate (NER), current account, reserves, lending rate (LR), money
supply (Ms) and stock price index (SP). As reported in the table, the results show a mixed
behaviour in the SAARC countries. In the case of LSM, it happens to have insignificant
correlation with inflows in all the countries except Sri Lanka. Similarly, we conclude no
statistical relation of capital inflows with inflation but Pakistan, where, instead of going
upward, negative relation may be a coincident or cause of other variable(s). Likewise, credit
and inflows have weak relation with the exception of Bangladesh and Sri Lanka where credit
and inflows move in the same direction.
Table 9: Gross Inflows: Correlations with macroeconomic indicators
Countries LSM Credit Inflation NER RER Current A/C Reserves LR Ms SP
Afghanistan … -0.05 0.06 0.55 … -0.03 0.04 -0.18 -0.38
Bangladesh -0.18 0.35* -0.12 0.46* … 0.08 0.26* -0.01 0.1 0.35*
Bhutan -0.22 0.27 -0.22 -0.009 … -0.72* 0.83* 0.31 -0.38
India 0.12 -0.13 0.01 -0.60* 0.73* -0.2* 0.28* -0.14 0.20* 0.57*
Maldives 0.05 0.38 0.06 -0.4 … -0.32 0.63* 0.11 0.08 0.21
Nepal … -0.14 -0.12 0.03 … 0.28* -0.13 0.01 -0.09 …
Pakistan 0.06 0.05 -0.32* -0.27* 0.24* -0.002 0.09 0.16 0.27* 0.41*
Sri Lanka -0.25* 0.29* -0.009 0.17 -0.2 -0.08 -0.04 0.19 0.18 0.03
*Significant
In the case of NER and RER, both variables are happened to appreciate in case of India
and Pakistan and the former is depreciated in case of Bangladesh. As far as current account and
reserves are concerned, in most of the countries, we conclude the expected results. Further,
domestic lending rates seem to be insignificantly related to capital inflows. Finally, the results
show positive co-movements between stock price and capital inflows as was a priori expected.
9 Capital outflows are negligible so we only focus on capital inflows.

20
Capital Flows and Financial Stability
In light of the preceding discussion, this section is devoted to highlight implications for
financial stability associated with capital flows and remittances in the SAARC countries. As
shown in the above graphs, capital flows to these economies are mainly concentrated to
remittances and official loans10. Although remittances are considered to be more permanent
and less prone to reversals, however, our panel results indicate highly significant impact of oil
price (OP) on remittances inflows. It means that decrease in international oil price may lead to
negative effect specifically on remittances11 as evident from the recent experience of drastic
slump in global oil prices12. In fact, in recent phase of falling oil prices, India and Sri Lanka
have seen lower remittances. Since remittances play a modest to significant role in financing
merchandise trade deficit in major SAARC economies, policy efforts, particularly towards
reduction in cost of remittances, are required to boost flows.
In addition to high dependence on remittances, SAARC countries have also low degree
of financial integration with rest of the world, as evident both from measures of financial
integration and insignificant impact of foreign interest rate and growth in advanced economies.
It implies that flows be diversified through gradual opening up of these economies and focusing
on shifting the composition of inflows towards FDI instead of dependence on vulnerable and
costlier external debt. The reason is that FDI is mainly driven by changes in economic
fundamentals rather than by arbitrage and speculative factors.
The results in Table 9 also report that capital inflows may induce exchange rate
appreciation in India and Pakistan damaging competitiveness of exports sectors and economic
growth. This may lead to real appreciation and so increase in current account deficit which
pave the way for inflows reversals or sudden stops. In the case of Bangladesh, inflows have
unexpected impact of nominal exchange rate depreciation. This may be reflecting excessively
loose monetary conditions and accumulation of foreign exchange reserves13 as mentioned in
Cardarelli et al (2009). To characterize exchange rate policy, we compute Resistance Index
(RI) for SAARC countries. RI is defined as change in percentage reserves scaled by its standard
deviation and divided by Exchange Market Pressure (EMP)14. This ratio of change in foreign
exchange reserves and EMP index measures the proportion of exchange market pressure that
is resisted through intervention. When the index is equal to 0 or negative, it means no resistance
and exchange rate is allowed to the market forces. On the other hand, when the value is equal
to or more than unity, it means maximum resistance is attempted.
The RI results covering sample period from 2002q1 to 2014q4 are divided into three
periods based on global financial crisis 2007-08: (a) pre-crisis period, (b) crisis period and (c)
post-crisis period. Generalizing the results for all SAARC countries, we conclude minimum
resistance (0.26) during the crisis period. The reason behind this may be either decreasing level
10 Except India and Maldives, all SAARC countries have more than 80 percent dependence on
remittances and official flows. 11 Oil price and remittances have significant correlation of 0.20. 12 It has an impact of decrease in oil payments as imported by SAARC countries. 13 FX reserves in Bangladesh increased from 2.58 billion dollars in 2002 to 17.56 billion dollars in
2014 14 See Cardarelli et al (2009).
21
of pressure on exchange rate appreciation due to stops in capital inflows or depleting level of
reserves. As far as pre and post crisis periods are concerned, it is difficult to generalize the
results because some of the countries such as Pakistan, Sri Lanka and Nepal where we observe
increase level of intervention during the post-crisis period as compared to the pre-crisis period
whereas in case of India and Bangladesh, our results show marginal decrease in exchange rate
intervention during the post-crisis period as compared to pre-crisis period.
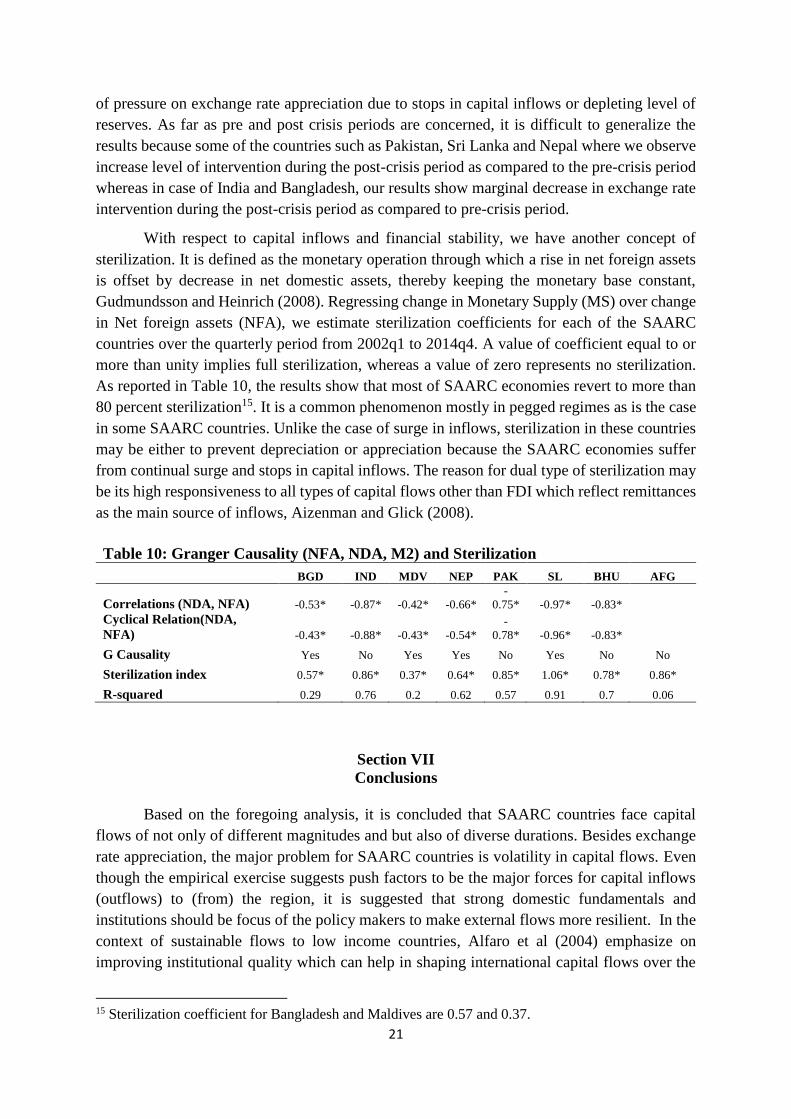
With respect to capital inflows and financial stability, we have another concept of
sterilization. It is defined as the monetary operation through which a rise in net foreign assets
is offset by decrease in net domestic assets, thereby keeping the monetary base constant,
Gudmundsson and Heinrich (2008). Regressing change in Monetary Supply (MS) over change
in Net foreign assets (NFA), we estimate sterilization coefficients for each of the SAARC
countries over the quarterly period from 2002q1 to 2014q4. A value of coefficient equal to or
more than unity implies full sterilization, whereas a value of zero represents no sterilization.
As reported in Table 10, the results show that most of SAARC economies revert to more than
80 percent sterilization15. It is a common phenomenon mostly in pegged regimes as is the case
in some SAARC countries. Unlike the case of surge in inflows, sterilization in these countries
may be either to prevent depreciation or appreciation because the SAARC economies suffer
from continual surge and stops in capital inflows. The reason for dual type of sterilization may
be its high responsiveness to all types of capital flows other than FDI which reflect remittances
as the main source of inflows, Aizenman and Glick (2008).
Section VII
Conclusions
Based on the foregoing analysis, it is concluded that SAARC countries face capital
flows of not only of different magnitudes and but also of diverse durations. Besides exchange
rate appreciation, the major problem for SAARC countries is volatility in capital flows. Even
though the empirical exercise suggests push factors to be the major forces for capital inflows
(outflows) to (from) the region, it is suggested that strong domestic fundamentals and
institutions should be focus of the policy makers to make external flows more resilient. In the
context of sustainable flows to low income countries, Alfaro et al (2004) emphasize on
improving institutional quality which can help in shaping international capital flows over the
15 Sterilization coefficient for Bangladesh and Maldives are 0.57 and 0.37.
Table 10: Granger Causality (NFA, NDA, M2) and Sterilization
BGD IND MDV NEP PAK SL BHU AFG
Correlations (NDA, NFA) -0.53* -0.87* -0.42* -0.66*
-
0.75* -0.97* -0.83*
Cyclical Relation(NDA,
NFA) -0.43* -0.88* -0.43* -0.54*
-
0.78* -0.96* -0.83*
G Causality Yes No Yes Yes No Yes No No
Sterilization index 0.57* 0.86* 0.37* 0.64* 0.85* 1.06* 0.78* 0.86*
R-squared 0.29 0.76 0.2 0.62 0.57 0.91 0.7 0.06

22
long-run. Some other studies (e.g. Becker and Noone, 2008) suggest substitutability of different
types of capital flows to reduce volatility.
Another interesting finding that capital flows, whether inflows or outflows, are
generally asynchronous with each other. This shows that capital flows in SAARC countries are
apparently prone less to common shocks and perhaps country-specific factors are more
important, though other empirical exercise on pull and push factors does not explicitly suggest
this. Since cyclical movements in capital flows occur at different points of time, SAARC
regions should strengthen the existing mechanism for regional coordination (e.g. swap
arrangements) so that countries facing severe stress in balance of payments due to volatility or
drying up of capital flows can be helped by others.
Since remittances play a more critical role in smaller SAARC countries than others,
they need to put in place appropriate policy to smoothen flows. In particular, the cost aspect
being emphasized at the global level needs to be studied in the context of SAARC region and
the scope for further intra-region coordination needs may be explored in this context.

23
Annex 1: Methodology to Measures Capital Flows Episodes
This section attempts to identify various phases of capital flow movements in SAARC
countries and classifies them into surges, stops, flights and retrenchment based on the
methodology originally suggested by Calvo (1998) and further developed in Calvo et al (2004
and 2008). Later the concept was modified and used in Cowan and Gregorio (2005), Reinhart
and Reinhart (2008), and Forbes and Warnock (2010 and 2012).
Calvo et al (2004) construct monthly net private capital inflows, 𝑃𝑡 , by subtracting monthly
changes in international reserves from the quarterly current account balance. Then 𝐶𝑡 is defined
to be 12-month moving sum of lagged values and compute annual year-on-year changes in 𝐶𝑡
as:
Ct = ∑ Pt t = 1, 2, 3, … . . N12𝑖=1 (1)
∆𝐶𝑡 = 𝐶𝑡 − 𝐶𝑡−12 𝑡 = 1, 2, 3, ……𝑁 (2)
The authors define the beginning of an episode at the month t when ∆𝐶𝑡 falls one standard
deviation below its rolling mean, providing that at some point within the episode ∆𝐶𝑡 falls at
least two standard deviations below its mean.
While using the same methodology, another series of papers as Rothenberg and warnock
(2010), and Forbes and Warnock (2012) examine sudden stops and surges in capital flows.
They use gross flows rather than relying on net flows proxies and cover waves of both inflows
and outflows in order to analyse behaviour of domestic and foreign investors. Following the
later methodology, we focus on episodes (surges, stops, flight and retrenchment) of gross flows
and net capital inflows. Surges and stops waves reflect the behaviour of foreigners and flight
and retrenchment are driven by domestic investors. We use quarterly data for SAARC countries
over the period from 2002Q1 to 2014Q4 as shown in the equations16:
Ct = ∑ Inflowst t = 1, 2, 3, … . . N4𝑖=1 (3)
∆𝐶𝑡 = 𝐶𝑡 − 𝐶𝑡−4 𝑤𝑖𝑡ℎ 𝑡 = 5, 6, ……𝑁 (4)
Now compute moving averages and standard deviations of Ct (Gross inflows or net inflows)
over the entire sample17. Surge episode starts at quarter t when ∆𝐶𝑡 increases more than one
standard deviation the moving average and ends when ∆𝐶𝑡 falls below one standard deviation
above the moving average, providing that at some point within episode ∆𝐶𝑡 crosses two
standard deviations above the moving average. Stop episode is defined to be starting at t when
∆𝐶𝑡 falls one standard deviation below the moving average, given that within episode ∆𝐶𝑡 falls
below two standard deviation of the moving average. Waves of flight and retrenchment are
identified respectively as sudden stops and surges by using gross capital outflows instead of
capital inflows.
16 Sample period for Bhutan and Afghanistan respectively start from 2006 and 2008. 17 Forbes and Warnock (2012) use rolling means of the last 5 years.

24
Our main source of data (capital inflows and outflows in million US dollar) is International
Financial Statistics (IFS) of International Monetary Fund (IMF) accessed through Haver
Analytics. We define gross capital inflows as the sum of foreign direct investment, portfolio
investment and others investments in the country and gross capital outflows as sum of foreign
direct investment, portfolio investment and others investments abroad. Net capital inflows is
defined as gross capital inflows minus gross capital outflows. The results for all SAARC
countries are shown in Annex 2.1 and 2.2.
Annex 2.1: Stops, Surges, Flight and Retrenchment Episodes by country (2004-2014)
Country
Inflows Outflows
Stops Surges Flight Retrenchment
Start
Date
End
Date
Start
Date
End
Date
Start
Date
End
Date
Start
Date
End
Date
Banglades
h
2005q4 2006q2 2007q1 2007q2 2006q3 2008q1 2005q4 2006q1
2009q2 2010q1 2008q2 2009q1 2009q2 2009q4 2008q2 2008q4
2011q1 2012q2 2010q1 2010q3 2012q3 2013q3 2013q3 2013q4
2012q4 2013q3 2014q2
India
2006q3 2006q4 2005q1 2005q4 2007q4 2008q3 2004q3 2005q1
2008q3 2009q4 2006q4 2008q2 2009q4 2010q2 2005q4 2007q1
2011q3 2012q4 2010q1 2011q1 2011q4 2014q1 2007q2 2007q3
2013q4 2008q4 2009q3
2010q3 2011q4
Maldives
2008q1 2011q3 2004q3 2005q4 2004q3 2006q2 2006q3 2008q3
2011q4 2013q4 2006q4 2007q1 2008q3 2012q4 2012q4 2014q1
2007q3 2008q1 2014q2
2013q4
Nepal
2004q3 2005q1 2005q4 2007q2 2004q3 2006q2 2008q3 2009q3
2007q2 2008q2 2008q3 2009q4 2007q1 2008q2
2011q4 2012q2 2010q4 2011q2 2009q4 2010q4
2012q3 2013q3 2011q1 2012q3
2014q2 2013q3
Pakistan
2008q1 2009q3 2004q4 2007q4 2005q4 2006q4 2010q2 2010q3
2010q3 2013q1 2014q1 2009q4 2010q1 2011q2 2011q4
2012q2 2012q3
2014q4
Sri Lanka
2004q3 2004q4 2006q1 2006q3 2005q3 2007q3 2004q3 2005q1
2008q1 2008q3 2012q1 2013q4 2010q1 2011q1 2007q3 2008q3
2010q3 2010q4 2013q2 2014q1 2009q1 2010q1
2011q1 2011q2 2011q2 2012q3
2014q1 2014q3 2012q1 2013q2
2014q4
Afghanista
n
Sample Period (2008q2-2014q4)
2010q3 2011q4 2008q4 2009q2 2010q2 2011q4 2008q4 2009q4
2013q1 2013q3 2012q1 2012q4 2013q4 2012q1 2013q1
2013q3 2014q3
Bhutan
Sample Period (2006q1-2014q4)
2007q3 2009q3 2006q1 2007q3 2008q3 2010q3 2007q1 2008q2
2012q3 2009q3 2012q2 2011q4 2012q2 2010q3 2011q3
2014q2 2012q2 2014q2
25
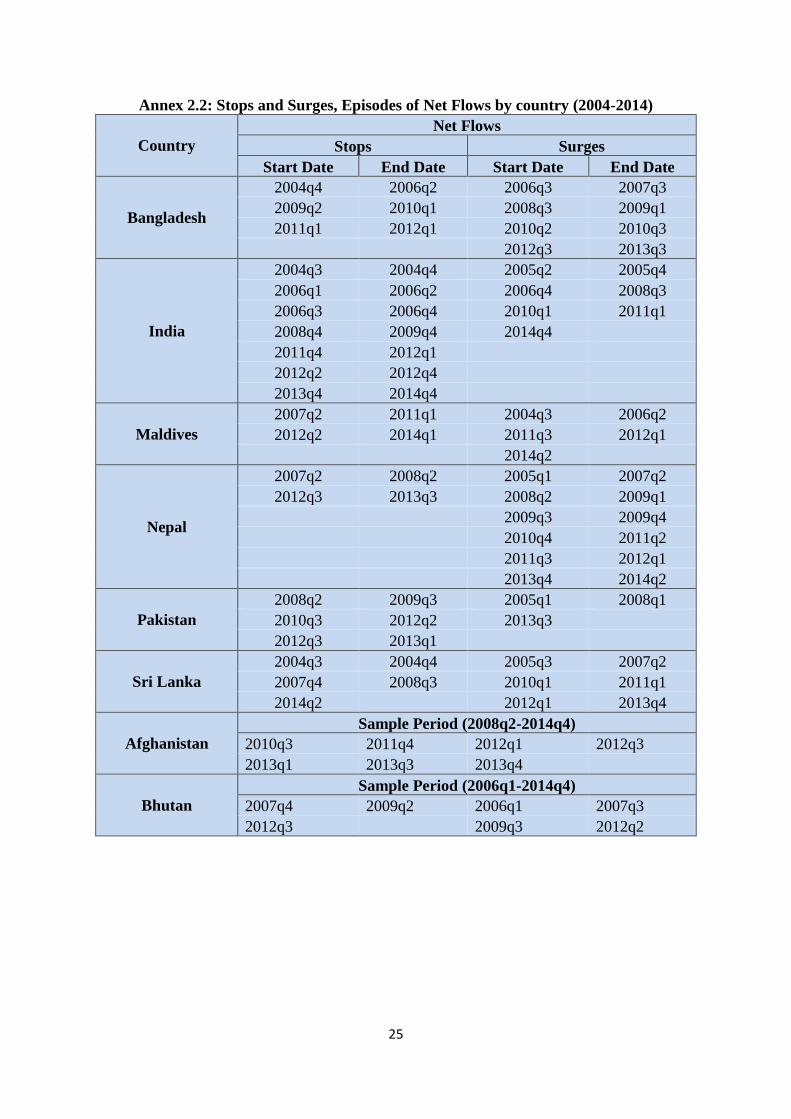
Annex 2.2: Stops and Surges, Episodes of Net Flows by country (2004-2014)
Country
Net Flows
Stops Surges
Start Date End Date Start Date End Date
Bangladesh
2004q4 2006q2 2006q3 2007q3
2009q2 2010q1 2008q3 2009q1
2011q1 2012q1 2010q2 2010q3
2012q3 2013q3
India
2004q3 2004q4 2005q2 2005q4
2006q1 2006q2 2006q4 2008q3
2006q3 2006q4 2010q1 2011q1
2008q4 2009q4 2014q4
2011q4 2012q1
2012q2 2012q4
2013q4 2014q4
Maldives
2007q2 2011q1 2004q3 2006q2
2012q2 2014q1 2011q3 2012q1
2014q2
Nepal
2007q2 2008q2 2005q1 2007q2
2012q3 2013q3 2008q2 2009q1
2009q3 2009q4
2010q4 2011q2
2011q3 2012q1
2013q4 2014q2
Pakistan
2008q2 2009q3 2005q1 2008q1
2010q3 2012q2 2013q3
2012q3 2013q1
Sri Lanka
2004q3 2004q4 2005q3 2007q2
2007q4 2008q3 2010q1 2011q1
2014q2 2012q1 2013q4
Afghanistan
Sample Period (2008q2-2014q4)
2010q3 2011q4 2012q1 2012q3
2013q1 2013q3 2013q4
Bhutan
Sample Period (2006q1-2014q4)
2007q4 2009q2 2006q1 2007q3
2012q3 2009q3 2012q2

26
Annex 3: Graphical Presentation of Phases of Capital Flows in SAARC Countries
Afghanistan: Episodes of Surges and Stops
-1
-0.8
-0.6
-0.4
-0.2
0
0.2
0.4
0.6
0.8
Q2-2
00
8
Q4-2
00
8
Q2-2
00
9
Q4-2
00
9
Q2-2
01
0
Q4-2
01
0
Q2-2
01
1
Q4-2
01
1
Q2-2
01
2
Q4-2
01
2
Q2-2
01
3
Q4-2
01
3
Q2-2
01
4
Q4-2
01
4
Chan
ge
(US
$ b
ill.
)
Gross Capital Inflows: Surges
Change in Gross InflowsRolling Average (RA: 4 Qtrs)RA+1SDRA+2SD
-1.0
-0.8
-0.6
-0.4
-0.2
0.0
0.2
0.4
0.6
0.8
Q2
-20
08
Q4
-20
08
Q2
-20
09
Q4
-20
09
Q2
-20
10
Q4
-20
10
Q2
-20
11
Q4
-20
11
Q2
-20
12
Q4
-20
12
Q2
-20
13
Q4
-20
13
Q2
-20
14
Q4
-20
14
Chan
ge
(US
$ b
ill.
)
Gross Capital Inflows: Stops
Change in Gross Inflows
Rolling Average (RA: 4 Qtrs)
RA-1SD
RA-2SD
-0.8
-0.6
-0.4
-0.2
0.0
0.2
0.4
0.6
0.8
Q2
-20
08
Q4
-20
08
Q2
-20
09
Q4
-20
09
Q2
-20
10
Q4
-20
10
Q2
-20
11
Q4
-20
11
Q2
-20
12
Q4
-20
12
Q2
-20
13
Q4
-20
13
Q2
-20
14
Q4
-20
14
Chan
ge
(US
$ b
ill.
)
Net Capital Inflows: Surges
Change in Net Inflows
Rolling Average (RA: 4 Qtrs)
RA+1SD
RA+2SD
-0.8
-0.6
-0.4
-0.2
0.0
0.2
0.4
0.6
Q2
-20
08
Q4
-20
08
Q2
-20
09
Q4
-20
09
Q2
-20
10
Q4
-20
10
Q2
-20
11
Q4
-20
11
Q2
-20
12
Q4
-20
12
Q2
-20
13
Q4
-20
13
Q2
-20
14
Q4
-20
14
Chan
ge
(US
$ b
ill.
)
Net Capital Inflows: Stops
Change in Net Inflows
Rolling Average (RA: 4 Qtrs)
RA-1SD
RA-2SD

27
Bangladesh: Episodes of Surges and Stops
-4.0
-3.0
-2.0
-1.0
0.0
1.0
2.0
3.0
4.0
5.0
Q4
-20
04
Q3
-20
05
Q2
-20
06
Q1
-20
07
Q4
-20
07
Q3
-20
08
Q2
-20
09
Q1
-20
10
Q4
-20
10
Q3
-20
11
Q2
-20
12
Q1
-20
13
Q4
-20
13
Q3
-20
14
Chan
ge
(US
$ B
ill.
)
Gross Capital Inflows: Surges
Change in Gross Inflows
Rolling Average (RA: 4 Qtrs)
RA+1SD
RA+2SD
-4.0
-3.0
-2.0
-1.0
0.0
1.0
2.0
3.0
4.0
Q3
-20
04
Q2
-20
05
Q1
-20
06
Q4
-20
06
Q3
-20
07
Q2
-20
08
Q1
-20
09
Q4
-20
09
Q3
-20
10
Q2
-20
11
Q1
-20
12
Q4
-20
12
Q3
-20
13
Q2
-20
14
Chan
ge
(US
$ B
ill.
)
Gross Capital Inflows: Stops
Change in Gross Inflows
Rolling Average (RA: 4 Qtrs)
RA-1SD
RA-2SD
-4.0
-3.0
-2.0
-1.0
0.0
1.0
2.0
3.0
4.0
5.0
Q4
-20
04
Q3
-20
05
Q2
-20
06
Q1
-20
07
Q4
-20
07
Q3
-20
08
Q2
-20
09
Q1
-20
10
Q4
-20
10
Q3
-20
11
Q2
-20
12
Q1
-20
13
Q4
-20
13
Q3
-20
14
Chan
ge
(US
$ B
ill.
)
Net Capital Inflows: Surges
Change in Net Inflows
Rolling Average (RA: 4 Qtrs)
RA+1SD
RA+2SD
-4.0
-3.0
-2.0
-1.0
0.0
1.0
2.0
3.0
4.0
Q4
-20
04
Q3
-20
05
Q2
-20
06
Q1
-20
07
Q4
-20
07
Q3
-20
08
Q2
-20
09
Q1
-20
10
Q4
-20
10
Q3
-20
11
Q2
-20
12
Q1
-20
13
Q4
-20
13
Q3
-20
14C
han
ge
(US
$ B
ill.
)
Net Capital Inflows: Stops
Change in Net Inflows
Rolling Average (RA: 4 Qtrs)
RA-1SD
RA-2SD

28
Bhutan: Episodes of Surges and Stops
-0.2
-0.1
0
0.1
0.2
0.3
Q1-2
00
6
Q3-2
00
6
Q1-2
00
7
Q3-2
00
7
Q1-2
00
8
Q3-2
00
8
Q1-2
00
9
Q3-2
00
9
Q1-2
01
0
Q3-2
01
0
Q1-2
01
1
Q3-2
01
1
Q1-2
01
2
Q3-2
01
2
Q1-2
01
3
Q3-2
01
3
Q1-2
01
4
Q3-2
01
4
Chan
ge
(US
$ b
ill.
)
Gross Capital Inflows: Surges
Change in Gross InflowsRolling Average (RA: 4 Qtrs)RA+1SDRA+2SD
-0.2
-0.1
0.0
0.1
0.2
0.3
Q1-2
00
6
Q3-2
00
6
Q1-2
00
7
Q3-2
00
7
Q1-2
00
8
Q3-2
00
8
Q1-2
00
9
Q3-2
00
9
Q1-2
01
0
Q3-2
01
0
Q1-2
01
1
Q3-2
01
1
Q1-2
01
2
Q3-2
01
2
Q1-2
01
3
Q3-2
01
3
Q1-2
01
4
Q3-2
01
4
Chan
ge
(US
$ b
ill.
)
Gross Capital Inflows: Stops
Change in Gross Inflows
Rolling Average (RA: 4 Qtrs)
RA-1SD
RA-2SD
-0.2
-0.1
-0.1
0.0
0.1
0.1
0.2
0.2
0.3
Q1-2
00
6
Q3-2
00
6
Q1-2
00
7
Q3-2
00
7
Q1-2
00
8
Q3-2
00
8
Q1-2
00
9
Q3-2
00
9
Q1-2
01
0
Q3-2
01
0
Q1-2
01
1
Q3-2
01
1
Q1-2
01
2
Q3-2
01
2
Q1-2
01
3
Q3-2
01
3
Q1-2
01
4
Q3-2
01
4
Chan
ge
(US
$ b
ill.
)
Net Capital Inflows: Surges
Change in Net InflowsRolling Average (RA: 4 Qtrs)RA-1SDRA-2SD
-0.2
-0.1
-0.1
0.0
0.1
0.1
0.2
0.2
0.3
Q1-2
00
6
Q3-2
00
6
Q1-2
00
7
Q3-2
00
7
Q1-2
00
8
Q3-2
00
8
Q1-2
00
9
Q3-2
00
9
Q1-2
01
0
Q3-2
01
0
Q1-2
01
1
Q3-2
01
1
Q1-2
01
2
Q3-2
01
2
Q1-2
01
3
Q3-2
01
3
Q1-2
01
4
Q3-2
01
4
Chan
ge
(US
$ b
ill.
)
Net Capital Inflows: Stops
Change in Net InflowsRolling Average (RA: 4 Qtrs)RA-1SDRA-2SD

29
India: Episodes of Surges and Stops
*based on 2004-05 base year series.
Net Capital Inflows in India
-100
-80
-60
-40
-20
0
20
40
60
80
Q3-2
004
Q1-2
005
Q3-2
005
Q1-2
006
Q3-2
006
Q1-2
007
Q3-2
007
Q1-2
008
Q3-2
008
Q1-2
009
Q3-2
009
Q1-2
010
Q3-2
010
Q1-2
011
Q3-2
011
Q1-2
012
Q3-2
012
Q1-2
013
Q3-2
013
Q1-2
014
Q3-2
014
Ch
ange
(US
$ b
illi
on
)
Gross Capital Inflows: Surges
Change in Gross InflowsRolling Average (RA: 4 Qtrs)RA+1SDRA+2SD
-100
-80
-60
-40
-20
0
20
40
60
80
Q3-2
004
Q1-2
005
Q3-2
005
Q1-2
006
Q3-2
006
Q1-2
007
Q3-2
007
Q1-2
008
Q3-2
008
Q1-2
009
Q3-2
009
Q1-2
010
Q3-2
010
Q1-2
011
Q3-2
011
Q1-2
012
Q3-2
012
Q1-2
013
Q3-2
013
Q1-2
014
Q3-2
014
Ch
ange
(US
$ b
illi
on
)
Gross Capital Inflows: Stops
Change in Gross InflowsRolling Average (RA: 4 Qtrs)RA-1SDRA-2SD
-120
-100
-80
-60
-40
-20
0
20
40
60
80
Q3-2
00
4Q
1-2
00
5Q
3-2
00
5Q
1-2
00
6Q
3-2
00
6Q
1-2
00
7Q
3-2
00
7Q
1-2
00
8Q
3-2
00
8Q
1-2
00
9Q
3-2
00
9Q
1-2
01
0Q
3-2
01
0Q
1-2
01
1Q
3-2
01
1Q
1-2
01
2Q
3-2
01
2Q
1-2
01
3Q
3-2
01
3Q
1-2
01
4Q
3-2
01
4
Chan
ge
(US
$ b
illi
on)
Net Capital Inflows: Surges
Change in Net Inflows
Rolling Average (RA: 4 Qtrs)
RA+1SD
RA+2SD
-120
-100
-80
-60
-40
-20
0
20
40
60
80
Q3-2
004
Q1-2
005
Q3-2
005
Q1-2
006
Q3-2
006
Q1-2
007
Q3-2
007
Q1-2
008
Q3-2
008
Q1-2
009
Q3-2
009
Q1-2
010
Q3-2
010
Q1-2
011
Q3-2
011
Q1-2
012
Q3-2
012
Q1-2
013
Q3-2
013
Q1-2
014
Q3-2
014
Chan
ge
(US
$ b
illi
on)
Net Capital Inflows: Stops
Change in Net InflowsRolling Average (RA: 4 Qtrs)RA-1SDRA-2SD

30
Maldives: Episodes of Surges and Stops
-0.3
-0.2
-0.1
0.0
0.1
0.2
0.3Q
3-2
004
Q2
-20
05
Q1
-20
06
Q4
-20
06
Q3
-20
07
Q2
-20
08
Q1
-20
09
Q4
-20
09
Q3
-20
10
Q2
-20
11
Q1
-20
12
Q4
-20
12
Q3
-20
13
Q2
-20
14
Ch
ange
(US
$ B
ill.
)
Gross Capital Inflows (Surges)
Change in Gross InflowsRolling Average (RA: 4 Qtrs)RA+1SDRA+2SD
-0.3
-0.2
-0.1
0.0
0.1
0.2
0.3
Q3
-20
04
Q2
-20
05
Q1
-20
06
Q4
-20
06
Q3
-20
07
Q2
-20
08
Q1
-20
09
Q4
-20
09
Q3
-20
10
Q2
-20
11
Q1
-20
12
Q4
-20
12
Q3
-20
13
Q2
-20
14
Ch
ange
(US
$ B
ill.
)
Gross Capital Inflows (Stops)
Change in Gross InflowsRolling Average (RA: 4 Qtrs)RA-1SDRA-2SD
-0.4
-0.2
0.0
0.2
0.4
0.6
Q3
-20
04
Q2
-20
05
Q1
-20
06
Q4
-20
06
Q3
-20
07
Q2
-20
08
Q1
-20
09
Q4
-20
09
Q3
-20
10
Q2
-20
11
Q1
-20
12
Q4
-20
12
Q3
-20
13
Q2
-20
14
Ch
ange
(US
$ B
ill.
)
Net Capital Inflows (Surges)
Change in Gross InflowsRolling Average (RA: 4 Qtrs)RA+1SDRA+2SD
-0.4
-0.2
0.0
0.2
0.4
0.6Q
3-2
004
Q2
-20
05
Q1
-20
06
Q4
-20
06
Q3
-20
07
Q2
-20
08
Q1
-20
09
Q4
-20
09
Q3
-20
10
Q2
-20
11
Q1
-20
12
Q4
-20
12
Q3
-20
13
Q2
-20
14
Ch
ange
(US
$ B
ill.
)
Net Capital Inflows (Stops)
Change in Gross InflowsRolling Average (RA: 4 Qtrs)RA-1SDRA-2SD
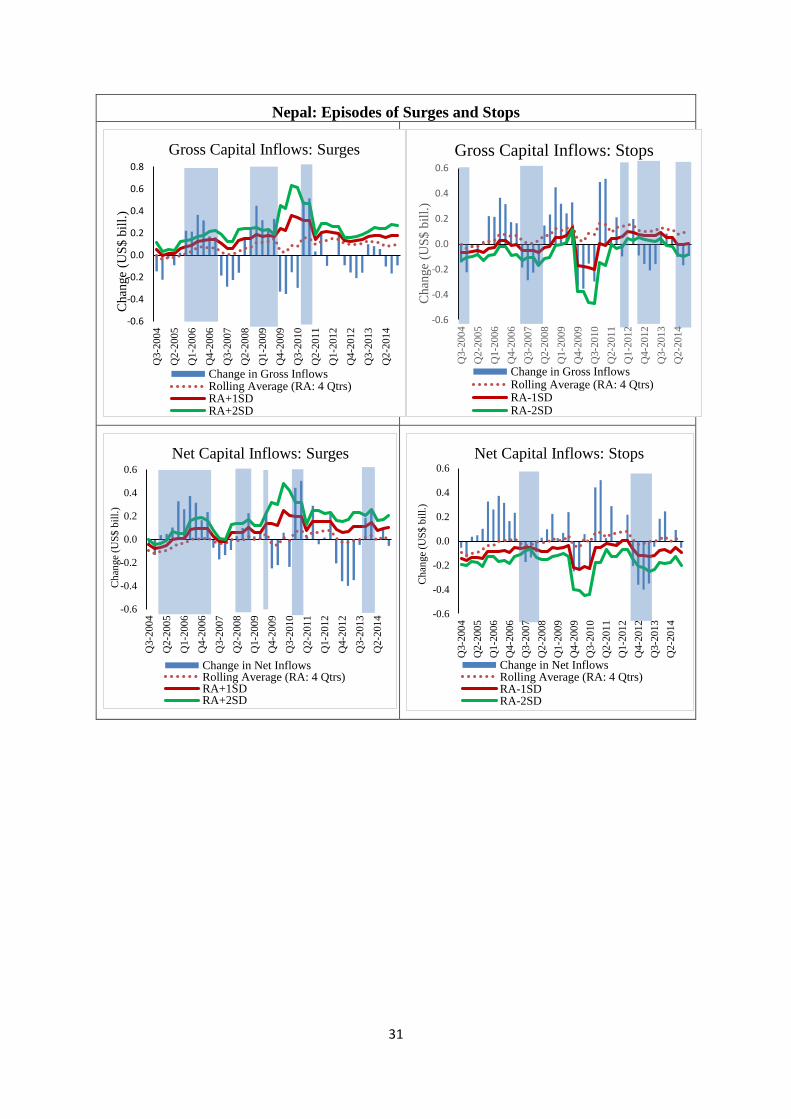
31
Nepal: Episodes of Surges and Stops
-0.6
-0.4
-0.2
0.0
0.2
0.4
0.6
0.8Q
3-2
00
4
Q2-2
00
5
Q1-2
00
6
Q4-2
00
6
Q3-2
00
7
Q2-2
00
8
Q1-2
00
9
Q4-2
00
9
Q3-2
01
0
Q2-2
01
1
Q1-2
01
2
Q4-2
01
2
Q3-2
01
3
Q2-2
01
4
Chan
ge
(US
$ b
ill.
)
Gross Capital Inflows: Surges
Change in Gross InflowsRolling Average (RA: 4 Qtrs)RA+1SDRA+2SD
-0.6
-0.4
-0.2
0.0
0.2
0.4
0.6
Q3-2
00
4
Q2-2
00
5
Q1-2
00
6
Q4-2
00
6
Q3-2
00
7
Q2-2
00
8
Q1-2
00
9
Q4-2
00
9
Q3-2
01
0
Q2-2
01
1
Q1-2
01
2
Q4-2
01
2
Q3-2
01
3
Q2-2
01
4
Chan
ge
(US
$ b
ill.
)
Gross Capital Inflows: Stops
Change in Gross InflowsRolling Average (RA: 4 Qtrs)RA-1SDRA-2SD
-0.6
-0.4
-0.2
0.0
0.2
0.4
0.6
Q3-2
00
4
Q2-2
00
5
Q1-2
00
6
Q4-2
00
6
Q3-2
00
7
Q2-2
00
8
Q1-2
00
9
Q4-2
00
9
Q3-2
01
0
Q2-2
01
1
Q1-2
01
2
Q4-2
01
2
Q3-2
01
3
Q2-2
01
4
Ch
ange
(US
$ b
ill.
)
Net Capital Inflows: Surges
Change in Net InflowsRolling Average (RA: 4 Qtrs)RA+1SDRA+2SD
-0.6
-0.4
-0.2
0.0
0.2
0.4
0.6Q
3-2
00
4
Q2-2
00
5
Q1-2
00
6
Q4-2
00
6
Q3-2
00
7
Q2-2
00
8
Q1-2
00
9
Q4-2
00
9
Q3-2
01
0
Q2-2
01
1
Q1-2
01
2
Q4-2
01
2
Q3-2
01
3
Q2-2
01
4
Ch
ange
(US
$ b
ill.
)
Net Capital Inflows: Stops
Change in Net InflowsRolling Average (RA: 4 Qtrs)RA-1SDRA-2SD

32
Pakistan: Episodes of Surges and Stops
-6.0
-4.0
-2.0
0.0
2.0
4.0
6.0
8.0
Q3
-20
04
Q2
-20
05
Q1
-20
06
Q4
-20
06
Q3
-20
07
Q2
-20
08
Q1
-20
09
Q4
-20
09
Q3
-20
10
Q2
-20
11
Q1
-20
12
Q4
-20
12
Q3
-20
13
Q2
-20
14
Chan
ge
(US
$ B
ill.
)
Gross Capital Inflows: Surges
Change in Gross InflowsRolling Average (RA: 4 Qtrs)RA+1SDRA+2SD
-6.0
-4.0
-2.0
0.0
2.0
4.0
6.0
8.0
Q3
-20
04
Q2
-20
05
Q1
-20
06
Q4
-20
06
Q3
-20
07
Q2
-20
08
Q1
-20
09
Q4
-20
09
Q3
-20
10
Q2
-20
11
Q1
-20
12
Q4
-20
12
Q3
-20
13
Q2
-20
14
Chan
ge
(US
$ B
ill.
)
Gross Capital Inflows: Stops
Change in Gross Inflows
Rolling Average (RA: 4 Qtrs)
RA-1SD
RA-2SD
-6.0
-4.0
-2.0
0.0
2.0
4.0
6.0
8.0
Q3
-20
04
Q2
-20
05
Q1
-20
06
Q4
-20
06
Q3
-20
07
Q2
-20
08
Q1
-20
09
Q4
-20
09
Q3
-20
10
Q2
-20
11
Q1
-20
12
Q4
-20
12
Q3
-20
13
Q2
-20
14
Chan
ge
(US
$ B
ill)
.
Net Capital Flows: Surges
Change in Net Inflows
Rolling Average (RA: 4 Qtrs)
RA+1SD
RA+2SD
-6.0
-4.0
-2.0
0.0
2.0
4.0
6.0
8.0
Q3
-20
04
Q2
-20
05
Q1
-20
06
Q4
-20
06
Q3
-20
07
Q2
-20
08
Q1
-20
09
Q4
-20
09
Q3
-20
10
Q2
-20
11
Q1
-20
12
Q4
-20
12
Q3
-20
13
Q2
-20
14
(Chan
ge
(US
$ B
ill.
)
Net Capital Flows: Stops
Change in Net Inflows
Rolling Average (RA: 4 Qtrs)
RA-1SD
RA-2SD
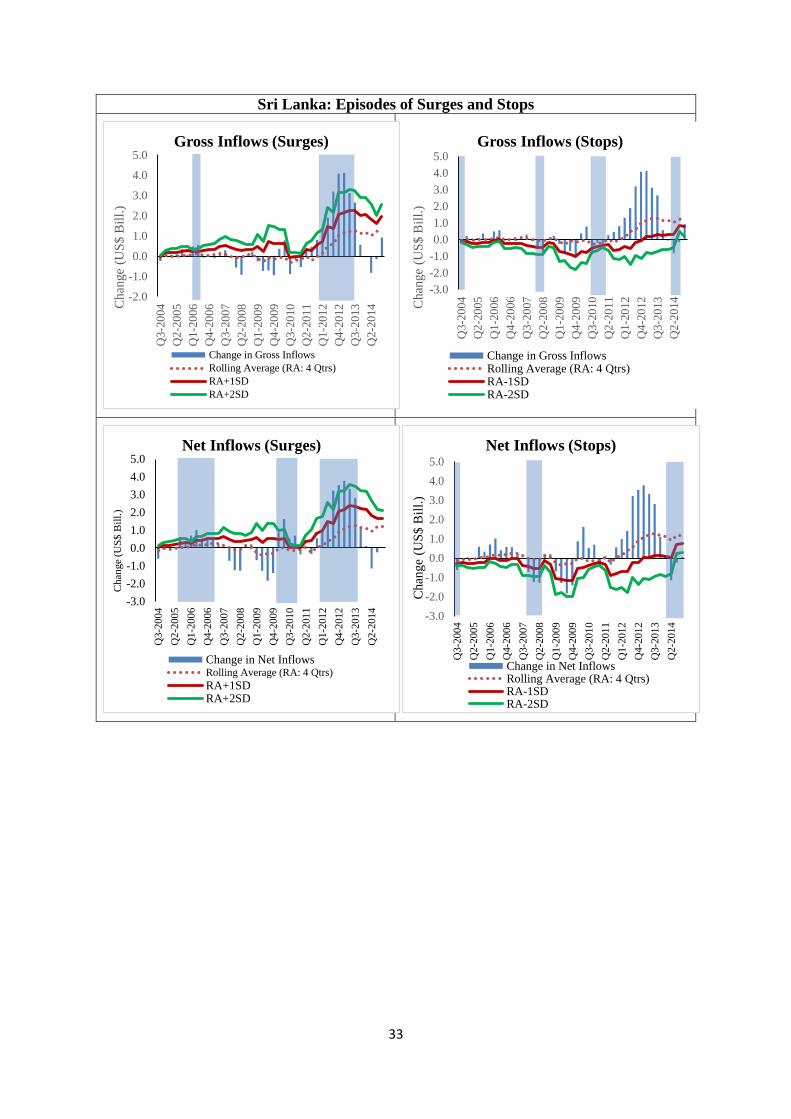
33
Sri Lanka: Episodes of Surges and Stops
-2.0
-1.0
0.0
1.0
2.0
3.0
4.0
5.0Q
3-2
004
Q2
-20
05
Q1
-20
06
Q4
-20
06
Q3
-20
07
Q2
-20
08
Q1
-20
09
Q4
-20
09
Q3
-20
10
Q2
-20
11
Q1
-20
12
Q4
-20
12
Q3
-20
13
Q2
-20
14C
han
ge
(US
$ B
ill.
)
Gross Inflows (Surges)
Change in Gross Inflows
Rolling Average (RA: 4 Qtrs)
RA+1SD
RA+2SD
-3.0
-2.0
-1.0
0.0
1.0
2.0
3.0
4.0
5.0
Q3
-20
04
Q2
-20
05
Q1
-20
06
Q4
-20
06
Q3
-20
07
Q2
-20
08
Q1
-20
09
Q4
-20
09
Q3
-20
10
Q2
-20
11
Q1
-20
12
Q4
-20
12
Q3
-20
13
Q2
-20
14
Chan
ge
(US
$ B
ill.
)
Gross Inflows (Stops)
Change in Gross InflowsRolling Average (RA: 4 Qtrs)RA-1SDRA-2SD
-3.0
-2.0
-1.0
0.0
1.0
2.0
3.0
4.0
5.0
Q3-2
00
4
Q2-2
00
5
Q1-2
00
6
Q4-2
00
6
Q3-2
00
7
Q2-2
00
8
Q1-2
00
9
Q4-2
00
9
Q3-2
01
0
Q2-2
01
1
Q1-2
01
2
Q4-2
01
2
Q3-2
01
3
Q2-2
01
4
Ch
ange
(US
$ B
ill.
)
Net Inflows (Surges)
Change in Net InflowsRolling Average (RA: 4 Qtrs)
RA+1SDRA+2SD
-3.0
-2.0
-1.0
0.0
1.0
2.0
3.0
4.0
5.0Q
3-2
00
4
Q2-2
00
5
Q1-2
00
6
Q4-2
00
6
Q3-2
00
7
Q2-2
00
8
Q1-2
00
9
Q4-2
00
9
Q3-2
01
0
Q2-2
01
1
Q1-2
01
2
Q4-2
01
2
Q3-2
01
3
Q2-2
01
4
Chan
ge
(US
$ B
ill.
)
Net Inflows (Stops)
Change in Net InflowsRolling Average (RA: 4 Qtrs)RA-1SDRA-2SD

34
Annex 4: Correlation Matrix of Cyclical Components of Gross Capital Outflows and
Net Capital Flows
Gross Capital Outflows
LBDC
Y
LINDC
Y
LNPC
Y
LPKC
Y
LSLC
Y
LBDCY 1.00 0.07 -0.03 -0.01 0.16
LINDCY 0.07 1.00 -0.01 0.37 -0.03
LNPCY -0.03 -0.01 1.00 -0.05 0.02
LPKCY -0.01 0.37 -0.05 1.00 -0.02
LSLCY 0.16 -0.03 0.02 -0.02 1.00
Net Capital Flows
LBDC
Y
LINDC
Y
LNPC
Y
LPKC
Y
LSLC
Y
LBDCY 1.00 -0.02 -0.13 -0.01 0.03
LINDCY -0.02 1.00 -0.07 0.01 0.11
LNPCY -0.13 -0.07 1.00 0.04 0.07
LPKCY -0.01 0.01 0.04 1.00 0.03
LSLCY 0.03 0.11 0.07 0.03 1.00
*: A correlation coefficient of 0.185 or more is statistically significant at 5 per cent.
Note: LBD, LIND, LNP, LPK, LSL represent Bangladesh, India, Nepal, Pakistan and Sri Lanka for
which comparable quarterly data are available in IMF’s BOPS.

35
Annex 5: Methodology for estimating Panel Results
Examining the impact of push and pull factors over capital flows, we estimate the following
model for six SAARC countries over annual data period from 2002 to 201418.
𝐹𝑙𝑜𝑤𝑠𝑖𝑡 = 𝐹𝑙𝑜𝑤𝑠𝑖𝑡−1 + 𝑃𝑢𝑠ℎ 𝑓𝑎𝑐𝑡𝑜𝑟𝑠𝑖𝑡𝛼𝑖 + 𝑃𝑢𝑙𝑙 𝑓𝑎𝑐𝑡𝑜𝑟𝑠𝑗𝑡𝛽𝑗 + (𝑐𝑖 + 𝜀𝑖𝑡) (1)
With 𝐹𝑙𝑜𝑤𝑠𝑖𝑡 = {
𝐺𝑟𝑜𝑠𝑠 𝐼𝑛𝑓𝑙𝑜𝑤𝑠𝑁𝑒𝑡 𝐼𝑛𝑓𝑙𝑜𝑤𝑠
𝐺𝑟𝑜𝑠𝑠 𝑂𝑢𝑡𝑓𝑙𝑜𝑤𝑠
𝑃𝑢𝑙𝑙 𝑓𝑎𝑐𝑡𝑜𝑟𝑠𝑖𝑡 =
{
𝐺𝐷𝑃 𝐺𝑟𝑜𝑤𝑡ℎ𝑃𝑜𝑙𝑖𝑡𝑖𝑐𝑎𝑙 𝑆𝑡𝑎𝑏𝑖𝑙𝑖𝑡𝑦
𝑃𝑢𝑏𝑙𝑖𝑐 𝐷𝑒𝑏𝑡𝑇𝑟𝑎𝑑𝑒 𝑂𝑝𝑝𝑒𝑛𝑛𝑒𝑠𝑠,𝑅𝑒𝑠𝑒𝑟𝑣𝑒𝑠 𝐴𝑑𝑒𝑞𝑢𝑎𝑐𝑦
𝐴𝑝𝑝𝑟𝑒𝑐𝑖𝑎𝑡𝑖𝑜𝑛 𝐸𝑥𝑝𝑒𝑐𝑡𝑎𝑡𝑖𝑜𝑛𝑇𝑒𝑟𝑚𝑠 𝑜𝑓 𝑇𝑟𝑎𝑑𝑒
𝑅𝑒𝑎𝑙 𝐸𝑥𝑐ℎ𝑎𝑛𝑔𝑒 𝑅𝑎𝑡𝑒𝐷𝑜𝑚𝑒𝑠𝑡𝑖𝑐 𝐼𝑛𝑡𝑒𝑟𝑒𝑠𝑡 𝑅𝑎𝑡𝑒
And
𝑃𝑢𝑠ℎ 𝑓𝑎𝑐𝑡𝑜𝑟𝑠𝑗𝑡 = {
𝐴𝑑𝑣𝑎𝑛𝑐𝑒𝑑 𝐸𝑐𝑜𝑛𝑜𝑚𝑖𝑒𝑠 𝐺𝐷𝑃 𝐺𝑟𝑜𝑤𝑡ℎ𝐹𝑖𝑛𝑎𝑛𝑐𝑖𝑎𝑙 𝑆𝑡𝑜𝑐𝑘 𝑃𝑟𝑖𝑐𝑒
𝐿𝑖𝑏𝑜𝑟𝑂𝑖𝑙 𝑃𝑟𝑖𝑐𝑒
Where each of the dependent variable is standardized by each country’s GDP. The list of
explanatory variables is large but not exhaustive and the strategy is of constructing estimable
equation for each type of capital flows selecting significant push and pull factors19. Pull and
push factors are followed by 𝑐𝑖 and 𝜀𝑖𝑡 representing unobserved component and estimation
error.
The first specification of pooled Ordinary Least Squares (OLS) assumes that individual’s
observations over time are observations from different individuals (countries). This approach
is reasonable in case when the size of cross-sectional samples is small20. The OLS specification
is followed by running Breisch-Pagan Langrange Multiplier (LM) test to know whether there
are individual-specific effects. Next, the Hausman test is applied to decide about the reliability
between Random Effect (RE) model and Fixed Effects (FE) model. The LM and Hausman tests
suggest in favour of pooled OLS which may be reasonable in this case of small cross-sectional
sample.
18 Data for Afghanistan and Bhutan over the entire period are not available. 19 Leamer (1985) sensitivity test is applied for variable selection. In this analysis model with different variables
are tested and records changes in the sign and significance level of coefficient of the concerned variable. 20 http://www.ub.uni-bamberg.de/elib/volltexte/2004/3/GH-Chap-2.pdf
36
Select References:
Ahmed, Hamna (2009), Capital Flows and Real Exchange Rate Overvaluation - A Chronic
Ailment: Evidence from Pakistan”, The Lahore Journal of Economics 14: SE (September
2009): pp. 51-86.
Ali, Sharafat (2014), Foreign Capital Flows and Economic Growth in Pakistan: An Empirical
Analysis”, World Applied Sciences Journal, Vol. 29 (2): pp193-201.
Aryal, Bibhu Prasad (2009), “Capital Flows and their Implications for Central Bank Policies
In Nepal”, in Min B. Shrestha and Choon-Seng Lim, Vincent (eds.), Capital Flows and their
Implications for Central Bank Policies in the SEACEN Countries, SEACEN Research and
Training Centre, Kuala Lumpur, Malaysia.
Baba, Chikako and Annamaria Kokenyne (2011), “Effectiveness of Capital Controls in
Selected Emerging Markets in the 2000s”, IMF Working Paper No. WP/11/281.
Bank of International Settlements (2009), “Capital flows and emerging market economies”,
CGFS Papers No.33.
Basu, Kaushik, Barry Eichengreen and Poonam Gupta (2015), “From Tapering to Tightening:
The Impact of the Fed’s Exit on India”, Policy Research Working Paper 7071, World Bank.
Budha Birendra Bahadur (2015), “Monetary Policy Transmission in Nepal”, NRB Working
Paper No. 29, August.
Calvo, G. (1998), “Capital flows and capital market crisis: the simple economics of sudden
stops”, Journal of Applied Economics, Vol. 1 No. 1, pp.35-54.
Calvo, Guillermo, Leonardo Leiderman, and Carmen Reinhart. (1996). “Inflows of Capital to
Developing Countries in the 1990s.” Journal of Economic Perspectives 10(2): 123-139.
Cardarelli, R., Selim Elekdag, M. Ayhan Kose, 2010, “Capital inflows: Macroeconomic
Implications and Policy Responses,” Economic Systems, Vol. 34, No. 4, pp. 333‒356.
Cardarelli, Roberto, Selim Elekdag and M.Ayhan Kose. (2009). “Capital Inflows:
Macroeconomic Implications and Policy Responses.” IMF Working Paper WP/09/40
Central Bank of Sri Lanka (2008), Annual Report 2008.
Central Bank of Sri Lanka, Annual Report 2007.
Chowdhury, Mamta B. (2011), “Remittances flow and financial development in Bangladesh”,
Economic Modelling, Vol. 28, pp 2600–2608.
Dua, Pami and Partha Sen (2006), “Capital Flow Volatility and Exchange Rates: The Case of
India”, CDE Working Paper No.144, Delhi School of Economics.
Eichengreen, Barry (2007), Globalizing Capital, Princeton: Princeton University Press.
Eswar Prasad, Raghuram Rajan, and Arvind Subramanian (2006), “ Patterns of International
Capital Flows and Their Implications for Economic Development”, available at
https://www.kansascityfed.org/PUBLICAT/SYMPOS/2006/pdf/11Rajan.pdf
Farkas, Beatrice (2012), “Absorptive Capacities and the Impact of FDI on Economic Growth”,
DIW Berlin Discussion Paper No.1202.
Forbes, K.J. (2007), “The Microeconomic Evidence on Capital Controls: No Free Lunch”, in:
Sebastian Edwards (ed.), Capital Controls in Emerging Economies: Policies, Practices and
Consequences, University of Chicago Press.
37
Forbes, Kristin and Frank Warnock, (2011). Capital Flow Waves: Surges, Stops, Flight and
Retrenchment, mimeo, MIT and University of Virginia.
Furceri, Davide, Stephanie Guicahrd, and Elena Rusticelli, 2012, “The Effect of Episodes of
Large Capital Inflows on Domestic Credit,” North American Journal of Economics and
Finance, Vol. 23, No. 3, pp. 325‒344.
Gallagher, Kevin P (2011), “Regaining Control? Capital Controls and the Global Financial
Crisis, Political Economy Research Institute, Working Paper No. 250.
Goyal, Ashima (2012), “The Future of Financial Liberalization In South Asia”, South and
South-West Asia Development Papers 1203, United Nations.
Gupta, Abhijit Sen and Rajeswari Sengupta (2013), “Management of Capital Flows in India:
1990-2011”, ADB South Asia Working Paper Series, No. 17.
Gupta, Poonam (2016), “Capital flows and central banking: the Indian experience”, Policy
Research Working Paper 7569, World Bank.
Hafeez-ur-Rehman, Atif Ali Jaffri and Imtiaz Ahmed (2010), Impact of Foreign Direct
Investment (FDI) Inflows on Equilibrium Real Exchange Rate of Pakistan”, South Asian
Studies, A Research Journal of South Asian Studies, Vol. 25, No. 1, January-June, pp.125-
141.
Harrison, A.E., I. Love and M.S. McMillan (2004), “Global Capital Flows and Financing
Constraints”, Journal of Development Economics, 75 (1), pp. 269-301.
Hemachandra, W. M. (2012), “Financial Crises and Impacts of Recent Financial Crises on Sri
Lanka”, Staff Studies, Vol.41 No. 1 & 2.
IMF (2005), World Economic Outlook, April.
IMF(2014), “Nepal: 2014 Article IV Consultation-Staff Report”, IMF Country Report No.
14/214.
Islam, M. Shahidul (2009), “An Economic Analysis of Bangladesh’s Foreign Exchange
Reserves”, ISAS Working Paper, No. 85, National University of Singapore.
Islam, Mohammed Saiful and Shamima Nasrin (2015), “Driving Forces of Remittance Inflow
in Bangladesh: An Empirical Study”, International Journal of Economics and Finance; Vol. 7,
No. 6.
Jan, Asad,; Ather Elahi and M. A. Zahid (2005), “Managing Foreign Exchange Inflows: An
Analysis of Sterilisation in Pakistan”, The Pakistan Development Review, Vol. 44, No. 4 Part
II (Winter) pp. 777–792.*
Karunasena, A.G. (1996), “Changing financial systems in open economies: Sri Lanka’s
experience”, https://www.bis.org/publ/plcy01e.pdf.
Khan, Mohammad Zubair (1996), “Pakistan: Prospects for Private Capital Flows and Financial
Sector Development”, The Pakistan Development Review, Vol.35: 4 Part II (Winter) ,pp. 853-
883.
Kohli, Renu (2001), “Capital Flows and Their Macroeconomic Effects in India”, IMF Working
Paper No.01/192.
Kohli, Renu (2011), “India’s Experience in Navigating the Trilemma: Do Capital Controls Help?”,
ICRIER Working Paper No.257.

38
Kramer, Charles F., Hélène K. Poirson and A. Prasad (2008), “Challenges to Monetary Policy
from Financial Globalization: The Case of India”, IMF Working Paper No. WP/08/131.
Kundu, Nobinkhor and Banu, Asma and Sehreen, Farhana (2012), “Workers’ remittances
impact on the economic growth: Evidence from capital inflows in Bangladesh”, The
Jahangirnagar Journal of Business Studies , Vol. 2, No. 1, pp. 153-167.
Mihaljek, Dubravko (2008), “The financial stability implications of increased capital flows for
emerging market economies”, BIS Papers No 44, December.
Mohan, Rakesh (2008), Capital flows to India, BIS Papers No.44.
Mohan, Rakesh and Muneesh Kapur (2009), “Managing the Impossible Trinity: Volatile
Capital Flows and Indian Monetary Policy”, Stanford Center for International Development,
Working Paper No.401.
Mujeri, Mustafa K. and Md. Shahiduzzaman (2009), “Navigating the Global Financial Storm:
Challenges for Bangladesh”, Policy Paper: 0903, Bangladesh Bank.
Naufal, George and Ali Termos (2009), “ The Responsiveness of Remittances to the Oil Price:
The Case of the GCC”, IZA DP No. 4277.
Nazir, Shumaila, Nadia Sarwar and Sami Ullah (2012), “Impact of Capital Inflows on
Domestic Inflation: A Case Study of Pakistan”, Journal of Asian Development. Studies, Vol 1,
Issue 1 (March).
Obstfeld, M. (1998), “The global capital market: Benefactor or menace?”, Journal of Economic
Perspectives, Vol. 12, pp. 9-30.
Ocampo, Jose Antonio, Shari Spiegel, and Joseph E. Stiglitz. 2008. Capital Market
Liberalization and Development. In Capital Market Liberalization and Development, edited by
J. A. Ocampo and J. E. Stiglitz. New York: Oxford University Press.
Panday, Anjan (2012), “Essays on the Exchange Rate and Monetary Policy in Nepal”, Ph.D
dissertation submitted to Washington University, Washington, D.C.
Pant, Bhubanesh (2006), “Remittance Inflows to Nepal: Economic Impact and Policy
Options”, Economic Review, Vol.18.
Pant, Bhubanesh (2007), “Capital account convertibility: benefits, costs and challenges”,
www.nepjol.info/index.php/sedp/article/download/1050/1066.
Prasad, Eswar, Kenneth Rogoff, Shang-Jin Wei and M. Ayhan Kose (2003), Effects of
Financial Globalization on Developing Countries: Some Empirical Evidence”, IMF Occasional
Papers No.220.
Pushparajah, P. (2011), “Capital Flows and their Implications for Central Bank Policies in Sri
Lanka”, in Min B. Shrestha and Choon-Seng Lim, Vincent (eds.), Capital Flows and their
Implications for Central Bank Policies in the SEACEN Countries, SEACEN Research and
Training Centre, Kuala Lumpur, Malaysia.
Qayyum, Abdul and Muhammad Arshad Khan (2003), “Capital Flows and Money Supply: The
Degree of Sterilisation in Pakistan”, The Pakistan Development Review , Vol. 42, No. 4
(Winter), pp. 975-985.
Rajan, Raghuram G. (2014), “Competitive monetary easing - is it yesterday once more?”,
Remarks at the Brookings Institution, Washington DC, 10 April 2014.
39
Rashid, Abdul (2009), “Capital Inflows and Exchange Rate Volatility in Pakistan”,
International Conference on Applied Economics –2009: 571.
Rashid, Abdul and Fazal Husain (2010), “Capital Inflows, Inflation and Exchange Rate
Volatility: An Investigation for Linear and Nonlinear Causal Linkages”, PIDE Working Paper
No.2010:63.
Raza, Syed Ali and Muhammad Sarwar Sabir and Farhan Mehboob (2011), “Capital inflows
and economic growth in Pakistan”, MPRA_paper_36790.pdf.
Reinhart, Carmen and Vincent Reinhart. (2009). “Capital Flow Bonanzas: An Encompassing
View of the Past and Present,” in Jeffrey Frankel and Francesco Giavazzi, eds. NBER
International Seminar in Macroeconomics 2008. Chicago: Chicago University Press.
Reinhart, Carmen M., and Vincent R. Reinhart, 2008, “Capital Flow Bonanzas: An
Encompassing View of the Past and Present.” NBER Working Paper No. 14321.
Roy, Ripon and Rahman, Md. Mokhlesur (2014), “An empirical analysis of remittance –
inflation relationship in Bangladesh: post-floating exchange rate scenario”, MPRA Paper No.
55190.
Sharma, Jan and Ganesh Gurung (2009), “Impact of Global Economic Slowdown on
Remittance Inflows and Poverty Reduction in Nepal”, Institute for Integrated Development
Studies (IIDS).
Shrestha, Bijaya (2008), “Contribution of Foreign Employment and Remittances to Nepalese
Economy”, Economic Review, Vol.20.
Singh, Harinam and Mohd. Muzammil (2010), “Capital Inflows and Exchange Rate Variations
under Economic Reforms in India”, The IUP Journal of Applied Economics, Vol. 9, No. 3, pp.
72-84.
Srivastava, Nagendra Lal and Shashi K. Chaudhary (2007), “Role of Remittance in Economic
Development of Nepal”, The Journal of Nepalese Business Studies, Vol. IV No. 1.
Thagunna Karan Singh and Saujanya Acharya (2013), “Empirical Analysis of Remittance
Inflow: The Case of Nepal”, International Journal of Economics and Financial Issues, Vol. 3,
No. 2, 2013, pp.337-344.
Virmani, Arvind (2007), “Macro-economic Management of the Indian Economy: Capital
Flows, Interest Rates and Inflation”, Working Paper No. 2/2007-DEA, Ministry of Finance.
Yasmin, Bushra (2005), “Foreign Capital Inflows and Growth in Pakistan: A Simultaneous
Equation Model”, South Asia Economic Journal, Vol. 6 No. 2, pp. 207-219.