preparation and characterization of microspheres of ... · preparation and characterization of...
TRANSCRIPT
Preparation and Characterization of Microspheres of Albumin-Heparin Conjugates
GLEN S. KWON,* YOU HAN BAE,* SUNG WAN KIM, *'1 H A R R Y CREMERS,t AND JAN FEIJEN'~
* Department of Pharmaceutics and Center for Controlled Chemical Delivery, University of Utah, Salt Lake City, Utah 84112; and t Department of Chemical Technology, University of Twente, Enschede, The Netherlands
Received August 21, 1990; accepted October 25, i990
Albumin-heparin microspheres have been prepared as a new drug carrier. A soluble albumin-heparin conjugate was synthesized by forming amide bonds between human serum albumin and heparin. After purification the albumin-heparin conjugate was crosslinked in a water-in-oil emulsion to form albumin- heparin microspheres. The composition of the conjugate was determined by amino acid analysis. The swelling properties of albumin-heparin microspheres were investigated as a function of pH and ionic strength and compared with albumin microspheres. Albumin-heparin and albumin microspheres exhibited stimuli-sensitive swelling. Both microsphere systems exhibited low swelling at low pH and high swelling at higher pH caused by ionization of amino acids of serum albumin. The swelling of albumin-hepafin microspheres was more sensitive toward ionic strength than that of albumin microspheres. This was due to the greater negative charge of the albumin-heparin microspheres. Surfaces of albumin-heparin and albumin microspheres were characterized by ESCA, contact angle measurements, electrophoresis, and scanning electron microscopy. Surface analysis indicated the presence of heparin at the albumin-heparin microsphere/water interface. © 1991 Academic Press, Inc.
INTRODUCTION
In recent years, polymeric microspheres have been ubiquitously investigated as drug delivery systems ( 1 ). The interest in polymeric microspheres as drug carriers is due to the fact that these systems are injectable, can deliver drugs site specifically, and can release drugs in a controlled manner (2). The delivery of a drug, protected by a drug carrier or dosage form, to a specific site of action (e.g., tumor or specific organ) may increase the therapeutic index of that drug (3).
In this contribution, the preparation of mi- crospheres based on conjugates of serum al- bumin and heparin that could be used as a new drug delivery system is described. Cur-
To whom correspondence should be addressed at De- partment of Pharmaceutics and Center for Controlled Chemical Delivery, University of Utah, 421 Wakara Way, Room 318, Salt Lake City, UT 84108.
Journal of Colloid and Interface Science, Vol, 143, No. 2, May 1991
rently there is much interest in the delivery of macromolecules, derived through biotechnol- ogy, due to their low oral bioavailability and short plasma half-lives (3). The viability of the microsphere approach has been investi- gated by Goosen et al. (4) with albumin mi- crospheres for the sustained release of insulin. After subcutaneous injection of the insulin- loaded microspheres, diabetic rats showed el- evated blood insulin levels for up to 2 months. Immobilizing heparin in albumin micro- spheres may increase its blood and tissue compatibility. Many workers have attempted to inhibit thrombosis at polymer/blood inter- faces by immobilizing heparin to polymer surfaces (5). Heparin is a highly negatively charged mucopolysaccharide and may en- hance the hydrophilicity of albumin micro- spheres. Longo and Goldberg (6) have dis- cussed the advantages of hydrophilic poly- meric microspheres for drug delivery. A study
501 0021-9797/91 $3.00 Copyright © 1991 by Academic Press, Inc. All rights of reproduction in any form reserved,
502 KWON ET AL.
on the release of Adriamycin from albumin- heparin microspheres has been previously re- ported (7).
The composition of the albumin-heparin conjugate was determined by amino acid analysis. The size distribution of microspheres was measured. To establish the enhanced hy- drophilicity of albumin-heparin microspheres the swelling as a function of pH and ionic strength of albumin-heparin microspheres in aqueous systems was compared to that of al- bumin microspheres.
The surface characteristics of albumin- heparin and albumin microspheres were then examined. Surface properties largely deter- mine the biocompatibility of microspheres when interfaced with body tissues and blood and they affect the distribution of intrave- nously administered microspheres through the process of opsonification (1). Due to their small size polymeric microspheres have a large specific surface area which would interface with the biological milieu. A thorough study of the surface characteristics of albumin-hep- arin microspheres was necessary to correlate in vivo performance with surface properties. The surfaces of albumin-heparin and albumin microspheres were therefore characterized by ESCA, contact angle measurements, electro- phoresis, and scanning electron micros- copy (SEM).
MATERIALS AND METHODS
MATERIALS
Human serum albumin (lyophilized and crystallized), olive oil, and 1-ethyl-3-(3-di- methylaminopropyl) carbodiimide (EDC) were obtained from Sigma (St. Louis, MO). Heparin (lot number LPP060143, average molecular weight 11,000), from porcine in- testinal mucosa, was obtained from Diosynth (Oss, The Netherlands). Purified glutaralde- hyde (25%, w/v) was purchased from Fisher (Pittsburgh, PA). Sodium cyanoborohydride was obtained from Aldrich (Milwaukee, WI). Blue Sepharose CL-6B and Diethylaminoethyl (DEAE)-Sepharose CL-6B were obtained
from Pharmacia (Piscataway, N J). Micro- concavity slides were purchased from Clay- Adams (Parsipanny, NJ). Pluronic F-68 was received from BASF (Parsipanny, NJ). Cel- lulose acetate (molecular weight cutoff 1000 and 3500) dialysis membranes and polytet- rafluoroethylene membranes (0.45-#m pore size) were obtained from Gelman (Ann Arbor, MI). Sodium acetate (0.1 N)/aeetonitrile buffer (HPLC grade) was obtained from VWR (Philadelphia, PA). Phenyl isothiocyanate was obtained from Pierce (Rockford, IL). Latexes ( 10 and 100 ~m) were purchased from Coulter Counter (Hialeah, FL). All other chemicals were reagent grade.
M E T H O D S
Synthesis of Albumin-Heparin Conjugate
The protocol used to synthesize the soluble albumin-heparin conjugate was based on the method of Hennink et al. (8). The procedure was slightly modified to inhibit denaturation of the serum albumin. A buffer was used to keep the pH constant during the course of the reaction without the addition of HC1, and all steps were carried out at 4°C. Heparin (770 mg) and serum albumin (2590 mg) were dis- solved in 39.0 ml phosphate buffer (0.061 M monopotassium phosphate, 5.33 X 10 -4 M disodium phosphate), pH 5.10. The solution was adjusted to pH 5.10 with 0.10 M HC1. Then, 32.5 mg EDC was dissolved in 1.00 ml distilled water and added to the heparin and serum albumin solution. This was repeated seven more times at 30-min intervals. The to- tal amount of EDC added was 260 mg. The pH was adjusted to pH 7.00 with 1.00 M NaOH 30 min after the last addition of EDC. The resultant solution was then gently stirred for 20 h. The solution was dialyzed (cellulose acetate, 1000 molecular weight cutoff) twice against 0.17 M NaCI, 0.025 M Tris/HC1, pH 7.00, for 6 h.
The albumin-heparin conjugate was puri- fied from free serum albumin and heparin us- ing a two-step liquid chromatography proce- dure. Heparin was removed by using a Blue
Journal of Colloid and Interface Science, Vol. 143, No. 2, May 1991

ALBUMIN-HEPARIN MICROSPHERES 503
Sepharose CL-6B column. The column was first equilibrated with two bed volumes of 0.17 M NaC1, 0.025 M Tris/HC1, pH 7.40, buffer. A mixture of albumin-heparin conjugate and unbound heparin and serum albumin dis- solved in 0.17 MNaC1, 0.025 MTris/Hcl, pH 7.40, buffer was applied to the column, and the heparin was eluted with one column vol- ume of starting buffer. The albumin-heparin conjugate and serum albumin were eluted by a stepwise ionic strength gradient of 1.5 M NaC1, 0.025 M Tris/HC1, pH 7.40, buffer. Heparin was determined by using a toluidine blue assay described elsewhere (9). The frac- tions were assayed for serum albumin by mea- suring the absorbances at 280 nm with a UV spectrophotometer (UV- 1, Pharmacia, Upp- sala, Sweden). Fractions with absorbances greater than 0.5 were collected, pooled, and dialyzed (cellulose acetate, 3500 molecular weight cutoff) three times against 8 liters of deionized water. The sample was then freeze- dried (Lyph-Lock6, LabConCo, Kansas City, MO). The albumin-heparin conjugate and serum albumin were then redissolved in 0.30 MNaC1, 0.025 M Tris/HC1, pH 7.40, buffer and applied to the DEAE-Sepharose CL-6B column which had been equilibrated with 0.30 M NaC1, 0.025 M Tris/HC1, pH 7.40, buffer. Serum albumin was eluted with one column of starting buffer. The albumin-heparin con- jugate was eluted by a stepwise ionic strength gradient of 0.90 M NaC1, 0.025 M Tris/HC1, pH 7.40. The fractions of albumin-heparin conjugate that exhibited an absorbance greater than 0.5 were collected, pooled, and dialyzed against 8 liters of deionized water. The con- jugate was then freeze-dried. All separation and dialysis procedures were carried out at 4°C.
Preparation of Albumin-Heparin and Albumin Microspheres
Microspheres were synthesized using a pro- tocol similar to that of Burger et al. (10). A 125-ml volume of olive oil was placed in a baffled cell (10) and stirred at a predetermined
rate for 30 min. The 100 mg ofalbumin-hep- arin conjugate or serum albumin, which had been dissolved in 400 #1 of distilled water at 4°C, was injected dropwise into stirred olive oil at 25°C, and stirring was continued for 15 rain. A predetermined amount of purified glutaraldehyde (25%, w/v) to make 1 to 4% (w / v) of the added albumin-heparin solution was then added along with twice the equimolar amount of sodium cyanoborohydride solu- tion. The crosslinking reaction was allowed to proceed for 3.5 h. A 100-ml aliquot ofglycine (10%, w/v) was then added to quench un- reacted aldehyde groups and allowed to pro- ceed for 30 min. Subsequently 60 ml of ace- tone was added and the emulsion stirred for 1 rain. The microspheres were isolated by centrifugation (MSE, VWR, Philadelphia, PA) at 1000 rpm for 15 min. The supernatant was then decanted. The microspheres were re- suspended in acetone, collected on a 0.45-gm polytetrafluoroethylene membrane, and washed and dehydrated with acetone. The collected microspheres were suspended in acetone, sieved between appropriate sized mi- crosieves (U.S. Standard, Newark Wire Cloth, Newark, N J), and washed with isotonic phos- phate buffer (PBS) (2.00 × 10⁻³ Mpotassium phosphate, 8.00 X 10 -3 M disodium phos- phate, 0.145 M NaC1), pH 7.40, and distilled water. The microspheres were air-dried for 24 h, vacuum-dried for an additional 24 h, and stored frozen. Albumin-heparin and albumin gels used for contact angle measurements were prepared by in situ crosslinking of the proteins in syringes at 4°C.
Composition
The composition of the albumin-heparin conjugate was determined by amino acid analysis. Briefly, the method first involved hy- drolysis of the sample. The determinations of serum albumin and heparin were carried out independently because hydrolysis conditions for proteins are too harsh for polysaccharides and result in degradation ( 11 ). Hydrolysis of serum albumin was carried out with 6 N HC1
Journal of Colloid and Interface Science, Vol. 143, No. 2, May 1991
5 0 4 K W O N ET AL.
at 106°C for 20 h. For the analysis ofheparin, hydrolysis was done with 4 N HC1 at 100°C for 16 h. Subsequently the amino acids and glucosamine were derivatized using phenyl isothiocyanate to form phenylthiocarbamoyl (PTC) derivatives. The PTC derivatives were then separated using sodium acetate (0.1 N) / acetonitrile buffer as the mobile phase with reverse phase column (Ultrasphere OPS, 4.6 mm × 15 cm, Waters, San Francisco, CA) using HPLC ( 1084B, Waters, San Francisco, CA). The amount of PTC derivative was de- termined by measuring absorbance at 254 nm with a UV spectrophotometer (484, Waters). Heparin standards were analyzed by the same procedure.
Analysis of Size Distribution
The size distribution of swollen and un- swollen albumin-heparin and albumin mi- crospheres (n = 300) was determined by phase-contrast light microscopy (Biophot, Nikon, Tokyo, Japan) using a calibrated grat- icule. Calibration was done with latexes of known size.
Swelling
Equilibrium swelling of microspheres was studied as a function ofpH and ionic strength. To examine the effects of pH on the swelling of albumin-heparin and albumin micro- spheres, a universal buffer, Britton and Rob- inson (12), was used and the ionic strength of the buffer was adjusted to a constant value of 0.21 with sodium chloride. The effect of ionic strength on swelling was examined using an isotonic PBS, pH 7.40, with sodium chloride added to adjust the ionic strength of the media. The swelling was also studied as a function of glutaraldehyde used for crosslinking. Equilib- rium swelling was determined in isotonic PBS, pH 7.40. All swelling experiments were done at 25°C. The swelling ratio
Vswollen q = - - [1]
Vdned
Journal of Colloid and Interface Science, Vol. 143, No. 2, May 1991
was determined by measuring the diameter of albumin-heparin and albumin microspheres (n = 50) by phase-contrast light microscopy (Biophot, Nikon) and by assuming a spherical geometry. Albumin-heparin and albumin microspheres sieved between 38 and 53 ~,m with an average dry diameter of 40 +_ 5 #m were used for these studies. Standard error of the means (s.e.m.) of the swelling ratio was calculated by propagating the error of the mi- crosphere diameter ( 13 ).
Surface Characterization of Albumin- Heparin and Albumin Microspheres
ESCA analysis. The chemical nature of al- bumin-heparin and albumin microsphere surfaces was studied by ESCA (5950B, Hew- lett-Packard, Palo Alto, CA). The X-ray source was a monochromatic A1Kal,2 and had an energy of 1487 eV and 400 W power at the anode. To inhibit charging, an electron flood gun bathed the surface of the microspheres at 6.0 eV. Albumin-heparin and albumin mi- crospheres were prepared by vacuum-drying. Albumin-heparin microspheres were also prepared by freeze-drying. Samples were fro- zen at -60°C with dry ice in acetone and then freeze-dried (Lyph-Lock6, LabConCo) . Atomic percentages of each sample were cal- culated by utilizing area sensitivity techni- ques (14).
Contact angle measurements. The contact angles of albumin-heparin and albumin gels were determined using a goniometer (A-100, Rame-Hart, Inc., Mountain Lakes, N J). Droplets of double-distilled water were care- fully placed via a syringe onto the surface of the gel. The advancing contact angle was de- termined by measuring the angle of the tangent to the drop with the surface at the gel/water/ air meeting point. Measurements were carried out at 25°C in triplicate and standard devia- tions were calculated. The water contents of the gels were determined by measuring the weight of the gels swollen in deionized water and the weight of the dried gels. The water contents (in percent) were defined as the
A L B U M I N - H E P A R I N M I C R O S P H E R E S 5 0 5
weight of the swollen gel minus the weight of the dried gel divided by the weight of the swol- len gel.
Electrophoresis measurements. The zeta potentials of albumin-heparin and albumin microspheres were measured by electropho- resis (3.0, Zetameter Inc., Long Island City, NY). The average diameter of the micro- spheres was 60 + 27 #m. An isotonic PBS, 7.40, was used for the determination of zeta potentials, and all experiments were done at 25°C. The zeta potential of albumin micro- spheres was determined using 0.1% Pluronic F-68, a nonionic surfactant, to prevent floc- culation. The Smoluchowski equation was used to calculate the zeta potentials,
g-=#~ [2]
(assuming KR > 100), where # is defined as the electrophoretic mobility. This value is ex- perimentally obtained by determining the ve- locity of microspheres in an applied electric field by light microscopy. Measurements were carried out in triplicate and standard devia- tions were calculated, n is the viscosity of the bulk medium, eeo is the dielectric permittivity of the medium. K, the reciprocal of the Debye length, is determined by the composition of the medium
e 2 \ 2 / 2
[3]
e is the elementary charge, k is the Boltzmann constant, T is the absolute temperature, and c~ and zi are the concentration and valency of the ionic species. R is the radius of albumin- heparin microspheres. The Debye length is less than 10 ~ under isotonic conditions.
SEM. The surfaces of albumin-heparin and albumin microspheres were studied using SEM. Microspheres were vacuum-dried over- night and then placed on stubs and sputter- coated with A u / P d using a sputter coater (Hammer III, Technics, Alexandria, VA). The surfaces were examined with SEM (JSM-35, JEOL, Peabody, MA).
R E S U L T S A N D D I S C U S S I O N
To immobilize heparin within an albumin matrix, soluble albumin-heparin conjugate was first synthesized. Since heparin and serum albumin do not interact at physiological con- ditions ( 15 ), heparin was covalently bound to serum albumin via amide bonds. The carboxyl groups of serum albumin and heparin are preactivated by EDC in the presence of an ex- ternal nucleophile, the lysine residue, and thus the formation of the N-acylurea is inhibited (16). By using a buffer the pH did not have to be adjusted during the course of the reac- tion. The pH did slightly increase with each addition of EDC as hydrogen ions were con- sumed in the reaction (16). The pH 30 min after the last addition of EDC was 5.24.
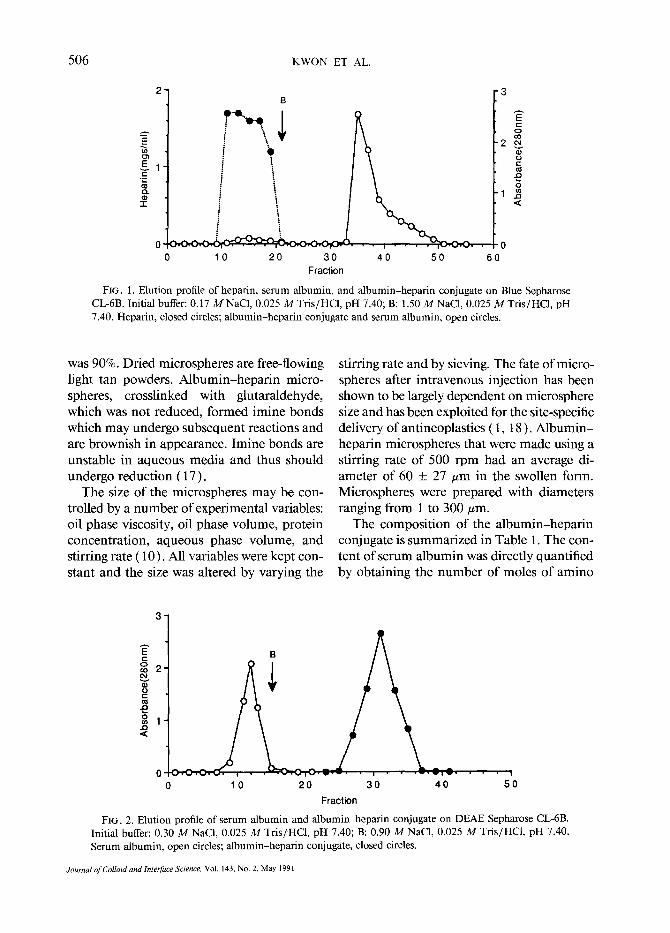
Purification of the albumin-heparin con- jugate was accomplished with liquid chro- matography, and the elution profiles are shown in Figs. 1 and 2. Heparin was isocrat- ically eluted from the Cibacron Blue F3G-A column. When a stepwise ionic strength gra- dient was applied a skewed peak was observed. This peak represents the serum albumin and the albumin-heparin conjugate. The skewed peak is due to the difference in affinity between the serum albumin and albumin-heparin conjugate toward the immobilized dye. It was not possible to resolve the two components on this column. Serum albumin was eluted iso- cratically on the DEAE-Sepharose CL-6B col- umn, and using a stepwise ionic strength gra- dient the albumin-heparin conjugate was eluted from the column (Fig. 2). The greater affinity of the albumin-heparin conjugate to- ward DEAE-Sepharose CL-6B was a result of the greater negative charge associated with the albumin-heparin conjugate relative to serum albumin. The percentage yield of the albumin- heparin conjugate after purification was 30% based on the initial weight of the serum al- bumin and heparin.
Albumin-heparin microspheres were pre- pared by crosslinking the conjugate in a water- in-oil emulsion. The percentage yield of al- bumin-heparin and albumin microspheres
Journal of Colloid and Interface Science, Vol. t43, No. 2, May 1991
506 K W O N ET AL.
2 B
O"e. " 'IPQ..
=_--
0 10 20 30 Fraction
40
-3
0 50 60
co 2 ¢q v
=~ t~ J~ o
<
FIG. 1. Elution profile of heparin, serum albumin, and a lbumin-hepar in conjugate on Blue Sepharose CL-6B• Initial buffer: 0.17 M NaC1, 0.025 M Tris/HC1, pH 7.40; B: 1.50 M NaC1, 0.025 M Tfis/HC1, pH 7.40. Heparin, closed circles; a lbumin-hepar in conjugate and serum albumin, open circles.
was 90%. Dried microspheres are free-flowing light tan powders. Albumin-heparin micro- spheres, crosslinked with glutaraldehyde, which was not reduced, formed imine bonds which may undergo subsequent reactions and are brownish in appearance. Imine bonds are unstable in aqueous media and thus should undergo reduction (17).
The size of the microspheres may be con- trolled by a number of experimental variables: oil phase viscosity, oil phase volume, protein concentration, aqueous phase volume, and stirring rate (10). All variables were kept con- stant and the size was altered by varying the
stirring rate and by sieving• The fate of micro- spheres after intravenous injection has been shown to be largely dependent on microsphere size and has been exploited for the site-specific delivery of antineoplastics ( 1, 18 ). Albumin- heparin microspheres that were made using a stirring rate of 500 rpm had an average di- ameter of 60 + 27 um in the swollen form. Microspheres were prepared with diameters ranging from 1 to 300 #m.
The composition of the albumin-heparin conjugate is summarized in Table 1. The con- tent of serum albumin was directly quantified by obtaining the number of moles of amino
3
E B
e'l
en
• !
0 10 20 30 40 50
Fraction
FIG. 2. Elution profile of serum albumin and a lbumin-hepar in conjugate on DEAE Sepharose CL-6B. Initial buffer: 0.30 M NaCI, 0.025 M Tris/HC1, pH 7.40; B: 0.90 M NaCI, 0.025 M Tris/HC1, pH 7.40. Serum albumin, open circles; a lbumin-hepar in conjugate, closed circles.
Journal of Colloid and Interface Science, Vol. 143, No. 2, May 1991

A L B U M I N - H E P A R I N M 1 C R O S P H E R E S 5 0 7
TABLE I
Composition of Albumin-Heparin Conjugate
Heparin content a Albumin content" Albumin/heparin [wt %] [wt %] [tool/tool]
9 .54 ± 0.46 90.5 ± 0.30 1.58 _+ 0 .07 b
a Determination by amino acid analysis. b SD (n = 3).
acids. The heparin content was determined by quantifying the number of moles of glucos- amine. The weight percentage of heparin in the albumin-heparin conjugate was found to be 9.54% by amino acid analysis. The amount of incorporated heparin is quite large relative to other similar heparin-immobilized hydrogel systems which contain 0.64% by weight hep- arin (19). The heparin is expected to be bioactive, and a systematic in vitro study of the blood compatibility of albumin-heparin microspheres is currently in progress.
Figure 3 shows that pH can act as an exter- nal stimulus to modulate the swelling of al- bumin-heparin microspheres; the degree of swelling is dependent on the crosslink density. A hydrogel network which has a higher cross- link density exhibits a greater retractive force
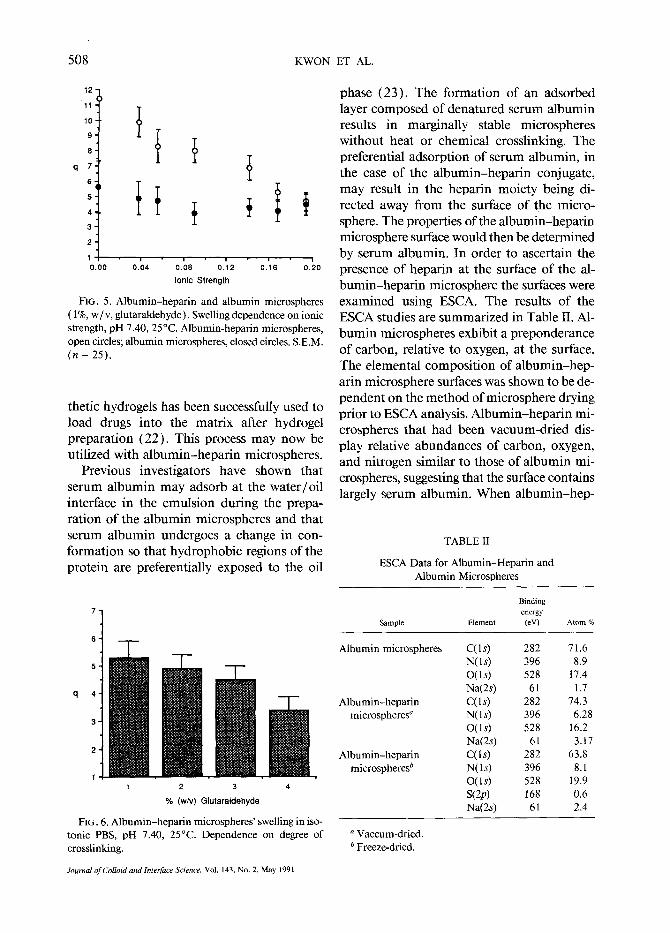
which prevents the gel from expanding (20). The swelling changes reflect the ionization of functional groups of amino acids (e.g., Asp, Glu, and Lys) of serum albumin and carboxyl groups of heparin which is dependent on pH. An increased number of like negative charges associated with the polymer chains result in expansion of the chain which is opposed by polymer network retractive forces and poly- mer-polymer interactions (20, 21 ). In Fig. 4, the pH-dependent swelling of albumin-hep- arin and albumin microspheres at 1% (w/v) glutaraldehyde is shown. The swelling of al- bumin microspheres is sensitive toward pH and also reflects the ionization of amino acids. Counterions in solution may effectively neu- tralize the repulsion of like charges along the polymer chain through electrostatic interac- tion, thus shielding the charge on the polymer chain and decreasing swelling (Fig. 5). The swelling of albumin-heparin microspheres is greater and exhibits more sensitivity toward ionic strength than albumin microspheres due to the higher negative charge of albumin-hep- arin microspheres. The swelling of synthetic hydrogels may be altered by the degree of crosslinking, and Fig. 6 illustrates that this is also possible with albumin-heparin micro- spheres. Stimuli-sensitive swelling with syn-
13
11
lO
9
7
q 6 ' ~
s-" 4 "
I 1
~ ' ; 4 ' ; ; ; ; "; ? 0 1 ' 1 7 2 7 3 pH
FIG. 3. p H - d e p e n d e n t swell ing o f a l b u m i n - h e p a r i n mi-
c rosphe res wi th va ry ing c ross l ink ing (%, w / v , g lu ta ra l -
d e h y d e ) . Ionic s t rength , 0 .21; 2 5 ° C . 1%, o p e n circles; 2%,
closed circles; 3%, open squares; 4%, d o s e d squares. S.E.M.
(n = 25).
12 i 11
10
9
q 7
6
4
3
2 i 1 . . . . r . . . . i . . . . i . . . . i . . . . i . . . . i... ' .1 . . . . v . . . . i . . . . i . . . . I
2 3 4 5 6 7 8 9 10 11 12
pH
FIG. 4. p H - d e p e n d e n t swelling o f a l b u m i n - h e p a r i n a n d
a l b u m i n mic ro sphe re s (1%, w / v , g l u t a r a l d e h y d e ) . Ionic
s t rength , 0 .21; 2 5 ° C . A l b u m i n - h e p a r i n mic rospheres ,
o p e n circles; a l b u m i n mic rospheres , c losed circles. S.E.M. (n = 25).
Journa l o f Col lo id a n d Interface Science, Vol. 143, No. 2, May 1991
508 KWON ET AL.
12-
11
lO
9
8
q 7
6
5
4
3
2
1 0.00 0,04 0.08 0. 2 0.16 0.20
Ionic Strength
FIG. 5. Albumin-heparin and albumin microspheres ( 1%, w/v, glutaraldehyde). Swelling dependence on ionic strength, pH 7.40, 25°C. Albumin-heparin microspheres, open circles; albumin microspheres, closed circles. S.E.M. (n = 25).
thetic hydrogels has been successfully used to load drugs into the matrix after hydrogel preparation (22). This process may now be utilized with albumin-heparin microspheres.
Previous investigators have shown that serum albumin may adsorb at the water/oil interface in the emulsion during the prepa- ration of the albumin microspheres and that serum albumin undergoes a change in con- formation so that hydrophobic regions of the protein are preferentially exposed to the oil
phase (23). The formation of an adsorbed layer composed of denatured serum albumin results in marginally stable microspheres without heat or chemical crosslinking. The preferential adsorption of serum albumin, in the case of the albumin-heparin conjugate, may result in the heparin moiety being di- rected away from the surface of the micro- sphere. The properties of the albumin-heparin microsphere surface would then be determined by serum albumin. In order to ascertain the presence of heparin at the surface of the al- bumin-heparin microsphere the surfaces were examined using ESCA. The results of the ESCA studies are summarized in Table II. Al- bumin microspheres exhibit a preponderance of carbon, relative to oxygen, at the surface. The elemental composition of albumin-hep- arin microsphere surfaces was shown to be de- pendent on the method ofmicrosphere drying prior to ESCA analysis. Albumin-heparin mi- crospheres that had been vacuum-dried dis- play relative abundances of carbon, oxygen, and nitrogen similar to those of albumin mi- crospheres, suggesting that the surface contains largely serum albumin. When albumin-hep-
TABLE II
ESCA Data for Albumin-Heparin and Albumin Microspheres
7
6
5
q 4
3
2
1 1 2 3 4
% (w/v) Gtutaraldehyde
FIG. 6. Albumin-heparin microspheres' swelling in iso- tonic PBS, pH 7.40, 25°C. Dependence on degree of crosslinking.
Binding energy
Sample Element (eV) Atom %
Albumin microspheres C(1 s) 282 71.6 N(ls) 396 8.9 O(ls) 528 17.4 Na(2s) 61 1.7
Albumin-heparin C(ls) 282 74.3 microspheres ~ N( 1 s) 396 6.28
O(ls) 528 16.2 Na(2s) 61 3.17
Albumin-heparin C(ls) 282 63.8 microspheres b N(I s) 396 8.1
O(ls) 528 19.9 S(2p) 168 0.6 Na(2s) 61 2.4
Vaccum-dried. b Freeze-dried.
Journal of Colloid and Interface Science, Vol. 143, No. 2, May 1991
ALBUMIN-HEPARIN
arin microspheres are freeze-dried ESCA analysis shows that the surface now contains sulfur and shows a decrease in the carbon:ox- ygen ratio which is consistent with the presence of hepafin at the surface. These results imply that heparin is present at the surface of mi- crospheres when interfaced with aqueous sys- tems. When the albumin-heparin micro- spheres are in contact with air the surfaces may undergo reorientation so that serum albumin is largely at the surface. Such reorientation processes at polymer/water and polymer/air interfaces are well documented and occur to minimize interracial free energies (24). Hep- arin at the surface is more likely to exhibit bioactivity relative to heparin in the interior of the microsphere.
Surface wettability was determined by con- tact angle measurements. Contact angles of albumin-heparin and albumin gels and water contents of the gels are summarized in Table III. Both gels exhibit high water contents. The low contact angles are consistent with the hy- drated nature of the gels. The albumin-hep- arin gel has a slightly lower contact angle pos- sibly due to the immobilized hepafin at the surface. Contact angles are measures of gel/ water interfacial free energies. King et aL have demonstrated that the interracial free energy at the gel/water interface approaches zero as the water content of the gels approaches 30% (25). From these results, it may be surmised that the interfacial free energy approaches zero for both albumin-heparin and albumin gels.
Albumin-heparin and albumin micro- spheres both have a net negative surface charge (Table IV). Zeta potential approximates sur- face potential; for albumin-heparin micro-
TABLE III
Contact Angle Measurements and Percentage Water
Contents of Albumin-Hepar in and Albumin Hydrogels
Hydrogel 0Cwat©r) % H20
Albumin-hepar in 10 _+ 2 a 96 Albumin 15 _+ 3 a 68
a SD (n ~ 3).
MICROSPHERES
TABLE IV
Zeta Potentials of Albumin-Hepar in and
Albumin Microspheres
509
Microsphere Zeta potential (mV)
Albumin-hepar in ~ -40 .0 _+ 4 c Albumin b - 17.0 _+ 2 c
a Suspension medium, isotonic PBS, pH 7.40. b Suspension medium, 0.1% (w/v) Pluronic F-68, PBS,
pH 7.40. c SD (n = 3).
spheres the zeta potential was -40.0 mV. The highly negatively charged nature of the surface accounts for its colloidal stability in isotonic phosphate buffer, pH 7.40, without the pres- ence of surfactants and is consistent with the presence of heparin at the surface. The nega- tive surface charge may result in a decreased interaction with biosurfaces since most of the surfaces also have a net negative charge (26). Albumin microspheres were found to have a zeta potential of -17.0 mV which is in good agreement with the literature (10). Generally, polymeric microspheres require surfactants for colloidal stability; this may cause deleterious effects on drug release and affect performance in vivo. Surfactants may possibly be toxic and affect tissue interactions.
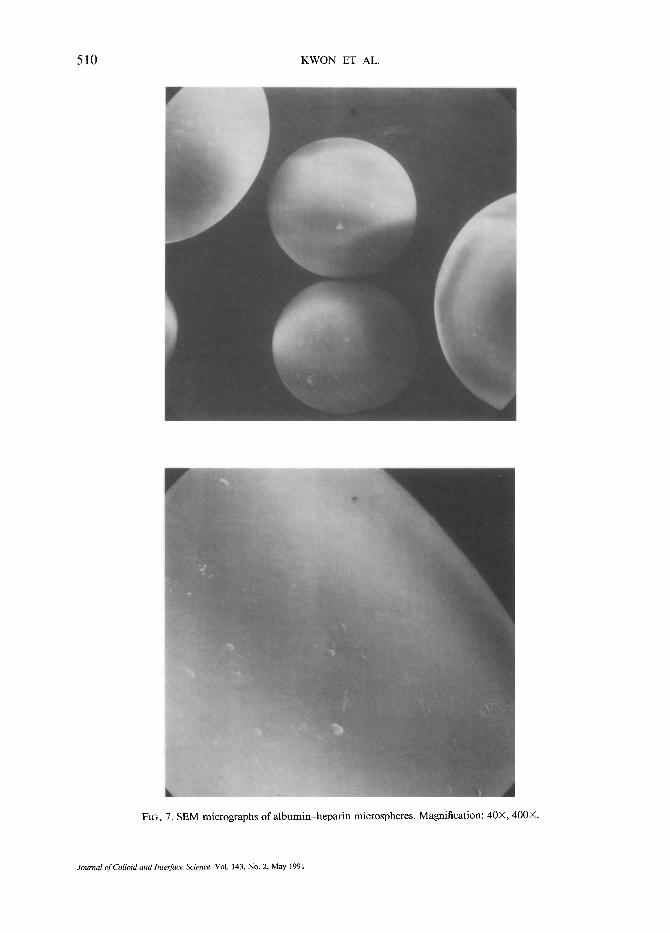
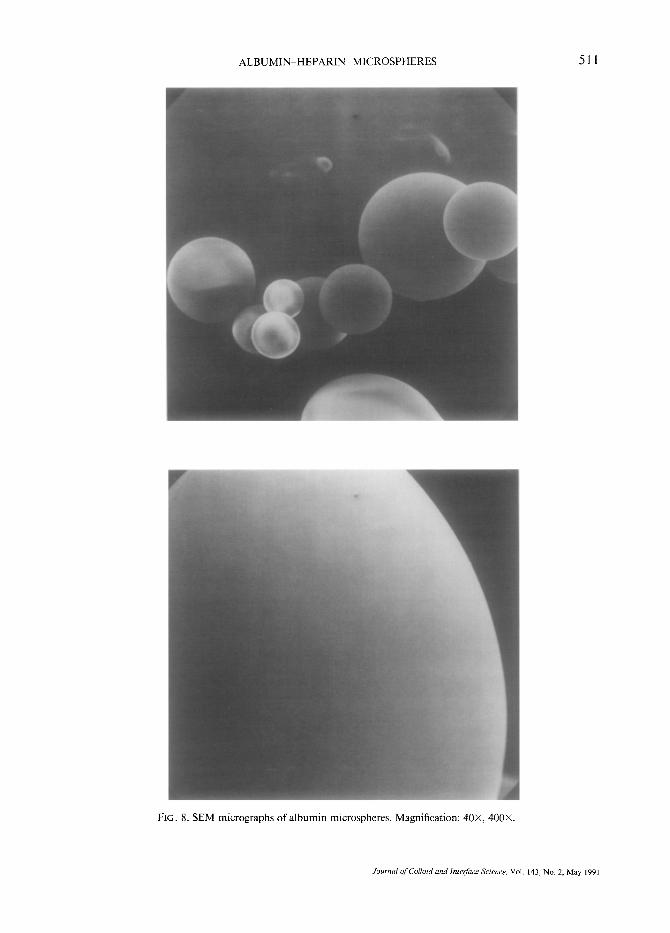
SEM micrographs (Figs. 7 and 8) taken at a magnification of 40× and 400X ofalbumin- heparin microspheres suggest that they have a homogeneous structure without macropores (27). The porosity of homogeneous hydrogels has been described to be related to the void volume between individual polymer chains (27). Drug release from homogeneous hydro- gels is expected to be slower compared to macroporous systems. Dry albumin-heparin microspheres appear spherical, have a smooth surface, and appear similar to albumin micro- spheres.
SUMMARY
In conclusion, the preparation of albumin- heparin microspheres has been described. It was shown that the albumin-heparin and al-
Journal of Colloid andlnterface Science, Vol. 143, No. 2, May 1991
5 10 K W O N ET AL.
FIG. 7. SEM micrographs of a lbumin-hepar in microspheres. Magnification: 40×, 400×.
Journal of Colloid and Interface Science, Vol. 143, No. 2, May 1991
A L B U M I N - H E P A R I N MICROSPHERES 5 1 1
FIG. 8. SEM micrographs of a lbumin microspheres. Magnification: 40X, 400X.
Journal of Colloid and Interface Science, Vol. 143, No. 2, May i 991
5 1 2 KWON ET AL.
bumin microspheres are stimuli-sensitive hy- drogels characterized by a high degree of swelling. Albumin-heparin microspheres ex- hibited an enhanced hydrophilicity and an in- creased negative charge relative to albumin microspheres due to the immobilized heparin. ESCA studies indicated that heparin is present at the surface of the albumin-heparin micro- sphere when interfaced with an aqueous sys- tem, but the surface may undergo reorienta- tion when interfaced with air, showing a pre- ponderance of serum albumin. Both surfaces are quite wettable as evidenced by contact an- gle measurements. The surface of albumin- heparin microspheres was more negatively charged than that of albumin microsphere surfaces which resulted in greater colloidal stability precluding the need for the addition of surfactants for stabilization. In vitro bio- degradation, drug loading, and release of macromolecules from albumin-heparin mi- crospheres are currently being investigated.
ACKNOWLEDGMENT
This work was supported, in part, by TheraTech, Inc., Salt Lake City, Utah.
REFERENCES
1. Lynn, L., Davis, S. S., Illum, L., and Davis, M. C., Biomed. Polym. 4, 1 (1988).
2. Tomlinson, E., J. Controlled Release 2, 385 (1985). 3. Tomlinson, E.,Adv. Drug Delivery Rev. 1, 87 (1987). 4. Goosen, M., Leung, Y., Chou, S., and Sun, A. M.,
Biomatter. Med. Devices Arti f Organs 10, 205 (1982).
5. Ebert, C. D., and Kim, S. W., in "Medical Applications of Controlled Release" (R. S. Langer and D. L Wise, Eds.), p. 77. CRC Press, Boca Raton, FL, 1984.
6. Longo, W., and Goldberg, E., in "Methods in Enzy- mology" (Kenneth J. Widder and Ralph Green, Eds.), vol. 112, p. 18. Academic Press, New York, 1985.
7. Cremers, H. F. M., Feijen, J., Kwon, G., Bae, Y. H., Kim, S. W., Noteborn, H. P., and McVie, J. G., J. Controlled Release 11, 167 (1990).
8. Hennink, W., Feijen, J., Ebert, C. D., and Kim, S. W., Thromb. Res. 29, 1 (1983).
9. Smith, P. K., Mallia, A. K., and Harmanson, G., Anal. Biochem. 109, 466 (1980).
10. Burger, J. J., Tomlinson, E., Mulder, E., and McVie, J. G., Int. J. Pharm. 23, 333 (1985).
11. Neuberger, A., and Marshall, R. D., in "Glycoproteins: Their Composition, Structure and Function" (A. Gottschalk, Ed.), p. 190. Elsevier, Amsterdam, 1966.
12. Dawson, R. M., "Data for Biochemical Research," p. 474. Oxford Univ. Press, London/New York, 1969.
13. Peters, D. G., Hayes, J. M., and Hieftje, G. M., "Chemical Separations and Measurements," p. 19. Saunders, Philadelphia, 1974.
14. Andrade, J. D., in "Surface and Interfacial Aspects of Biomedical Polymers" (J. D. Andrade, Ed.), p. 105. Plenum, New York, 1984.
15. McKay, E. J., and Laurell, C. B., J. Lab. Clin. Med. 95, 69 (1980).
16. Rich, D. H., and Singh, J., in "The Peptides: Analysis, Synthesis, and Biology" (E. Gross and J. Meien- borer, Eds.), p. 242. Academic Press, New York, 1979.
17. Sokoloski, T. D., and Royer, G., in "Microspheres and Drug Therapy: Pharmaceutical, Immunolog- ical and Medical Aspects" (S. S. Davis, L. Illum, J. G. McVie, and E. Tomlinson, Eds.), p. 295. El- sevier, Amsterdam, 1984.
18. Gupta, P. K., Hung, C. T., and Perrier, D. G., Int. J. Pharm. 33, 137 (1986).
19. Rollason, G., and Sefton, M., Thromb. Res. 44, 517 (1986).
20. Flory, P. J., "Principles of Polymer Chemistry," p. 584. Cornell Univ. Press, New York, 1954.
21. Seigel, R., and Firestone, B. A., Macromolecules 21, 3254 (1988).
22. Hoffman, A. S., Afrassiabi, A., and Dong, L. C., J. Controlled Release 4, 213 ( 1986 ).
23. Widder, K., Flouter, G., and Senyei, A., J. Pharm. Sci. 68, 79 (1979).
24. Andrade, J. D., and Chert, W. Y., Surf. Interface Anal. 8, 253 (1986).
25. King, R. N., Andrade, J. D., Ma, S. M., Gregonis, D. E., and Brostrom, L R., J. Colloid Interface Sci. 103, 62 (1985).
26. Norde, W., in "Microspheres and Drug Therapy: Pharmaceutical, Immunological and Medical As- pects" (S. S. Davis, L. Illum, J. G. McVie, and E. Tomliuson, Eds.), p. 43. Elsevier, Amsterdam, 1984.
27. Ratner, B. D., in "Biocompatibility of Clinical Implant Material" (D. F. Williams, Ed.), p. 145. CRC Press, Boca Raton, FL, 1981.
Journal of ColloM and Interface Science, Vol. 143, No. 2, May 1991