preparation and evaluation of coal-derived activated carbons for removal of mercury vapor from...
TRANSCRIPT
Preparation and Evaluation of Coal-Derived ActivatedCarbons for Removal of Mercury Vapor from Simulated
Coal Combustion Flue Gases
Hsing-Cheng Hsi,†,‡ Shiaoguo Chen,‡ Massoud Rostam-Abadi,*,†,‡ Mark J. Rood,†Carl F. Richardson,§ Todd R. Carey,§ and Ramsay Chang|
Environmental Engineering and Science Program, Department of Civil and EnvironmentalEngineering, University of Illinois at Urbana-Champaign, 205 North Mathews Avenue,
Urbana, Illinois 61801, Illinois State Geological Survey, 615 East Peabody Drive, Champaign,Illinois 61820, Radian International L.L.C., Austin, Texas 78720-1088, and Electric Power
Research Institute, Palo Alto, California 20036
Received May 5, 1998
Coal-derived activated carbons (CDACs) were tested for their suitability in removing traceamounts of vapor-phase mercury from simulated flue gases generated by coal combustion. CDACswere prepared in bench-scale and pilot-scale fluidized-bed reactors with a three-step process,including coal preoxidation, carbonization, and then steam activation. CDACs from high-organic-sulfur Illinois coals had a greater equilibrium Hg0 adsorption capacity than activated carbonsprepared from a low-organic-sulfur Illinois coal. When a low-organic-sulfur CDAC wasimpregnated with elemental sulfur at 600 °C, its equilibrium Hg0 adsorption capacity wascomparable to the adsorption capacity of the activated carbon prepared from the high-organic-sulfur coal. X-ray diffraction and sulfur K-edge X-ray absorption near-edge structure examinationsshowed that the sulfur in the CDACs was mainly in organic forms. These results suggestedthat a portion of the inherent organic sulfur in the starting coal, which remained in the CDACs,played an important role in adsorption of Hg0. Besides organic sulfur, the BET surface area andmicropore area of the CDACs also influenced Hg0 adsorption capacity. The HgCl2 adsorptioncapacity was not as dependent on the surface area and concentration of sulfur in the CDACs aswas adsorption of Hg0. The properties and mercury adsorption capacities of the CDACs werecompared with those obtained for commercial Darco FGD carbon.
Introduction
The U.S. Clean Air Act Amendments of 1990 listed188 substances as hazardous air pollutants, of which37 substances have been detected in power plant emis-sions.1 Of the 37 hazardous air pollutants, 11 are tracemetals such as mercury. It is of concern because of theperceived risks, it occurs mainly in the vapor form, andbecause it is not captured effectively by existing par-ticulate removal systems.
Worldwide, between 2000 and 4000 tons of mercuryare emitted to the atmosphere from anthropogenicsources2 and about 900 tons of mercury are emitted tothe atmosphere from natural sources each year.3 How-ever, the U.S. Environmental Protection Agency re-ported that 5500 tons of mercury are emitted to theatmosphere from anthropogenic (about 50 tons fromcoal-fired power plants in the United States) andnatural sources annually.4 Once deposited on soils or
water bodies, mercury may bioconcentrate in vegetationand fish.5 It can also be absorbed and accumulated inhumans.6
The concentration of mercury in flue gases generatedby coal-fired power plants (CFPPs) typically ranges from1 to 10 µg/m3.1 Mercury is present in both elementaland oxidized forms, but relative amounts of eachmercury species strongly depend on the concentrationof mercury in the coal4 (0.01 ppmm up to 3.3 ppmm inbituminous coal7) and conditions during combustionsuch as gas residence time, temperature, and gascomposition.8 In the combustion zone (1200-1400 °C),mercury is vaporized from the coal and exists aselemental mercury (Hg0). As the flue gas temperaturedecreases, Hg0 is partially oxidized to form Hg2+ andpartitions between gas, liquid, or solid phases.8,9 Hg0
† Department of Civil and Environmental Engineering, Universityof Illinois at Urbana-Champaign.
‡ Illinois State Geological Survey.§ Radian International, L.L.C.| Electric Power Research Institute.(1) Chang R.; Owens, D. EPRI J. 1994, July/August, 46.(2) Porcella, D. B.; Ramel, C.; Jernelov, A. Water, Air, Soil Pollut.
1997, 97, 205.(3) Nriagu, J. O. Nature 1989, 338, 47.
(4) U.S. Environmental Protection Agency. Mercury Study Reportto Congress, Volume 1: Executive Summary; Office of Air QualityPlanning and Standards: Washington, DC, December 1997.
(5) Hakanson, L.; Nilsson, A.; Anderson, T. Environ. Pollut. 1988,49, 145.
(6) Bidstrup, P. C. Toxicity of Mercury and its Compounds; ElsevierScience, Inc.: Amsterdam, 1964.
(7) Livengood, C. D.; Huang, H. S.; Wu, J. M. Presented at the 87thAnnual Meeting of the Air and Waste Management Association,Cincinnati, OH, June 1994; 94-RA114A.04.
(8) Galbreath, K. C.; Zygarlicke, C. J. Environ. Sci. Technol. 1996,30, 2421.
1061Energy & Fuels 1998, 12, 1061-1070
10.1021/ef9801064 CCC: $15.00 © 1998 American Chemical SocietyPublished on Web 10/09/1998

is more difficult to remove from the flue gas streamsbecause of its low melting point (-38.9 °C),10 highequilibrium vapor pressure (0.25 Pa at 25 °C),11 and lowsolubility in water (6 × 10⁻⁵ g/L at 25 °C).12 Mercuricchloride (HgCl2) is more water soluble (69 g/L at 25 °C)10
than Hg0, therefore, it is more readily removed from fluegas streams by conventional air pollution control devicessuch as wet scrubbers.13
Carbon-based processes (e.g., direct injection and fixedbed) have been developed for removal of mercury fromgas streams generated by municipal- and hazardous-waste incinerators.14,15 Available data from the incin-erators provide some insight into mercury control, butthese data cannot be used directly for coal-fired utilitiesbecause the mercury concentrations, species, and pro-cess conditions of incinerators differ greatly from CF-PPs.1 For example, flue gases generated by municipal-waste combustors (MWCs) contain mercury concentra-tions (200-1000 µg/Nm3) that are 1-2 orders of mag-nitude greater than mercury concentrations in fluegases generated by CFPPs.
Injection of activated carbon upstream of a particulate-control system has the potential of providing a low-costoption for control of mercury emissions from utility fluegases.1 In carbon injection processes, a large carbon/mercury ratio (10000-100000 on a weight basis) isrequired to achieve >90% removal efficiency for mer-cury.1 The large C/Hg ratio could be a result of eithermass-transfer limitations,16 limited mercury adsorptioncapacity of carbon because of the extremely smallconcentrations of mercury in the flue gas, or the limitedreactivity of the carbon. To reduce the operating costof the carbon injection process, either a more efficientadsorbent that can operate at a smaller C/Hg ratio, ora lower-cost adsorbent, or both are required.
Sulfur-impregnated activated carbon has been shownto be an effective sorbent for the removal of vapor-phaseHg0 from CFPP and MWC flue gases.17-21 This materialhas a large mercury adsorption capacity, but the addi-
tion of sulfur to activated carbon requires additionalproduction costs. To avoid such processing steps, it maybe possible to produce activated carbons from a precur-sor that already contains sulfur.
The actual relationships between sorbent character-istics, such as pore size, pore volume, surface area, andsurface chemistry, and vapor-phase Hg0 and HgCl2adsorption onto activated carbon are not well under-stood. A sorbent development program was initiatedto address how sorbent properties affect vapor-phasemercury adsorption and to develop low-cost, customizedsorbents based on the improved understanding of keysorbent characteristics. In Phase I of the program,presented in this paper, activated carbons with a widerange of pore sizes, pore volumes, surface areas, andsulfur contents were prepared from low- and high-organic-sulfur Illinois coals. The physical and chemicalproperties of the activated carbons were determined andused to explain their Hg0 and HgCl2 adsorption capaci-ties.
Experimental Section
Sample Preparation. Four high-organic-sulfur Illinoisbituminous coals (IBC-107, C-2, C-3, and M-2) and one low-organic-sulfur Illinois bituminous coal (IBC-109) were selectedfor testing (Table 1). The IBC-107 and IBC-109 coals wereobtained from the Illinois Basin Coal Sample Program.22
These coals have been stored at room temperatures undernitrogen for about 10 years. C-2, C-3, and M-2 were obtainedfrom several active coal mines in Illinois. Samples wereinitially crushed to about 5-mm size particles and thenpulverized (Holmes model 500) and ground (Quaker City model4-E) to decrease the particle size to <1 mm. Samples weresubsequently sieved with U.S. standard sieves (tyler standardscreen) to obtain -16 + 65 mesh (1.000-0.210 mm) samples.
Coal-derived activated carbons (CDACs) were prepared inbench- and pilot-scale reactors. Bench-scale experiments wereperformed in a batch, 5-cm i.d. fluidized-bed reactor. Theobjectives of the experiments were to (1) prepare CDACs withselected sulfur contents, surface areas, and pore structures,(2) evaluate the influence of inherent sulfur of the coalprecursors on the mercury adsorption capacity of the resultantCDACs, and (3) obtain scale-up data for producing largerquantities of CDAC in the pilot-scale reactor. Two series, ACand FBR, of CDACs were prepared using a three-step process.Typically, about 100-g samples of sieved coal are preoxidized(air, 225 °C, 1-3 h), carbonized (N2, 400 °C, 1 h) to form char,
(9) Senior, C. L.; Bool, L. E., III; Huffman, G. P.; Huggins, F. E.;Shah, N.; Sarofim, A.; Olmez, I.; Zeng, T. Presented at the 90th AnnualMeeting and Exhibition of the Air and Waste Management Association,Toronto, Canada, June 1997; 97-WP72B.08.
(10) CRC Handbook of Chemistry and Physics, 64th ed.; Weast, R.C., Ed.; CRC Press: Boca Raton, FL, 1983.
(11) Schroedor, W. H.; Yarwood, G.; Niki, H. Water, Air, Soil Pollut.1991, 56, 653.
(12) Schuster, E. Water, Air, Soil Pollut. 1991, 56, 667.(13) Volland, C. S. Presented at the 84th Annual Meeting and
Exhibition of the Air and Waste Management Association, Vancouver,BC, 1991; 91-35.1.
(14) Haythornthwaite, S.; Sjostrom, S.; Ebner, T.; Ruhl, J.; Slye, R.;Smith, J.; Hunt, T.; Chang, R.; Brown, T. D. Presented at the EPRI-DOE-EPA Combined Utility Air Pollutant Control Symposium, Wash-ington, DC, 1997.
(15) Waugh, E. G.; Jensen, B. K.; Lapatnick, L. N.; Gibbons, F. X.;Sjostrom, S.; Ruhl, J.; Slye, R.; Chang, R. Presented at the EPRI-DOE-EPA Combined Utility Air Pollutant Control Symposium, Washington,DC, 1997.
(16) Rostam-Abadi, M.; Chen, S.; Hsi, H.-C.; Rood, M.; Chang, R.;Carey, T.; Hargrove, B.; Richardson, C.; Rosenhoover, W.; Meserole,F. Presented at the EPRI-DOE-EPA Combined Utility Air PollutantControl Symposium, Washington, DC, 1997.
(17) Otani, Y.; Emi, H.; Kanaoka, C.; Uchijima, I.; Nishino, H.Environ. Sci. Technol. 1988, 22, 708.
(18) Teller, A. J.; Quimby, J. M. Presented at the 84th AnnualMeeting of the Air & Waste Management Association, Vancouver,Canada, June 1991; 91-35.5.
(19) Krishnan, S. V.; Gullett, B. K.; Jozewicz, W. Environ. Sci.Technol. 1994, 28, 1506.
(20) Vidic, R. D.; McLaughlin, J. B. J. Air Waste Manage. Assoc.1996, 46, 241.
(21) Korpiel, J. A.; Vidic, R. D. Environ. Sci. Technol. 1997, 31, 2319.(22) Illinois State Geological Survey. Illinois Basin Coal Sample
Program Handbook, 1996.
Table 1. Ultimate and Sulfur Analyses of Coal Samples
coal sample
property IBC-107 C-2 C-3 M-2 IBC-109
moisture 9.3 13.7 11.9 12.7 9.2asha,b 11.5 9.7 12.0 9.7 8.3carbona 68.2 72.0 70.1 72.1 75.2hydrogena 4.9 5.2 5.1 5.2 5.0nitrogena 1.2 1.3 1.3 1.2 1.7oxygena 10.5 7.7 7.5 7.9 8.6sulfura 3.7 4.1 4.0 3.9 1.2
sulfatic sulfura 0.2 0.0 0.1 0.0 0.0pyritic sulfura 0.4 1.1 1.0 0.9 0.4organic sulfura 2.9 3.0 3.0 3.0 0.7
total 100.0 100.0 100.0 100.0 100.0a Moisture-free values. b At 750 °C with air.
1062 Energy & Fuels, Vol. 12, No. 6, 1998 Hsi et al.
and then activated with steam (50% H2O/50% N2, 825 °C, 1-7h) to produce CDACs (Table 2). AC-1 to AC-5 were preparedusing 1-3 h of activation time. CDACs in the AC-63 and FBR-45 series were prepared at activation times ranging from 1 to7 h. For example, AC-63-3 refers to an AC-63 prepared using3 h of activation time. FBR-35 to FBR-44 tests were aimedat optimizing the processing conditions and identifying a feedcoal for the pilot-scale carbon production tests.
The pilot-scale reactor was a batch, 48-cm i.d. fluidized-bedreactor located at Svedala Industries, Inc., in Oak Creek, WI.It was used to produce more than 60 kg of CDAC carbon fromC-2 coal. The processing conditions employed in the pilotcarbon production runs were comparable to those identifiedduring the bench-scale studies, except that about 50 kg of 60mesh (<0.250 mm) coal is typically used. The pilot-scalecarbon production study has been described elsewhere.14-16
For characterization and mercury adsorption tests, a 2.5-galiquot of CDAC was ground (Spec Agate laboratory mill/grinder) for 10 min. The mass median particle size of thesamples after grinding was 15-20 µm (Microtrac II analyzer).
One commercial lignite-based activated carbon, Darco FGDmanufactured by American Norit, was also studied. This FGDhas been studied for the removal of mercury from flue gasesgenerated by CFPPs and MWCs.23 The process conditionsused for manufacture of the FGD carbon are not known.
Sample Characterization. The specific surface area, porevolume, and pore-size distribution of the original coal samplesand the resulting CDACs were determined by N2 adsorptionat 77 K (P/P0 ) 10-3) (Micromeritics ASAP2400 analyzer).Samples were degassed at 10-20 µTorr at 150 °C for 24 hbefore adsorption measurements. The specific surface areawas calculated with the BET (Brunauer, Emmett, and Teller)equation.24 Micropore surface area and volume were calcu-lated using t-plot analysis with the Jura-Harkins equation:t ) [13.99/(0.0340 - log(P/Po)]0.5.25 The thickness t values usedin the least-squares analysis were between 4.5 and 8.0 Å. Themicropore-size distribution was determined by the MP method,which is an extension of t-plot analysis proposed by Mikhailet al.26 Pore sizes smaller than 5 Å are not accuratelymeasured when using the MP method. Nitrogen adsorptionat 77 K is a standard procedure for characterizing microporousadsorbents.27 For most pore-size distribution methods, a lowrelative adsorptive pressure is required to obtain the structuralinformation for micropores. The MP method, however, canprovide detailed pore-size distribution information for poresbetween 5 and 20 Å at the lowest relative pressure (P/P0 )10-3) used for measuring the nitrogen adsorption isotherm at77 K.28 Recent results from our research group also suggestthat the MP method is an effective method for characterizingmicroporous adsorbent despite its theoretical limitations as-sociated with adsorption on nonporous materials.29
Mesopore- and macropore-size distributions were calculatedby the Barret-Joyner-Halenda (BJH) method.30 Ultimateand sulfur analyses of the original coal samples and resultingCDACs were measured by LECO MAC-d SC-32 systemsaccording to ASTM methods D5373-93 and D4239-94, respec-tively.
Sulfur functional group characterization of several CDACswas obtained from a least-squares analysis of sulfur K-edgeX-ray absorption near-edge structure (XANES) spectra.31 Thesulfur K-edge X-ray absorption fine structure (XAFS) spectrawere obtained at beam-line X-19A of the National SynchrotronLight Source (NSLS). The tests were performed at theBrookhaven National Laboratory, NY. Selected samples werealso examined by X-ray diffraction (XRD) to identify thepresence of any inorganic sulfur compounds in the CDACs.
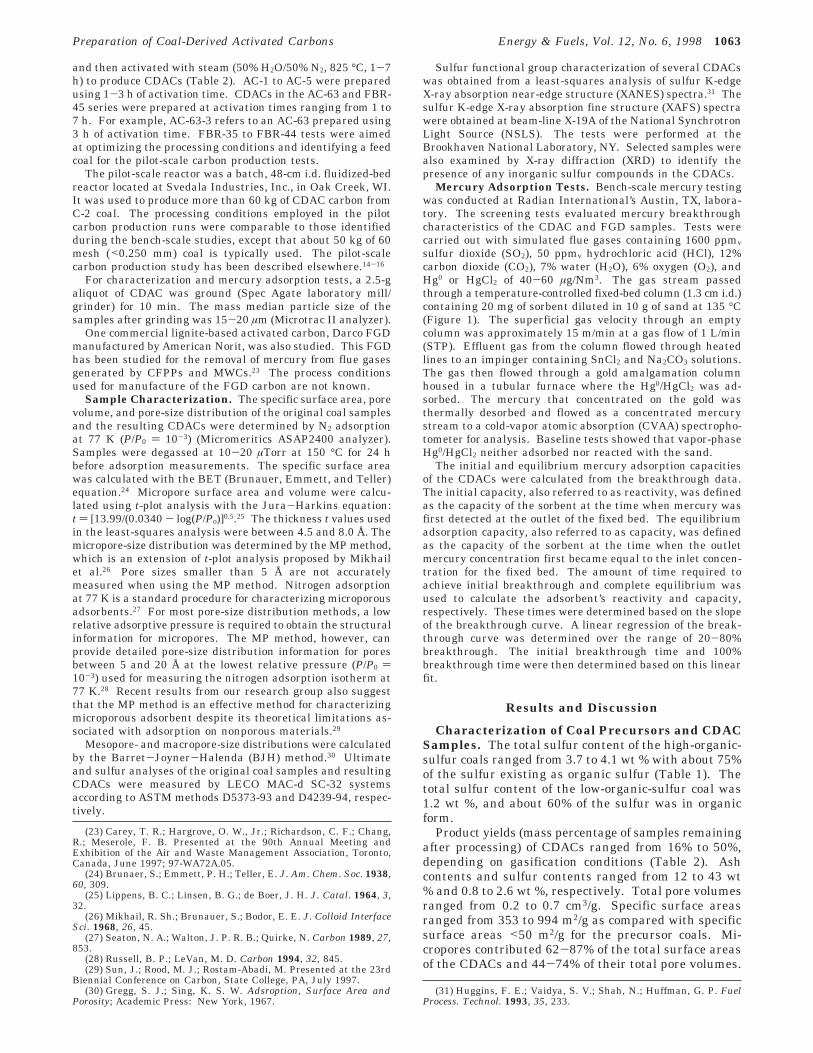
Mercury Adsorption Tests. Bench-scale mercury testingwas conducted at Radian International’s Austin, TX, labora-tory. The screening tests evaluated mercury breakthroughcharacteristics of the CDAC and FGD samples. Tests werecarried out with simulated flue gases containing 1600 ppmv
sulfur dioxide (SO2), 50 ppmv hydrochloric acid (HCl), 12%carbon dioxide (CO2), 7% water (H2O), 6% oxygen (O2), andHg0 or HgCl2 of 40-60 µg/Nm3. The gas stream passedthrough a temperature-controlled fixed-bed column (1.3 cm i.d.)containing 20 mg of sorbent diluted in 10 g of sand at 135 °C(Figure 1). The superficial gas velocity through an emptycolumn was approximately 15 m/min at a gas flow of 1 L/min(STP). Effluent gas from the column flowed through heatedlines to an impinger containing SnCl2 and Na2CO3 solutions.The gas then flowed through a gold amalgamation columnhoused in a tubular furnace where the Hg0/HgCl2 was ad-sorbed. The mercury that concentrated on the gold wasthermally desorbed and flowed as a concentrated mercurystream to a cold-vapor atomic absorption (CVAA) spectropho-tometer for analysis. Baseline tests showed that vapor-phaseHg0/HgCl2 neither adsorbed nor reacted with the sand.
The initial and equilibrium mercury adsorption capacitiesof the CDACs were calculated from the breakthrough data.The initial capacity, also referred to as reactivity, was definedas the capacity of the sorbent at the time when mercury wasfirst detected at the outlet of the fixed bed. The equilibriumadsorption capacity, also referred to as capacity, was definedas the capacity of the sorbent at the time when the outletmercury concentration first became equal to the inlet concen-tration for the fixed bed. The amount of time required toachieve initial breakthrough and complete equilibrium wasused to calculate the adsorbent’s reactivity and capacity,respectively. These times were determined based on the slopeof the breakthrough curve. A linear regression of the break-through curve was determined over the range of 20-80%breakthrough. The initial breakthrough time and 100%breakthrough time were then determined based on this linearfit.
Results and Discussion
Characterization of Coal Precursors and CDACSamples. The total sulfur content of the high-organic-sulfur coals ranged from 3.7 to 4.1 wt % with about 75%of the sulfur existing as organic sulfur (Table 1). Thetotal sulfur content of the low-organic-sulfur coal was1.2 wt %, and about 60% of the sulfur was in organicform.
Product yields (mass percentage of samples remainingafter processing) of CDACs ranged from 16% to 50%,depending on gasification conditions (Table 2). Ashcontents and sulfur contents ranged from 12 to 43 wt% and 0.8 to 2.6 wt %, respectively. Total pore volumesranged from 0.2 to 0.7 cm3/g. Specific surface areasranged from 353 to 994 m2/g as compared with specificsurface areas <50 m2/g for the precursor coals. Mi-cropores contributed 62-87% of the total surface areasof the CDACs and 44-74% of their total pore volumes.
(23) Carey, T. R.; Hargrove, O. W., Jr.; Richardson, C. F.; Chang,R.; Meserole, F. B. Presented at the 90th Annual Meeting andExhibition of the Air and Waste Management Association, Toronto,Canada, June 1997; 97-WA72A.05.
(24) Brunaer, S.; Emmett, P. H.; Teller, E. J. Am. Chem. Soc. 1938,60, 309.
(25) Lippens, B. C.; Linsen, B. G.; de Boer, J. H. J. Catal. 1964, 3,32.
(26) Mikhail, R. Sh.; Brunauer, S.; Bodor, E. E. J. Colloid InterfaceSci. 1968, 26, 45.
(27) Seaton, N. A.; Walton, J. P. R. B.; Quirke, N. Carbon 1989, 27,853.
(28) Russell, B. P.; LeVan, M. D. Carbon 1994, 32, 845.(29) Sun, J.; Rood, M. J.; Rostam-Abadi, M. Presented at the 23rd
Biennial Conference on Carbon, State College, PA, July 1997.(30) Gregg, S. J.; Sing, K. S. W. Adsroption, Surface Area and
Porosity; Academic Press: New York, 1967.(31) Huggins, F. E.; Vaidya, S. V.; Shah, N.; Huffman, G. P. Fuel
Process. Technol. 1993, 35, 233.
Preparation of Coal-Derived Activated Carbons Energy & Fuels, Vol. 12, No. 6, 1998 1063
There were no significant differences between thephysical and chemical properties of the bench- and pilot-scale CDACs.
In the AC-63 and FBR-45 series carbon productiontests, increasing the activation time (up to 6 h for AC-63 and 3 h for FBR-45) resulted in an increasing surfacearea, an increasing pore volume, an increasing ashcontent, and a decreasing total sulfur content of thesamples. In both series of tests, the maximum surfacearea and micropore volume of the CDACs were about
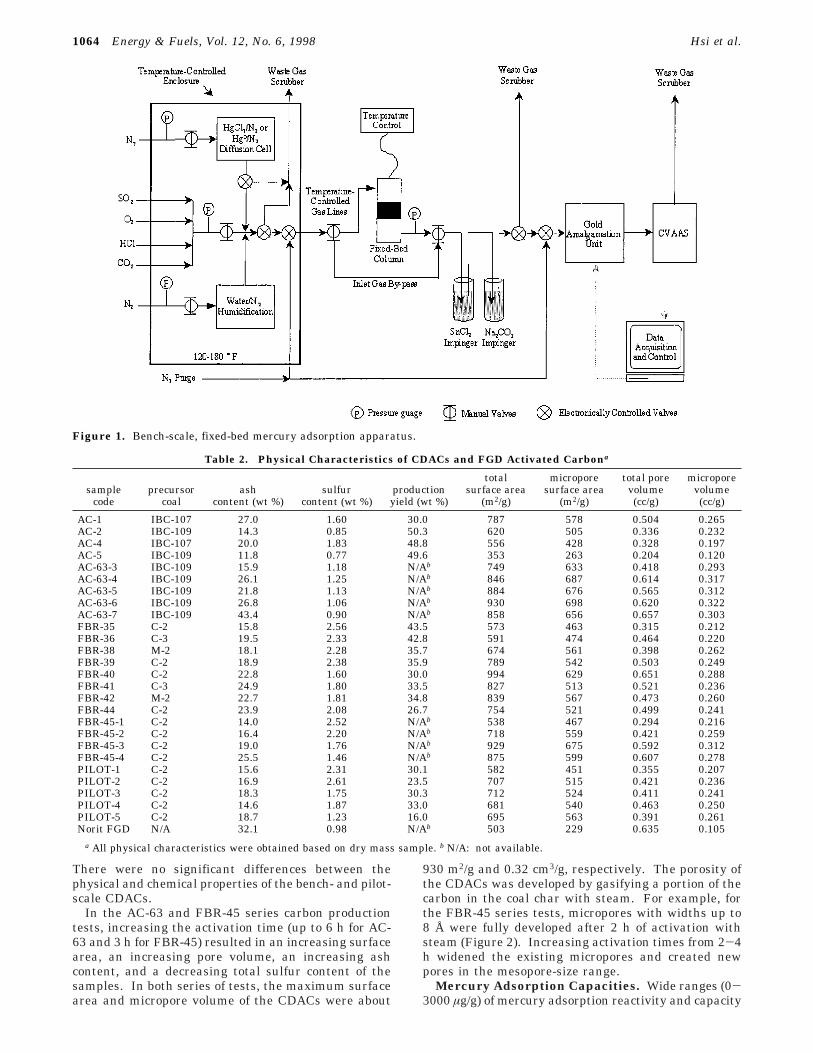
930 m2/g and 0.32 cm3/g, respectively. The porosity ofthe CDACs was developed by gasifying a portion of thecarbon in the coal char with steam. For example, forthe FBR-45 series tests, micropores with widths up to8 Å were fully developed after 2 h of activation withsteam (Figure 2). Increasing activation times from 2-4h widened the existing micropores and created newpores in the mesopore-size range.
Mercury Adsorption Capacities. Wide ranges (0-3000 µg/g) of mercury adsorption reactivity and capacity
Figure 1. Bench-scale, fixed-bed mercury adsorption apparatus.
Table 2. Physical Characteristics of CDACs and FGD Activated Carbona
samplecode
precursorcoal
ashcontent (wt %)
sulfurcontent (wt %)
productionyield (wt %)
totalsurface area
(m2/g)
microporesurface area
(m2/g)
total porevolume(cc/g)
microporevolume(cc/g)
AC-1 IBC-107 27.0 1.60 30.0 787 578 0.504 0.265AC-2 IBC-109 14.3 0.85 50.3 620 505 0.336 0.232AC-4 IBC-107 20.0 1.83 48.8 556 428 0.328 0.197AC-5 IBC-109 11.8 0.77 49.6 353 263 0.204 0.120AC-63-3 IBC-109 15.9 1.18 N/Ab 749 633 0.418 0.293AC-63-4 IBC-109 26.1 1.25 N/Ab 846 687 0.614 0.317AC-63-5 IBC-109 21.8 1.13 N/Ab 884 676 0.565 0.312AC-63-6 IBC-109 26.8 1.06 N/Ab 930 698 0.620 0.322AC-63-7 IBC-109 43.4 0.90 N/Ab 858 656 0.657 0.303FBR-35 C-2 15.8 2.56 43.5 573 463 0.315 0.212FBR-36 C-3 19.5 2.33 42.8 591 474 0.464 0.220FBR-38 M-2 18.1 2.28 35.7 674 561 0.398 0.262FBR-39 C-2 18.9 2.38 35.9 789 542 0.503 0.249FBR-40 C-2 22.8 1.60 30.0 994 629 0.651 0.288FBR-41 C-3 24.9 1.80 33.5 827 513 0.521 0.236FBR-42 M-2 22.7 1.81 34.8 839 567 0.473 0.260FBR-44 C-2 23.9 2.08 26.7 754 521 0.499 0.241FBR-45-1 C-2 14.0 2.52 N/Ab 538 467 0.294 0.216FBR-45-2 C-2 16.4 2.20 N/Ab 718 559 0.421 0.259FBR-45-3 C-2 19.0 1.76 N/Ab 929 675 0.592 0.312FBR-45-4 C-2 25.5 1.46 N/Ab 875 599 0.607 0.278PILOT-1 C-2 15.6 2.31 30.1 582 451 0.355 0.207PILOT-2 C-2 16.9 2.61 23.5 707 515 0.421 0.236PILOT-3 C-2 18.3 1.75 30.3 712 524 0.411 0.241PILOT-4 C-2 14.6 1.87 33.0 681 540 0.463 0.250PILOT-5 C-2 18.7 1.23 16.0 695 563 0.391 0.261Norit FGD N/A 32.1 0.98 N/Ab 503 229 0.635 0.105
a All physical characteristics were obtained based on dry mass sample. b N/A: not available.
1064 Energy & Fuels, Vol. 12, No. 6, 1998 Hsi et al.
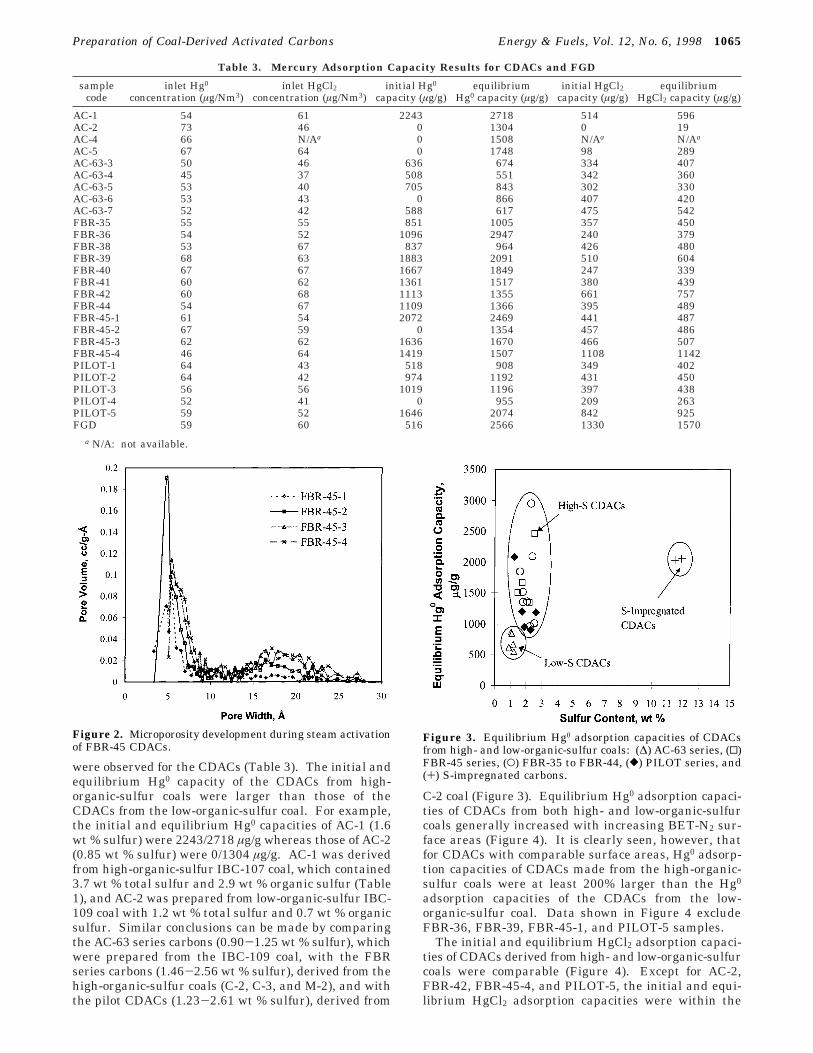
were observed for the CDACs (Table 3). The initial andequilibrium Hg0 capacity of the CDACs from high-organic-sulfur coals were larger than those of theCDACs from the low-organic-sulfur coal. For example,the initial and equilibrium Hg0 capacities of AC-1 (1.6wt % sulfur) were 2243/2718 µg/g whereas those of AC-2(0.85 wt % sulfur) were 0/1304 µg/g. AC-1 was derivedfrom high-organic-sulfur IBC-107 coal, which contained3.7 wt % total sulfur and 2.9 wt % organic sulfur (Table1), and AC-2 was prepared from low-organic-sulfur IBC-109 coal with 1.2 wt % total sulfur and 0.7 wt % organicsulfur. Similar conclusions can be made by comparingthe AC-63 series carbons (0.90-1.25 wt % sulfur), whichwere prepared from the IBC-109 coal, with the FBRseries carbons (1.46-2.56 wt % sulfur), derived from thehigh-organic-sulfur coals (C-2, C-3, and M-2), and withthe pilot CDACs (1.23-2.61 wt % sulfur), derived from
C-2 coal (Figure 3). Equilibrium Hg0 adsorption capaci-ties of CDACs from both high- and low-organic-sulfurcoals generally increased with increasing BET-N2 sur-face areas (Figure 4). It is clearly seen, however, thatfor CDACs with comparable surface areas, Hg0 adsorp-tion capacities of CDACs made from the high-organic-sulfur coals were at least 200% larger than the Hg0
adsorption capacities of the CDACs from the low-organic-sulfur coal. Data shown in Figure 4 excludeFBR-36, FBR-39, FBR-45-1, and PILOT-5 samples.
The initial and equilibrium HgCl2 adsorption capaci-ties of CDACs derived from high- and low-organic-sulfurcoals were comparable (Figure 4). Except for AC-2,FBR-42, FBR-45-4, and PILOT-5, the initial and equi-librium HgCl2 adsorption capacities were within the
Table 3. Mercury Adsorption Capacity Results for CDACs and FGD
samplecode
inlet Hg0
concentration (µg/Nm3)inlet HgCl2
concentration (µg/Nm3)initial Hg0
capacity (µg/g)equilibrium
Hg0 capacity (µg/g)initial HgCl2
capacity (µg/g)equilibrium
HgCl2 capacity (µg/g)
AC-1 54 61 2243 2718 514 596AC-2 73 46 0 1304 0 19AC-4 66 N/Aa 0 1508 N/Aa N/Aa
AC-5 67 64 0 1748 98 289AC-63-3 50 46 636 674 334 407AC-63-4 45 37 508 551 342 360AC-63-5 53 40 705 843 302 330AC-63-6 53 43 0 866 407 420AC-63-7 52 42 588 617 475 542FBR-35 55 55 851 1005 357 450FBR-36 54 52 1096 2947 240 379FBR-38 53 67 837 964 426 480FBR-39 68 63 1883 2091 510 604FBR-40 67 67 1667 1849 247 339FBR-41 60 62 1361 1517 380 439FBR-42 60 68 1113 1355 661 757FBR-44 54 67 1109 1366 395 489FBR-45-1 61 54 2072 2469 441 487FBR-45-2 67 59 0 1354 457 486FBR-45-3 62 62 1636 1670 466 507FBR-45-4 46 64 1419 1507 1108 1142PILOT-1 64 43 518 908 349 402PILOT-2 64 42 974 1192 431 450PILOT-3 56 56 1019 1196 397 438PILOT-4 52 41 0 955 209 263PILOT-5 59 52 1646 2074 842 925FGD 59 60 516 2566 1330 1570
a N/A: not available.
Figure 2. Microporosity development during steam activationof FBR-45 CDACs.
Figure 3. Equilibrium Hg0 adsorption capacities of CDACsfrom high- and low-organic-sulfur coals: (∆) AC-63 series, (0)FBR-45 series, (O) FBR-35 to FBR-44, ([) PILOT series, and(+) S-impregnated carbons.
Preparation of Coal-Derived Activated Carbons Energy & Fuels, Vol. 12, No. 6, 1998 1065

range of 415.5 ( 219.8 and 480.0 ( 217.0 µg/g, respec-tively. Such observation implies that for the CDACs,the adsorption of HgCl2 was not as dependent on theBET surface area and the concentration of sulfur in theprecursor coal as for adsorption of Hg0.
The Hg0 and HgCl2 adsorption capacities of the pilotCDACs were comparable to the bench samples, e.g.,FBR-series CDACs (Tables 2 and 3). These dataconfirm that scale-up of the activated carbon productionwas successful, and the CDACs could be manufacturedon a larger scale.
Further examination of the CDAC samples derivedfrom high-organic-sulfur C-2 coal revealed that equi-librium Hg0 adsorption capacities generally decreasedand HgCl2 remained the same with increasing totalsulfur content (Tables 2 and 3). This observationsuggests that the greater total sulfur content in a CDACdid not guarantee larger Hg0 adsorption capacities. Inaddition to the BET surface area, other properties ofactivated carbon, such as pore structure, forms, amounts,and distributions of sulfur functional groups, probablyinfluenced mercury adsorption as well.
Statistical analyses were performed (SPSS Ver. 7.5)in an attempt to gain a better understanding of therelationships between the physical and chemical changesthat occurred during the preparation of CDACs andpotential interdependencies of the mercury adsorptioncapacity on properties of the CDACs. A correlation testwas carried out to evaluate the relationship betweenpairs of micropore volume/surface area, micropore vol-ume/sulfur content, and surface area/sulfur content.Pearson correlation coefficients for these pairs were0.84, -0.64, and -0.62, respectively (the two-tailedsignificance values were 0.000, 0.006, and 0.008, re-spectively, at the 99% confidence level). The generaltrends obtained from these analyses were expected. Theporosity, mainly micoporosity (Table 2), of CDAC wasdeveloped by gasifying a portion of the carbon in thecoal char with steam (Figure 2). Desulfurization reac-tions, which will be discussed later, also occurred duringactivation with steam (see data for FBR-45 series, Table2). Therefore, the surface area and microporosity of thechar increased and its total sulfur content decreasedwith increasing activation time. The Pearson correla-tion coefficients reflect the relationships between the
physical and chemical changes that occurred during thepreparation of CDACs.
Multiple regression analyses were performed with 17sets of data from the bench-scale (FBR-series) and pilot-scale (PILOT-series) tests. A 95% confidence level wasused to determine the statistical significance. Thespecific surface area, total sulfur content, and reactortype (i.e., bench scale or pilot scale) were used asindependent variables. Mercury adsorption capacitieswithin the range described by the mean ( 1 standarddeviation of the raw data were included in the analyses.The correlation coefficient (R) for the equilibrium Hg0
adsorption capacity with the independent variables was0.95. The specific surface area was the only indepen-dent variable that was correlated to the Hg0 adsorptioncapacity. This result is consistent with the resultsprovided in Figure 4. There was no correlation of theother independent variables with Hg0 adsorption capac-ity. None of the independent variables were correlatedwith HgCl2 adsorption capacity (R ) 0.44). Theseresults imply that the surface area, total sulfur content,and reactor type had small influences on the equilibriumadsorption capacity of HgCl2 with CDACs. The lack ofa statistical correlation between adsorption capacitiesand reactor type also suggests that bench-scale andpilot-scale results can be used to describe properties ofthe CDAC for larger scale production of activated-carbonadsorbents.
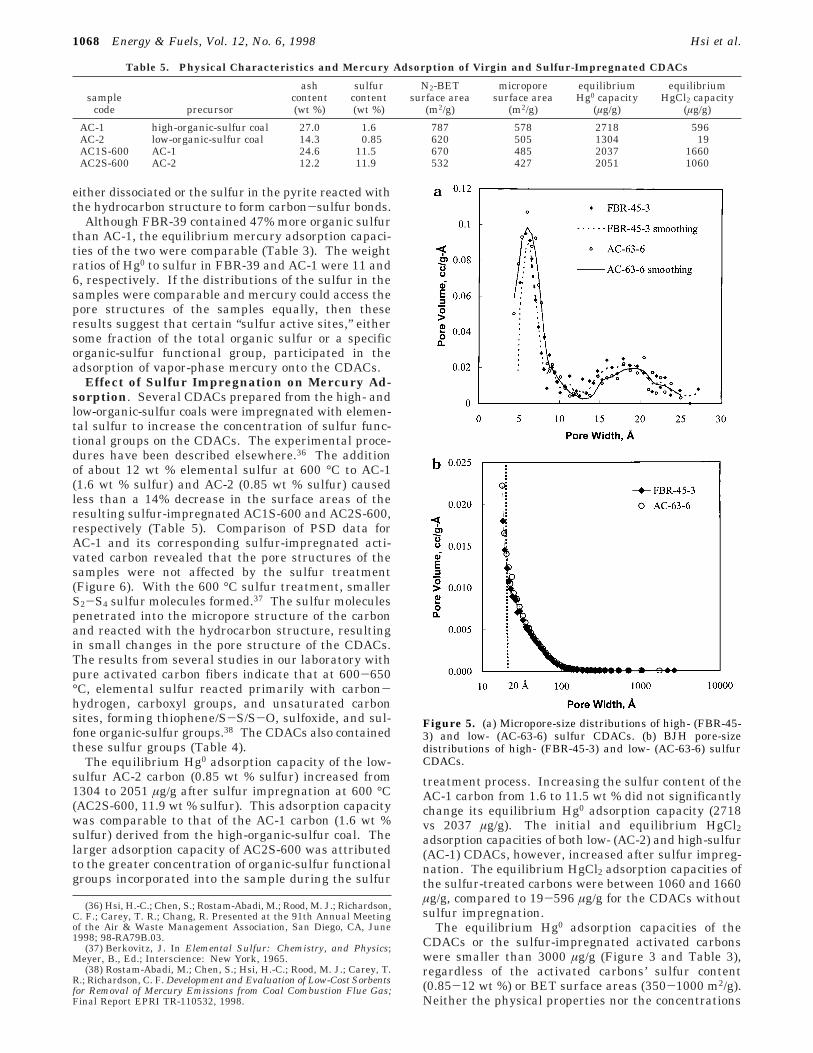
The influence of pore structure on Hg0 adsorption wasexamined by comparing the pore-size distributions(PSDs) for a high-sulfur CDAC (FBR-45-3, 1.76 wt %sulfur) and a low-sulfur CDAC (AC-63-6, 1.06 wt %sulfur). The CDACs all had similar pore-size ranges(Figure 5a and b), surface areas, micropore areas, andmicropore volumes (Table 2). The micropore areasoccupied more than 76% of the total pore areas, sug-gesting that this pore-size range was important foradsorption of Hg0 onto activated carbon. CDACs alsocontained some pores in the mesopore-size range (about20% of the total pore area). The initial and equilibriumHg0 adsorption capacities of FBR-45-3 CDAC were twicethat for AC-63-6 (1636/1670 vs 0/866 µg/g, Table 3).These results confirm that micropore and mesoporesurface areas in CDACs, alone, were not responsible foradsorption of Hg0 and that a larger concentration ofsulfur functional groups in FBR-45-3 was responsiblefor the larger adsorption capacity of this CDAC. Mi-cropore and mesopore surface areas represent poreareas contained in a wide range of pore sizes. Perhapscorrelation between adsorption capacities and a seriesof narrow pore-size ranges in the micropore and meso-pore regions would provide additional insight that couldhelp explain the role of a specific pore-size range onmercury adsorption.
Effect of Inherent Sulfur in Coal on MercuryAdsorption. Because the raw coals contained pyriticand organic sulfur, it was important to determine thetype and amount of each sulfur form remaining in theCDACs and their potential contributions to mercuryadsorption. On the basis of the sulfur and ash analysesof coals and CDACs, between 50% and 85% of theoriginal sulfur was released from the raw coal duringproduction of the CDACs. Sulfur is present in coalessentially as iron disulfides (FeS2, pyritic sulfur) or as
Figure 4. Equilibrium Hg0 and HgCl2 adsorption capacitycorrelated to BET surface area of CDACs.
1066 Energy & Fuels, Vol. 12, No. 6, 1998 Hsi et al.
organic sulfur. During carbonization, sulfur in coal ispartitioned among all three product phases, i.e., gas,liquid, and solid (char). In an inert atmosphere, pyritedecomposes to ferrous sulfide (FeS) and elementalsulfur. Decomposition begins at 300 °C and is completeat 600 °C.32 The elemental sulfur released from pyritedecomposition can polymerize and remain in the charor interact with the hydrocarbon matrix of the coal toform carbon-sulfur bonds.33 Sulfur fixation reactionscan take place between 350 and 500 °C.
During steam gasification of coal char, ferrous sulfideis converted to ferrous oxide (FexOy) and H2S.32
The carbon-steam and water-gas shift reactions alsooccur during steam activation of coal char. Hydrogenreleased by both reactions may react with carbon andferrous sulfide to enhance sulfur removal.
Organic sulfur in coal is believed to be divalent speciessuch as sulfides, disulfides, thiophenes, and thiols. Thechemistry of organic sulfur removal from coal is not wellunderstood. During carbonization, some of the organicsulfur complexes may decompose, yielding unsaturatedhydrocarbons and volatile H2S.34 Reaction of the un-saturated chain with H2S leads to the formation ofthiols. Some organic sulfur is thermally fixed into avery stable form and is difficult to remove from the coalchar. Under an inert atmosphere, a large fraction ofthe organic sulfur remains in the coal char even at 1000°C.32 At 850 °C, the activation temperature used in thisstudy, steam is relatively ineffective in the removal oforganic sulfur from coal char.35 Desulfurization byhydrogen may be involved in the overall chemistryduring steam activation.
Selected CDACs were examined by XANES to identifythe type and amount of the various sulfur compoundsin the samples. XANES data showed that organic-
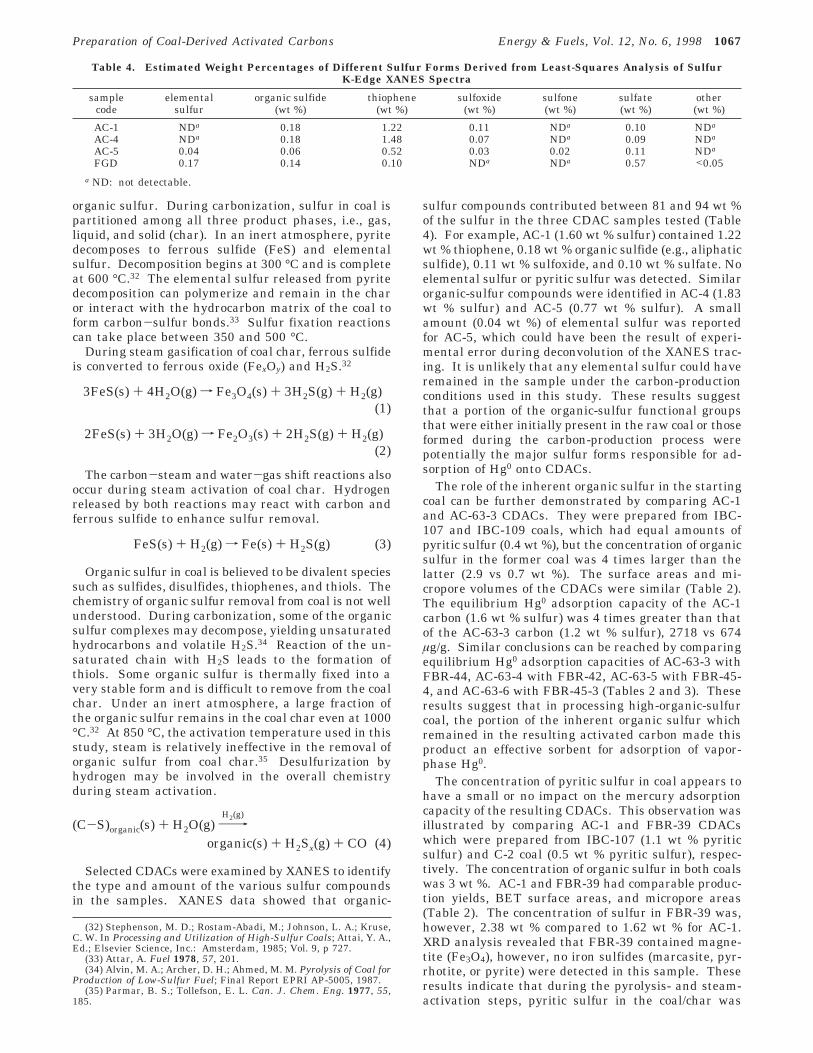
sulfur compounds contributed between 81 and 94 wt %of the sulfur in the three CDAC samples tested (Table4). For example, AC-1 (1.60 wt % sulfur) contained 1.22wt % thiophene, 0.18 wt % organic sulfide (e.g., aliphaticsulfide), 0.11 wt % sulfoxide, and 0.10 wt % sulfate. Noelemental sulfur or pyritic sulfur was detected. Similarorganic-sulfur compounds were identified in AC-4 (1.83wt % sulfur) and AC-5 (0.77 wt % sulfur). A smallamount (0.04 wt %) of elemental sulfur was reportedfor AC-5, which could have been the result of experi-mental error during deconvolution of the XANES trac-ing. It is unlikely that any elemental sulfur could haveremained in the sample under the carbon-productionconditions used in this study. These results suggestthat a portion of the organic-sulfur functional groupsthat were either initially present in the raw coal or thoseformed during the carbon-production process werepotentially the major sulfur forms responsible for ad-sorption of Hg0 onto CDACs.
The role of the inherent organic sulfur in the startingcoal can be further demonstrated by comparing AC-1and AC-63-3 CDACs. They were prepared from IBC-107 and IBC-109 coals, which had equal amounts ofpyritic sulfur (0.4 wt %), but the concentration of organicsulfur in the former coal was 4 times larger than thelatter (2.9 vs 0.7 wt %). The surface areas and mi-cropore volumes of the CDACs were similar (Table 2).The equilibrium Hg0 adsorption capacity of the AC-1carbon (1.6 wt % sulfur) was 4 times greater than thatof the AC-63-3 carbon (1.2 wt % sulfur), 2718 vs 674µg/g. Similar conclusions can be reached by comparingequilibrium Hg0 adsorption capacities of AC-63-3 withFBR-44, AC-63-4 with FBR-42, AC-63-5 with FBR-45-4, and AC-63-6 with FBR-45-3 (Tables 2 and 3). Theseresults suggest that in processing high-organic-sulfurcoal, the portion of the inherent organic sulfur whichremained in the resulting activated carbon made thisproduct an effective sorbent for adsorption of vapor-phase Hg0.
The concentration of pyritic sulfur in coal appears tohave a small or no impact on the mercury adsorptioncapacity of the resulting CDACs. This observation wasillustrated by comparing AC-1 and FBR-39 CDACswhich were prepared from IBC-107 (1.1 wt % pyriticsulfur) and C-2 coal (0.5 wt % pyritic sulfur), respec-tively. The concentration of organic sulfur in both coalswas 3 wt %. AC-1 and FBR-39 had comparable produc-tion yields, BET surface areas, and micropore areas(Table 2). The concentration of sulfur in FBR-39 was,however, 2.38 wt % compared to 1.62 wt % for AC-1.XRD analysis revealed that FBR-39 contained magne-tite (Fe3O4), however, no iron sulfides (marcasite, pyr-rhotite, or pyrite) were detected in this sample. Theseresults indicate that during the pyrolysis- and steam-activation steps, pyritic sulfur in the coal/char was
(32) Stephenson, M. D.; Rostam-Abadi, M.; Johnson, L. A.; Kruse,C. W. In Processing and Utilization of High-Sulfur Coals; Attai, Y. A.,Ed.; Elsevier Science, Inc.: Amsterdam, 1985; Vol. 9, p 727.
(33) Attar, A. Fuel 1978, 57, 201.(34) Alvin, M. A.; Archer, D. H.; Ahmed, M. M. Pyrolysis of Coal for
Production of Low-Sulfur Fuel; Final Report EPRI AP-5005, 1987.(35) Parmar, B. S.; Tollefson, E. L. Can. J. Chem. Eng. 1977, 55,
185.
Table 4. Estimated Weight Percentages of Different Sulfur Forms Derived from Least-Squares Analysis of SulfurK-Edge XANES Spectra
samplecode
elementalsulfur
organic sulfide(wt %)
thiophene(wt %)
sulfoxide(wt %)
sulfone(wt %)
sulfate(wt %)
other(wt %)
AC-1 NDa 0.18 1.22 0.11 NDa 0.10 NDa
AC-4 NDa 0.18 1.48 0.07 NDa 0.09 NDa
AC-5 0.04 0.06 0.52 0.03 0.02 0.11 NDa
FGD 0.17 0.14 0.10 NDa NDa 0.57 <0.05a ND: not detectable.
3FeS(s) + 4H2O(g) f Fe3O4(s) + 3H2S(g) + H2(g)(1)
2FeS(s) + 3H2O(g) f Fe2O3(s) + 2H2S(g) + H2(g)(2)
FeS(s) + H2(g) f Fe(s) + H2S(g) (3)
(C-S)organic(s) + H2O(g)98H2(g)
organic(s) + H2Sx(g) + CO (4)
Preparation of Coal-Derived Activated Carbons Energy & Fuels, Vol. 12, No. 6, 1998 1067
either dissociated or the sulfur in the pyrite reacted withthe hydrocarbon structure to form carbon-sulfur bonds.
Although FBR-39 contained 47% more organic sulfurthan AC-1, the equilibrium mercury adsorption capaci-ties of the two were comparable (Table 3). The weightratios of Hg0 to sulfur in FBR-39 and AC-1 were 11 and6, respectively. If the distributions of the sulfur in thesamples were comparable and mercury could access thepore structures of the samples equally, then theseresults suggest that certain “sulfur active sites,” eithersome fraction of the total organic sulfur or a specificorganic-sulfur functional group, participated in theadsorption of vapor-phase mercury onto the CDACs.
Effect of Sulfur Impregnation on Mercury Ad-sorption. Several CDACs prepared from the high- andlow-organic-sulfur coals were impregnated with elemen-tal sulfur to increase the concentration of sulfur func-tional groups on the CDACs. The experimental proce-dures have been described elsewhere.36 The additionof about 12 wt % elemental sulfur at 600 °C to AC-1(1.6 wt % sulfur) and AC-2 (0.85 wt % sulfur) causedless than a 14% decrease in the surface areas of theresulting sulfur-impregnated AC1S-600 and AC2S-600,respectively (Table 5). Comparison of PSD data forAC-1 and its corresponding sulfur-impregnated acti-vated carbon revealed that the pore structures of thesamples were not affected by the sulfur treatment(Figure 6). With the 600 °C sulfur treatment, smallerS2-S4 sulfur molecules formed.37 The sulfur moleculespenetrated into the micropore structure of the carbonand reacted with the hydrocarbon structure, resultingin small changes in the pore structure of the CDACs.The results from several studies in our laboratory withpure activated carbon fibers indicate that at 600-650°C, elemental sulfur reacted primarily with carbon-hydrogen, carboxyl groups, and unsaturated carbonsites, forming thiophene/S-S/S-O, sulfoxide, and sul-fone organic-sulfur groups.38 The CDACs also containedthese sulfur groups (Table 4).
The equilibrium Hg0 adsorption capacity of the low-sulfur AC-2 carbon (0.85 wt % sulfur) increased from1304 to 2051 µg/g after sulfur impregnation at 600 °C(AC2S-600, 11.9 wt % sulfur). This adsorption capacitywas comparable to that of the AC-1 carbon (1.6 wt %sulfur) derived from the high-organic-sulfur coal. Thelarger adsorption capacity of AC2S-600 was attributedto the greater concentration of organic-sulfur functionalgroups incorporated into the sample during the sulfur
treatment process. Increasing the sulfur content of theAC-1 carbon from 1.6 to 11.5 wt % did not significantlychange its equilibrium Hg0 adsorption capacity (2718vs 2037 µg/g). The initial and equilibrium HgCl2adsorption capacities of both low- (AC-2) and high-sulfur(AC-1) CDACs, however, increased after sulfur impreg-nation. The equilibrium HgCl2 adsorption capacities ofthe sulfur-treated carbons were between 1060 and 1660µg/g, compared to 19-596 µg/g for the CDACs withoutsulfur impregnation.
The equilibrium Hg0 adsorption capacities of theCDACs or the sulfur-impregnated activated carbonswere smaller than 3000 µg/g (Figure 3 and Table 3),regardless of the activated carbons’ sulfur content(0.85-12 wt %) or BET surface areas (350-1000 m2/g).Neither the physical properties nor the concentrations
(36) Hsi, H.-C.; Chen, S.; Rostam-Abadi, M.; Rood, M. J.; Richardson,C. F.; Carey, T. R.; Chang, R. Presented at the 91th Annual Meetingof the Air & Waste Management Association, San Diego, CA, June1998; 98-RA79B.03.
(37) Berkovitz, J. In Elemental Sulfur: Chemistry, and Physics;Meyer, B., Ed.; Interscience: New York, 1965.
(38) Rostam-Abadi, M.; Chen, S.; Hsi, H.-C.; Rood, M. J.; Carey, T.R.; Richardson, C. F. Development and Evaluation of Low-Cost Sorbentsfor Removal of Mercury Emissions from Coal Combustion Flue Gas;Final Report EPRI TR-110532, 1998.
Table 5. Physical Characteristics and Mercury Adsorption of Virgin and Sulfur-Impregnated CDACs
samplecode precursor
ashcontent(wt %)
sulfurcontent(wt %)
N2-BETsurface area
(m2/g)
microporesurface area
(m2/g)
equilibriumHg0 capacity
(µg/g)
equilibriumHgCl2 capacity
(µg/g)
AC-1 high-organic-sulfur coal 27.0 1.6 787 578 2718 596AC-2 low-organic-sulfur coal 14.3 0.85 620 505 1304 19AC1S-600 AC-1 24.6 11.5 670 485 2037 1660AC2S-600 AC-2 12.2 11.9 532 427 2051 1060
Figure 5. (a) Micropore-size distributions of high- (FBR-45-3) and low- (AC-63-6) sulfur CDACs. (b) BJH pore-sizedistributions of high- (FBR-45-3) and low- (AC-63-6) sulfurCDACs.
1068 Energy & Fuels, Vol. 12, No. 6, 1998 Hsi et al.

of the total sulfur in the CDACs alone could be used toexplain adsorption of Hg0 onto activated carbon. Asshown earlier (Figure 4), equilibrium Hg0 adsorptioncapacities of the CDACs derived from low- and high-organic-sulfur coals increased with increasing BETsurface areas. Adsorbed mercury molecules, however,covered only a small fraction of the surface area. Forexample, for a 700 m2/g microporous activated carbonwith a 1.6 wt % sulfur content, and 3000 µg/g equilib-rium Hg0 adsorption capacity, the adsorbed Hg0 oc-cupied less than 1% of the total surface area and itreacted with about 0.05 wt % of the sulfur (assumingthat Hg0 reacts with sulfur). If Hg0 reacts mainly withspecific sulfur functional groups and/or adsorbs mainlyin a specific pore-size range, then the forms andconcentrations of sulfur functional groups and theirdistribution in the pores become important. This is thesubject of a current study in our laboratories.
Chemical equilibrium between the mercury speciesin the adsorbed phase and the small concentration (<50µg/Nm3) of vapor-phase mercury in the bulk gas couldalso limit the adsorption capacity of activated carbons.Results from mercury adsorption tests with FGD carbonshowed that the equilibrium adsorption capacity in-creased linearly (from about 100 to 5500 µg/g) withincreasing inlet mercury concentrations in the range of5-130 µg of Hg/m3.23 Activated carbons derived fromhigh-organic-sulfur coal are expected to show a similaradsorption behavior.
Commercial Activated Carbon. Compared withthe CDACs, the commercial FGD activated carbon (BETsurface area 503 m2/g) had a larger ash content (32.1wt %) and smaller total sulfur content (0.98 wt %). FGDcontained less micropore volume than the CDACs (44-74%). BJH pore-size distributions for the CDACs(Figure 7) revealed that most of the pores were smallerthan 100 Å and that a large fraction of the pore areawas contained in pores with widths <20 Å. In contrast,almost one-half of the surface area for FGD was in poresbetween 100 and 1000 Å.
The XANES data (Table 4) showed that in additionto small amounts of organic sulfide and thiophene (0.24wt %), FGD contained elemental sulfur (0.17 wt %) anda large concentration of sulfatic sulfur (0.57 wt %). FGDwas not examined by XRD. It is, however, expected thatthe sulfatic sulfur was in calcium and/or iron sulfateforms, because FGD was prepared from a lignite coal.
The initial and equilibrium Hg0 adsorption capacities(516/2566 µg/g) of FGD were comparable to the adsorp-tion capacities of the high-sulfur CDACs (Table 3).However, FGD had 2-3 times larger initial and equi-librium HgCl2 adsorption capacities (1330/1570 µg/g)compared to the CDACs developed as part of thisresearch effort. Compared with the Illinois bituminouscoal, the precursors of the CDACs, the lignite, precursorof the FGD, is much younger, has a less aromatic carbonstructure, and contains more oxygen functional groups.It remains to be determined whether the geologic ageand other inherent properties of precursor carbonaceousmaterials affect the mercury adsorption properties ofthe resultant activated carbon.
Summary and Conclusions
One of the major conclusions of this research was thatactivated carbons developed from high-organic-sulfurcoal had 2-4 times larger equilibrium Hg0 adsorptioncapacities than activated carbons developed from low-organic-sulfur coals. The large Hg0 adsorption capaci-ties of CDACs produced from high-organic-sulfur coals(1000-3000 µg/g) compared to those made from low-organic-sulfur coal (500-1300 µg/g) showed the impor-tance of the inherent organic sulfur in the coal feed forproducing an effective activated carbon for Hg0 adsorp-tion.
Hg0 adsorption capacities of high-sulfur CDACs de-creased, in general, with increasing sulfur content,suggesting that the presence of sulfur alone in CDACswas not responsible for Hg0 adsorption. Pore structuresof the activated carbon developed during the activationprocess were also important for Hg0 adsorption. Hg0
adsorption capacities of activated carbons derived fromboth high- and low-organic-sulfur coals generally in-creased with increased BET-N2 surface areas and mi-cropore areas.
The Hg0 adsorption capacity of the activated carbonderived from the low-organic-sulfur coal, after sulfurimpregnation at 600 °C, was comparable to that of theactivated carbons derived from high-organic-sulfur coals.These results suggest that in processing high-organic-sulfur coal, a portion of the inherent organic sulfurremained in the resulting CDACs and made thesematerials more effective mercury sorbents. CDACs with
Figure 6. Micropore-size distribution of virgin (AC-1) andsulfur-impregnated CDACs (AC1S-600). Figure 7. Cumulative BJH pore-size distributions of FBR-
39 and FGD activated carbons.
Preparation of Coal-Derived Activated Carbons Energy & Fuels, Vol. 12, No. 6, 1998 1069

surface areas between 500 and 700 m2/g and organic-sulfur contents between 1.5 and 2.5 wt % had largecapacities (2500-3000 µg/g) for adsorption of traceamounts of Hg0 (<50 µg/Nm3) and are potentiallysuitable sorbents for removal of Hg0 emissions from coalcombustion flue gases. The results presented in thispaper indicate that by selecting a high-organic-sulfurcoal as the starting feed, an activated carbon with alarge mercury adsorption capacity could be preparedwithout post-production sulfur treatment.
There were no significant differences between theHgCl2 adsorption capacities of activated carbons derivedfrom high- and low-organic-sulfur coals. The HgCl2adsorption capacities of the CDACs were 2-5 timessmaller than the Hg0 adsorption capacities. HgCl2adsorption was less dependent on the precursor coal,processing conditions, and physical characteristics of theCDACs than Hg0 adsorption.
Activated carbons prepared from a high-organic-sulfur coal in bench-scale and pilot-scale reactors had
comparable surface areas and mercury adsorption ca-pacities, suggesting that there were no difficulties inscaling-up the carbon production process.
Acknowledgment. Funding support from the Il-linois Department of Commerce and Community Affairsthrough the Illinois Clean Coal Institute (ICCI 97-03)and the Electric Power Research Institute (WO8303-02) are appreciated. The authors acknowledge the helpof Frank E. Huggins, J. Zhao, and Gerald P. Huffman(University of Kentucky) for XANES technical support.The XAFS spectroscopy portion of this study wasconducted at beam-line XD-19A at the National Syn-chrotron Light Source, Brookhaven National Labora-tory, New York. The operation of the National Synchro-tron Light Source was supported by the U.S. Departmentof Energy.
EF9801064
1070 Energy & Fuels, Vol. 12, No. 6, 1998 Hsi et al.