preparation, characterization and activation of co...
TRANSCRIPT

PREPARATION, CHARACTERIZATION and ACTIVATION of Co-Mo/Y ZEOLITE CATALYST for CONVERSION of COAL TAR to LIQUID FUEL
Didi Dwi Anggoro*, Luqman Buchori, Giveni Christina S., Resti Nur U.
Department of Chemical Engineering, University of Diponegoro Jl. Prof. Soedarto, Tembalang, Semarang, Indonesia 50275
* Corresponding author, tel/fax: 6224-76480675, email: [email protected]
Co-author 1, email: [email protected] Co-author 2, email: [email protected]
Co-author 3, email: [email protected]
ABSTRACT
One of many efforts to convert coal tar into alternative liquid fuel is by hydrocracking. This research aims to determine the impregnation of Co-Mo/Y zeolite, its characteristics, the effect of impregnation temperature and time, and also the best Co-Mo/Y zeolite impregnation condition for the conversion of coal tar. This research was conducted in several steps, impregnating Co in Co(NO3)2.6H2O and Mo in (NH4)6Mo7O24.4H2O into Y zeolite in liquid media, drying at 100°C for 24 hours, and calcination at 550°C for 3 hours. Coal tar was then reacted with Co-Mo/Y zeolite and H2 flowing was excecuted at 350°C. Characteristic analysis showed that Co and Mo had impregnated into Y zeolite, as well as it made no change of catalyst’s structure and increased the total acidity. The higher the impregnation temperature was, the higher catalyst crystallinity, total acidity, and yield were. The longer impregnation took time, the more crystallinity reduced but total acidity and yield increased. GC analysis showed that product in the time range of gasoline contained C8, C9, and C10. Keywords: impregnation; Co-Mo/Y zeolite; characterization; coal tar; liquid fuel
ABSTRAK
Satu usaha untuk mengkonversi tar batubara menjadi bahan bakar cair alternative dengan proses perengkahan-hidro. Tujuan dari penelitian ini adalah membuat katalis Co-Mo/Y zeolit secara impregnasi, melakukan karakterisasi, mengetahui pengaruh suhu dan waktu impregnasi, serta menentukan kondisi optimum untuk mengkonversi tar batubara. Penelitian in dijalankan dengan beberapa langkah, yaitu : mengimpregnasi Co dari Co(NO3)2.6H2O dan Mo dari (NH4)6Mo7O24.4H2O kedalam zeolit Y fase cair, pengeringan pada suhu 100oC selama 24 jam, dan kalsinasi pada suhu 550oC selama 3 jam. Tar batubara kemudian direaksikan dengan katalis Co-Mo/Y zeolit dengan dialiri gas H2 pada suhu 350oC. Hasil dari karakterisasi menunjukkan bahwa impregnasi Co dan Mo kedalam zeolit Y tidak mengubah struktur katalis tetapi merubah persen kristallinitas dan derajat keasaman. Semakin besar suhu imregnasi menyebabkan persen kristallinitas, derajat keasaman dan yield produk meningkat. Semakin lama waktu impregnasi menyebabkan persen kristallinitas menurun, tetapi derajat keasaman dan yield produk meningkat. Analisa GC memperlihatkan bahwa produk cair yang dihasilkan termasuk bensin range, yang mengandung C8, C9, dan C10. Kata Kunci: impregnasi; Co-Mo/Y zeolit; karakterisasi; tar batubara; bahan bakar cair

INTRODUCTION
The use of petroleum as a fuel in Indonesia is increasing every year. While oil
production constantly decreased. To overcome this, the government officially issued
Regulation No. 5 Year 2006 on National Energy Policy where in it is mentioned to reduce
petroleum consumption and increase the consumption of other energies such as coal.
Coal should not be directly burned, but would be more meaningful and efficient if
converted into synthetic fuel or other high value petrochemical materials. One is by a
gasification process. Coal gasification is a process to convert solid coal into flammable coal
gas. This process produces byproducts such as coal tar which is quite large. Coal tar is
black or dark brown high viscosity liquid. Coal tar has very complex chemical components,
includes monocyclic aromatic compounds, polycyclic aromatic, and heterocyclic so it has
potential to be processed into synthetic fuel. Coal tar is mostly composed of C, H, and O,
and also lower concentration of S and N [1]. The aromatics and heteroatoms (S and N)
contained in coal tar must be changed and the molecular weight and viscosity should be
lowered. To lower the molecular weight, viscosity, and aromatics content, coal tar must be
processed by hydrogenation and cracking.Hydrogenation and cracking process requires a
catalyst that has dual functions, metal component as the hydrogenation catalyst and acid
component as the cracking catalyst [2]. Ones of the hydrogenation metals most commonly
used in the hydrocracking process are Co and Mo.While the most common catalyst used in
catalytic cracking and hydrocracking is Y zeolite. Co-Mo/Y zeolite is expected to have high
activity in coal tar hydrocracking process [3].
Wang, et al [4] had did a research using zeolite catalyst, that reaction initially took
place at high temperature, but by using catalyst the reaction could take place at lower
temperature. Research by Lestari et al [5] about the effect of Ni and Mo metal showed that
catalyst with Ni and Mo required higher specific surface area to produce greater distribution
of Mo. Ramadan and Friandani [6] studied the effect of Co and Mo metal addictiononY
zeolite where the higher concentration of the metal, the higher values of catalyst acidity
was if supported by equitable distribution. Therefore this research impregnated Co and Mo
into Y zeoliteto convert coal tar into liquid fuels and not Ni metal which is more expensive
and requires greater specific surface area.
The effect of impregnation temperature and time need to be considered to determine
the best preparation of Co-Mo/Y zeolite condition which can be used as a hydrocracking

catalyst of coal tar. This has encouraged research to determine the effect of impregnation
condition Co and Mo into Y zeolite in coal tar hydrocracking into liquid fuel.
The purpose of this study was to determine the catalyst preparation Co-Mo / zeolite Y
with impregnation method, knowing the characteristics of the catalyst Co-Mo / zeolite Y,
determine the effect of temperature and time of impregnation on the preparation of the
catalyst Co-Mo / zeolite Y for the conversion process coal tar, and determine the best
conditions in the manufacture of Co-Mo / zeolite Y for the conversion process coal tar.
EXPERIMENTAL SECTION
Materials
The materials used are coal tar from PT. Sango Ceramic Indonesia, Y zeolite and
ZSM-5 from PT. Zeolyst International, Co(NO3)2.6H2O from Merck, (NH4)6Mo7O24.4H2O
from Merck, ammonia from Merck, hydrogen gas from PT. Aneka Gas, and distilled water
from Chemical Process Laboratory Department of Chemical Engineering
UniversitasDiponegoro.
Instrumentation
The functional group of the catalysts was analyzed by Fourier Transform-Infra Red
(FTIR) in Technology Laboratory Separation Department of Chemical Engineering,
University of Diponegoro. Stability catalyst structure by X-Ray Diffraction (XRD) Laboratory
Integrated Diponegoro University, and the total acidity method adsorbs ammonia
gravimetrically at Laboratory of Basic Chemical Engineering Department Chemistry
University of Diponegoro. Liquid fuel product analyzed using Gas Chromatography at
Organic and Bioorganic Laboratory Department of Chemistry Universitas GadjahMada in
standard gasoline.
Procedure
Preparation and Characterization of Catalyst
Preparation of Co-Mo/Y zeolite catalyst used impregnation method. Five grams of Y
zeolite, cobalt metal obtained from Co(NO3)2.6H2O 0.985 grams, and molybdenum metal
from (NH4)6Mo7O24.4H2O 4.34 grams, dissolved in 50 ml of distilled water. The solution was
then heated in accordance temperature variables during the time variables. The samples
then filtered using a vacuum pump until no more water was dripping. Further drying was
done in the oven with temperature of 100 °C for 24 hours. Dried samples then calcined at
temperature of 550°C for 3 hours. The functional group of the catalysts was analyzed by
FTIR. Stability catalyst structure was analyzed by X-Ray Diffraction. The total acidity
method adsorbs ammonia gravimetrically method.
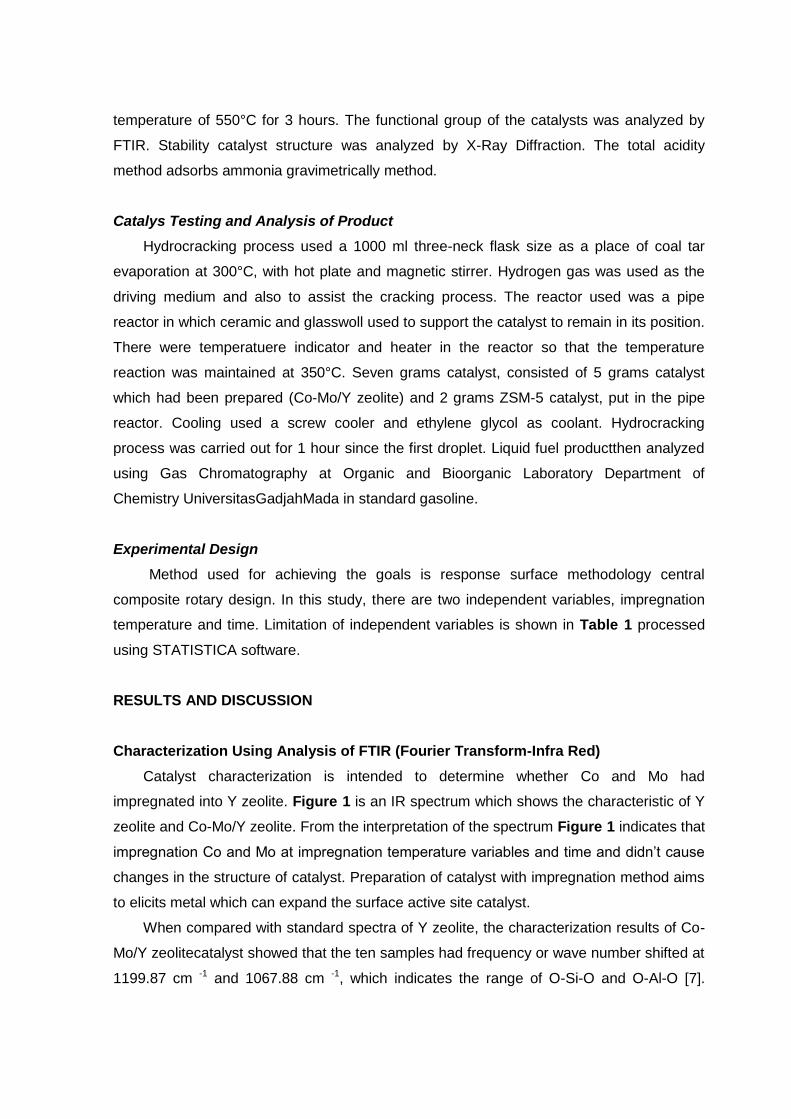
Catalys Testing and Analysis of Product
Hydrocracking process used a 1000 ml three-neck flask size as a place of coal tar
evaporation at 300°C, with hot plate and magnetic stirrer. Hydrogen gas was used as the
driving medium and also to assist the cracking process. The reactor used was a pipe
reactor in which ceramic and glasswoll used to support the catalyst to remain in its position.
There were temperatuere indicator and heater in the reactor so that the temperature
reaction was maintained at 350°C. Seven grams catalyst, consisted of 5 grams catalyst
which had been prepared (Co-Mo/Y zeolite) and 2 grams ZSM-5 catalyst, put in the pipe
reactor. Cooling used a screw cooler and ethylene glycol as coolant. Hydrocracking
process was carried out for 1 hour since the first droplet. Liquid fuel productthen analyzed
using Gas Chromatography at Organic and Bioorganic Laboratory Department of
Chemistry UniversitasGadjahMada in standard gasoline.
Experimental Design
Method used for achieving the goals is response surface methodology central
composite rotary design. In this study, there are two independent variables, impregnation
temperature and time. Limitation of independent variables is shown in Table 1 processed
using STATISTICA software.
RESULTS AND DISCUSSION
Characterization Using Analysis of FTIR (Fourier Transform-Infra Red)
Catalyst characterization is intended to determine whether Co and Mo had
impregnated into Y zeolite. Figure 1 is an IR spectrum which shows the characteristic of Y
zeolite and Co-Mo/Y zeolite. From the interpretation of the spectrum Figure 1 indicates that
impregnation Co and Mo at impregnation temperature variables and time and didn’t cause
changes in the structure of catalyst. Preparation of catalyst with impregnation method aims
to elicits metal which can expand the surface active site catalyst.
When compared with standard spectra of Y zeolite, the characterization results of Co-
Mo/Y zeolitecatalyst showed that the ten samples had frequency or wave number shifted at
1199.87 cm -1 and 1067.88 cm -1, which indicates the range of O-Si-O and O-Al-O [7].

Presumably this shift is caused by a reduction of Al atoms in the framework become Al
non-framework due to dealuminatedat catalyst calcination [7]. At 200°C, protons in zeolite
have high mobility and at 550° C are separated as water to form the Lewis site, can be
described in Figure 2.
The presence of water vapor will constantly strengthen the structure stability of Lewis
site structure which is not stable, the result is called "actual Lewis sites" which can be seen
in Figure 3.
Peak in the standard spectrum of Y zeolite at 1400.62 cm-1 is present while not in ten
samples. According to Coates [7], the peak indicates -OH.The cause of the loss of is by
hydrothermal process when the Co-Mo/Y zeolite catalyst calcination. There is also a peak
at 829.49 cm-1on spectrum of Y zeolite standard which indicates C-H [7]. Meanwhile the
spectrums of Co-Mo/Y zeolitehave a shift at that wave numbers thought caused by
impregnation of Co and Mo. Also, there is appearance of two peaksnear wave numbers of
902 cm-1 and 945 cm-1 while there is none in spectra standard of Y zeolite before. The area
indicates asymmetrical strain O-Si-O and O-Al-O [7]. The appearance strengthens the
presumption of Co and Mo had impregnated into catalyst accordance impregnation
temperature and time variables.
Effect of Impregnation Temperature and Time To Co-Mo/Y Zeolite Crystallinity
It can be observed in Figure 4 that the intensity of the ten of Co-Mo/Y zeolite catalysts’
diffractogram is decreasing. Catalyst crystallinity is calculated by comparing the intensity of
8 strongest peaks Co-Mo/Y zeolite with Y zeolite. So we get the data as shown in Table 2.
Catalyst crystallinity decreased when Co and Mo were impregnated. This is probably
caused by the impregnation of Co and Mo into Y zeolite. However, the tencatalysts have
similar pattern with Y zeolite, so it can be said that the crystallinity of Y zeolite was not
damaged after impregnating Co and Mo [8]. This is consistent with the results of FTIR
analysis where the graph shows that the structure does not change after impregnating Co
and Mo.
Based on figure 5 (a), at the same impregnation time can be seen that the higher the
temperature, the higher degree of catalyst crystallinity is. According to Krichko [9], the
increasing of impregnation temperature may increase the mobility of the chains bond in the
catalyst, which may occur in the area of the crystal structure. High mobility led to the
composition of the chain becomes thight and thus expand the areas of crystal structure.
However, there are deviations in the chart, which is a decrease of crystallinity as the
temperature rises at impregnation time of 20 minutes and temperature of 60°C.
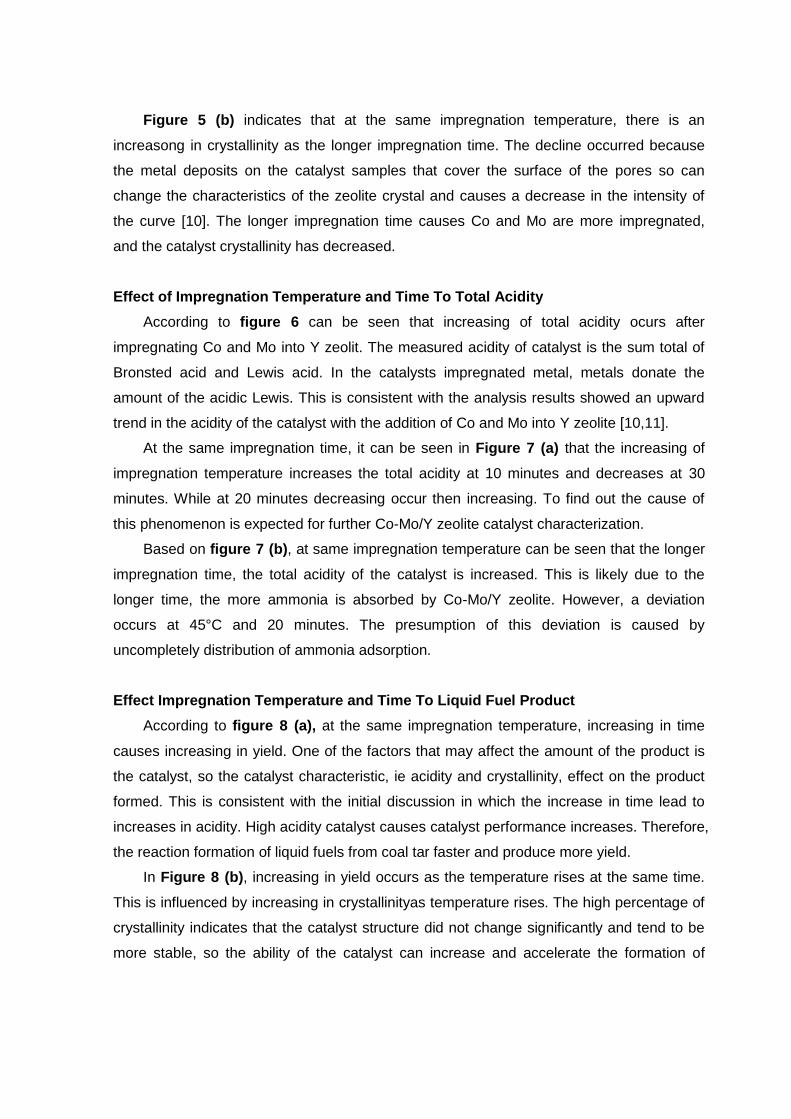
Figure 5 (b) indicates that at the same impregnation temperature, there is an
increasong in crystallinity as the longer impregnation time. The decline occurred because
the metal deposits on the catalyst samples that cover the surface of the pores so can
change the characteristics of the zeolite crystal and causes a decrease in the intensity of
the curve [10]. The longer impregnation time causes Co and Mo are more impregnated,
and the catalyst crystallinity has decreased.
Effect of Impregnation Temperature and Time To Total Acidity
According to figure 6 can be seen that increasing of total acidity ocurs after
impregnating Co and Mo into Y zeolit. The measured acidity of catalyst is the sum total of
Bronsted acid and Lewis acid. In the catalysts impregnated metal, metals donate the
amount of the acidic Lewis. This is consistent with the analysis results showed an upward
trend in the acidity of the catalyst with the addition of Co and Mo into Y zeolite [10,11].
At the same impregnation time, it can be seen in Figure 7 (a) that the increasing of
impregnation temperature increases the total acidity at 10 minutes and decreases at 30
minutes. While at 20 minutes decreasing occur then increasing. To find out the cause of
this phenomenon is expected for further Co-Mo/Y zeolite catalyst characterization.
Based on figure 7 (b), at same impregnation temperature can be seen that the longer
impregnation time, the total acidity of the catalyst is increased. This is likely due to the
longer time, the more ammonia is absorbed by Co-Mo/Y zeolite. However, a deviation
occurs at 45°C and 20 minutes. The presumption of this deviation is caused by
uncompletely distribution of ammonia adsorption.
Effect Impregnation Temperature and Time To Liquid Fuel Product
According to figure 8 (a), at the same impregnation temperature, increasing in time
causes increasing in yield. One of the factors that may affect the amount of the product is
the catalyst, so the catalyst characteristic, ie acidity and crystallinity, effect on the product
formed. This is consistent with the initial discussion in which the increase in time lead to
increases in acidity. High acidity catalyst causes catalyst performance increases. Therefore,
the reaction formation of liquid fuels from coal tar faster and produce more yield.
In Figure 8 (b), increasing in yield occurs as the temperature rises at the same time.
This is influenced by increasing in crystallinityas temperature rises. The high percentage of
crystallinity indicates that the catalyst structure did not change significantly and tend to be
more stable, so the ability of the catalyst can increase and accelerate the formation of

reaction product. Data crystallinity and the concentration of the gas in the GC product
analysis results are shown in Table 3.
From table 3, it is obtained relationship betweenCo-Mo/Y zeolite crystallinity at
impregnation temperatureand time variables with the concentration of the gas contained in
coal tar products of hydrocracking.
According to figure 9 it can be seen that the higher percentage of Co-Mo/Y zeolite
crystallinity, the greater the concentration of the fuel produced. Crystallinity is a very
important factor influencing the nature of the catalyst. High crystallinity indicate that catalyst
is free from impurities and physical properties (catalytic properties of high, stable at high
temperatures and extensive porosity) are not disturbed [10,12]. As a result, performance
can be run optimally, so that produce more product.
Analysis of Liquid Fuel
GCMS analysis obtained peak gasoline in the range of 1.3-19.9 minutes and GC
analysis obtained 10 products with different peak. Concentration gasoline on 10 products
can be determined by calculating the concentration peak GC results were in the range of
gasoline when GCMS results. Commercial gasoline sample is obtained from gas station
where GCMS analysis indicates that the components contained in the gasoline have a
number of chains of carbon atoms ranging from C2-C10.
Consideration of the suitable using of hydrocarbons for gasoline is based on the
volatility and octane number. In general, gasoline has a component of C5-C8, but some are
up to C9 or more [13]. In the range of C5-C8, it contained aromatic isomers with branched-
chain or cyclic good in the use of gasoline as a motor fuel. This is consistent with the
results of GC analysis of 10 products in Table 4 that most of the products contain C8, C9
and C10. Table 4 shows that the best impregnation condition to get the most yield, 1.35 ml
of gasoline, is by impregnation at temperature of 55°C and 30 minutes.
CONCLUSION
Catalyst characterization results indicate that Co and Mo had impregnated into Y
zeolite. Impregnation of Co and Mo at impregnation temperature and time variables did not
damage the structure of Y zeolite catalyst and increased the value of Y zeolite total acidity.
Increasing in impregnation temperature caused catalyst crystallinity and acidity as well as
the yield of gasoline rised.Meanwhile, the longer the impregnation time, the more reduced
the catalyst crystallinity but the catalyst total acidity and yield increased.GC analysis

showed that the products in the time range of gasoline contained components of C8, C9,
and C10.To get the best crystallinity Co-Mo/Y zeolite catalyst was by impregnating at
temperature range of 40-50°C and time of 5-20 minutes. Meanwhile, to get the best yield,
ie 1.35 ml of gasoline, was by using a catalyst with impregnation method at temperature of
55°C and 30 minutes
ACKNOWLEDGEMENTS
The authors gratefully acknowledge the financial support from Diponegoro University
DIPA Number 214-05/UN7.5.1/PG/2015 and support from PT. Sango Ceramic Indonesia
for Feedstock Coal Tar.
REFERENCES
1. Tang, W., Fang, M., Wang, H., Yu, P., Wang, Q., and Luo, Z., 2014, Chemical Engineering Journal, Vol. 236, 15 January 2014, pp. 529–537.
2. Fanani, Z., 2010, Jurnal Penelitian Sains, 1006, (08), pp. 22-33 3. Chang, N., Gu, Z., Wang, Z., Liu, Z., Hou, X., and Wang, J., 2011, J Porous Mater, 18,
pp. 589-596, 4. Wang L, Shen B, Fang F, Wang F, Tian R, Zhang Z, Cui L., 2010, Catal Today,158,
(3/4) pp. 343–347. 5. Lestari, H.D., Subagjo, S., and Makerthihartha, I.G.B.N., 2006, Jurnal Teknik Kimia
Indonesia, 5, pp. 365-373. 6. Ramadhan, Z. and Friandani, T., 2015, Graduate Thesis, Pengaruh Penambahan
Logam Co dan Mo Pada Aktivasi Katalis Co-Mo/Zeolit Y Terhadap Pembutan Bahan Bakar Cair Dari Tar Batubara, Universitas Diponegoro, Semarang, Indonesia.
7. Coates, J., 2000, Interpretation of Infrared Spectra, A Practical Approach, in R.A. Meyers (Ed.) Encyclopedia of Analytical Chemistry, John Wiley & Sons Ltd, Chichester, pp. 10815-10837.
8. Khabib, I., Kadarwati, S., and Wahyuni S., 2014, Indo. J. Chem., 14, pp. 192-198. 9. Krichko, A.A., Maloletnev, A.S., Mazneva, O., and Gagarin, S.G, 1996, Fuel, 76: 683-
685. 10. Didi Dwi Anggoro, et al, 2016, Bulletin of Chemical Reaction Engineering & Catalysis,
Vol. 11 (1), pp. 75-83 11. Hassan A, Ahmed S, Ali M A, Hamid H, Inui T. 2001, Appl. Catal A: Gen, 220, (1/2) pp.
59–68. 12. Li, L., Quan, K., Xu, J., Liu, F., Liu, S., Yu, S., Xie, C., Zhang, B., Ge, X., 2014, Fuel,
123, pp. 189-193. 13. Buekens, A.G. and Huang, H., 1998, Resources, Conservation and Recycling, 23, pp.
163-181.

Table 1 Matrix of experimental design
Run Temperature (°C) Time (minutes)
1 35 10 2 35 30 3 55 10 4 55 30 5 31 20 6 59 20 7 45 6 8 45 34 9 45 20
10 45 20
Table 2 Co-Mo/Y zeolite crystallinity
Run Crystallinity (%)
1 23,84 2 17,39 3 36,49 4 17,73 5 25,35 6 23,31 7 49,84 8 30,86 9 46,53 10 43,92
Table 3. Crystallinity and consentration of gasoline produced by Co-MO/Y zeolite
Run Crystallinity (%) Concentration of Gasoline (%)
1 23,84 36,54 2 17,39 37,23 3 36,49 71,19 4 17,73 89,80 5 25,35 44,65 6 23,31 89,12 7 49,84 89,30 8 30,86 56,81 9 46,53 91,51
10 43,92 83,93
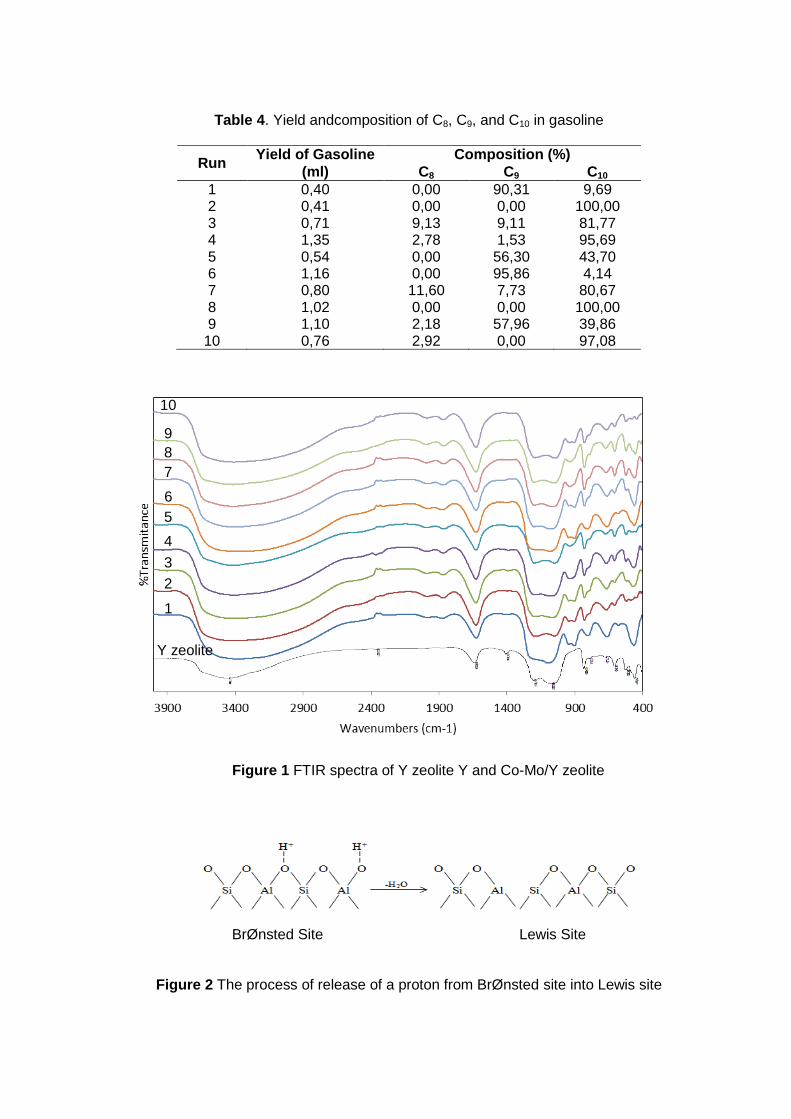
Table 4. Yield andcomposition of C8, C9, and C10 in gasoline
Run Yield of Gasoline Composition (%)
(ml) C8 C9 C10
1 0,40 0,00 90,31 9,69 2 0,41 0,00 0,00 100,00 3 0,71 9,13 9,11 81,77 4 1,35 2,78 1,53 95,69 5 0,54 0,00 56,30 43,70 6 1,16 0,00 95,86 4,14 7 0,80 11,60 7,73 80,67 8 1,02 0,00 0,00 100,00 9 1,10 2,18 57,96 39,86
10 0,76 2,92 0,00 97,08
Figure 1 FTIR spectra of Y zeolite Y and Co-Mo/Y zeolite
BrØnsted Site Lewis Site
Figure 2 The process of release of a proton from BrØnsted site into Lewis site
1
2
3
4
5
6
7
8
9
10
Y zeolite

Lewis Site Actual Lewis Site
Figure 3 The process of structural stability from Lewis site into actual Lewis site
Figure 4 XRD diffractogram of Y zeolite and Co-Mo/Y zeolite
10 9
8
6 5
3
7
4
2 1
zeolit Y

Figure 5.Relationship of impregnation (a) temperature and (b) time with crystallinity
Figure 6 Value of Y zeolite and Co-Mo/Y zeolite total acidity
(a)
(b)

Figure 7 Relationship of impregnation (a) temperatureand (b) time with acidity
(a)
(b)

Figure 8 Relationship of impregnation (a) time and (b) temperature with yield
(b)
(a)
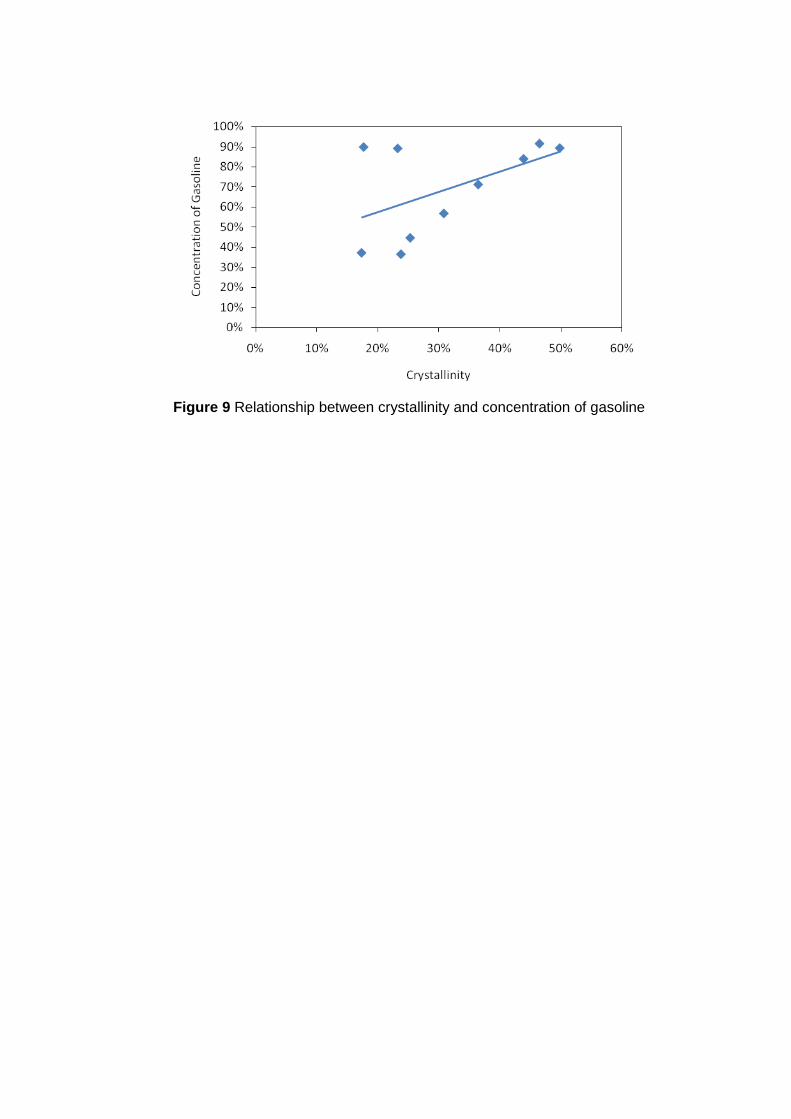
Figure 9 Relationship between crystallinity and concentration of gasoline
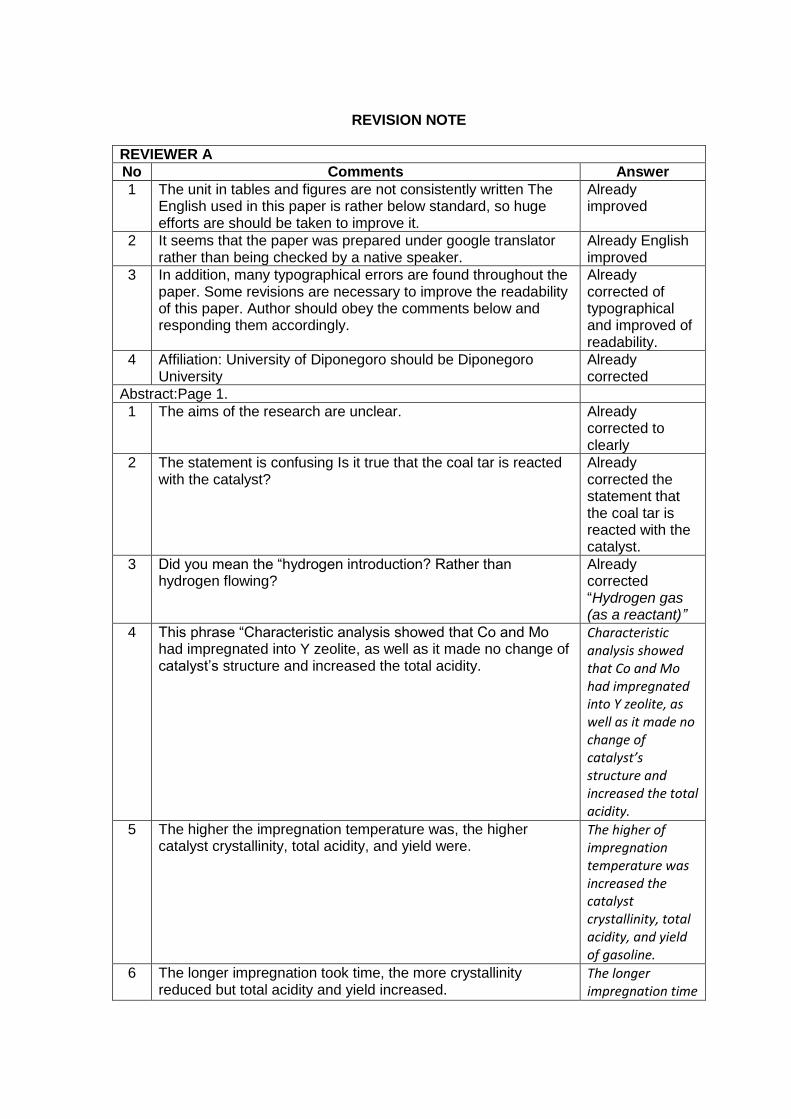
REVISION NOTE
REVIEWER A
No Comments Answer
1 The unit in tables and figures are not consistently written The English used in this paper is rather below standard, so huge efforts are should be taken to improve it.
Already improved
2 It seems that the paper was prepared under google translator rather than being checked by a native speaker.
Already English improved
3 In addition, many typographical errors are found throughout the paper. Some revisions are necessary to improve the readability of this paper. Author should obey the comments below and responding them accordingly.
Already corrected of typographical and improved of readability.
4 Affiliation: University of Diponegoro should be Diponegoro University
Already corrected
Abstract:Page 1.
1 The aims of the research are unclear. Already corrected to clearly
2 The statement is confusing Is it true that the coal tar is reacted with the catalyst?
Already corrected the statement that the coal tar is reacted with the catalyst.
3 Did you mean the “hydrogen introduction? Rather than hydrogen flowing?
Already corrected “Hydrogen gas (as a reactant)”
4 This phrase “Characteristic analysis showed that Co and Mo had impregnated into Y zeolite, as well as it made no change of catalyst’s structure and increased the total acidity.
Characteristic analysis showed that Co and Mo had impregnated into Y zeolite, as well as it made no change of catalyst’s structure and increased the total acidity.
5 The higher the impregnation temperature was, the higher catalyst crystallinity, total acidity, and yield were.
The higher of impregnation temperature was increased the catalyst crystallinity, total acidity, and yield of gasoline.
6 The longer impregnation took time, the more crystallinity reduced but total acidity and yield increased.
The longer impregnation time

wasreducedcrystallinity value but total acidity and yield were increased.
7 GC analysis showed that product in the time range of gasoline contained C8, C9, and C10.” is even more confusing to readers. Please rephrase and make it more readable.
GC analysis showed that products included into the gasoline product (C8, C9, and C10).
Introduction:
1 Please give reference for the first paragraph of introduction Already give the reference
2 Please rephrase the last two paragraphs of this section. They are unclear and could develop confusion over the readers
Already rephrase and corrected to clearly
Material and Method:
1 What do the authors mean by “Technology Laboratory Separation Department of Chemical Engineering”
Revision: Chemical Process Laboratory Department of Chemical Engineering, Diponegoro University.
2 What do the authors mean by “the total acidity method adsorbs ammonia gravimetrically at Laboratory of Basic Chemical Engineering Department Chemistry University of Diponegoro.”.
Revision: method adsorbs ammonia gravimetrically was done at Laboratory of Basic Chemical Engineering Department Chemistry University of Diponegoro
3 Please rephrase the “procedure for catalyst preparation” Already rephrase
Catalys Testing and Analysis of Product (please make correction)
1 Are the authors sure that the hot plate could bring the temperature of the three necked flash to about 300oC? It is rather ridiculous.
Hydrocracking process used a 1000 ml three-neck flask size as a place of coal tar (100 ml), for evaporated using

a hot plate (300oC), above a hot plate there is oil as media warm up and magnetic stirrer.
2 Please also rephrase the section “Catalys Testing and Analysis of Product”
Already rephrase.
Results and Discussion:
1 Please give detail discussion of your results rather than just reporting the value of data.
Already explanation of data.
2 It is better to express yield in (amount of product/amount of feed or multiplied it by 100 to get % yield). Reporting yield in the form of mL is not appropriate because we do not know the change of the reactant into the product. See. Figure 8
Already correction.
3 The experimental data in Figure 8 and Figure 9 are not linear, but the authors forced them to be linear. Why?
Figure 8 (now as Figure 9) is changed to be linear. Figure 9 (now as Figure 10) is linear, without crystallinity at17.73 and 23.31%.
4 Some figure still comes with Bahasa Indonesia (menit) Already correction.
Conclusion:
1 Please make your conclusion in brief, clear and concise. Already correction and improve.
2 The current conclusion is unclear and confusing. Already correction and improve.
References:
1 Please write the literature cited following the guideline that may be obtained from the BCREC website
Already correction and improve.
REVIEWER B
Page Comments Answer
1 [1] Please check English Grammar throughout the texts (all sentences) in this paper, sentence by sentence, carefully. I suggest you to use Grammarly software
Already correction and improve.
1 [2] Keyword must be specific and represent this research. Do not use too general words
Already correction and improve.
1 [3] Please delete this section Already delete.
1 [4] Please delete this section Already delete.
2 [5] Grammar????? “..had did..” Already correction.
3 [6] In the end of Introduction section, authors MUST put gap analysis ststements or novelties of this paper, what is
Already correction and improve.
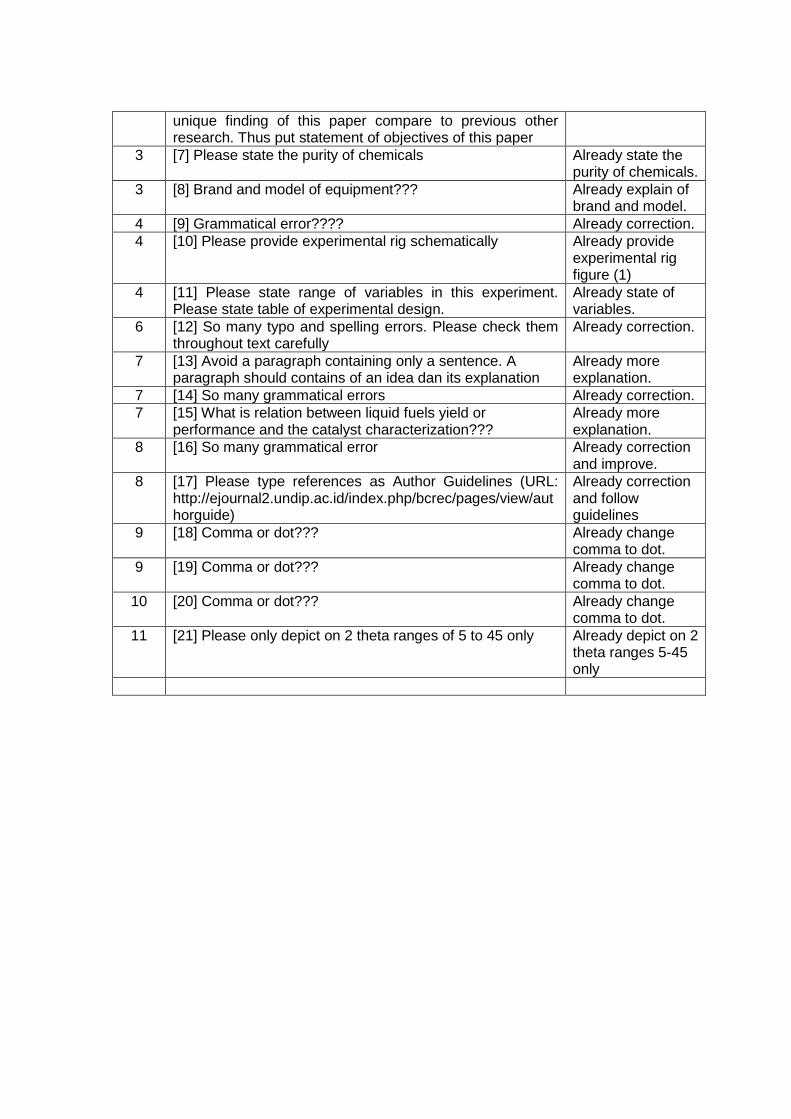
unique finding of this paper compare to previous other research. Thus put statement of objectives of this paper
3 [7] Please state the purity of chemicals Already state the purity of chemicals.
3 [8] Brand and model of equipment??? Already explain of brand and model.
4 [9] Grammatical error???? Already correction.
4 [10] Please provide experimental rig schematically Already provide experimental rig figure (1)
4 [11] Please state range of variables in this experiment. Please state table of experimental design.
Already state of variables.
6 [12] So many typo and spelling errors. Please check them throughout text carefully
Already correction.
7 [13] Avoid a paragraph containing only a sentence. A paragraph should contains of an idea dan its explanation
Already more explanation.
7 [14] So many grammatical errors Already correction.
7 [15] What is relation between liquid fuels yield or performance and the catalyst characterization???
Already more explanation.
8 [16] So many grammatical error Already correction and improve.
8 [17] Please type references as Author Guidelines (URL: http://ejournal2.undip.ac.id/index.php/bcrec/pages/view/authorguide)
Already correction and follow guidelines
9 [18] Comma or dot??? Already change comma to dot.
9 [19] Comma or dot??? Already change comma to dot.
10 [20] Comma or dot??? Already change comma to dot.
11 [21] Please only depict on 2 theta ranges of 5 to 45 only Already depict on 2 theta ranges 5-45 only

2nd Revision Note File
No Comment Correction
1 DO NOT shorten the last names !! Already correction…. GIVENI CHRISTINA
SILAEN, RESTI NUR UTAMI 2 Please improve English grammar in
this sentences The cooling system used a screw condenser and ethylene glycol (as coolant). Time of reaction is 1 hour. Then, analyze of liquid fuel product carried by….
3 In this method, author told that the design experiment of RSM using STATISTICA has been used, BUT in the results there is no optimization results using the RSM, no contour, no surface simulation???
Already delete
4 Please write the formula and method to calculate this cristalinity in %.
Already write in page number 6…The crystallinity of the zeolite can be calculated from X-ray diffractograms and is expressed according to [20].
5 % here is concentration or percentage of composition???? As far as I know that concentration is in mol/volume??
Already change … concentration to composition
6 Comma or dot? Already change … comma to dot
7 Yield, usually presented in “%” based the reactant and product. Not in ml.
Already change…ml to %
8 X-axis and unit ???? Figure 6(a) already correction of X-axis and unit.
9 X-axis and unit ???? Figure 6(b) already correction of X axis and unit.
10 X-axis and unit ???? Figure 8(a) already correction of X-axis and unit.
11 X-axis and unit ???? Figure 8(b) already correction of X-axis and unit.
12 X-axis and unit ???? Figure9(a) already correction of X-axis and unit.
13 X-axis and unit ???? Figure9(b) already correction of X-axis and unit.
14 Unit of x-axis and y-axis labels? Figure 10 already correction of Unit of x-axis and y-axis labels?