preparation – filtration and dna extraction – for the
TRANSCRIPT
Optimization of sample preparation – filtration and DNA extraction – for the analysis of seawater samples
Eyjólfur Reynisson Árni Rafn Rúnarsson Sveinn Haukur Magnússon Desiree Seehafer Viggó Þór Marteinsson
Öryggi, umhverfi og erfðir Skýrsla Matís 36-10 Nóvember 2010 ISSN 1670-7192

Titill / Title Bestun á undirbúningi og meðhöndlun sjósýna fyrir sameinda‐ líffræðilegar örverurannsóknir/ Optimization of sample preparation – filtration and DNA extraction – for the analysis of sea water samples
Höfundar / Authors Eyjólfur Reynisson, Árni Rafn Rúnarsson, Sveinn Haukur Magnússon, Desiree Seehafer, Viggó Þór Marteinsson
Skýrsla / Report no. 36‐10 Útgáfudagur / Date: Nóvember 2010
Verknr. / project no. 1698 og 1987 Skýrsla lokuð til 01.12.2011
Styrktaraðilar / funding: Verkefnasjóður sjávarútvegsins, Sjávarútvegs‐ og landbúnaðar‐ráðuneyti
Ágrip á íslensku:
Lítið er vitað um örverur eða fjölbreytileika örverusamfélaga á Íslandsmiðum en þær gegna mikilvægu hlutverki í vistkerfi hafsins. Nauðsynlegt er að rannsaka örverufræði hafsins í kring um Ísland með nýjum og öflugum aðferðum sem byggja á sameindalíffræði. Við slíka vinnu skiptir gæði sýna og sýnaundirbúningur mjög miklu máli. Í þessari rannsókn var gerð forkönnun á sjósýnum, sýnatöku og sýna‐meðhöndlun áður en sýni verða tekin í miklu magni. Fyrst voru sýni tekin úr smábátahöfninni í Reykjavík til forathugunar og svo var haldið lengra með sýnum úr rúmsjó. Skoðaðar voru heimtur með tilliti til DNA magns og hversu vel tókst til að magna upp erfðaefni örveranna með PCR. Niðurstöðurnar sýndu að besta aðferðin var aðkeypt DNA einangrunarsett sem einangraði mest af DNA og var magnanalegt með PCR. Ódýrari og fljótvirkari aðferð með sjálfvirku einangrunartæki og heimatilbúnum hvarfefnum reyndist einnig mjög vel þar sem sambærilegar niðurstöður fengust úr PCR mögnun þó svo að lægri DNA heimtur fengust. Út frá þessum niðurstöðum er unnt að setja upp verkferla sem byggja á sjálfvirkri DNA einangrun sýna en notkun aðkeyptra einangrunarsetta á erfiðari sýni. Fyrirhugað er að nota þessar niðurstöður við sjósýni úr vorralli Hafrannsóknarstofnunarinnar.
Lykilorð á íslensku: Íslandsmið, sjór, örverur, fjölbreytileiki, sýnaundirbúningur
Summary in English:
The knowledge on microbial diversity and community structure in Icelandic seawater is scarce at present despite their important role in ocean ecology. The agenda is to increase our knowledge in this field by applying recent and powerful analytical tools. In order to do that it is essential to have access to high quality samples and sample preparation procedures. In the present study sea sample preparation was studied with aim of comparing different methods and optimizes the workflow. Samples from a harbour in Reykjavík and open sea samples were used for this purpose. The results showed that an extraction method based on an Epicentre kit gave the best results regarding DNA recovery from the samples and suitability in a PCR amplification. However, a method based on semi‐automatic protocol and in house reagents proofed to be more cost effective and showed comparable performance with PCR suitability of the samples although a lower DNA recovery was obtained. From these results it is now possible to establish an efficient work flow for microbial diversity analysis of sea samples using an automated method as a first choice with the option of more costly method for more challenging samples.
English keywords: Icelandic seawater, microbes, diversity, sample preparation

Contents 1 Introduction ................................................................................................................. 1 2 Materials and Methods ................................................................................................ 3
2.1 Sampling spots ..................................................................................................... 3 2.1.1 East Reykjavík harbor side ............................................................................ 3 2.1.2 South coast of Iceland, district south of Eyjafjallajökull .................................. 4
2.2 Sample preparation (filtration) .............................................................................. 5 2.3 Extraction.............................................................................................................. 6
2.3.1 Extraction with Kingfisher instrument ............................................................. 6 2.3.2 Extraction with MasterPureTM DNA Purification Kit ........................................ 8 (Method of gentle salt-precipitation) ......................................................................... 8 2.3.3 Lysis Extraction .............................................................................................. 9
2.4 Concentration determination with the NanoDrop .................................................. 9 2.5 Gel electrophoresis............................................................................................. 10 2.6 PCR (Teg-System) ............................................................................................. 11 2.7 Gel Band Purification .......................................................................................... 12
3 Experiments and Results .......................................................................................... 13 3.1 Comparison of three different extraction methods using the example of harbor water .......................................................................................................................... 13 3.2 Extraction test with the “MasterPureTM DNA Purification Kit” (EPICENTRE) using the example of one water sampling spot of the South coast of Iceland .................... 15 3.3 Optimization of the “Kingfisher” extraction including a Proteinase K treatment step using the example of one water sampling spot of the South coast of Iceland ... 17
4 Discussion ................................................................................................................. 19 4.1 Comparison of three different extraction methods using the example of harbor water .......................................................................................................................... 19 4.2 Extraction test with the “MasterPureTM DNA Purification Kit” (EPICENTRE) using the example of one water sampling spot of the South coast of Iceland .................... 20 4.3 Optimization of the “Kingfisher” extraction including a Proteinase°K treatment step using the example of one water sampling spot of the South coast of Iceland ... 20
5 Future Prospects ....................................................................................................... 21 6 References ................................................................................................................ 22 7 Appendix ................................................................................................................... 23

1
1 Introduction The exposure of marine microbial structures with the help of modern bioanalytic tools is
becoming more and more important. At least the fast development of high efficient and
comfortable technologies like real-time PCR, microarrays, and sequencing robots
during the last decades were important steps for the realization of such ambitious
analyses. At least cultivation methods are more time consuming and above all in many
cases there is no knowledge about cultivation methods for some species. There are a
vast number of microscopic life forms inhabiting the world’s oceans. According to
nominal cell counts more than 105 cells occupy one ml of surface sea water (Porter and
Feig 1980, Hobbie et al. 1977) which means that projected 3.6 * 1029 microbial cells
inhabit the oceans with a total cellular carbon content of 3 * 2017 g (Whitman et al.
1998). Bacteria, archaea, protists, and unicellular fungi are the biggest part of the
oceanic biomass accounting 98% of primary production (Whitman et al. 1998, Atlas
and Bartha 1993) and mediate all biogeochemical cycles in the oceans (Atlas and
Bartha 1993).
In particular there is a substantial interest for the exploration of the microbial diversity
around the Iceland Sea which so far has not been examined and thus represents a
black box regarding to the prevailed marine ecosystem. The changing of the microbial
flora with changing local external factors represents therefore an interesting part of
marine exploration.
Fig.1.1 Ocean currents surrounding the Icelandic coast One important factor that affects the marine life of Iceland is the differing water
conditions around the island caused by the surrounding current system. Iceland is

2
located 63-67°N and 18-23°W. Nevertheless, the climate along the west and south
coast is quite moderate because a branch of the Gulf Stream, the so called Irmiger
Current, flows along these coast parts (see also Fig.1.1) leaving warm sea
temperatures that rise to over 10 °C in the summer and bringing saline Atlantic water.
On the other hand there is the East Greenland Current that flows west of Iceland
bringing cold water with low salinity. A branch of that current, the East Icelandic
Current, approaches the northeast- and east coasts (Fig.1.1) inducing water
temperatures which only slightly rise to over 8 °C in the north and remaining 8 °C in the
east (Jónsson and Valdimarsson 2007).
Above all the analysis of water samples taken directly after the eruption of
Eyjafjallajökull volcano at the 18th of April 2010 along the south coast of Iceland where
the molten glacial ice mixed with the volcanic ash flew into the surrounding sea, was of
particular interest in order to gain new information about microorganisms of extreme
habitats.
The 16 S rRNA gene is present in all living bacteria and archaea and its evolutionary
rate is suitable to distinguish between genera and most species which makes it an
ideal instrument for these ecological studies (Green and Noller 1997). 16 S rRNA plays
an important role in the biosynthesis of living cells where it is a key factor in translation
of mRNA to proteins (Green and Noller 1997). Highly conserved three dimensional
structures such as hairpins and helices are important for binding of other molecules.
These conserved areas can be used as priming sites for so called universal primers
that are able to hybridize to most bacteria present in a sample which makes it possible
to amplify the detected organisms for a successful analysis.
The initial point of this working part is a new sequencing device, the so called Roche
454 GS-FLX system using Titanium Chemistry (CD genomics) that promises
unprecedented sensitivity and reliability for a range of high throughput sequencing
applications. It is said to obtain up to 500 Mb per run with between one and sixteen
samples with an average read length of 300 to 500 bp.
Aim of the present work
The aim of the present work is to find a reliable procedure of sample preparation that
will allow a successful detection and analysis of microbial diversity, especially for
bacteria and archaea that inhabit the Iceland Sea. The basis to identify microorganisms
with the help of bioinformatics tools by 16°S clone-analysis and sequencing is a good,
reliable and fast DNA extraction method that will guarantee a high yield. Therefore
three different DNA isolation methods were tested and compared
with each other to find the best opportunity.

3
2 Materials and Methods
2.1 Sampling spots
2.1.1 East Reykjavík harbor side
20 l of seawater had been taken from East Reykjavík harbor side which were provided
as trying samples for the methods that are going to be used on the water samples
taken from spots swayed by the volcano eruption of Eyjafjallajökull (subitem°2)
Fig.2.1 Sampling spot (harbor side, East Reykjavík) for the harbor water samples used for pre-
experiments

4
2.1.2 South coast of Iceland, district south of Eyjafjallajökull
Due to the eruption of the Eyjafjallajökull at the 18th of April 2010 water samples (each
with a volume of 500 ml) had been taken at the south coast of Iceland on 13 different
spots (Fig.2.2) at diverse depth (see Appendix Tab.A.1) where the molten glacial ice
combined with the volcanic ash was flown into the sea and dispensed by prevail
currents.
Fig.2.2 Sampling spots of the sea water samples taken from the South coast of Iceland after
the volcano eruption of Eyjafjallajökull at 18th of April.

5
2.2 Sample preparation (filtration)
Materials
• Water samples
• Sterile Filters (pore size: 0,45 µm)
• Petri dishes
• Seawater
• Motor driven pump connected with the filtering device
• Plastic hopper
Procedure 1. East Reykjavík harbor side
The filtration was implemented under sterile conditions with a filtering device actuated
by a motor driven pump. Different volumes were tested, including: 50, 100, 250 and
500 ml. After filtration the filter was put into a Petri dish where it was spiked with four ml
of sterile seawater. The filter coating was removed from the filter by pipetting up and
down or by carefully scraping with the pipet tip and mixed with the seawater. The
volume of 4 ml was subdivided into two 2 ml portions from which one was directly
centrifuged at 8000 x g for 10 min at 4 °C. After the supernatant had been discarded
the fluid of the second vessel was added to the pellet and a further centrifugation under
the same conditions followed. The supernatant was discarded and the pellet stored at –
20 °C for later extraction.
2. South coast of Iceland, district south of Eyjafjallajökull
From each sample 10 ml of liquid were taken out of the bottle, transferred to a separate
vessel and stored for later experiments. The entire remaining volume was filtered under
sterile conditions with a filtering device actuated by a motor driven pump. After filtration
the filter was put into a Petri dish where it was spiked with 4 ml of sterile seawater. The
filter coating was removed from the filter by pipetting up and down or by carefully
scraping with the pipet tip and mixed with the seawater. The total volume of 4ml was
subdivided into two equal portions from which one was used for fixation. The other
sample was centrifuged at 8000 x g for 10 min at 4 °C, the supernatant discarded and
the pellet frozen at –80 °C for later extraction.

6
2.3 Extraction
Three different extraction methods have been employed and checked against each
other to find out the best method for the analysis of the seawater samples.
2.3.1 Extraction with Kingfisher instrument
Materials
• Sample material (water sample pellets)
• Magnesil Kf genomic DNA extraction lysis buffer (Promega, item MD 1521)
• Nanoparticles (UK beads)
• Wash solution 1 (50 mM Tris-HCl, 750 mM NaCl, pH 7.0)
• Wash solution 2 (25% ethanol, 25% isopropanol, 100 mM NaCl, pH 7.0)
• Sterile ddH2O
• Kingfisher nucleic acid extraction instrument (Thermo Fisher Scientific Inc)
• 100 µl trays for Kingfisher extraction instrument (Thermo Fisher Scientific
Inc)
Procedure After thawing 200 µl of lysis buffer were added to each pellet, vortexed vigorously and
incubated at RT for 45 min. During incubation time a 96 well tray was prepared for the
DNA extraction with Kingfisher instrument as shown in Tab.2.1. The UK beads
(1°mg/sample) had been washed twice with sterile ddH2O before they were placed into
the tray. After lysis the sample was centrifuged briefly to collect potential drops from the
rim of the tube at the bottom and then dispersed in wells A, B and C of the
corresponding column. For extraction the tray was placed into the Kingfisher instrument
and the appropriate program was selected. Extraction time took approximately 40 min.

7
Tab. 2.1 Allocation example for a 12 samples tray. One sample is processed through one column by the Kingfisher instrument. The respective sample volume (~ 200 µL) was dispensed into 3 wells (e.g. A1, B1, C1 for sample 1). Wells of row D and E were filled with 100 µL wash solution 1, wells of row F and G with 100 µL wash solution 2. For the elution step (row H) 50 µl ddH2O were put into each well.
1 2 3 4 5 6 7 8 9 10 11 12
A
25 µL
beads
+ 1/3
sample
25 µL
beads
+ 1/3
sample
25 µL
beads
+ 1/3
sample
25 µL
beads
+ 1/3
sample
25 µL
beads
+ 1/3
sample
25 µL
beads
+ 1/3
sample
25 µL
beads
+ 1/3
sample
25 µL
beads
+ 1/3
sample
25 µL
beads
+ 1/3
sample
25 µL
beads
+ 1/3
sample
25 µL
beads
+ 1/3
sample
25 µL
beads
+ 1/3
sample
B
25 µL
beads
+ 1/3
sample
25 µL
beads
+ 1/3
sample
25 µL
beads
+ 1/3
sample
25 µL
beads
+ 1/3
sample
25 µL
beads
+ 1/3
sample
25 µL
beads
+ 1/3
sample
25 µL
beads
+ 1/3
sample
25 µL
beads
+ 1/3
sample
25 µL
beads
+ 1/3
sample
25 µL
beads
+ 1/3
sample
25 µL
beads
+ 1/3
sample
25 µL
beads
+ 1/3
sample
C
25 µL
beads
+ 1/3
sample
25 µL
beads
+ 1/3
sample
25 µL
beads
+ 1/3
sample
25 µL
beads
+ 1/3
sample
25 µL
beads
+ 1/3
sample
25 µL
beads
+ 1/3
sample
25 µL
beads
+ 1/3
sample
25 µL
beads
+ 1/3
sample
25 µL
beads
+ 1/3
sample
25 µL
beads
+ 1/3
sample
25 µL
beads
+ 1/3
sample
25 µL
beads
+ 1/3
sample
D Wash
solution
1
Wash
solution
1
Wash
solution
1
Wash
solution
1
Wash
solution
1
Wash
solution
1
Wash
solution
1
Wash
solution
1
Wash
solution
1
Wash
solution
1
Wash
solution
1
Wash
solution
1
E Wash
solution
1
Wash
solution
1
Wash
solution
1
Wash
solution
1
Wash
solution
1
Wash
solution
1
Wash
solution
1
Wash
solution
1
Wash
solution
1
Wash
solution
1
Wash
solution
1
Wash
solution
1
F Wash
solution
2
Wash
solution
2
Wash
solution
2
Wash
solution
2
Wash
solution
2
Wash
solution
2
Wash
solution
2
Wash
solution
2
Wash
solution
2
Wash
solution
2
Wash
solution
2
Wash
solution
2
G Wash
solution
2
Wash
solution
2
Wash
solution
2
Wash
solution
2
Wash
solution
2
Wash
solution
2
Wash
solution
2
Wash
solution
2
Wash
solution
2
Wash
solution
2
Wash
solution
2
Wash
solution
2
H Sterile
ddH2O
Sterile
ddH2O
Sterile
ddH2O Sterile
ddH2O Sterile
ddH2O
Sterile
ddH2O
Sterile
ddH2O
Sterile
ddH2O
Sterile
ddH2O
Sterile
ddH2O Sterile
ddH2O Sterile
ddH2O

8
2.3.2 Extraction with MasterPureTM DNA Purification Kit
(Method of gentle salt-precipitation)
Materials
• Sample material (water sample pellets)
• MasterPureTM DNA Purification Kit (Epicentre Biotechnologies) including:
o Tissue and Cell Lysis Solution
o MPC Protein Precipitation Reagent
o TE Buffer
o Rnase A (5 µg/µl)
o Proteinase K (50 µg/µl)
• Isopropanol (absolute)
• Ethanol (75%)
Procedure For each sample 1 µl of Proteinase K was first diluted in 300 µl Tissue and Cell Lysis
Solution. 300 µl of this mixture were added to the thawed pellet and mixed thoroughly.
While incubating at 65 °C for 15 min each sample was mixed every 5 min. After having
been cooled down to 37 °C 1 µl of Rnase A was added to each sample and mixed
thoroughly followed by a further incubation at 37 °C for 30 min. After lysis the samples
had been placed on ice for 3 – 5 min. For precipitation 175 µl of MCP Protein
Precipitation Reagent were added to 300 µl of lysed sample and mixed vigorously for
10 s. The cell debris was spun down by centrifugation at 10000 x g for 10 min and the
supernatant transferred to a clean new microcentrifuge tube. 500 µl of isopropanol
were given to each supernatant and every tube was inverted 30 - 40 times. To form a
DNA pellet the samples were centrifugated at 4 °C for 10 min. Without dislodging the
pellet the isopropanol was carefully pipetted off followed by two rinsing steps with
ethanol (75%). After all residuals of ethanol had been removed the DNA was
resuspended in 50 µl of TE Buffer.

9
2.3.3 Lysis Extraction
Materials
• Sample material (water sample pellets)
• Lysis buffer
(50 mM Tris, 1 mM EDTA buffer (pH 7.6), 0.5% (v/v) Tween 20)
• Proteinase K (20 mg/ml)
Procedure 200 µl of lysis buffer were added to each pellet, thoroughly mixed and spiked with 2 µl
of Proteinase K. During incubation in the water bath for 2 h at 55 °C all reaction vessels
had been mixed thoroughly every 30 min. Subsequently a final incubation for 5 – 7 min
at 95 °C was implemented in the thermoblock.
2.4 Concentration determination with the NanoDrop
Concentration and purity of the extracted nucleic acid have been determined with the
NanoDrop ND-1000 Spectrophotometer. 1 µl of each sample was pipetted onto the
sensor, a fiber optic cable, and the photometric measurement was automatically
conducted by the device. The relative elution reagent was used for blank
measurement. The concentration of nucleic acid is measured in ng/µl by the device.
Moreover the purity of the sample is determined by calculating the quotient of the
sample absorption at 260 nm and 280 nm, as well as 260 nm and 230 nm.

10
2.5 Gel electrophoresis
Materials
• Prepared Agarose gel solution (2%) (stored at 60 °C)
• Ethidium bromide
• TAE (Tris-acetate-EDTA) buffer (1 x working solution: 40 mM Tris acetate,
1°mM EDTA)
• 100 bp DNA ladder (100 bp – 2000 bp seperated as follows: 100, 200, 300,
400, 500, 600, 700, 800, 900, 1000, 1500, 2000)
• 1 kbp DNA ladder (0.5 kbp – 10.0 kbp separated as follows: 500, 1000, 1500,
2000, 2500, 3000, 4000, 5000, 6000, 8000, 10000 bp)
• loading dye
• mould and comb
• Gel electrophoresis chamber
• Voltage supply source
• Transilluminator
Procedure 100 ml of the ready to use agarose gel solution had been transferred with 3 µl of
ethidium bromide and gently spilled into the mould. Possible disturbing bubbles were
carefully shifted to the side with a pipet tip. A comb was placed into the mould which
had been removed after 15 min of hardening time. During hardening time 5 µl of each
DNA sample had been mixed with 2 µl loading dye. The solidified gel was placed into
the electrophoresis chamber and TAE buffer was added to cover the gel. The wells
were filled with the prepared DNA samples as well as 8 µl of each 100 bp and 1 kbp
DNA ladder. Gel run was carried out at 100 V, 400 mA for 40 min. The result was
visualized with the transilluminator under ultraviolet light and documented by camera.
11
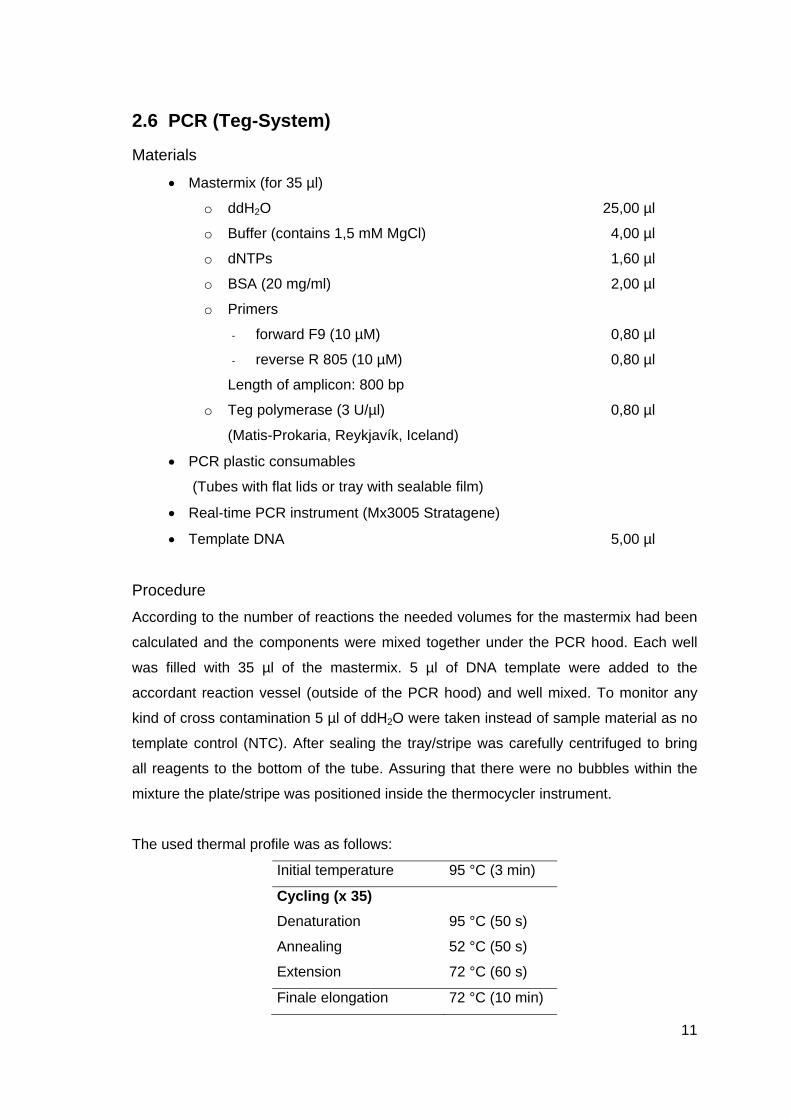
2.6 PCR (Teg-System)
Materials
• Mastermix (for 35 µl)
o ddH2O 25,00 µl
o Buffer (contains 1,5 mM MgCl) 4,00 µl
o dNTPs 1,60 µl
o BSA (20 mg/ml) 2,00 µl
o Primers
- forward F9 (10 µM) 0,80 µl
- reverse R 805 (10 µM) 0,80 µl
Length of amplicon: 800 bp
o Teg polymerase (3 U/µl) 0,80 µl
(Matis-Prokaria, Reykjavík, Iceland)
• PCR plastic consumables
(Tubes with flat lids or tray with sealable film)
• Real-time PCR instrument (Mx3005 Stratagene)
• Template DNA 5,00 µl
Procedure According to the number of reactions the needed volumes for the mastermix had been
calculated and the components were mixed together under the PCR hood. Each well
was filled with 35 µl of the mastermix. 5 µl of DNA template were added to the
accordant reaction vessel (outside of the PCR hood) and well mixed. To monitor any
kind of cross contamination 5 µl of ddH2O were taken instead of sample material as no
template control (NTC). After sealing the tray/stripe was carefully centrifuged to bring
all reagents to the bottom of the tube. Assuring that there were no bubbles within the
mixture the plate/stripe was positioned inside the thermocycler instrument.
The used thermal profile was as follows:
Initial temperature 95 °C (3 min)
Cycling (x 35)
Denaturation 95 °C (50 s)
Annealing 52 °C (50 s)
Extension 72 °C (60 s)
Finale elongation 72 °C (10 min)

12
2.7 Gel Band Purification
Material
• Illustra GFX PCR DNA and Gel Band Purification Kit (GE Healthcare)
including:
o Capture buffer type 3
(Contains pH indicator. Yellow or pale orange color: Capture buffer
sample mix is at optimal pH for efficient DNA binding to the silica
membrane. Dark pink or red color: pH is too high to achieve efficient
DNA adsorption to the silica membrane.)
o Wash buffer type 1
o Elution buffer type 6 (sterile nuclease free water)
o IllustraTM GFXTM MicroSpinTM columns
o Collection tubes
• Cutted Gel Band
Procedure After the wished gel band was cut out the agarose gel with a clean scalpel and put into
a new, clean 1.5 ml microcentrifuge tube ca. 400 µl of capture buffer type 3 were
added till the gel slice was completely covered. The components were mixed by
inversion and then incubated at 60 °C for 15-30 min and 350 rpm until the agarose was
completely dissolved. For each purification, one GFX MicroSpin column was placed
into one Colllection tube. The Capture buffer type 3-sample mix was centrifuged briefly
to collect all liquid at the bottom of the tube, transferred onto the column and incubated
for 1 min at RT followed by one centrifugation step at 16,000 x g for 30 s. The flow
through was discarded and 500 µl of Wash buffer type 1 solution pipeted onto the
column. The column containing tube was spun once again for 30 s at 16,000 x g and
after it the collection tube was discarded and the column transferred to a new clean
one. 50 µl of elution buffer type 6 were added to the center of the membrane,
incubated for 1 min at RT and then centrifuged at 16,000 x g for 1 min to recover the
purified DNA. The purified samples were stored at –20 °C for further experiments.

13
3 Experiments and Results
3.1 Comparison of three different extraction methods using the example of harbor water
With the ambition to find a good, fast and efficient extraction method that yields to a
high amount of isolated nucleic acid and thus is useful for the DNA extraction of the
volcano water samples from the South coast of Iceland, three different extraction
methods were tested and compared with each other. For this test the partially
automated “Kingfisher extraction” method based on the use of paramagnetic particles
was chosen on the one hand. Further the precipitation based “MasterPureTM DNA
Purification Kit” (EPICENTRE) and a Lysis extraction that only includes lysis buffer and
Proteinase K as chemical reagents were consulted.
The harbor water was used as sample material for this pre test to avoid loss of the
precious water samples from the South coast. To get an impression of the sensitivity of
each extraction method four different volumes (50 ml, 100°ml, 250 ml and 500 ml) were
filtrated and treated as described in Materials and Methods 2.2. In case of the first
implemented extraction with the Kingfisher instrument a fit volume of 750 ml was also
tested. But as it took a long lasting filtration time this volume was excluded for the other
extraction methods. The pellets were used for the extraction which was carried out as
described in Materials and Methods 2.3.
As can be seen in the digital image of the pre PCR agarose gel run (Fig.3.1) the
“Kingfisher extraction method” leads to clearly visible high molecular DNA containing
bands at the filtration volumes 500 and 750°ml. In addition one hardly recognizable
band was observed in case of 250 ml filtration volume. In the case of the sample
volumes 50 and 100 ml no band can be seen. This result is reflected by the
concentration values established with the spectrophotometric measurement with the
NanoDrop (Tab.3.1). Reliable values were achieved in case of the 500 and 750 ml
samples. The other values are beneath the detection limit. With the “Epicentre Kit”
clearly visible bands of high molecular DNA were obtained throughout all filtration
volumes. Beyond an increase of band intensity with increasing filtration volume can be
noticed. This increase of intensity with rising volume is supported by the NanoDrop
values (Tab.3.1). In case of the “Lysis Method” no bands were detected on the agarose
gel despite relatively high concentration values shown in Tab.3.1. But in case of the
Lysis extraction the values for the ratio of sample absorbance at 260 and 280 nm were
lower than 2.0, the value for pure DNA. The values for the ratio of sample absorbance

14
at 260 and 230 nm were beneath the range of 1.8 – 2.0 and therefore beneath the
purity value for nucleic acid.
Fig. 3.1 Digital image of a 2% agarose gel run (pre PCR) showing the comparison of the
three different extraction methods “Kingfisher”, “MasterPureTM DNA Purification Kit” (EPICENTRE) and “Lysis Method” using the example of harbor water in different volumes. Line 1: 100 bp ladder. Line 2 – 6: “Kingfisher instrument”. 50, 100, 250, 500, and 750 ml (from left to right). Line 7 – 10: “Epicentre Kit”. 50, 100, 250 and 500°ml (from left to right). Line 11 – 14: “Lysis Extraction”. 50, 100, 250 and 500°ml (from left to right). Line 15: 1 kbp ladder.
Tab.3.1 Determination of concentration and purity of the extracted nucleic acid from the harbor
water samples with the NanoDrop ND-1000 Spectrophotometer. (Values beneath detection limit are marked as cursive)
ng/µl 260/280 260/230
Kingfisher instrument 50 ml 0.8 -1.52 1.39
100 ml 1.2 1.54 -1.39
250 ml 0.8 -4.68 0.01
500 ml 23.0 2.37 1.10
750 ml 125.2 2.23 0.72
Epicentre Kit 50 ml 9.2 1.68 0.67
100 ml 12.2 2.19 0.95
250 ml 28.2 2.15 1.61
500 ml 117.7 2.21 1.87
Lysis 50 ml 15.4 0.97 0.17
100 ml 42.2 1.20 0.29
250 ml 56.1 1.22 0.33
500 ml 148.7 1.31 0.46
10,000 bp
2500 bp
1 2 3 4 5 6 7 8 9 10 11 12 13 14 15

15
After the extraction all samples were used for amplification with universal bacterial
primers (Materials and Methods 2.6). The results of the PCR run are shown in Fig.3.2
Thus the “Kingfisher” extraction led to good visible bands at the wished height of 800
bp for all sample volumes. Just the band of the 50 ml water sample is of less intensity.
The band intensity of the samples 100, 250, 500 and 750 ml is comparable. The
amplification of the samples extracted with the “Epicentre Kit” led to good visible bands
with the same intensity in all cases. Not as intensive but still good detectable are the
bands for 100, 250 and 500 ml of the “Lysis Extraction”. In case of the 50 ml sample no
band can be seen.
Fig. 3.2 Digital image of a 2% agarose gel run (post PCR) showing the comparison of the
three different extraction methods “Kingfisher”, “MasterPureTM DNA Purification Kit” (EPICENTRE) and “Lysis Method” using the example of harbor water in different volumes. Line 1: 100 bp ladder. Line 2 – 6: “Kingfisher instrument”. 50, 100, 250, 500, and 750 ml (from left to right). Line 7 – 10: “Epicentre Kit”. 50, 100, 250 and 500°ml (from left to right). Line 11 – 14: “Lysis Extraction”. 50, 100, 250 and 500°ml (from left to right). Line 15, 16 and 17: empty. Line 18: 1 kbp ladder.
3.2 Extraction test with the “MasterPureTM DNA Purification Kit” (EPICENTRE) using the example of one water sampling spot of the South coast of Iceland
After the comparison of the three different extraction methods on the basis of the
harbor water sample used in different volumes, a test was made with the “Epicentre
Kit” using the water samples from one sampling spot of the Icelandic South coast (#
252, see also Tab.A.1). With the “Epicentre Kit” even the smallest filtration volume of
the harbor water was detected in the pre PCR gel (Fig.3.1) and all samples led to the
same band intensity in the post PCR gel as well. Thus this experiment was carried out,
to get an impression, if it is possible to detect nucleic acid extracted from the volcano
water samples with the “Epicentre Kit”. This sampling spot (# 252) included sampling
depth of 0, 10, 20, 40 and 100 m. The extraction was accomplished as described in
2500 bp
1000 bp 1000 bp
1 2 3 4 5 6 7 8 9 10 11 12 13 14 15 16 17 18

16
Materials and Methods 2.3.2. After the extraction the samples were amplified by Teg-
real-time PCR with universal bacterial primers (Materials and Methods 2.6). Pre as well
as post PCR results are shown in Fig.3.3. Thus high molecular DNA was extracted in
all cases (Line 2 –6). The band for the 10 m sample shows the highest intensity. 0, 20
and 40 m are of nearly the same intensity and 100 m is of lowest intensity and hardly
visible. These optical results are supported by the concentration values measured with
the NanoDrop spectrophotometric device (Tab.3.2). The PCR result (Line 7 – 11)
shows clearly visible bands throughout all samples. The thickest band (marked in red,
Fig.3.3) is the wished amplification at a height of 800 bp which was cut of the gel in
each case and used for gel band purification. The purified DNA was stored for at –20
°C for later planned experiments. No bands are detected in case of the negative
template controls (Line°13°°15).
Fig.3.3 Digital image of a 2% agarose gel run (pre and post PCR) showing the results of the
extraction with the “MasterPureTM DNA Purification Kit” (EPICENTRE) using the example of one water sampling spot (# 252) from the Southcoast/Iceland. Line 1: 100 bp ladder. Line 2 – 6: pre PCR results. Sampling depth: 0 m, 10 m, 20 m, 40 m, 100°m (from left to right). Line 7 – 11: post PCR results. Sampling depth: 0 m, 10 m, 20°m, 40 m, 100°m (from left to right). Line 12: empty. Line 13 – 14: NTC. Line 15: 1°kbp ladder.
Tab.3.2 Determination of concentration and purity of the extracted nucleic acid with the “Epicentre Kit” from the volcano water samples/Southcoast Iceland with the NanoDrop ND-1000 Spectrophotometer. (Values beneath detection limit are marked as cursive)
# 252 ng/µl 260/280 260/230 0 m 36.8 1.96 1.41
10 m 92.8 2.23 1.87
20 m 41.0 2.21 1.27
40 m 36.1 2.09 1.57
100 m 6.3 2.27 0.51
2500 bp
800 bp 1000 bp
1 2 3 4 5 6 7 8 9 10 11 12 13 14 15

17
3.3 Optimization of the “Kingfisher” extraction including a Proteinase K treatment step using the example of one water sampling spot of the South coast of Iceland
Due to the fact that the “Kingfisher” extraction method is half automated and thus faster
and furthermore cheaper than the manually extraction with the “Epicentre Kit” but on
the other hand of less yield, an optimization experiment was implemented inserting an
additional Proteinase K treatment step. Each filtration sample pellet was spiked with
2.5°µl of Proteinase K (20 µg/ml) and incubated at 55 °C for 1 h under mixing. After the
incubation 200 µl of lysis buffer were added to each sample and the extraction was
continued as described in Material and Methods 2.3.1. A PCR with universal primers
was implemented after the extraction. Both pre and post PCR results are shown in
Fig.3.4. No bands throughout all sampling depth were detected in case of the pure
applied DNA (Line 2 – 6). The appropriate concentration values calculated by
NanoDrop measurement are relatively low, too (Tab.3.3). The values for the ratio of
sample absorbance at 260 and 280 nm (Tab.3.3) were lower than 2.0, the value for
pure DNA with the exception of the surface value at 0 m. All values for the ratio of
sample absorbance at 260 and 230 nm (Tab.3.3) were beneath the range of 1.8 – 2.0
and therefore beneath the purity value for nucleic acid. The amplification was effective
and clearly visible, thick bands of the same intensity were detected on the gel at the
expected size of 800 bp (Line 7 – 11, Fig.3.4).
Fig. 3.4 Digital image of a 2% agarose gel run (pre and post PCR) showing the results of the
extraction with the “Kingfisher instrument” tested with an additional Proteinase K treatment step, using the example of one water sampling spot (# 252) from the South coast/Iceland. Line 1: 100 bp ladder. Line 2 – 6: pre PCR results. Sampling depth: 0 m, 10 m, 20 m, 40 m, 100°m (from left to right). Line 7 – 11: post PCR results. Sampling depth: 0 m, 10 m, 20°m, 40 m, 100°m (from left to right). Line 12: empty. Line 13 – 14: NTC. Line 15: 1°kbp ladder.
1000 bp
2500 bp
1000 bp
1 2 3 4 5 6 7 8 9 10 11 12 13 14 15

18
Tab.3.3 Determination of concentration and purity of the extracted nucleic acid with the “Kingfisher instrument + Proteinase K” from the volcano water samples/South coast Iceland with the NanoDrop ND-1000 Spectrophotometer. (Values beneath detection limit are marked as cursive)
# 252 ng/µl 260/280 260/230
0 m 10.1 3.73 1.22
10 m 12.7 1.63 1.38
20 m 11.8 1.52 1.19
40 m 7.4 1.40 1.45
100 m 2.2 2.96 0.04

19
4 Discussion
4.1 Comparison of three different extraction methods using the example of harbor water
With the aim to find a good, fast, efficient and reliable DNA-extraction method that can
be used for the analysis of the water samples taken after the eruption of the
Eyafjallajökull volcano at the south coast of Iceland, three different extraction methods
have been tested. The comparison between the partially automated “Kingfisher
extraction” based on the use of magnetic beads, the “MasterPureTM DNA Purification
Kit (EPICENTRE) and the simple “Lysis method” showed that the best results are
obtained with the “Epicentre-Kit”. In this case thick bands were obtained throughout all
sample volumes (50, 100, 250 and 500 ml) in the pre as well as in the post PCR
agarose gel. The pre PCR gel shows that high molecular DNA was extracted in case of
all volumes. Moreover with this kit reliable predications regarding to sensitivity seem to
be possible because a good visible increasing of the band intensity with increasing
sample volume was detected in the pre PCR gel. This statement is supported by the
results obtained with the NanoDrop spectrophotometric measurement. The increase of
concentration with increasing sample volume reflects the increase of band intensity.
Nevertheless, with the “Kingfisher extraction” method high molecular DNA bands are
good visible in the case of sample volumes 250 and 500 ml in the pre PCR gel. This is
also reflected by the obtained NanoDrop concentration values. In the case of the
sample volumes 50 and 100 ml these values were not significant because they seem to
be under the detection limit. But in the post PCR gel bands were obtained as well for
these volumes. Only the band intensity of the Kingfisher extraction is lower than with
the Epicentre kit. With the Epicentre Kit all bands were of the same strong intensity in
the post PCR gel. In case of the Kingfisher extraction the intensity for sample volume
50 ml is lower than with the other higher concentrations. Consequently the use of the
“Epicentre kit” leads to a higher rate of yield than the “Kingfisher extraction method”. In
case of the Lysis method no visible bands were detected in the pre PCR gel. On
contrary the concentration results obtained by NanoDrop measurement were relatively
high. This can be explained by the obtained values for the ratio of 260/280 and 260/230
which were very low and thus depart from the desired values off 2 and 1.8-2.0.
Therefore contamination caused by proteins and other cell impurities that inhibit the gel
run are thinkable. But even in this case bands were detected at the expected size of

20
800 bp in case of the samples 100, 250 and 500 ml. But the band intensity was lower
as with the other two methods.
4.2 Extraction test with the “MasterPureTM DNA Purification Kit” (EPICENTRE) using the example of one water sampling spot of the South coast of Iceland
The first experiment showed that the “Epicentre kit” leads to the best results regarding
to high yield and sensitivity. Even the lowest concentration was detected in the pre as
well as post PCR gel. Thus this method was adducted for one extraction experiment
with one water sampling point of the Icelandic South coast. Sampling spot #252 (see
Tab.A.1 and Fig.2.2) was chosen for this analysis. This sampling point is characterized
by a farther distance from the coastline where lower concentrations may be expected
than at sampling spots close to the coast. 0, 10, 20, 40 and 100 m were the chosen
sampling depth. The extraction was successful in every case because good visible
bands of high molecular DNA were detected throughout all samples in the pre PCR gel.
In case of the 10 m water sample the band intensity was the highest and lowest for the
surface and the deepest (100 m) sample. This result is supported by the NanoDrop
values. Additionally this result seems to be realistic because the most material is
expected beneath the surface around the 10 m level. With increasing depth a decrease
of concentration may be expected and this is also reflected and supported by the
obtained results regarding to the low intensity band at 100 m sampling depth. Thus the
“Epicentre kit” seems to be a very reliable extraction method for these valuable sample
material because even from low concentrated samples DNA can be extracted and
verified. Furthermore the PCR implemented with the universal bacterial primers was
successful in all cases and therefore seems to be an adequate tool for the analysis.
4.3 Optimization of the “Kingfisher” extraction including a Proteinase°K treatment step using the example of one water sampling spot of the South coast of Iceland
So far the “Epicentre kit” was posed to be the method of choice regarding to the
analysis of the volcano water samples from the south coast of Iceland. But still this
method is disadvantageous regarding to cost-effectiveness. Furthermore the handling
is much more elaborate and time consuming than the half automated “Kingfisher
extraction method”. For this reason an optimization experiment was implemented to

21
see if there is an opportunity to improve the “Kingfisher extraction method” regarding to
the rate of yield and sensitivity. In this optimization experiment a proteinase K
treatment step that is also used in case of the “Epicentre extraction” was attached to
the procedural method. For a reliable comparison to the results obtained by “Epicentre
extraction” the same sampling spot was chosen for the implementation. In contrast to
the “Epicentre kit” results there were no bands visible in the pre PCR gel throughout all
samples. Moreover the concentration values obtained by NanoDrop measurement
were nearly three to four times lower than the ones of the “Epicentre method”. The
concentration value for 100 m sampling depth seems to be under the detection limit.
The values for 260/280 and 260/230 measurement are lower than the desired values of
2 and 1.8 – 2 which is an indicator for protein and other cell contaminations. But
nevertheless after PCR thick bands with the same intensity throughout all samples
were detected in the gel which means that the extraction was successful. Only the
concentration of pure DNA may be insufficient for pre PCR gel detection. Or inhibitory
effects caused by contaminants prevent the gel run. But still there is enough DNA
material for amplification. And even at 100 m sampling depth a very good visible band
could be seen in the gel. In conclusion with this additional proteinase K step an
optimization was achieved regarding to sensitivity because even at sampling points of
low concentration good visible results were obtained.
As consequence this faster and cheaper method can also be used for the analysis of
the volcano seawater samples. Only in exceptional cases of maybe very low
concentrations that might not be detected by “Kingfisher extraction” it seems to be
useful to repeat the extraction manually with the “Epicentre kit”.
5 Future Prospects With the pre tests exposed afore a reliable procedural method was elaborated that can
now be used for further experiments. A 16 S clone analysis is intended, to gain new
valuable information about the different communities, the allocation as well as the
diversity of marine bacteria and archaea inhabit the Icelandic sea which has not been
done before. With this favorable method it should be possible to implement the
16°S°rRNA gene cloning, sequencing and identification of the gained sequences by
bioinformatics tools (alignment). Also with the background to test the new sequencing
device Roche 454 GS-FLX system using Titanium Chemistry (CD genomics)
mentioned in the introduction.
22
6 References Atlas, R. M. and Bartha, R. 1993. Microbial Ecology: Fundamentals and Applications (3rd edition). Redwood City, CA. The Benjamin/Cummings publishing Company, Inc. Green, R. and Noller, H.F. 1997. Ribosomes and translation. Annu. Rev. Biochem. 66: 679-716 Hobbie, J. E., Daley, R. J., Jasper, S. 1977. Use of nucleopore filters for counting bacteria by fluorescence microscopy. Appl. Environ. Microbiol. 33, 225–1228. Jónsson, S. and Valdimarsson, H. 2007. 60 års klimavariasjoner I havet rundt Island. Klima (Norklima), 3, 35-37. Porter, K. G. and Feig, Y. S. 1980. The use of DAPI for identifying and counting aquatic microflora. Limnol. Oceanogr. 25, 943–948. Whitman, W. B., Coleman, D. C., Wiebe, W. J. 1998. Prokaryotes: The unseen majority. Proc. Natl. Acad. Sci. USA 95, 6578–6583.

23
7 Appendix Tab.A.1 Sampling locations and corresponding sampling depth of the seawater samples taken
from the South coast of Iceland belonging to Fig.2.2
Sample name Sampling depth (m)
# 229 0
# 229 10
# 230 0
# 230 10
# 230 20
# 230 30
# 230 50
# 231 0
# 231 10
# 231 20
# 231 30
# 231 50
# 232 0
# 232 10
# 232 20
# 232 50
# 232 150
# 238 0
# 238 10
# 238 20
# 238 30
# 238 50
# 240 0
# 240 10
# 240 20
# 240 30
# 240 50
# 242 0
# 242 10
# 242 20
# 242 30
# 242 50
# 245 0
# 245 10
# 245 20
# 245 30

24
# 245 47
# 247 0
# 247 10
# 247 20
# 247 30
# 247 50
# 249 0
# 249 10
# 249 20
# 249 30
# 249 50
# 252 0
# 252 10
# 252 20
# 252 30
# 252 50
# 254 0
# 254 10
# 254 20
# 254 30
# 254 50
# 254 130
# 256 0
# 256 10
# 256 20
# 256 30