preparation methods for nanocrystalline...
TRANSCRIPT

Department of Chemistry and Chemical Engineering
CHALMERS UNIVERSITY OF TECHNOLOGY
Gothenburg, Sweden 2015
Preparation Methods for
Nanocrystalline Cellulose
- Acid hydrolysis and various cellulose
sources
Bachelor Science Thesis
Linnéa Nilsson


Preparation Methods for Nanocrystalline Cellulose
- Acid hydrolysis and various cellulose sources
LINNÉA NILSSON
Supervisor: Gunnar Westman
Department of Chemistry and Chemical Engineering
Division of Organic Chemistry
CHALMERS UNIVERSITY OF TECHNOLOGY
Göteborg, Sweden 2015

Preparation Methods for Nanocrystalline Cellulose
- Acid hydrolysis and various cellulose sources
LINNÉA NILSSON
© LINNÉA NILSSON, 2015
Department of Chemistry and Chemical Engineering
Division of Organic Chemistry
Chalmers University of Technology
SE-412 96 Göteborg
Sweden
Telephone +45 (0) 31 772 1000
Cover:
AFM pictures of nanocrystalline cellulose prepared from sulphuric acid with two different starting materials,
microcrystalline cellulose and cellulose extracted from barley husk.
Göteborg, Sweden 2015

I
Preparation Methods for Nanocrystalline Cellulose
- Acid hydrolysis and various cellulose sources
LINNÉA NILSSON
Department of Chemistry and Chemical Engineering
Chalmers University of Technology
ABSTRACT
The aim of this project has been to prepare nanocrystalline cellulose (CNC) from hydrochloric acid
hydrolysis and optimise the process. CNC was also prepared from sulphuric acid hydrolysis to use
as a reference. The starting material in both these processes was microcrystalline cellulose (MCC),
therefore another cellulose source was used to try and prepare CNC from. The cellulose was
extracted from barley husk in another project performed in the same division which is usually
considered a waste product.
Four different procedures were performed using hydrochloric acid, where the first three procedures
followed various studies in literature and the parameters of the fourth procedure was determined
after evaluating the results from the first three. After analysing the samples with atomic force
microscopy (AFM) it was found that no clear CNC had been obtained.
Preparing CNC from sulphuric acid hydrolysis was shown to be an optimised process with
successful results. Characteristic rod-like crystals were obtained and could be seen after using AFM.
Therefore this process was used in the attempt of preparing CNC from cellulose that was extracted
from barley husk. Two different procedures were evaluated, one starting with wet cellulose and one
with dry cellulose. It was found that preparing CNC from dry cellulose with sulphuric acid
hydrolysis was possible. The AFM picture showed that some of the crystals seemed to be a bit too
long to be nanosize which implies that the process needs to be evaluated and adjusted.
The conclusions of this project is that further studies must be performed on preparing CNC from
hydrochloric acid hydrolysis to obtain an optimised process. It is possible to prepare crystals from
cellulose extracted from barley husk although the process must be further evaluated to obtain
parameters that accommodates the cellulose source. It has been shown that preparing CNC from
sulphuric acid hydrolysis is an optimised and established process.
Keywords: Nanocrystalline cellulose, acid hydrolysis, barley husk, hydrochloric and sulphuric acid

II
SAMMANFATTNING
Syftet med detta projekt har varit att framställa nanokristallin cellulosa (CNC) genom saltsyra
hydrolys samt optimera denna process. CNC framställdes också genom svavelsyra hydrolys för att
användas som referens. Startmaterialet i båda dessa processer var mikrokristallin cellulosa (MCC),
därför undersöktes det om det gick att framställa CNC från ytterligare en cellulosa källa. Cellulosan
extraherades från kornskal och anses vara en avfallsprodukt, den framställdes i ett annat projekt som
utfördes på samma avdelning.
Fyra olika procedurer utfördes med saltsyra, där de första tre procedurerna följde olika studier i
litteratur och parametrarna för den fjärde proceduren bestämdes utefter resultaten från de tre första.
Efter analys med atomic force microscopy (AFM) konstaterades det att ingen tydlig CNC hade
erhållits. Framställning av CNC genom svavelsyra hydrolys visade sig vara en optimerad process
där man kan få framgångsrika resultat. Karaktäristiska stav-liknande kristaller erhölls och kunde
observeras efter analys med AFM.
Därför användes även denna process i försöket att framställa CNC från en cellulosa som extraherats
från kornskal. Två olika procedurer utvärderades där den ena startade med blöt cellulosa och den
andra med torr cellulosa. Det konstaterades att det var möjligt att framställa CNC genom svavelsyra
hydrolys med torr cellulosa som startmaterial. AFM bilderna visade att somliga av de erhållna
kristallerna verkade vara lite för långa för att vara i nanostorlek vilket indikerade att processen måste
studeras vidare och justeras.
Slutsatserna av detta projekt är att fortsatta studier måste utföras när det gäller att framställa CNC
genom saltsyra hydrolys för att erhålla en optimerad process. Det är möjligt att framställa kristaller
från cellulosa som extraherats från kornskal, dock måste processen studeras vidare för att få fram
parametrar som passar cellulosa källan. Det har också visat sig att framställa CNC genom svavelsyra
hydrolys är en optimerad och etablerad process.

III
ABBREVATIONS
CNC Nanocrystalline cellulose
MCC Microcrystalline cellulose
AFM Atomic Force Microscopy
XRD X-ray Diffraction
FT-IR Fourier Transform Infrared Spectroscopy
NMR Nuclear Magnetic Resonance

IV
CONTENT
1. Introduction ............................................................................................................................................................................. 1
1.1 Background ..................................................................................................................................................................... 1
1.2 Objectives ........................................................................................................................................................................ 2
2 Theory ...................................................................................................................................................................................... 3
2.1 Cellulose .......................................................................................................................................................................... 3
2.2 Nanocrystalline cellulose ........................................................................................................................................... 4
2.3 Cellulose sources .......................................................................................................................................................... 4
3 Experimental ........................................................................................................................................................................... 6
3.1 Materials .......................................................................................................................................................................... 6
3.1.1 Chemicals .............................................................................................................................................................. 6
3.1.2 Other material ....................................................................................................................................................... 6
3.1.3 Apparatus ............................................................................................................................................................... 6
3.2 Methods ........................................................................................................................................................................... 6
3.2.1 Dialysis ................................................................................................................................................................... 6
3.2.2 Preparation of CNC through sulphuric acid hydrolysis .......................................................................... 6
3.2.3 Preparation of CNC through hydrochloric acid hydrolysis ................................................................... 7
3.2.4 Preparation of CNC using cellulose extracted from barley husk ......................................................... 8
4 Analysis and characterisation ............................................................................................................................................ 9
5 Results and discussion ...................................................................................................................................................... 10
5.1 Preparation and characterisation of CNC through sulphuric acid hydrolysis ......................................... 10
5.2 Preparation and characterisation of CNC through hydrochloric acid hydrolysis .................................. 13
5.3 Preparation and characterisation of CNC from Barley Husk ....................................................................... 20
5.3.1 Cellulose crystallinity ..................................................................................................................................... 20
5.3.2 Characterisation of CNC ................................................................................................................................ 21
6 Conclusions .......................................................................................................................................................................... 25
7 Future perspectives............................................................................................................................................................. 26
8 Acknowledgements ............................................................................................................................................................ 27
9 References ............................................................................................................................................................................. 28
A. AFM pictures ......................................................................................................................................................................... I
B. X-ray diffraction ................................................................................................................................................................ III
C. FT-IR Spectra ................................................................................................................................................................... VIII

1
1. INTRODUCTION
1.1 BACKGROUND
Cellulose is an interesting and sought of material due to current demands for green chemistry, more
environmentally friendly resources and renewable raw material. The use of cellulose is therefore
highly attractive because of it being renewable, biodegradable and non-toxic [1]. In recent years,
nanotechnology and especially nanocellulose has received a lot of attention and is one of the most
interesting and promising areas for future development [2]. Nanocrystalline cellulose (CNC) has
unique characteristics and can be used as a reinforcement in polymer nanocomposites to highly
enhance mechanical properties [3].
Before being able to fully apply CNC, various preparation methods must be evaluated to be able to
obtain a stable and usable material. Today’s most common method for extracting CNC is through
controlled acid hydrolysis where sulphuric acid is the most used because it creates a stable aqueous
suspension of CNC. When using sulphuric acid, charged sulfate groups attach to the surface of the
CNC after the hydrolysis which induces a significant decrease in thermal stability [3]. There is
therefore an interest in using an acid that would not create charged CNC such as hydrochloric acid.
A less stable aqueous suspension will be obtained using hydrochloric acid but the thermal stability
will increase. As a consequence, there is a delicate balance to find a thermal stable CNC that at the
same time gives a stable suspension. It is therefore important to study various types of acids and
preparation methods to gain more knowledge about the differences in properties of the CNC and to
obtain the highest compatible CNC for use in polymer matrices. It is also important to compare and
evaluate different starting material and various cellulose sources, to obtain material that can be used
in sustainable industrial processes.

2
1.2 OBJECTIVES
The aim of this project was to optimise the production of CNC extracted through acid hydrolysis
using hydrochloric acid and create a reliable process for future use. Part of the project was to produce
CNC using sulphuric acid to use as a reference.
The aim was also to examine whether CNC could be obtained from an alternative cellulose source
such as annual plants. In a parallel bachelor project at the department, extraction of hemicellulose
from annual plants (barley husk), cellulose was obtained as a by-product. The cellulose extracted
from barley husk was collected and analysed to find out if it was crystalline enough to be used for
CNC preparation. Solid state NMR and XRD were used in order to characterise the cellulose and
for the nanocrystals AFM, IR and XRD were used.

3
2 THEORY
2.1 CELLULOSE
Cellulose is one of the most abundant natural biopolymer in the world. It can be found in a variety
of sources such as trees, plants, animals and some bacteria [2], but the most important and common
source is wood which contains up to 50% cellulose. Cellulose is a linear homopolysaccharide that
consist of anhydroglucopyranose units linked together by β-1,4-glycosidic bonds where the
repeating unit is two glucose monomers known as cellobiose, see figure 1 [4].
Figure 1. Molecular structure of the repeating unit of cellulose.
Every glucose monomer consists of three hydroxyl groups which gives the cellulose molecule high
functionality and thus makes it an interesting and important material to study [1]. Due to the
hydroxyl groups, cellulose molecule chains attach to each other through hydrogen bonding and form
larger units called elementary fibrils. These pack into even larger units called microfibrils, which
are composed into fibres and this whole contexture creates a morphological hierarchy formed by
the hydrogen bond network. The microfibrils has a diameter of 5-50 nm and several micrometers in
length and within these fibrils there are highly ordered crystalline regions and disordered amorphous
regions as can be seen in figure 2 [4,5].
Figure 2. Crystalline and amorphous regions within a microfibril.

4
The crystalline regions contain complicated intra- and intermolecular interactions while the
amorphous regions are regularly scattered. By isolating and extracting the crystalline regions,
nanocrystalline cellulose can be obtained.
2.2 NANOCRYSTALLINE CELLULOSE
When extracting CNC using controlled acid hydrolysis, the amorphous regions will initially
decompose due to them being more accessible compared to the crystalline regions higher resistance.
Thereafter rod-like cellulose crystals with typical diameter of 2-20 nm and length from 100 to 600
nm will be obtained [2]. During acid hydrolysis, parameters such as cellulose source, type of acid,
reaction time and temperature are vital for the characterisation of the nanocrystals. These parameters
will determine the properties of the nanocrystals, partially due to crystalline and amorphous regions
that change significantly depending on the cellulose source [6].
As mentioned earlier, CNC is highly interesting as reinforcement in polymer nanocomposites. This
is due to their low density, high aspect ratio, low toxicity, good mechanical properties and reactive
hydroxyl groups attached to the surfaces [7]. Although CNC has a lot of unique characteristics there
are some disadvantages such as difficulty in dispersing in organic solvents and tendency to
aggregate during drying processes due to the hydroxyl groups. Therefore a lot of interest in surface
modification of nanocrystals have attracted attention to improve the dispersibility and make the
nanocrystals more compatible with different polymer matrices.
Addition of surfactants and modification by surface grafting are two common methods for this
purpose [8]. If the shortcomings of CNC can be managed, there are a lot of applications to be
considered such as in paper and packaging products, construction, furniture, electronics, pharmacy
and so on [2]. A great benefit for these applications are that only a percentage of nanocrystals are
required to reinforce the material when applied in composites.
2.3 CELLULOSE SOURCES
As previously mentioned it is important to consider different cellulose sources when extracting CNC
through acid hydrolysis. The various parameters of the hydrolysis must be adjusted to suit the
cellulose starting material. The properties of the nanocrystals will also turn out differently depending
on the source. Therefore several studies have been made with different cellulose sources such as
bamboo [6], curaua fibers [9], sugarcane bagasse [7] and so on. Considering various cellulose
sources is also vital to obtain sustainable and economically feasible industrial productions. This is
one of the main problems that has to be evaluated to be able to implement CNC more today.

5
Therefore a different cellulose source was evaluated in this study instead of using industrially made
microcrystalline cellulose (MCC) which is too expensive when producing CNC in larger scales.
The cellulose was produced as a by-product when extracting hemicellulose from barley husk in
another bachelor project performed at the same department [10]. Barley husk is a material that is
considered a waste product and is often discarded. Instead of throwing away this material, other
applications are examined such as extracting hemicellulose for use in biocomposites. The cellulose
that is extracted as a by-product is not further used and is usually discarded. By examining its
crystallinity and the possibility of producing nanocrystals a more sustainable process is created
when recycling within the department. The cellulose was prepared following a method studied by
Höije et al. with some adjustments [11].

6
3 EXPERIMENTAL
3.1 MATERIALS
3.1.1 Chemicals
Sulphuric acid from Sigma Aldrich
Hydrochloric acid from Honeywell
3.1.2 Other material
Microcrystalline cellulose, Avicel PH-101 from FMC Biopolymer
Dialysis membrane, Standard RC Tubing from Spectrum Labs (part no. 132684)
3.1.3 Apparatus
Centrifuge: Megafuge 40 centrifuge.
Sonicator: Sonics vibra cell from Chemical instruments AB.
Conductometric Analyser: EcoScan from Eutech instruments.
FT-IR: Spectrum One from PerkinElmer instruments.
XRD: Diffractometer D5000 from Siemens.
AFM: NanoScope III from Digital Instruments Santa Barbara, California.
3.2 METHODS
3.2.1 Dialysis
Dialysis is used to wash away excess ions. It was performed using a dialysis membrane that was
prepared by being put in deionised water for 15 minutes. Thereafter one end was tied together and
the suspension was added to the membrane through a funnel and the other end was tied together.
The membrane was put in a container with deionised water.
3.2.2 Preparation of CNC through sulphuric acid hydrolysis
The starting material MCC was hydrolysed with 64% w/w sulphuric acid. 40 g of MCC was added
to 250 ml of sulphuric acid and the hydrolysis was carried out at 45°C for 2 hours under constant
mechanical stirring. The suspension was then diluted into 7 litres of deionised water and centrifuged

7
at 4300 rpm for 15 minutes. The supernatant was removed and the solid phase was diluted with 2
litres deionised water and put on dialysis until the conductivity measured below 5 µS. After
cancelling the dialysis, the suspension was sonicated at an amplitude of 40% for 6 x 7 minutes.
3.2.3 Preparation of CNC through hydrochloric acid hydrolysis
Preparation of CNC through hydrochloric acid hydrolysis was carried out in four different
procedures following studies in literature with some adjustments. Procedure 1 was prepared by
following a study on curaua fibers [9], procedure 2 followed a dissertation on nanocomposites based
on nanocellulose whiskers [12] and procedure 3 followed a study on facile extraction of thermally
stable CNC [13]. Procedure 4 was established and determined after analysing the results from
procedure 1, 2 and 3. The starting material in all procedures was microcrystalline cellulose.
Procedure 1
MCC was hydrolysed with 4 M hydrochloric acid. 5 g of MCC was added to 100 ml hydrochloric
acid and the hydrolysis was carried out at 45°C for 90 minutes under constant stirring. The
suspension was then diluted into 500 ml deionised water and centrifuged at 4300 rpm for 15 minutes.
The supernatant was removed and the solid phase was diluted into 600 ml deionised water and the
suspension was vigorously stirred for 1 hour. Thereafter the suspension was put on dialysis until the
conductivity measured below 5 µS. After cancelling the dialysis, the suspension was centrifuged at
4300 rpm for 15 minutes and the solid phase was collected, filtered using Microfunnel Plus filter
unit 0.45 µm and dried.
Procedure 2
5 g of MCC was hydrolysed with 361 ml of 4 M hydrochloric acid in a water bath shaker at 80°C
for 8 hours. The suspension was diluted into 1200 ml deionised water to terminate the reaction. The
cellulose settled overnight and was then centrifuged until the pH of the supernatant was around 3.
Thereafter the suspension was put on dialysis until the conductivity measured below 5 µS. After the
dialysis, the suspension was sonicated at an amplitude of 40% for 2 minutes and then centrifuged at
3000 rpm for 5 minutes. The turbid supernatant was decanted and the solid phase was diluted into
400 ml deionised water, sonicated and re-centrifuged. This procedure was supposed to be repeated
until the supernatant became clear. After the procedure was repeated several times and no clear

8
supernatant could be observed, the solid phase was collected and the turbid supernatant was filtered.
Both the solid phase and the filtered supernatant was dried.
Procedure 3
MCC was hydrolysed with 6 M hydrochloric acid. 5 g of MCC was added to 200 ml of hydrochloric
acid and sonicated at an amplitude of 40% for 3 x 2 minutes. The hydrolysis was carried out at
100°C for 2 hours under constant mechanical stirring. The suspension was diluted into 1000 ml
deionised water and centrifuged at 4300 rpm for 15 minutes. The solid phase was diluted into 300
ml deionised water and put on dialysis until the conductivity measured below 5 µS. After the
dialysis, the suspension was centrifuged at 4300 rpm for 15 minutes, filtered and dried.
Procedure 4
5 g of MCC was added to 200 ml of 6 M hydrochloric acid and hydrolysed in a water bath shaker
at 80°C for 3 hours. The suspension was diluted into 2 litres deionised water and left overnight. The
suspension was then centrifuged at 4300 rpm for 15 minutes where the solid phase was diluted into
100 ml deionised water and transferred to a dialysis membrane. When the conductivity measured
below 5 µS the dialysis was terminated and the suspension was sonicated at an amplitude of 40%
for 2 x 2 minutes.
3.2.4 Preparation of CNC using cellulose extracted from barley husk
The nanocrystals from cellulose extracted from barley husk was prepared through sulphuric acid
hydrolysis using 64% w/w sulphuric acid. 10 g of cellulose was added to 87,5 ml acid and
hydrolysed at 45°C for 2 hours under constant mechanical stirring. The reaction was terminated by
diluting the solution in 1750 ml deionised water and then centrifuged at 4300 rpm for 15 minutes.
After decanting, the solid phase was diluted into 500 ml deionised water and transferred to a dialysis
membrane. The dialysis ended when the conductivity measured below 5 µS and then sonicated at
an amplitude of 40% for 5 x 7 minutes.

9
4 ANALYSIS AND CHARACTERISATION
Fourier transform infrared spectroscopy (FT-IR)
FT-IR was performed to determine functional groups and examine different peaks that can indicate
cellulose crystallinity. 2 mg of each sample was mixed with 300 mg of potassium bromide, finely
ground and pressed under vacuum to form pellets. The FT-IR spectrum was then recorded in the
range of 4000-400 cm-1 and were set to 16 scans per sample. Crystallinity index was calculated by
taking the ratio between band intensity at around 1425 cm-1 and band intensity at around 900 cm-1
[14]. This is due to cellulose being sensitive to crystal structure at absorbance values around the
850-1500 cm-1 region. With higher crystallinity index values, the crystallinity and ordered structure
in a sample increases [7, 15].
Powder X-ray Diffraction
XRD were used to analyse crystallinity and calculate a crystallinity index. Each sample was grinded
into a fine powder and placed on a sample holder to obtain total X-ray exposure. The X-ray
diffractometer operated at 45 kV and 40 mA. The patterns were obtained over the angular range 2θ
= 10-60° and the crystallinity was calculated using the following equation, calculations can be found
in appendix B, [14, 16]:
𝐶𝑟𝐼(%) =𝐼002−𝐼𝑎𝑚𝑜𝑟𝑝ℎ𝑜𝑢𝑠
𝐼002 𝑥 100 (1)
Where I002 is the maximum intensity of the crystalline peak at a diffraction angle around 2θ = 22°
and Iamorphous is the minimum intensity scattered by the amorphous part at a diffraction angle around
2θ = 18°. The intensities can be seen highlighted in figure 3.
Atomic Force Microscopy
AFM was performed to examine the dimensions of the nanocrystals by viewing them individually.
Each sample was diluted to 0.005% with deionised water. Thereafter the samples were put in
ultrasonification for 10 minutes. One drop from each sample was placed on a mica plate and dried
for about 30 minutes. The AFM analysis was performed by Anders Mårtensson, Polymer
Technology, Chalmers.

10
5 RESULTS AND DISCUSSION
5.1 PREPARATION AND CHARACTERISATION OF CNC THROUGH SULPHURIC ACID
HYDROLYSIS
The hydrolysis was carried out at 45°C for 2 hours and after the hydrolysis was completed, the
solution had a discoloured appearance. After being put on dialysis the suspension was white and
had cloudlike patterns that implied there was small particles in the suspension. These observations
indicated that the hydrolysis had succeeded. After the suspension had been sonicated, 50 ml were
freeze-dried.
A few milligrams of the freeze dried sample was analysed with XRD. The result can be seen in
figure 3, where CNC-S stands for CNC from sulphuric acid hydrolysis, together with the XRD result
of the starting material MCC.
The XRD pattern showed that the CNC had the typical pattern of crystalline cellulose with a high
peak at around 2θ = 22° [8, 14]. It can also be observed that the peaks of CNC is broader than the
peaks of MCC, which implicates that the nanocrystals are more crystalline than the microcrystals.
Figure 3. XRD pattern of CNC from sulphuric acid hydrolysis (CNC-S) and starting material microcrystalline
cellulose (MCC) with the peaks I002 and Iamorphous highlighted.

11
When looking at the pattern for CNC there is a barely noticeable peak at around 2θ = 34° compared
to a clearly visible peak for MCC. This is due to sulphuric acid being a strong acid that can damage
the crystalline domains during the acid hydrolysis [13]. The crystallinity was calculated using
equation 1 that can be found in chapter 4. The crystallinity of CNC was calculated to be 82,2%
while MCC was calculated to be 83,7%. This can be a result of difficulties in grinding the freeze-
dried sample into a fine powder or that CNC loses some of its properties when fully dried.
The freeze dried sample was also analysed with FT-IR which can be seen in figure 4. It can be
observed that the peak at around 3400 cm-1 is further down for MCC than for CNC, which indicated
that there were less amorphous regions for CNC. This can be due to the hydrogen bonding being
less flexible when the material is more crystalline [14].
The peak on CNC at around 3400 cm-1 is also slightly sharper than for MCC which is an additional
indication of nanocrystals [17]. The crystallinity index for CNC was calculated to be 0,85 and the
index for MCC was calculated to be 0,60 which also implied that the CNC was more crystalline.
How this was calculated can be found in chapter 4.
Figure 4. FT-IR spectra of CNC from suplhuric acid hydrolysis (CNC-S) and starting material microcrystalline cellulose (MCC).

12
The suspension was analysed with AFM which showed the dimensions of the nanocrystals. As can
be seen in figure 5, the CNC had the characteristic rod-like shape and showed slight agglomeration
which can depend on the suspension being stored for about a month. This showed that
nanocrystalline cellulose in fact had been obtained.
Figure 5. AFM picture of a CNC suspension from sulphuric acid hydrolysis.

13
5.2 PREPARATION AND CHARACTERISATION OF CNC THROUGH HYDROCHLORIC
ACID HYDROLYSIS
The preparation of CNC through hydrochloric acid hydrolysis was carried out in four different
procedures with different parameters which can be seen in table 1. The first three procedures was
following studies in literature while procedure 4 was performed after evaluating the results from the
first three procedures. Procedure 2 had a dark brown colour after the hydrolysis which indicated that
the reaction had gone too far and the acid probably attacked the nanocrystals.
Table 1. Four different preparation methods and parameters of CNC through hydrochloric acid hydrolysis.
Procedure Temperature (°C) Time of
hydrolysis (min)
Concentration
of acid (M)
Acid/pulp ratio
(ml/g)
Appearance
1 45 90 4 20 White
2 80 480 4 72,2 Slightly yellow
3 100 120 6 40 Dark brown
4 80 180 6 40 Discoloured
The first three procedures were analysed with XRD, see figure 6 below, where CNC-H stands for
CNC from hydrochloric acid. All three procedures followed the same pattern which match the
typical cellulose crystallinity pattern. When evaluating the result it can be observed that the graph
of procedure 2 had slightly broader peaks than the two other procedures. This implied that procedure
2 had more crystalline content and was the most likely to have succeeded.

14
The crystallinity index was calculated using equation 1 and the result can be seen in table 2 where
it is compared to the crystallinity calculated for MCC. The calculation showed that neither of the
procedures had succeeded to obtain CNC through hydrochloric acid and that MCC was more
crystalline than any of them.
Table 2. Crystallinity index of MCC and four different procedures of CNC from hydrochloric acid hydrolysis.
Sample CrI(%) from XRD Crystallinity index from
FT-IR
MCC 83,7 0,60
Procedure 1 82,1 0,53
Procedure 2 83 0,85
Procedure 3 80,6 0,82
Procedure 4 85,7 0,80
Figure 6. XRD pattern of CNC from hydrochloric acid hydrolysis in three different procedures.

15
The procedures were also analysed using FT-IR and the results can be seen in figure 7. The FT-IR
analysis showed that procedure 2 and 3 indicated to be more crystalline than MCC by observing the
shape of the graphs. This is due to, as previously mentioned, a sharper peak at around 3400 cm-1
that is not as far down as for MCC. Procedure 1 followed almost the exact same pattern as MCC
and it is therefore implied that this procedure had not been successful.
The crystallinity index for the different procedures was calculated and is shown in table 2. By
evaluating the various index results, procedure 2 indicated to have the most crystalline structure.
After analysing with XRD and FT-IR it was determined that procedure 2 gave the best result and
was slightly more crystalline than the other samples from procedure 1 and 3. Therefore a larger
batch was produced following procedure 2 and was analysed with AFM together with samples from
procedure 1 and 3. The AFM picture of procedure 1 showed barely any result at all and can be seen
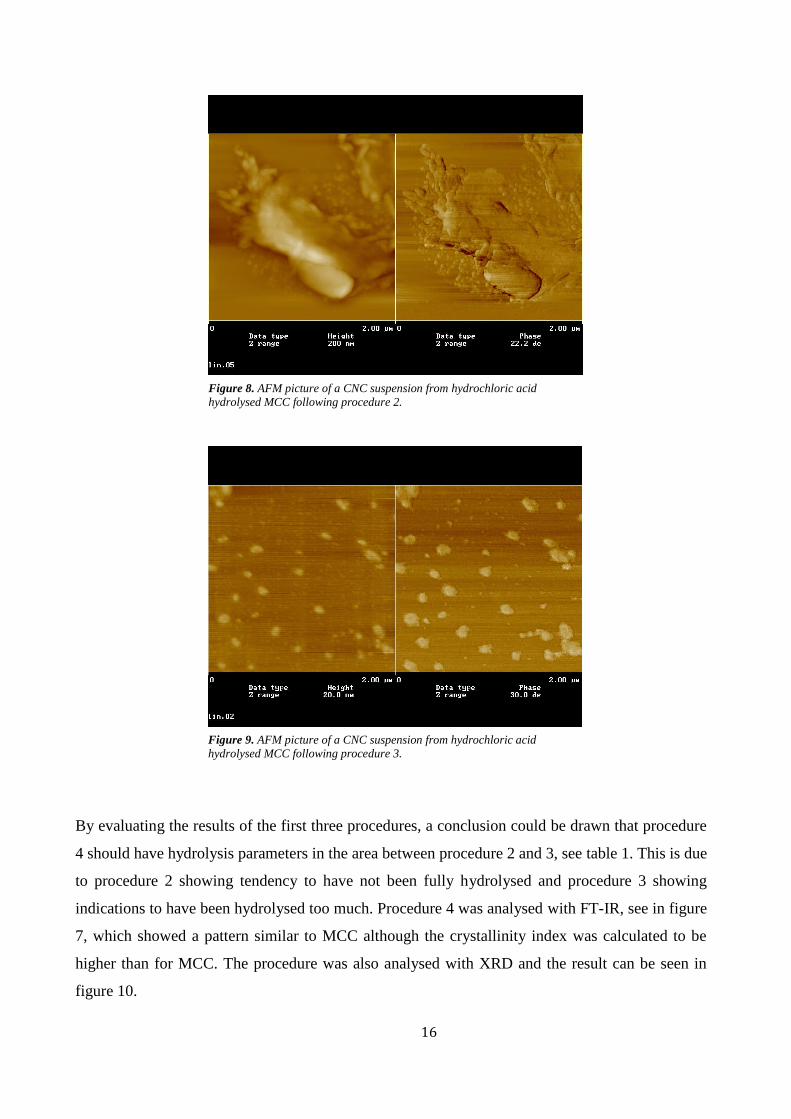
in appendix A. By observing the AFM pictures of procedure 2 and 3, as can be seen in figures 8 and
9, the following indications can be found: procedure 2 seemed to have agglomerated and not been
hydrolysed sufficiently while procedure 3 showed small particles that implicated that the hydrolysis
had gone too far.
Figure 7. FT-IR spectra of MCC and CNC from hydrochloric acid hydrolysis in four different procedures.
16
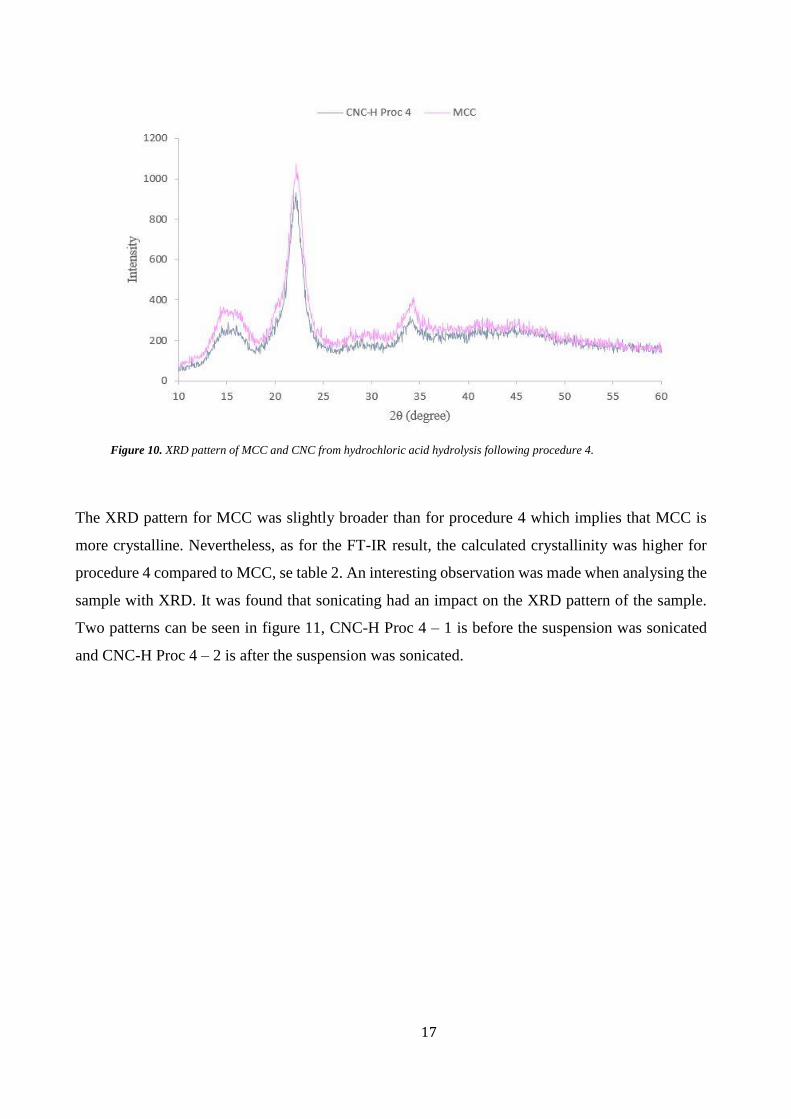
By evaluating the results of the first three procedures, a conclusion could be drawn that procedure
4 should have hydrolysis parameters in the area between procedure 2 and 3, see table 1. This is due
to procedure 2 showing tendency to have not been fully hydrolysed and procedure 3 showing
indications to have been hydrolysed too much. Procedure 4 was analysed with FT-IR, see in figure
7, which showed a pattern similar to MCC although the crystallinity index was calculated to be
higher than for MCC. The procedure was also analysed with XRD and the result can be seen in
figure 10.
Figure 8. AFM picture of a CNC suspension from hydrochloric acid
hydrolysed MCC following procedure 2.
Figure 9. AFM picture of a CNC suspension from hydrochloric acid
hydrolysed MCC following procedure 3.
17
The XRD pattern for MCC was slightly broader than for procedure 4 which implies that MCC is
more crystalline. Nevertheless, as for the FT-IR result, the calculated crystallinity was higher for
procedure 4 compared to MCC, se table 2. An interesting observation was made when analysing the
sample with XRD. It was found that sonicating had an impact on the XRD pattern of the sample.
Two patterns can be seen in figure 11, CNC-H Proc 4 – 1 is before the suspension was sonicated
and CNC-H Proc 4 – 2 is after the suspension was sonicated.
Figure 10. XRD pattern of MCC and CNC from hydrochloric acid hydrolysis following procedure 4.

18
The peak of the sonicated suspension is not only clearly broader but also had the highest calculated
crystallinity, 85,7% while it was calculated to be 81,1% before sonicating.
This can be assumed to depend on agglomeration that holds the crystals together and therefore they
are not detected when analysing with XRD. Sonicating divides the agglomeration and makes the
suspension more homogeneous and therefore it might be easier for the XRD to detect crystallinity.
Finally, AFM analysis were performed to obtain a picture of the material. Two pictures were taken
and they can be seen in figures 12 and 13.
Figure 11. XRD pattern of CNC from hydrochloric acid hydrolysis following procedure 4, before and after sonication.

19
Both pictures showed a lot of agglomerated areas that did not have any specific crystals. This might
have indicated that the suspension should have been sonicated longer to obtain a more homogeneous
and dispersed solution. Figure 13 had some tendency of nanocrystals in the lower right corner which
implied that there might have been some nanocrystalline cellulose that had agglomerated.
Figure 12. AFM picture of a CNC suspension from hydrochloric acid
hydrolysis following procedure 4.
Figure 13. AFM picture of a CNC suspension from hydrochloric acid
hydrolysis following procedure 4.

20
5.3 PREPARATION AND CHARACTERISATION OF CNC FROM BARLEY HUSK
5.3.1 Cellulose crystallinity
Solid state NMR was performed on the cellulose extracted from barley husk and showed that the
cellulose was crystalline as can be seen in figure 14. This is due to the typical crystalline cellulose
peaks at around 65 ppm and 90 ppm that are not overlapping as they would be if the sample was
amorphous [18]. The crystalline peaks are highlighted in figure 14 and if the cellulose would have
been fully amorphous they would not have existed.
The crystallinity of the cellulose was also examined using XRD, see figure 15, and the result
followed the typical pattern of crystalline cellulose with a high peak around 2θ = 22°. The calculated
crystallinity, using equation 1, was 62,9% and this was enough crystallinity to make an attempt to
produce CNC.
Figure 14. Solid state NMR on cellulose extracted from barley husk with crystalline peaks highlighted.
Crystalline Crystalline

21
5.3.2 Characterisation of CNC
CNC from barley husk was prepared following the same procedure as nanocrystals prepared through
the optimised sulphuric acid hydrolysis procedure. Two batches were made, one with small pieces
of completely dried cellulose and one with wet cellulose that had been washed with ethanol before
hydrolysis. Both batches were analysed with XRD and the result can be seen in figure 16.
Figure 15. XRD pattern of cellulose extracted from barley husk.

22
The XRD pattern for CNC from wet cellulose was slightly broader than CNC from dry cellulose
which implied that CNC-wet was more crystalline. Although the calculated crystallinity can be seen
in table 4 where CNC-dry was calculated to be the most crystalline and that indicated that this batch
had succeeded in becoming more crystalline than the cellulose source. The XRD pattern can be
affected by the samples not being a fine powder and that would explain why the pattern of CNC-
wet is broader when it is not calculated to be more crystalline than CNC-dry.
The samples were also analysed with FT-IR, see figure 17. As can be seen both CNC samples
followed the same pattern while the cellulose sample differed. The crystallinity index was calculated
for all three samples and can be seen in table 4.
Figure 16. XRD pattern of CNC from sulphuric acid hydrolysis prepared from dry and wet cellulose extracted from
barley husk.

23
The calculated index showed similar indications as the results obtained from XRD, which was that
CNC prepared from dry cellulose had the most crystalline structure. When observing the different
patterns in figure 17 it can be seen that the graph of CNC-dry does not seem to be more crystalline
than the cellulose, although the calculated index indicates that it is. This can depend on difficulty
when preparing the sample for FT-IR because the cellulose could not be grinded into a fine powder.
Table 3. Crystallinity index of cellulose extracted from barley husk and CNC prepared from wet and dry cellulose, calculated after
analysis with XRD and FT-IR.
Sample CrI(%) from XRD Crystallinity index
from FT-IR
Cellulose from barley
husk
62,9 0,87
CNC from wet cellulose 59,4 1,12
CNC from dry cellulose 66,5 1,22
To determine the dimensions of the nanocrystals AFM analysis were executed. The AFM picture of
CNC-wet showed only a layer of something unknown on the mica plate, it did not show any crystals
or particles at all and the picture can be seen in appendix A. The AFM picture of CNC-dry, see
figure 18, showed a lot of isolated crystals and some agglomeration.
Figure 17. FT-IR spectra of cellulose extracted from barley husk and nanocrystalline cellulose from dry and wet cellulose.

24
When observing the picture it can be found that some of the crystals are about 1 µm long which is
somewhat too long to be nanocrystals. This can depend on the cellulose not being hydrolysed
enough so that there are still some amorphous regions left. Nevertheless, the AFM analysis showed
a result which was more crystalline than the starting cellulose.
Figure 18. AFM picture of CNC prepared from dry cellulose extracted from
barley husk.
25
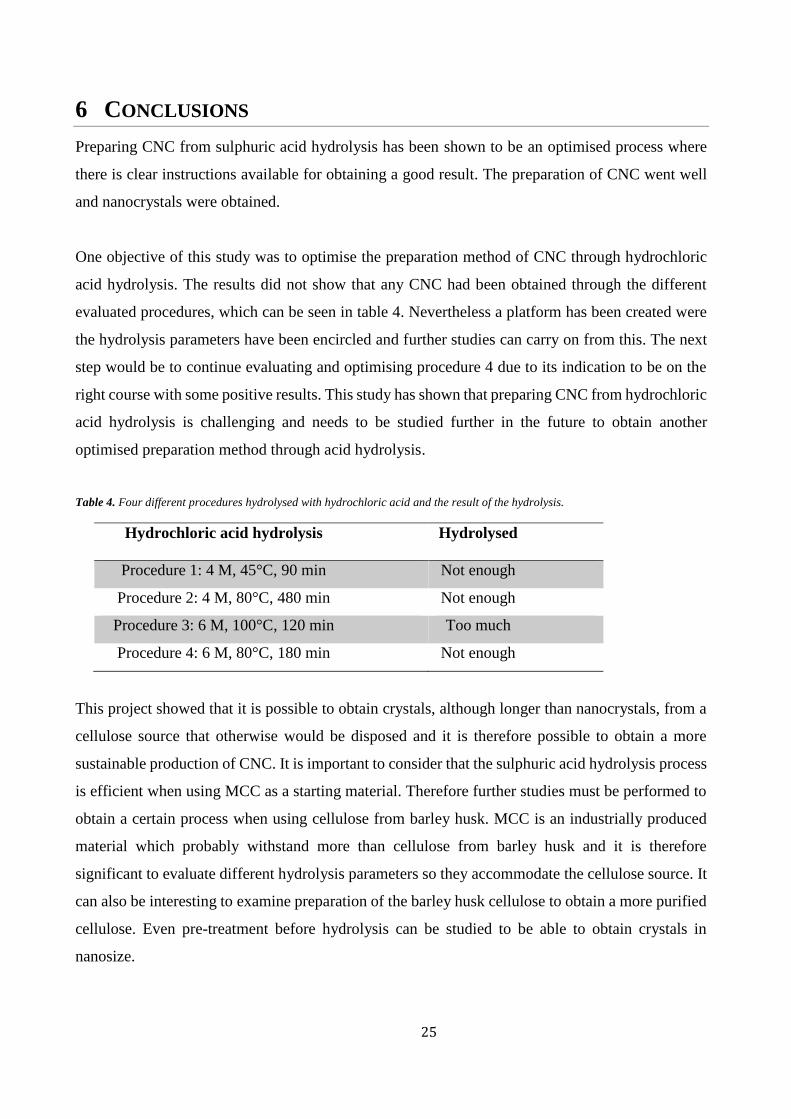
6 CONCLUSIONS
Preparing CNC from sulphuric acid hydrolysis has been shown to be an optimised process where
there is clear instructions available for obtaining a good result. The preparation of CNC went well
and nanocrystals were obtained.
One objective of this study was to optimise the preparation method of CNC through hydrochloric
acid hydrolysis. The results did not show that any CNC had been obtained through the different
evaluated procedures, which can be seen in table 4. Nevertheless a platform has been created were
the hydrolysis parameters have been encircled and further studies can carry on from this. The next
step would be to continue evaluating and optimising procedure 4 due to its indication to be on the
right course with some positive results. This study has shown that preparing CNC from hydrochloric
acid hydrolysis is challenging and needs to be studied further in the future to obtain another
optimised preparation method through acid hydrolysis.
Table 4. Four different procedures hydrolysed with hydrochloric acid and the result of the hydrolysis.
Hydrochloric acid hydrolysis Hydrolysed
Procedure 1: 4 M, 45°C, 90 min Not enough
Procedure 2: 4 M, 80°C, 480 min Not enough
Procedure 3: 6 M, 100°C, 120 min Too much
Procedure 4: 6 M, 80°C, 180 min Not enough
This project showed that it is possible to obtain crystals, although longer than nanocrystals, from a
cellulose source that otherwise would be disposed and it is therefore possible to obtain a more
sustainable production of CNC. It is important to consider that the sulphuric acid hydrolysis process
is efficient when using MCC as a starting material. Therefore further studies must be performed to
obtain a certain process when using cellulose from barley husk. MCC is an industrially produced
material which probably withstand more than cellulose from barley husk and it is therefore
significant to evaluate different hydrolysis parameters so they accommodate the cellulose source. It
can also be interesting to examine preparation of the barley husk cellulose to obtain a more purified
cellulose. Even pre-treatment before hydrolysis can be studied to be able to obtain crystals in
nanosize.

26
7 FUTURE PERSPECTIVES
Containing nanocrystals through acid hydrolysis using sulphuric acid is a developed and efficient
extraction method. This study has shown that extracting nanocrystals using hydrochloric acid is a
method that needs to be developed and optimised further to be able to use it in a future perspective.
After developing an optimised process the next step would be to start producing larger scales with
various cellulose sources and still be able to obtain a good result.
Concerning the preparation methods it is important to further improve the process and make it more
efficient. This needs to be accommodating to be able to lower the costs and enlarge the production.
As of today it is highly expensive to produce nanocrystals and it is therefore difficult to establish
the process. When using hydrolysis as a preparation method it is necessary to examine different
acids, cellulose sources and hydrolysis parameters. This is to gain more knowledge about production
outcome when it comes to uniform size, aspect ratio and surface chemistry. This will create a
controlled preparation method for nanocrystalline cellulose and make the process standardised and
by that more available and trustworthy [4].
One important aspect that has not been an objective in this project but could be an extension, is the
drying of CNC. This is a challenge because CNC tend to agglomerate when dried due to hydrogen
bonds that generates which can be irreversible. This can change size and characteristics of the CNC.
It is essential to continue studies when it comes to drying process to be able to maintain the size of
the CNC and reduce transportation cost that increase with the weight of the CNC [2, 4].

27
8 ACKNOWLEDGEMENTS
Thank you to the department of Organic Chemistry for giving me the opportunity to perform this
project and being able to use equipment and material. I would like to thank following people for
helping me make this project possible:
My supervisor Gunnar Westman for all the help and support during this project. Thank you for being
positive and encouraging.
Thank you to Mikaela Börjesson for answering a lot of questions and helping me with the laboratory
work.
Thank you to Filip Nylander for helping with freeze-drying of samples and Anders Mårtensson for
performing AFM analysis.
I would also like to thank Josefine Ridaeus for helping me perform procedure 4 and Jonathan Carbol
for all the help with graphs and excel.
At last I would like to thank my fellow thesis workers, Ali Amirjani, Lea Jerre, Robert Lindberg
and Mona Svantesson for all the help and companionship, it has been a pleasure working with you.

28
9 REFERENCES
[1] B.L. Peng, N. Dhar, H.L. Liu and K.C. Tam. “Chemistry and applications of nanocrystalline
cellulose and its derivatives: a nanotechnology perspective.” The Canadian journal of
chemical engineering, vol. 89, no. 5, pp. 1191-1206, June 2011.
[2] H.P.S. Abdul Khalil, et al. “Nanocellulose Based Polymer Nanocomposite: Isolation,
Characterization and Applications”, in Nanocellulose Polymer Nanocomposites:
Fundamentals and Applications, V.K. Thakur, Ed. USA: John Wiley & Sons, Inc. 2014, pp.
1-31.
[3] H.Y. Yu, et al. “Comparison of the reinforcing effects for cellulose nanocrystals obtained
by sulphuric and hydrochloric acid hydrolysis on the mechanical and thermal properties of
bacterial polyester.” Composites Science and Technology, vol. 87, pp. 22-28, Oct. 2013.
[4] L. Brinchi, F. Cotana, E. Fortunati and J.M. Kenny. “Production of nanocrystalline cellulose
from lignocellulosic biomass: Technology and applications.” Carbohydrate Polymers, vol.
94, no. 1, pp. 154-169, April 2013.
[5] C. Zhou and Q. Wu. “Recent Development in Applications of Cellulose Nanocrystals for
Advanced Polymer-Based Nanocomposites by Novel Fabrication Strategies”, in:
Nanocrystals – Synthesis, Characterization and Applications. 2012, pp. 103-120.
[6] P.P. Zhang, et al. ”Effects of acid treatments on bamboo cellulose nanocrystals.” Asia-
pacific Journal of Chemical Engineering, vol. 9, no. 5, pp. 686-695, Sep. 2014.
[7] A. Kumar, et al. ”Characterization of Cellulose Nanocrystals Produced by Acid-Hydrolysis
from Sugarcane Bagasse as Agro- Waste.” Journal of Materials Physics and Chemistry, vol.
2, no. 1, pp. 1-8, Jan. 2014.
[8] N. Wang, E. Ding and R. Cheng. “Surface modification of cellulose nanocrystals.” Frontiers
of Chemical Engineering in China, vol. 1, no. 3, pp. 228-232, July 2007.
[9] A.C. Corrêa, et al. “Cellulose nanofibers from curaua fibers.” Cellulose, vol. 17, no. 6, pp.
1183-1192, Dec. 2010.

29
[10] A. Amirjani. ”Extraction and Chemical Modification of Hemicellulose for use in
Biocomposites.” B.S. thesis, Chalmers University of Technology, Gothenburg, Sweden,
2015.
[11] A. Höije, et al. “Isolation and characterization of physicochemical and material properties
of arabinoxylans from barley husks.” Carbohydrate Polymers, vol. 61, pp. 266-275, Feb
2005.
[12] A. Saxena. Nanocomposites based on Nanocellulose whiskers. PhD [Dissertation]. Georgia:
Georgia Institute of Technology, 2013.
[13] H. Yu, et al. “Facile extraction of thermally stable cellulose nanocrystals with a high yield
of 93% through hydrochloric acid hydrolysis under hydrothermal conditions.” Journal of
Materials Chemistry A, vol. 1, no. 12, pp. 3938-3944, Jan. 2013.
[14] M. Abd-Allah, et al. ”Preparation and characterisation of microcrystalline cellulose (MCC).”
BioResources, vol. 4, no. 4, pp. 1359-1371, Nov. 2009. [Online]. Available:
https://www.ncsu.edu/bioresources/BioRes_04/BioRes_04_4_1359_Nada_EAA_Prep_Ch
ar_MCC_374.pdf.
[15] I. Spiridon, et al. “Structural changes evidenced by FTIR spectroscopy in cellulosic materials
after pre-treatment with ionic liquid and enzymatic hydrolysis.” BioResources, vol. 6, no. 1,
pp. 400-413, 2010.
[16] S. Park, et al. ”Cellulose crystallinity index: measurement techniques and their impact on
interpreting cellulase performance.” Biotechnology for Biofuels, vol. 3, pp. 1-10. May 2010.
[17] T. Huq, et al. “Nanocrystalline cellulose (NCC) reinforced alginate based biodegradable
nanocomposite film.” Carbohydrate Polymers, vol. 9, pp. 1757-1763, July 2012.
[18] S. Park, et al. “Measuring the crystallinity index of cellulose by solid state 13C nuclear
magnetic resonance.” Cellulose, vol 16, pp. 641-647, May 2009.

I
APPENDIX A
A. AFM PICTURES
A 1. AFM picture of CNC prepared from hydrochloric acid
hydrolysis following procedure 1.
A 2. AFM picture of CNC prepared from wet cellulose extracted
from barley husk.

II
A 3. AFM picture of CNC prepared from dry cellulose extracted
from barley husk.

III
APPENDIX B
B. X-RAY DIFFRACTION
Sample (𝑰𝟎𝟎𝟐 − 𝑰𝒂𝒎𝒐𝒓𝒑𝒉𝒐𝒖𝒔) 𝑰𝟎𝟎𝟐⁄ CrI(%)
MCC (1073 − 175) 1073⁄ 83,7
CNC from H2SO4 (1175 − 209) 1175⁄ 82,2
CNC from HCl Procedure 1 (893 − 160) 893⁄ 82,1
CNC from HCl Procedure 2 (1124 − 191) 1124⁄ 83
CNC from HCl Procedure 3 (738 − 143) 738⁄ 80,6
CNC from HCl Procedure 4 (933 − 133) 933⁄ 85,7
Cellulose from barley husk (526 − 195) 526⁄ 62,9
CNC from wet cellulose (439 − 178) 439⁄ 59,4
CNC from dry cellulose (406 − 136) 406⁄ 66,5
Table b 1. Calculated crystallinity of all performed procedures after XRD analysis.
B 1. XRD pattern of microcrystalline cellulose (MCC).

IV
B 2. XRD pattern of CNC from sulphuric acid hydrolysis.
B 3. XRD pattern of CNC from hydrochloric acid following procedure 1.

V
B 4. XRD pattern of CNC from hydrochloric acid following procedure 2.
B 5. XRD pattern of CNC from hydrochloric acid following procedure 3.

VI
B 6. XRD pattern of CNC from hydrochloric acid hydrolysis following procedure 4.
B 7. XRD pattern of CNC from sulphuric acid hydrolysis prepared from wet cellulose extracted from barley husk.

VII
B 8. XRD pattern of CNC from sulphuric acid hydrolysis prepared from dry cellulose extracted from barley husk.
VIII
APPENDIX C
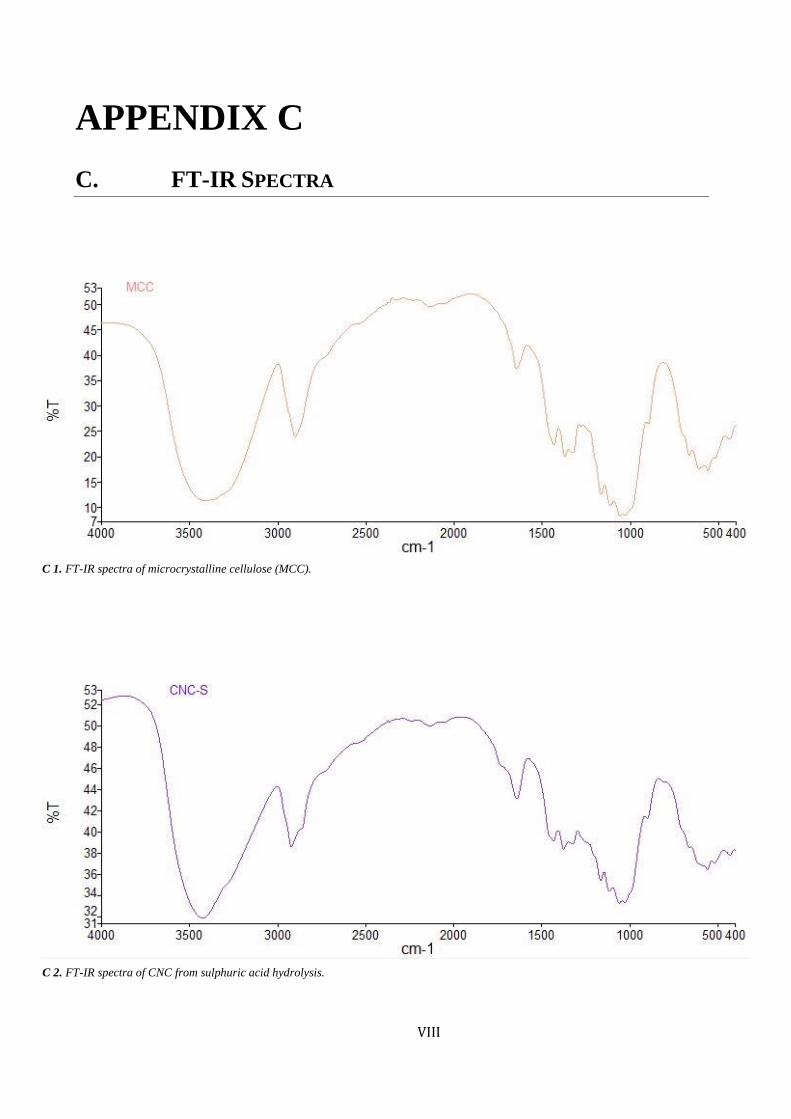
C. FT-IR SPECTRA
C 1. FT-IR spectra of microcrystalline cellulose (MCC).
C 2. FT-IR spectra of CNC from sulphuric acid hydrolysis.

IX
C 3. FT-IR spectra of CNC from hydrochloric acid hydrolysis following procedure 1.
C 4. FT-IR spectra of CNC from hydrochloric acid hydrolysis following procedure 2.

X
C 5. FT-IR spectra of CNC from hydrochloric acid following procedure 3.
C 6. FT-IR spectra of hydrochloric acid hydrolysis following procedure 3.

XI
C 7. FT-IR spectra of cellulose extracted from barley husk.
C 8. FT-IR spectra of CNC from sulphuric acid hydrolysis prepared from cellulose extracted from barley husk.

XII
C 9. FT-IR spectra of CNC from sulphuric acid hydrolysis prepared from cellulose extracted from barley husk.