preparation of carbon metallurgical … archive/files/merge/vol-12...preparation of carbon...
TRANSCRIPT
51.
PREPARATION OF CARBON METALLURGICAL ELECTRODES FROM LOW-TEMPERATURE LIGNITE COKE AND LIGNITE PITCH BINDER
John S. Berber and Richard L. Rice
U, S. Department of the Interior, Bureau of Mines, Morgantown Coal Research Center, Morgantown, West Virginia 26505
INTRPDUC TION
Low-temperature carbonization of coal produces char and coal tar. Char i s potentially useful as powerplant fuel, a s smokeless fuel for domestic uses, for synthesis gas production, and for blending with other coals to make metallurgical coke. Low-temperature t a r is a potential source of organic chemicals and other products, including materials for making carbon electrodes. Large quantities of carbon in the form of petroleum coke a r e used to make carbon electrodes for the aluminum, steel, electrochemical, and electrothermal industries.
Two methods were developed for producing carbon electrodes from low- temperature lignite tar. ated by comparing their properties and performance with those of commercial grade electrodes.
Electrodes were then made by these methods and evalu-
This paper presents preliminary results of the comparison.
ELECTRODE PRODUCTION AND SPECIFICATIONS
Carbon and graphite manufacture was developed by the end of the 18th and the beginning of the 19th century. application i s attributed to Sir Humphrey Davy'in 1800. charcoal. The need for stronger carbon materials, which could res i s t heat and have higher electrical conductivity, enhanced the carbon industry for its manu- facture. The first baked carbon composition f rom coke, lampblack, and sugar syrup, is credited to a French scientist, Carrg, in 1876. started 20 years la te r , in 1896, with the development of the resistance type elec- t r ic furnaces.
The ear l ies t use of carbon in an electrical His carbon material was
The graphite industry
Carbon electrodes for metallurgical purposes today a r e made by mixing petroleum coke, graphite, anthracite, o r coal with a coal pitch, placing the mix in a mold, then baking for about 24 hours to about 2 ,000" F. pitch into coke which serves a s a binding skeleton between filler particles, result- ing in a strong finished product (I) . Theoretically, about 0. 3 ton of carbon is required to produce a ton of aluminum, however in practice about 0.6 ton of c a r - bon of which 0. 2 ton is pitch i s required (3, 8, =). tar pitch is used annually in the United States for aluminum production. market for carbon electrodes i s about 2 . 5 million tons per year.
Baking converts the
About 400,000 tons of coal The U. S .
The characterist ics of the coal ta r pitch determine the stability and tensile strength of finished electrodes (5). The amount of binding coke formed during the baking operation depends to a large extent on the percentage of medium molecular weight tar resins contained in the coal pitch. resins in the pitch binder, the greater w i l l be the binding effect. contained in pitch have high molecular weight, however, and do not enhance
The higher the amount of these Alpha resins

52.
binding of the electrodes; therefore their content in the pitch should be a s low as possible. Contrarily, the beta resins, being in colloidal form in the pitch, have a great binding power, so their content in the electrode pitch binder should be as high a s possible. Since the value of the resins is determined by its free carbon, the free carbon characterizing the total pitch unity should be a s high a s possible. The pitch binder coke produced during baking i s an all-important factor in bond- ing coke aggregate particles into an overall structure possessing high compres- sive strength, high apparent density, and low electrical resistivity. A good pitch binder should have a carbon-hydrogen ratio of 1.20 to 1.80, ash content l e s s than 1%, softening point of about 105" to 120" C. and coking value of at least 60% (2)- For many purposes, a density approaching the theoretical maximum of 2 . 0 g / c c i s highly desirable, yet in practice it i s difficult t o exceed 2 . 0 g/cc (4, a, E).
.
EXPERIMENTAL EQUIPMENT AND PROCEDURE
Materials used to produce electrodes in this investigation were derived' from low-temperature lignite ta r except for the petroleum coke and bituminous binder. The latter two were obtained f rom commercial suppliers.
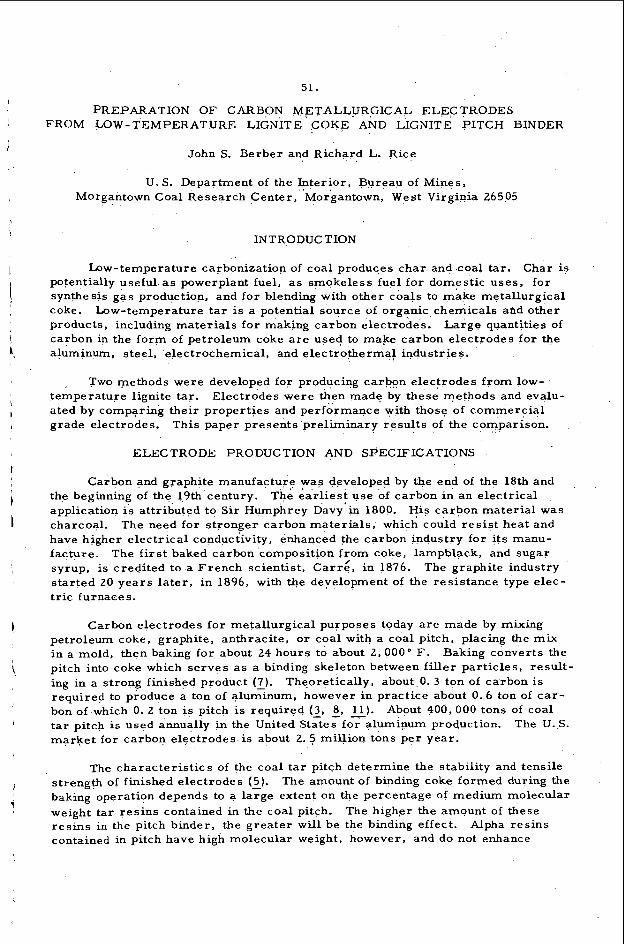
Coke and binder for the electrodes were obtained from low-temperature lignite pitch by two methods--thermal cracking (L) and delayed coking (2) . thermal cracking and delayed coking produce an oily liquid and coke. i s distilled into a distillate and a residue. tions for use a s an electrode binder. cined, and screened for electrode aggregate as shown in Figure l.
Both The liquid
The residue shows suitable specifica- Coke from both processes i s leached, cal-
Coke i s leached by digesting it in a 50% hydrochloric acid solution for 2 After filtration and washing until neutral, the leached coke i s dried at hours.
212" F and then calcined fo r 12 hours in nitrogen atmosphere a t 2,500" F. cination of green coke is necessary for several reasons. when ground cannot be bound together to give a proper density. trodes a r e difficult to mold o r extrude from green coke. give off volatile matter during baking, thus resulting in a very porous electrode. Finally, electrodes a r e poor conductors and have a high resistivity when made from green coke. The green and leached coke, both calcined at 2,500" F, were analyzed for iron, sulfur, ash content, and electrical resistivity.
Cal- F i r s t , the green coke
Third, the electrodes Second, elec-
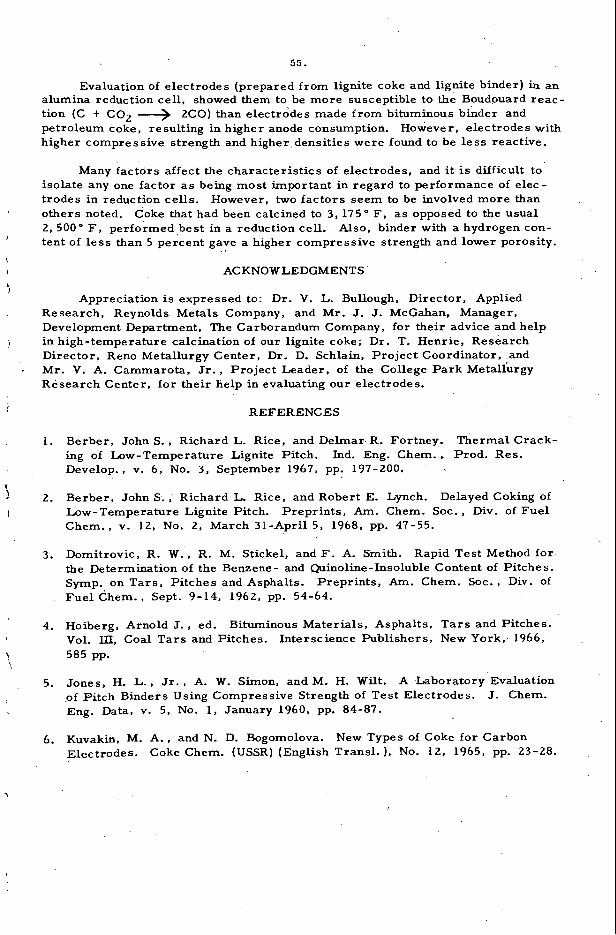
Two systems were used for making electrical resistivity measurements. A The other Wheatstone bridge galvanometer was capable of measuring 0. 001 ohm.
system (Figure 2) impresses a 2 ampere current through the electrode and then measures the voltage drop across a 2 .01 inch length. and the diameter, the electrical resistivity i s calculated.
F rom this measurement
The preparation of test electrodes involves making the green mix (or paste), molding, and baking. which has been preheated to about 300" F. After the pitch has melted, the mixer is started and different s ize coke fractions are added one at a time, starting with the l a rg i s t size (minus 10 plus 20 mesh). About 5 minutes i s allowed between the addition of each size fraction (the timing of the addition is recorded) to assure wetting of the coke by the binder. When the mixing of the,paste i s completed, it is transferred still hot to the molds, which have been preheated to about 250" F. The paste i s tamped into stainless-steel molds and pressed.
The pitch is placed in an oil heated sigma-blade mixer
At f i r s t graphite
i I
I
t

53.
molds were used, but later stainless-steel molds were found more practical. TWO s k e s of molds were used, 1-1/4 ihches diameter by 5 inches long and 1-314 inches diameter by 5 inches long. in the metallurgical reduction cell.
The larger electrodes were required for use
The upper one-half inch of the mold is filled with powdered dry coke and the molds a re placed in the baking jig. furnace and baked (in a nitrogen atmosphere) to 1.550" F at a heating rate of 90" F per hour.
The jig is then placed in a crucible type
After baking, the electrodes a r e allowed to cool in the furnace for 24 hours The density is determined by carefully measuring and then removed for testing.
a section of the electrode and then weighing it. The resistivity and strength of the section a r e then measured and the remains are used for the reactivity test. The electrodes were also evaluated in an electrical reduction cell used fo r reduction of alumina.
RESULTS AND DISCUSSION
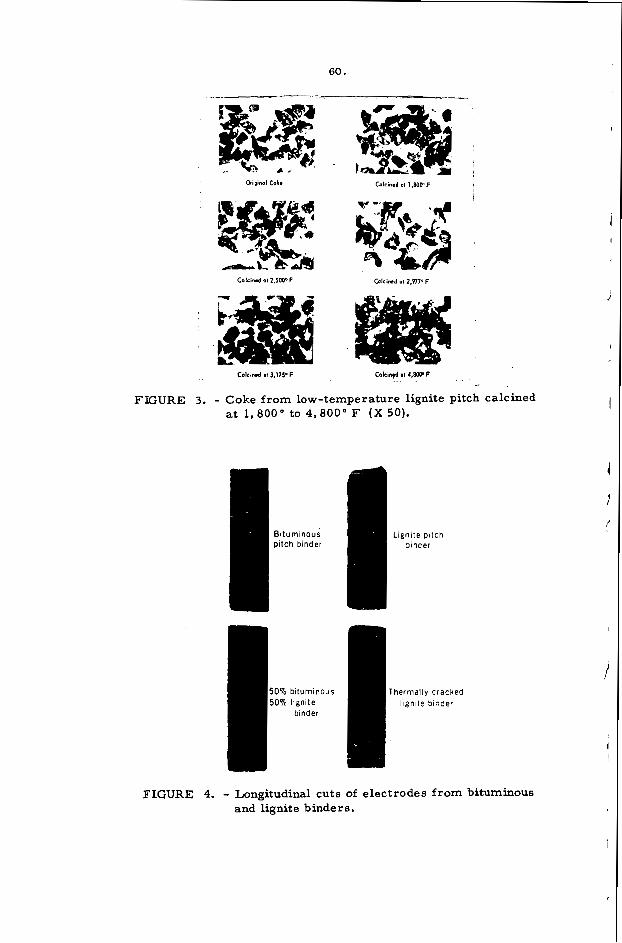
Calcination. peratures on the electrical resistivity and density gave interesting results, a s shown in Table 1. t e r and effects an increase in the specific gravity o r r ea l density of the electrode. The photomicrographs (Figure 3) compare the appearance of coke particles after calcination at increasing temperatures f rom 1,850" to 4,800' F. The particles calcined a t 1,850". 2,500". and 3,000" F show little change in appearance from the original coke. At 3,175 " F the appearance begins to change f r o m the asym- metr ic oblong grains to the i r regular grains with rough edges that are highly branched and a re the predominant shapes of the particles calcined at 4,800' F.
A study on the effect of calcination of coke at different tem-
Calcination causes shrinkage with the expulsioh of volatile mat-
Table 2 shows the analytical differences between the green and the leached coke, which influence the qualitative specifications of a carbon electrode. green coke showed a much higher electrical resistivity and iron content than the leached coke.
The
Product Specifications. When a coke is 'mixed with a binder and the mix extruded or molded, a structure i s formed that is similar in many aspects to a compressed powder. wetting is of considerable importance, because it is desirable to obtain nonporous and very compact electrodes of low specific resistivity. high compressive strength. low reactivity. Low electrical resistivity avoids waste of electric power, which is one of the largest costs in electrolytic processes. High compressive strength requires that the electrodes be sturdy when subjected to tension. compression, and shear and twist; otherwise they fail. disrupting furnace and cell operation and increasing overall cost. High reactivity destroys the electrodes by oxidation. Some elements in the ash. for example, iron, vana- dim, boron, and alkalies, by acting a s catalysts, can affect the reactivity of the electrode with certain gases present during operations. Ash i s especially unde- sirable in electrolytic operations that use consumable electrodes. since the ash can contarninate electrolyte and, in some operations, can be reduced and contami- nate the product. of binder pitches and electrode aggregates should be as low as possible A high
During the mixing of the pitch with the coke, the degree of
and low ash and sulfur content.
Fo r applications where these conditions apply, the ash content

5 4 .
sulfur content in pitches used for electrodes can contribute to the formation of a layer of iron sulfide on the metallic contact pins, thus changing the electrical resistance at the interface. Sulfur can have harmful effects on carbon products during graphitization. The fumes of sulfur a r e also objectionable. The sulfur content of most coal ta r pitches ranges from 0. 35 to 0.50 percent.
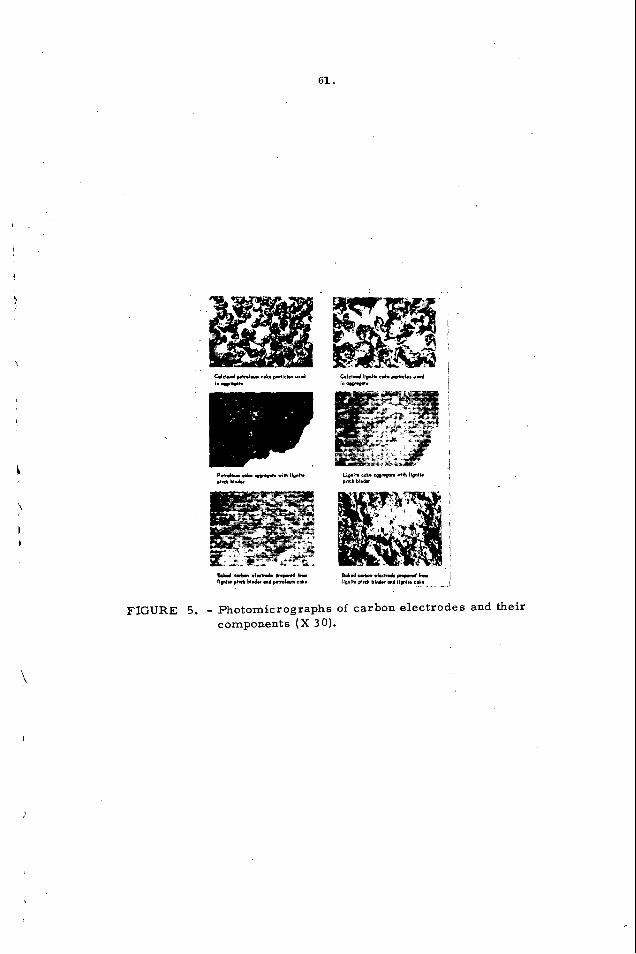
The pitch binder has a tendency to penetrate deep into the voids of the coke aggregate. tion that occurs inside some of the electrodes and serve a s the first step in photomicrographic studies to determine wetting of the coke by the binder and the quality of calcination during the baking cycle. All the electrodes shown in Fig. 4 were made with about the same amount of binder, except the one labeled "thermally cracked lignite binder, having 25% of binder. The prefer red weight-percentage of low-temperature lignite pitch binder fo r the green mix was found to be 25 to 2770, varying in relation to the density of the calcined coke. nation temperature, the higher i s the density of the coke, a s shown in Table 1, consequently the amount of binder should be proportionately increased to avoid higher porosity of an electrode,
Photographs of the electrode sections (Figure 4) show the poor condi-
The higher the calci-
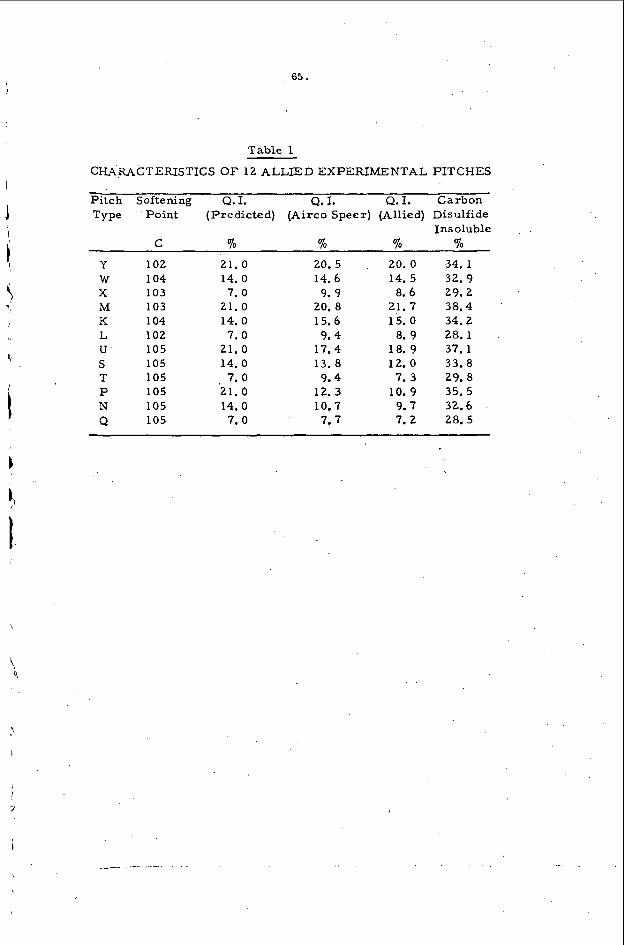
Calcined coke prepared by thermal cracking of lignite is compared with petroleum coke in Figure 5. The coke particles differ, lignite particles being much more angular in appearance than the petroleum particleg that h#ve a more uniformly rounded appearance. The wetting property of the binder i s of equal value using both cokes. more and larger void spaces than the ones using petroleum coke. particles exposed in the baked electrode show the lignite coke to be denser in appearance with thicker cell walls, whereas the petroleum coke has a more striated appearance in section.
The finished baked electrodes using lignite coke have Sections of coke
Electrodes having about 400 kg/cm2 of compressive strength and 0.007 to 0. 009 ohm/cm3 of electrical resistivity, Table 3, have been prepared totally from materials derived from lignite t a r .
The characteristics of the binder pitch a r e given in Table 4. The better electrodes were prepared with a binder content less than 27%, and a binder having a hydrogen content l e s s than 5%. and quinoline-insoluble contents a r e completely overshadowed by the large varia- tion in binder percent in the electrodes.
The effect of the coking value and the benzene-
Product Evaluation. Results of tes t s performed on our electrodes at the College Park Metallurgy Research Center showed that the surface of anodes pre- pared from our electrodes, Figure 6 , after electrolysis were very similar to anodes made from commercial materials. and the electrolyte covers the entire surface, indicating good wettability.
The surfaces were uniformly eroded
CONCLUSIONS
Results of replacing petroleum coke with lignite coke to produce a n entire Lignite coke produced from thermai ?ignite electrode were very encouraging.
cracking and delayed coking of lignite pitch was calcined at 2, 500' F in a nitrogen atmosphere. 1.96 gfcc and an electrical resistivity of 0.045 ohm/in3.'
This coke, a f te r being calcined to 2 ,500" F, showed a density of
55.
Evaluation of electrodes (prepared from lignite coke and lignite binder) in an alumina reduction cell, showed them to be more susceptible to the Boudouard reac- tion (C t Co2 + 2CO) than electrodes made from bituminous binder and petroleum coke, resulting in higher anode consumption. However, electrodes with higher compressive strength and higher densities were found to be l e s s reactive.
Many factors affect the characteristics of electrodes, and it is difficult to
However, two factors seem to be involved more than Coke that had been calcined to 3,175" F , a s opposed to the usual
Also, binder with a hydrogen con-
isolate any one factor as being most important in regard to performance of elec- trodes in reduction cells. others noted. 2,500" F, performed best in a reduction cell. tent of l e s s than 5 percent gave a higher compressive strength and lower porosity.
ACKNOWLEDGMENTS '
Appreciation is expressed to: Dr. V. L. Bullough, Director, Applied Research, Reynolds Metals Company, and Mr. J. J. McGahan, Manager, Development Department, The Carborandum Company, for their advice and help in high-temperature calcination of our lignite coke; Dr. T. Henrie, Research Director, Reno Metallurgy Center, Dr. D. Schlain, Project Coordinator, and Mr. V. A. Cammarota, Jr., Project Leader, of the College Pa rk Metallurgy Research Center, for their help in evaluating our electrodes.
REFERENCES
1.
2 .
3.
4.
5.
6.
Berber, John S., Richard L. Rice, and Delmar R. Fortney. Thermal Craek- ing of Low-Temperature Lignite Pitch. Ind. Eng. Chem., Prod. Res. Develop., v. 6, No. 3, September 1967, pp. 197-200.
Berber, John S., Richard L. Rice, and Robert E. Lynch. Delayed Coking of Low-Temperature Lignite Pitch. Preprints, Am. Chem. SOC., Div. of Fuel Chem., v. 12, No. 2, March 31-April 5, 1968, pp. 47-55.
Domitrovic, R. W. , R. M. Stickel. and F. A. Smith. Rapid Test Method fo r the Determination of the Benzene- and Quinoline-Insoluble Content of Pitches. Symp. on Tars , Pitches and Asphalts. Preprints, Am. Chem. SOC., Div. of FuelChem., Sept. 9-14, 1962, pp. 54-64.
Hoiberg, Arnold J., ed. Vol. LII, Coal Ta r s and Pitches. 585 pp.
Bituminous Materials, Asphalts, T a r s and Pitches. Interscience Publishers, New York; 1966,
Jones, H. L . , J r . , A. W. Simon. and M. H. Wi l t . A Laboratory Evaluation of Pitch Binders Using Compressive Strength of Test Electrodes. Eng. Data, v. 5, No. 1, January 1960, pp. 84-87.
Kuvakin, M. A., and N. D. Bogomolova. New Types of Coke for Carbon Electrodes. Coke Chem. (USSR) (English Transl. ), No. 12, 1965, pp. 23-28.
J. Chem.
7.
a.
9.
10.
11.
56.
Lauer, G. G., and K. P, Bonstedt. Factors Influencing the Performance of Pitch Binders in the Baking of Small Carbon Electrodes. Carbon, v. 1, No. 2 , February 1964, pp. 165-169.
Martin, S. W . , and H. W. Nelson. Carbon Materials Rcqui-red in Electro- lytic Reduction of Alumina.
Morgan, M. S., W . H. Schlag, and M. H. W i l t . Surface Properties of the Quinoline-Insoluble Fraction of Coal-Tar Pitch. J. Chem. Eng. Data, v. 5, No. 1, January 1960, pp. 81-84.
J. Metals, v. 7 , No. 4, April 1955, pp. 540-543.
Stepanenko, M. A . , N. I. Matusyak, A. T. Movchan, and P. L. Saltan. Electrode Pitch Manufacture by Thermal Treatment. Coke Chem. (USSR) (English Transl. ), NO. 12, 1965, pp. 2 0 - 2 3 .
Thomas, B. E. A, Electrode Pitch. Cas World, v. 151, No. 3946, Coking suppl., v. 56, No, 564, April 2, 1960, pp. 51-64, 66.

57.
Calcination temp., " F
1,850 2,200 2,500 3,000 3, 175 4,800
TABLE 1. - Electrical resistivity and density of coke' a t different calcination temperature s
Resistivity, Density , ohm / in3 g l cc
0.0940 1.83 0.0640 1.95 0.0450 1.96 0.008 1 1.97 0.0075 1.97 0.0053 2. 00
Green
Percent: Ash 1. 15 Iron 0.11 Sulfur 0. 82
Resistivity, ohm/ in3 0.051 Calcination temperature, " F 2,500
Leached
0.75 0.03 0.83 0.035 2,500
Batch No.
-87 89 105 106 90 92 93 95 100 111 113 101 94
Coke
Calcining temp., "F
2,000 2,500 2,500 2,500 2,500 2.500 2,500 2,500 2,500 2,500 2,500 3,175 Unknown
Method
Delayed do. do. do.
Cracked do. do.
. do. do. do. do. do.
I Petroleum
Re sis - tivity. ohm-cm
0. 163 0.122 0.122 0.122 0.089 0.089 0.089. 0.089 0.089 0.089 0. 089
1 0.038 ~ 0.088
Electrodes
tivity, Strength,
0.013 0.010 0.011 0.0088 0.012 0.011 0.012 0.013 0. 012 0.0080 0.0070 0.0052 0.0087
284 363 258 315 27 4 321 208 205 225 393 413 237 254
Density, gJcc
1. 31 1. 32 1. 36 1.43 1. 23 1.37 1. 25 1. 22 1. 27 1.45 1. 46 1.47 1. 28
1 1 Coke obtained from a commercial supplier. Lignite pitch used as binder.

58.
P) c, .r(
c .r( rl
E 0
.l.l w
l.l al a c B $ U
.r(
w 0 m V
.r( c,
10 .rl
l.l al c, V Id
s u 2
Lo - I I i
I
59.
,
COKE PITCH TTl 4 4 4
Calcining
4 Additives
1 Molding
I
FIGURE 1. - Flowsheet for preparation of coke and pitch for carbon electrodes.
FIGURE 2. - Electrical resistivity apparatus.
60.
Original Coke 61cm.d VI 1.8OC" F
Colcuwd 19 3.175'F C d c t n d 01 4,8O(P F
FIGURE 3. - Coke from low-temperature lignite pitch calcined at 1,800' to 4,800" F ( X 50).
50% bituminous Thermally cracked I 50% lignite binder I lignite binder
I /
FIGURE 4. - Longitudinal cuts of electrodes from bituminous and lignite binders.
,
61.
,
L
FIGURE 5. - Photomicrographs of carbon electrodes and their components ( X 30).
I
i

62.
i t i o n . ’
: a t i o n .
FIGURE 6. - Anodes, machined from electrodes prepared from low- t ezpcrat~re lignite coke and lignite pitch binder, after use in an alumina reduction cell.

63.
THE EFFECT O F PITCH QUINOLINE INSOLUBLES ON GRAPHITE PROPERTIES
James Jerauld Fer r i t to
Airco Speer A Division of Air Reduction Co., Inc. Electrode & Anode Development Dept.
Niagara Falls, New York 14302 I
Joseph Weiler I I i \ Allied Chemical Company
I Edgewater, New Je r sey Plast ics Division
INTRODUCTION
' F o r several years Airco Speer has been working with raw mater ia ls suppliers in , order to characterize o r better define these raw materials, i n t e r m s of their effects
on f i n a l graphite properties. In particular, Airco Speer 's work with Allied Chemical Company, a major pitch supplier, w a s directed toward the development of a better electrode binder, through a c learer definition of their process parameters (such as column atmospheres, distillation temperatures, tar sources and other feed s t r eam variables), as they affect pitch character is t ics , hence, graphite properties.
1 ,2 ,3 I . '
Of the many pitch character is t ics specified by the graphite electrode industry, the Q.I. content was chosen the subject of this investigation. The Q.I. ' s consist 3 primarily of solid particles4. 52 ranging in size f rom colloidal to coarse7. The colloidal particles a r e mostly complex hydrocarbons of high molecular weight. They a r e derived f rom the decomposition of coal directly or may be derived indi- rectly f rom the condensation and dehydrogenation of small aromatic molecules
' coming from the coal. The coarse particles can be any insoluble "dirt", such as coal or coke dust. (nucleation) during carbonization or graphitization.
Many investigators feel that the Q. I. of coal t a r pitch i s important i n determining graphite quality. 9 s l o I t is known, for example, that the higher the Q.I., the higher wi l l be the graphite strength, density and conductivity.
\ over 16 to 18% generally have no beneficial effect and, in fact, may be detrimental. '\ Not a s well. known. but perhaps more important, is the type of Q. I. , vis . , the
process parameters by which cer ta in levels a r e attained, affect not only those levels, but also the nature of the Q. I., and, consequently, may affect the nature of the graphite.
The function of the Q.I. i s to provide s i tes f o r crystall i te growth
However, Q. I. levels of
1
EXPERIMENTAL
After managerial approval of both Companies, the basic plan w a s formulated. 3 x 4 factorial-type experiment was proposed in which Allied would process one low ( -- 5%) Q. I. tar by filtration, distillation, two heat treatments, addition of Therm= (a thermatomically decomposed "black") and {blending. Four different pitches would initially be made.
A
i
Each would be modified by the processes described, I
I . ..

64
to contain three levels of Q. I. --about 7, 14 and 217'0. would result.
Twelve (12) pitches in all
In the preparation of the raw mater ia ls and the blend components (Figure l ) , the starting mater ia l was feed T a r "A", with a low (570) Q.I. to yield low (4y0) Q. I. Pitch " Z " . This, in turn, was used as the blending pitch for Processes I through IV. , The residue from feed T a r "A" was used to make the high (1270) Q. I. T a r "B", which was used as the r a w mater ia l i n Processes I and 11.
This tar was filtered
In the preparation of natural Q.I. pitches (P rocess I), the high Q.I. T a r "B" w a s distilled (Figure 2) to yield a high Q. I. Pi tch "Y", raising the Q. I. f rom 12 to about 2170. This pitch was blended with low Q.I. Pitch " Z " to give Pitches "X" and "W", thus lowering the Q. I. to about 7 and 1470, respectively.
The pitches in P rocess I1 were produced f rom the high Q.I. T a r "B" in Process I (Figure 3). This pitch was distilled to yield Pi tch "U", with a Q. I. of 217'0. As in Process I, this pitch was blended with low Q. I. Pitch " Z " to give Pitches "T" and " S " , again, lowering the Q.I. to 7 and 1470, respectively.
The high Q. I. tar f rom Experimental Process 11 was used in preparing the pitches in Process I11 (Figure 4). of about 21%. Pi tch "P" was blended with Pi tch "Z" to give Pitches "Q" and olN", with Q. I. ' s of 7 and 1470, respectively.
This t a r was distilled to yield Pi tch "P", with a Q.I.
Process IV pitches were prepared by starting with one of the original raw materials, low Q. I. T a r "C", which w a s feed Ta r "A" with the insolubles removed by filtration. The low Q. I. T a r "C" then had Thermax dispersed in it, thus raising the Q. I. from 2 to about 12% (Figure 5), resulting in high Q. I. T a r "E". By distillation, the Q.I. was increased to about 217'0 and was now called Pi tch I'M". The Q. I. content of P i tch "M" was lowered to 7 and 140/, by blending with P i tch " Z " to yield Pitches "L" and "K", respectively.
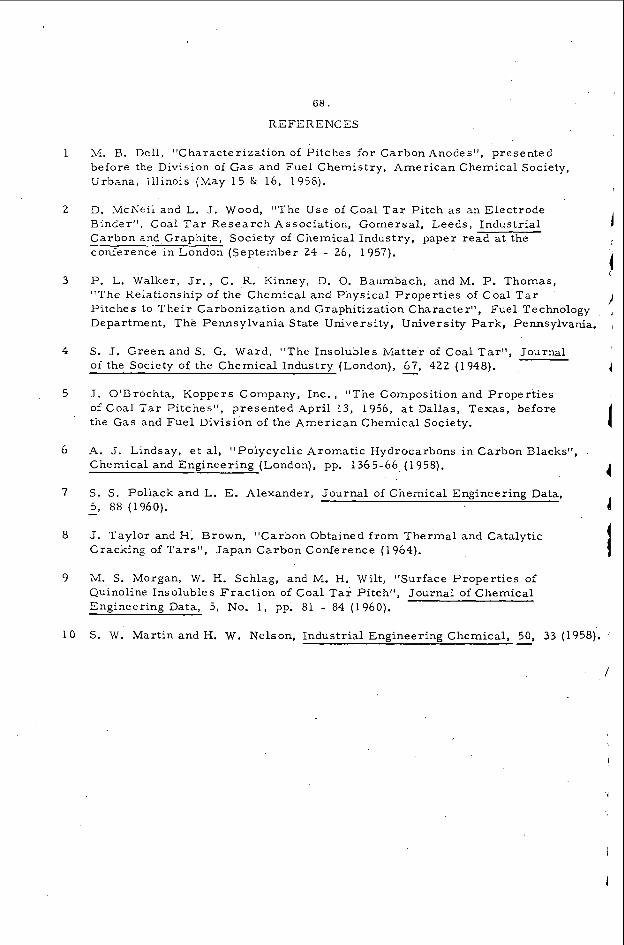
The character is t ics of all these pitches, as received by Airco Speer, is shown in Table 1. Since Allied used new o r modified polymerization techniques, it proved difficult to make some of the pitches with specific Q. I. values. Pi tch "P" was considerably lower in Q. I. than predicted, their process scheme, i t would have been economically impract ical or technically impossible for them to change their processing to ra ise the Q. I.
In particular, To be consistent with
When Airco Speer received the pitches, they were extruded in an electrode formu- lation ,in the Pilot Plant, i n five inch diameter rods. using a standard binder pitch, w a s a lso extruded.
i t was the intention to extrude all pitches a t three binder levels, according t o standard Pilot Plant operating procedures. However, Pitches "K", "M" and "P" were non-extrudable at the lower binder level. The as-formed rods were then baked to about 800 C in the P i lo t Plant furnace, then graphitized to about 2800 C. All stock w a s tested by the Chemical and Physical Measurements Group of the Re search Department.
Concurrently, a control lot,
RESULTS AND DISCUSSION
Table 2 summarizes all of the pertinent graphite data and also gives the relative
65.
Table 1
CHARACTERISTICS OF 12 ALLIED EXPERIMENTAL PITCHES
Pitch Softening Q.I. Q. I. Q.I. Carbon Type Point (Predicted) (Airco Speer) (Allied) Disulfide
Insoluble C 7 0 7 0 % 7 0
Y 102 21.0 20.5 20.0 34.1 W 104 14. 0 14.6 14. 5 32. 9 X 10³ 7.0 9. 9 8.6 29.2 M 103 21.0 20. 8 21. 7 38.4 K 104 14.0 15.6 15. 0 34.2 L 102 7 .0 9.4 8. 9 28. 1 U 105 21.0 17.4 18. 9 37. 1 s 105 14. 0 13. 8 12. 0 33.8 T 105 7. 0 9.4 7. 3 29. 8 P 105 21.0 12.3 10. 9 35.5 N 105 14.0 10.7 9.7 32.6 Q 105 7.0 7.7 7. 2 28. 5
/

6 6 .
binder levels at which the formulations were extruded. formulations, it is reasonable to assume that the spread in binder levels, 2 pph, can result in significant differences in graphite properties. levels and formulations a r e proprietary. properties a r e coded. show the true, relative differences in values, which correctly shows the change i n effects due to the different pitches.
Since these were electrode
The actual binder It should a l so be noted that the graphite
Though the actual values a r e not represented, they do
A portion of the data is graphically represented in Figures 6, 7 and 8. Only the optimum values f o r some of the most important properties were plotted, These values are: t ransverse coefficient of thermal expansion (T-CTE), flexural strength and apparent density. Thus, for the T-CTE's (Figure 6 ) , only the binder levels that resulted in the lowest CTE, were considered. Those binder levels a r e not necessar i ly the same ones that resulted in optimum flexural strengths (Figure 7) or apparent densities (Figure 8), and vice versa. In determining the suitability of a particular pitch for fur ther evaluation, a compromise is sometimes necessary i n considering which binder levels m e r i t most attention.'
i On this basis, the most important process, in t e rms of T-CTE, is P rocess III. I n particular, Pitch I ' P l ' , at its optimum value (Figure 6 ) , had a T-CTE of about 0. 54 x 1 O-b/C, which was substantially lower than the standard. However, the flexural strengths (Figure 7) were also lower, but could be increased, if required, through impregnatioh ei ther lower or equivalent to the standard, w i th no apparent degradation of structural(
It is of further interest to note that all of the T-CTE's were
integrity.
Pi tch l'Y", f rom P r o c e s s I, i s a l so important, not only because of i ts low graphite T-CTE. but a lso because the flexural strengths and apparent densities (Figure 8) were at least equivalent to the standard. somewhat l e s s e r degree, Pi tches Q, N and W were a l so important because of their low T-CTE's. Graphite strengths were equivalent to the standard.
F r o m the longitudinal e lec t r ica l resist ivity data (Table 2) it can be seen that a l l the values were higher than the standard, with the exception of graphites from Pitches "T", "U" and possibly "L" and 81N11, which were about equivalent. ever , even those with equivalent resist ivit ies were no better than the standard, in t e r m s of apparent density, f lexural strength o r t ransverse CTE.
F r o m the same standpoint, but to a
How-
CONCLUSION
The most significant fact t o a r i s e out of our r e sea rch is that graphite physical propert ies , such as CTE, flexural strength, apparent density and electrical resist ivity, a r e apparently unrelated to pitch Q. I. levels, alone, but to the nature or type of Q. I. i. e. , process route, by which specific Q. I. levels are attained.
This, i n turn, is directly related to the method of preparation,
I

1
2
3
4
5
6
7
8
9
10
68.
REFERENCES
M. B. Dell, "Characterization of Pitches for Carbon Anodes", presented before the Division of Gas and Fuel Chemistry, American Chemical Society, Urbana, Illinois (May 15 & 16,
D. .Mciieii and L. J. Wood, "The Use of Coal T a r Pitch as an Electrode Binder", Coal T a r Research Association, Gomersal , Leeds, Industrial Carbon and Graphite, Society of Chemical Industry, paper read at the conference in London (September 24 - 2 6 , 1957).
P. L. Walker, Jr., C. R. Kinney, D. 0. Baumbach, andM. P. Thomas, "The Relationship of the Chemical and Physical Propert ies of Coal T a r Pitches to Thei r Carbonization and Graphitization Character", Fuel Technology Department, The Pennsylvania State University, University Park , Pennsylvania. ,
1958).
1
,i I
S. J. Green and S. G. Ward, "The Insolubles iMatter of Coal Tar" , Journal I
of the Society of the Chemical Industry (London), - 67, 422 (1948). 4 J. O'Brochta, Koppers Company, Inc. , "The Composition and Propert ies of Coal T a r Pitches", presented April 13, 1956, at Dallas, Texas, before the Gas and Fuel Division of the American Chemical Society. 1 A. J. Lindsay, e t al, "Polycyclic Aromatic Hydrocarbons i n Carbon Blacks", Chemical and Engineering (London), pp. 1365-66 (1958).
S. S. Pollack and L. E. Alexander, Journal of Chemical Engineering Data, - 5 , 88 (1960).
J. Taylor and H. Brown, "Carbon Obtained f rom Thermal and Catalytic Cracking of Tars" . Japan Carbon Conference (1964).
(I
1
M. S. LMorgan, W. H. Schlag, and M. H. Wilt, "Surface Proper t ies of Quinoline Insolubles Frac t ion of Coal T a r Pitch", Journal of Chemical Engineering Data, 5, No. 1 , pp. 81 - 84 (1960).
S . W. Martin and H. W. Nelson, Industrial Engineering Chemical, 50, 33 (1958). -

69.
i
i J 4

70.
-N I
a
I
1 f
..

I
I '
I i
71.
F

72.

73.
ELECTRODE TESTS O F PURIFIED COKE FROM COAL IN ALUMINUM MANUFACTURE
V. L. Bullough, L. 0. Daley, W. R . Johnson and C. J. McMinn
Reduction Research Laboratory, Reynolds Metals Company, Sheff ield, Alabama
During the electrowinning of aluminum from aluminum oxide by the Hall process nearly 0 .5 pounds of high grade carbon is consumed for each pound of aluminum produced. necessity, be of high purity because many metallic impurities in t h e carbon a r e transferred to t h e aluninum produced, and affect t h e metallurgical properties of the aluminum. F o r this reason raw materials used in anode manufacture for the aluminum industry have stringent purity specifications.
In addition to the specifications of purity, coke used in the manufacture of electrodes for aluminum production n;ust be heat treated to ten-Lperatures of about 1300°C to insure the high temperature dimensional stability of the electrode. It must also contain about 25 percent of particles larger than 1/4 inch to allow for a graduated aggregate in electrode manufacture that is needed to prevent the propagation of stress cracks in large carbon masses.
\
The r a w materials making up this carbon must , of , ’
,
, Y
Because petroleum coke represents a large volume source of relatively pure carbon, it is used almost exclusively for anode manufacture by the aluminum industry in the United States. supplement the supply of petroleum coke.
Some coal tar pitch coke is used in Europe to \
I ’
I
Coke derived from coal is not used in alumina reduction cell anodes because of the high ash content. of removing the mineral matter from coal for the purpose of making purified coke for electrode use, and coke from purified coal has been used in Europe on a commercial scale in at least two cases.’ ’ * These were wartime uses, however, and were not competitive when adequate supplies of high grade petro- leum coke were available.
Several investigators1-6 have studied methods
Possible fu tu re shortages of electrode grade petroleum coke have encouraged the continued investigation of methods of producing high purity coke from coal as a substitute and corxpetitive rr.ateria1 for use in electrodes. report will be concerned primarily with a performance test of electrodes made from a purified coke from coal in pilot plant and commercial alumina reduction cells.
This ~
t,
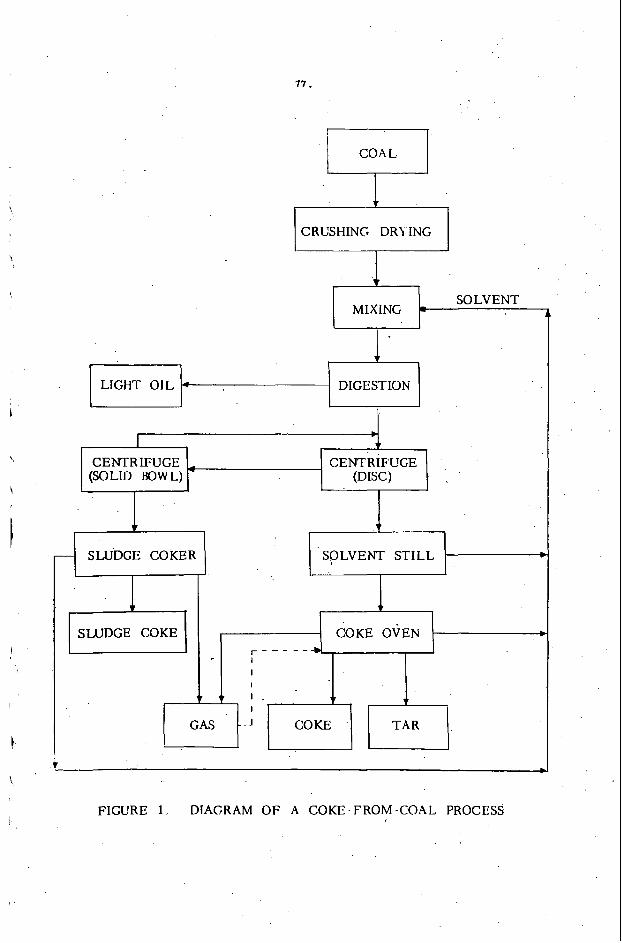
Process Description
\ Figure 1 is a diagram of the major steps of a process for manufacturing high grade coke from coal. Company for the production of coke, a mixture of high volatile bituminous coal and a solvent oil was digested in a continuous pressure digester to a temperature slightly above the temperature of maximum solubility of the coa1.O The coal solution from the pressure digester was charged to centrifuges where the
In a pilot plant operated by Reynolds Metals I

1 4 .
stis;><il<!ci! iiiinc!nl iiiiittcr aiid fusain were sc'parated fro111 t!ie coi l solution. l'liis solution fro111 thc ccntl-ifuge was c'hargcd to a continuous distillation still wherc tlic solvent was separated and rcturneci to the iiiixing cycle. The still hoxoms which containcd the purificd coal were charged d i r ea ly to n cokc ovcn whel-c a purified coal was converted to cokc and heat treated to a temperature that \vould assuic diincnsional stability at the operating temperature of an alumina reduction ccll.
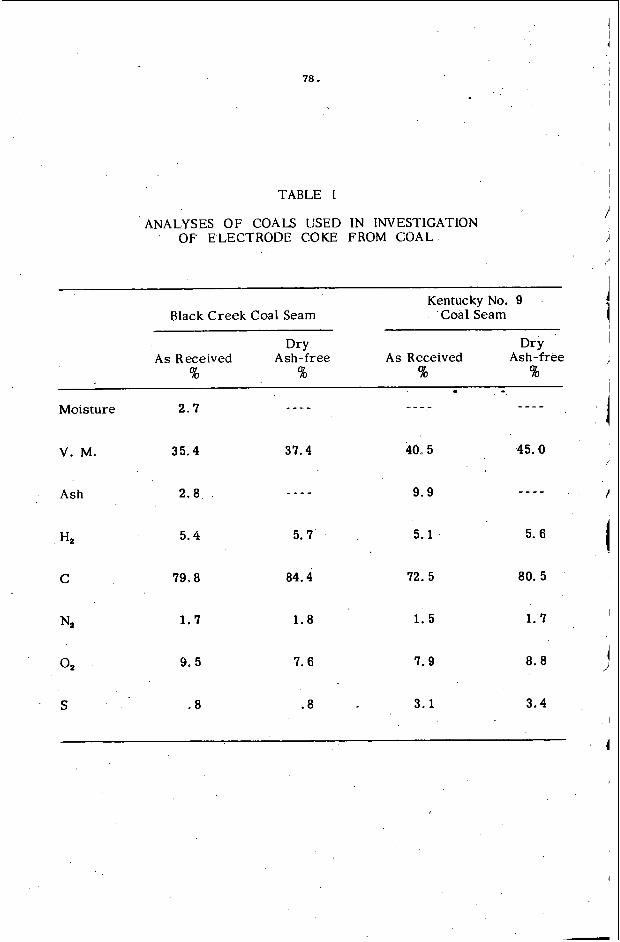
Coal from two sources was run i n thc pilot plant - the Black Crcek sciiin in North Xlabani~i and the No. 9, seam in Western l<entucky. thcse coals are shown in T a b l e I. coals compared with an elcctrode grade petroleum coke are shown in Table 11: Electrical resisrivity was determined by the Great Lakes Carbon Company Mcthod, C-12, and the I-lardgrove grindability index was determined by ASTM Method No. D409-51. was more resistant to grinding than regular petroleum coke. The iron content was the only property of this coke that was inferior to electrode grade petroleum coke and did not meet specifications imposed by aluminum producers. iron content of the coke produced in the pilot plant w a s about three times higher than coke produced from the same coals in laboratory scale equipment, it i s believed that this difference ,represents iron pickup from t h e pilot plant process- ing equipment and i s not a n inherent limitation of the process.
Typical analyscs of Typical properties of cokes made from these
The coke prepared from these coals had a grey metallic luster and
'Since the
Two types of carbon anodes a r e used in the aluminum process. In t h e prebaked anode type cell, electrode blocks a r e fabr.ic.ated from a graded carbon aggregate and coal t a r pitch. hydraulic presses, and the resulting blocks a r e heated in furnaces to about 1200°C. The baked block i s suspended in the molten salt'electrolyte by the electrical con- nection which i s usually made with a steel pin held in a specially molded well in the carbon block by cast iron. In the other type of anode system, which is known as the continuous electrode or Soderberg system, heat from the 'electrolytic pro- cess i s used to bake a carbonaceous paste prepared from a graded coke aggregate and coal tar pitch. This paste i s added to the top of t h e anode casing a s carbon i s consumed by the process from the bottom of the anode. a r e made through steel pins embedded in t h e carbon.
This misture i s pressed into blocks by large
Electrical connections
Approximately 6000 pounds of coke from purified coal were processed into electrode blocks at t h e carbon plant of a commercial aluminum plant for tests in a 10,000 ampere scale alumina reduction c,ell. These blocks were 20 x 16 x 13 inches and each weighed about 200 pounds.
Thcre a r c two major sources of anode carbon consumption in an alumina These a re electrolytic reaction with oxygen releascd from the reduction cell.
aluminum oxide at the working face of t h e anode and reaction with oxygen from the a i r on the sides and top of t h e anode in t h e area not wet by t h e molten salt electro- lyte. sources, a number of the anodes were capped with an alumina cap prepared from
. a tabular alumina castable refractory. The rest of t h e blocks were run without a cap to prorecr: against ai.r burning which is t h e normal practice i n an alumina reduction plant. regular electrode materials, half of the anodes in the cell a t any time were pre- pared from pctrolcum coke.
To determine t h e amount of carbon lost to oxygen from each of these
To provide experimental control and comparison against
I
I

Y
I i
I
I
7 5 .
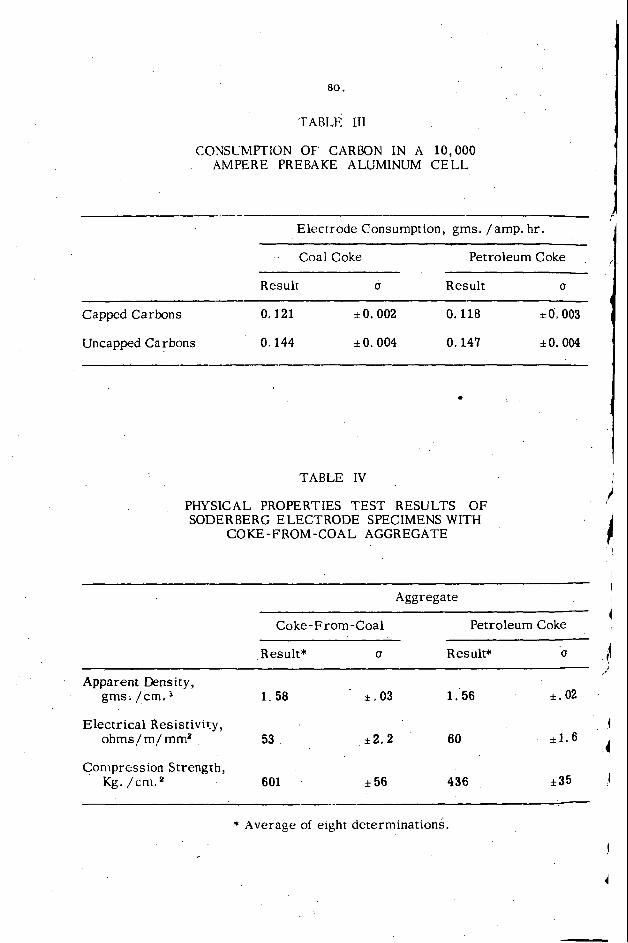
Each anode was wcighed before being placed in the test cell. Aftcr seven days of electrolysis the unburned portion was removcd from thc cell and wcighcd. The difference between the initial and the final weights' was takcn to bc equal to the carbon consumcd during the test period. alumina refractory were weighed before capping and after test t h e remaining cap was broken froni the block before the stub was weighed. Each individual anode position on the test cell was equipped with electrical shunts and t h e current passing through the block during the test period was recorded with integrating ammeters. Results of the test a r e summarized in Table 111. Approximately 30 anode blocks made from the coke from purified coal were tested a s were a like number of con- trol blocks made from petroleum coke. This number of blocks was established by statistical treatment of data from previous experiments a s being the number required to distinguish a carbon consumption difference of 0. 5 gms. /amp. hr. in this type of test cell.
The anodes that were capped with an I
The anode stubs from the coke from coal blocks removed from the ' test cell were hard and dense and showed no tendency for coke particles to dust from the electrode surface.
In a second test, more than 20,000 pounds of coke made from purified coal were made into a carbon paste and tested in a 45,000 ampere Soderberg type reduction cell. samples of the carbon paste that were baked to about 1,OOO"C in a laboratory furnace a r e shown in Table IV with the mechanical properties of specimens from comparable paste made from electrode grade petroleum coke. One notable characteristic of the paste prepared from coke from purified coal was that about two perccz; icss pitch was required than was normally used to prepare paste of comparable viscosity from petroleum coke.
Mechanical properties of electrode specimens prepared from
Midway through the test the anode was raised from the electrolyte and The working face of the anode was flat and smooth and the anode inspected.
was free of large cracks indicating that the coke from the pilot plant was thermally stable for use at the anode operating temperatures. Cell operation was smooth and efficient and the anode generally could not be distinguished from anodes made from petroleum coke.
Discussion
Examination of the test results summarized in Table I11 indicate that the consumption of carbon blocks was nearly the same for the coke from coal anodes as it was for the petroleum coke anodes.. capped and udcapped anodes shows that 20 percent of the carbon in the petroleum coke anodes was lost to a i r burning compared to 1 6 percent for the anodes made with coke from coal. were less susceptible to attack by oxygen in t h e air. by observations made while determining the ash content that the cokes made from coal required considerably longer time to burn away than did petroleum cokes.
The performance testing of electrodes made from coke from purified coal in both prebaked and Soderberg type anodes indicated that the coke was satisfactory and could meet the specifications for anode grade coke for the aluminum industry.
The difference in consumption between
This is an indication that the coke from coal electrodes This indication is supported

7 6 .
ACKNOWLEDGMENT
The permis<icm o f Rr.\nc4ds Metals Cctmpanb to publish the rt.sults of this investigation is grCarfulI\ a.. knc-lwlziigr-d.
LlTEKATllRE CITED
1.
2,
3.
4.
5.
6.
7.
8.
9.
Selvig, W - A . , W.. ti. Odt:, and F. H Gibson, '.Coke From Low-Ash Appalachian Cnals for Car.bon E1c:crrrde.s In Aluminum Industry, Mines Report (Jf 1nvt;:srrgar:cms 3731, 1943, 188 pp.
Graham, H- C,. , and L D. Schmidr, "Methods of Producing Ultra-Clean Coal for Elecrrodt? Carbon in Germany, ' I Bureau of Mi,nes Information C i r p ~ l a r 7481, 1948, 13 pp.
Bureau of,
Campbell, R 1 , Ir , R I Hilrcm, and C L. Boyd, "Coal A s a Source of Electrode Carbon in Aluminum ProduL-tion, " Rureau c4 Mines, Report of .lnvesrigations 5191, 1956. 53 pp
Klemgard, E N , "Elecrrnde Carbon From Washington State Coal, '*
Bullerin No 218. Washington Stare Institute of Technology, Pullman, Washington, 1953, 37 pp
Bloomer, W 1 , and F L Shea, "Coal Deashing and High-Purity Coke, " American Chemical S r ~ c w y . Division of Fuel Chemistry, Preprints, 11 No. 2, 378-392 !April 1967)
-
Kloepper, Dean L . , Thomas F Rogers, Charles H. Wright, and Willard C. Bull, "Solvent Processing of Coal to Produce a De-ashed Product, .' Research and Developmenr Report No, 9,- Office of Coal Research.
.
Nelson, H . , "The Se1~:ctive Separation of Super LL~W Ash Coal by Flotation, Gas World, ' Vol 127, 1947, pp 125-130-132.
Lowry, H H , and H I Rose, ' Port-Broche Coal Extraction Process and Plact of Ruhrol G M B H , ktrrop-Wilheim, Germany, "Bureau of Mines Information Circt~ldr 7420, 12 pp.
C S. Patent 3,240.566
17 .
MIXING
ICRUSHING DRIING I SOLVENT
r-
LIGHT OIL 4
r
DIGESTION
SOLVENT STILL I
I
CENTRIFUGE (SOLID BOWL)
I CENTRIFUGE (DISC)
FIGURE 1, DIAGRAM OF A COKE-FROM-COAL PROCESS
I
7 8 . I
I
TABLE I
ANALYSES OF COALS (.!SED IN INVESTlGATlON OF' ELECTRODE COKE FROM COAL
/
I 1 Kentucky No. 9 'Coal Seam Black Creek Coal Seam
I Dry Dry A s Received Ash -iree
B s A s Received Ash -free ,,
% s
V. M. 35.4 37.4 40.5 45.0
Ash 2.8
H2 5.4 5.7
C 79-8 84.4
- - - - . 9.9
5.1 5. 6
72.5 80. 5
I
I 1.7 1.8 1.5 1.7 N*
0 2 9.5 7.6 7.9 8.8
S . 8 . 8 3.1 3.4

79.
P- m
In eu N
N N
v) W r( m
0
a b 0 0
P- m W O
0 0
: 8 0 0
In eu cy 0 0 m 0 0 0
Q) Q) (0 0 o P-
0 0 0
P- Q, aD 0 0 v)
0 0 0
80.
TABLE III
CONSLMPTlON OF CARBON IN A 10,000 AMPERE PREBAKE ALUMINUM CELL
I-*.--- -- Elecrrode Consumption, gms. /amp. h r .
Coal Coke Petroleum Coke
Resu l t U Resu l t U
Capped Carbons 0.121 *o. 002 0.118 * 0.003
Uncapped Carbons 0.144 io, 004 0,147 *O. 004
.
TABLE IV
PHYSICAL PROPERTIES TEST RESULTS OF SODERBERG ELECTRODE SPECIMENS WITH
COKE-FROM-COAL AGGREGATE
Aggregate
Coke-From-Coal Petroleum Coke
Result* U R es u lt* U
Apparent Density, gms. /cm. 1. 58 k.03 1.56 f. 02
Electrical Resistivity, ohms/ m/ mm2 53 * 2 . 2 60 il. 6
Compression Strength, Kg. /cn i ,2 601 f 56 436 *35
* Average of eight determinations.
81.
THE I R R E V E R S I B L E EXPANSION OF C A R B O N BODIES DURIN~.GRLP4ITIZATION
M. P . W h i t t a k e r and L . I . G r i n d s t a f f
Great L a k e s R e s e a r c h C o r p o r a t i o n E l i z a b e t h t o n , T e n n e s s e e
I N T R O D U C T I ON
The f o r m a t i o n o f s y n t h e t i c e r a n h i t e f r o m a m o r p h o u s c a r b o n s h o u l d t h e o r e t i c a l l y b e a c c o m p a n i e d bv a c o n t i n u o u s s h r i n k a g e o f m a t e r i a l . Hoerever , in manv i n s t a n c e s a n i r r e v e r s i b l e v o l u m e e x p a n s i o n , commonly r e € e r r e d t o as p u f f i n e , i s a c t u a l l v o b s e r v e d t o o c c u r a t some ~ o i n t i n t h e t r a n s f o r m a t i o n . The a d d i t i o n o f c e r t a i n me ta l s , p a r t i c u l a r l y i r o n a n d c a l c i u m o r t h e i r compounds , i s known t o i n h i b i t o r e l i m i n a t e t h i s e x p a n s i o n . A l t h o u g h " p u f f i n g " h a s R e n e r a l l v b e e n a s s o c i a t e d w i t h t h e s u l f u r c o n t e n t o f t h e p e t r o l e u m c o k e , v e r v l i t t l e i n f o r m a t i o n h a s a c t u - a l l y b e e n p u b l i s h e d c o n c e r n i n g t h i s phenomenon , B a s e d l a r g e l y upon a n a l o g i e s f o u n d i n t h e p u f f i n g b e h a v i o r o f s u l f u r - c o n t a i n i n g p e t r o l e u m c o k e s and o f c a r b o n - b r o m i n e l a m e l l a r r e s i d u e c o m p o u n d s , H. C. V o l k l a d v a n c e d t h e t h e o r y t h a t p u f f i n g r e s u l t e d f r o m t h e d e c o m p o s i t i o n o f c c r b o n - s u l f u r l a m e l l a r r e s i d u e compounds . The f o r m a t i o n o f a t h e r m a l l y s t a b l e c a r b o n - s u l f u r - m e t a l t e r n a r y l a m e l l a r compound was p r o p o s e d as a n e x p l a n a t i o n f o r t h e i n h i b i t i o n m e c h a n i s m , H o w e v e r , t h e e x i s t e n c e o f t h e s e compounds h a s n o t b e e n c o n v i n c i n g l y e s t a b l i s h e d a n d o u r r e s u l t s a r e c e r t a i n l y d i f f i c u l t t o r e c o n c i l e w i t h l a m e l l a r compound f o r m a t i o n .
EXPERIMENTAL.
The c a r b o n b o d i e s were made f r o m a s t a n d a r d m i x t u r e o f c a l c i n e d p e t r o l e u m c o k e , p a r t i c l e s i z e s r a n g i n g f r o m -35 mesh t o -100 m e s h , a n d a c o a l t a r p i t c h b i n d e r b y h o t p r e s s i n g i n a n e l e c t r i c a l l y h e a t e d mold a t 1 2 , 5 0 0 p s i 5 f o r t h i r t y s e c o n d s a t 100°C. T h e c y l i n d r i c a l p l u g s were b a k e d t o a t e m p e r a t u r e o f 8 5 0 ° C .
The e x t e n t o f i r r e v e r s i b l e e x p a n s i o n e x h i b i t e d by t h e b a k e d c a r b o n b o d i e s a s a f u n c t i o n o f h e a t t r e a t m e n t w a s m e a s u r e d w i t h a g r a p h i t e d i l a t o m e t e r . The d i l a t o m e t e r h o l d i n n t h e c a r b o n p l u g s w a s h e a t e d I n a g r a p h i t e t u b e f u r n a c e t o t e m p e r a t u r e s a s h i g h a s 2900°C a t a r a t e o f 1 4 " C / m i n . A n i t r o g e n a t m o s p h e r e w a s m a i n t a i n e d t h r o u q h - o u t t h e h e a t i n g p e r i o d .
A 1 5 , 0 0 0 p s i m e r c u r y p o r o s i m e t e r was u s e d t o o b t a i n m l c r o p o r e v o l u m e d i s t r i b u t i o n i n t h e h e a t e d c a r b o n p l u g s . T h e p l u g s w e r e c r u s h e d t o -35148 mesh a n d p o r e v o l u m e d e t e r m i n a t i o n s made o n 0.400 g. s a m p l e s o f t h i s m a t e r i a l .
X-ray d i f f r a c t i o n e x a m i n a t i o n s w e r e made w i t h a r e c o r d i n g d i f f r a c - t o m e t e r u s i n g m o n o c h r o m a t i c Cu ka r a d i a t i o n a t room t e m p e r a t u r e .
The s u l f u r i n t h e c a r b o n s a m p l e s was d e t e r m i n e d by i g n i t i n g t h e s a m p l e i n a n o x y g e n a t m o s p h e r e a t 1400°C. T h e SO2 f o r m e d was t i t r a t e d c o n t i n u o u s l y by i d o m e t r y i n t h e p r e s e n c e o f s t a r c h i n d i c a t o r . Good a g r e e m e n t was P a r r - p e r o x i d e bomb c o m b u s t i o n t e c h n i q u e .
f o u n d b e t w e e n t h i s me thod a n d t h e m e t h o d u s i n y ! t h e

a2.
I? E S U L T S
C a u s e o f t h e 1 ) e f o r m n t i o n
The D e t r o l e u T c o k e s s t u d i e d ~ ~ h i c l i -7ere s u b j e c t t o d e f o r m a t i o n c o u l d b e s e n a r a t e d r o u e h l v i n t o two b r o a d ~ r o u n s a c c o r d i n r r t o t h e i r n u f f i n ~ . c h a r a c t e r i s t i c s . T v n i c a l d r n a m i c e l o n ~ a t i o n c u r v e s o f t h e two e r o u n s a r e c o m n a r e d i n ' i s u r e 1 a n d r i s u r c 2 . I t c a n be s e e n t h a t t h e r e e x i s t s a d i f f e r e n c e o f 300°C b e t w e e n t h e t w o c r o u n s o f c a r b o n s v i t h r e s p e c t t o t h e t e T n e r a t u r e a t w h i c h t h e d e f o r e a t t o n b e p i n s . The c o k e s w h i c h d e f o r r a t t h e lor.yer t e m n e r a t u r e d o n o t r e s n o n d v e l 1 t o q u f f i n ? i n h i b i t o r s a n d v e n e r a l l v h a v e a h i ~ h e r c o n c e n t r a t i o n o F s u l f u r , o x v o e n and n i t r o a e n .
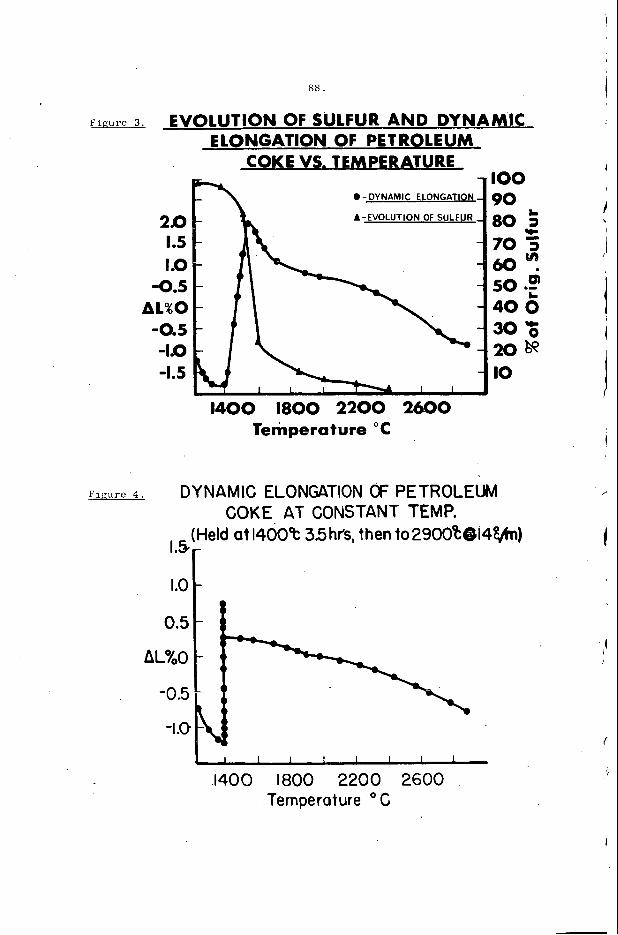
The l o s s o f t i l e v o l a t i l e c o n s t i t u e n t s o € . a l a r g e numher o f c a r b o n s a s a f u n c t i o n o f h e a t t r e a t m e n t v a s d e t e r m i n e d . I n a l l c a s e s o x y e e n and n i t r o e e n were l o s t a t t e n n e r a t u r e s b e l o v 1 0 0 0 ° C . The s u l f u r o u s e a s e s , h o v e v e r , w e r e e v o l v e d o v e r ~ r e c i ~ e l ~ t h e same t e m p e r a t u r e r a n e e a s t h a t a t : ~ ! i i c h t h e d e f o r m a t i o n o c c u r r e d . The s u l f u r e v o l u t i o n f r o m t h e s a m o l e s was f o l l o w e d b y h e n t i n r . t h e b o d i e s a t t h e same r a t e , , 1 4 ° C / m i n . , a s was u s e d i n t h e d v n a n i c n u f f i n r ! t e s t t o v a r i o u s t e m n e r a t u r e s h e f o r e t h e d e s i r e d a n a l v s e s c7ere m a d e . T h e c o m p o s i t i o n o f t h e s a m n l e s w a s compared a n d c o r r e l a t e d w i t h t h e d v n a m i c n u f f i n a c h a r a c t e r i s t i c s . An e x a m n l e of s u c h . a c o r r e l a t i o n is n r e s e n t e d i n F i z u r e 3 . The r a t e o f s u l f u r e v o l u - t i o n i n t h e c a r b o n s a m n l e s i n w h i c h t h e i n i t i a l d e c o m p o s i t i o n and c o r r e s p o n d i n g d e f o r m a t i o n o c c u r r e d a t t h e l o v e r t e m q e r a t u r e , 14OO0C, w a s t e n t o t w e n t v t i n e s e r e a t e r t h a n t h e r a t e o b s e r v e d i n s a m ~ l e s w i t h t h e m o r e t h e r m a l l v s t a b l e sulfur.
The e s c a n i n g e a s f r o m s e v e r a l c a r b o n s v a s c a r e f u l l v t r a p n e d and a n a l v z e d . The p a s w a s f o u n d t o b e e s s e n t i a l l v h v d r o p e n s u l f t d e . U n f o r t u n a t e l v , a l l o f t h e c a r b o n s s t u d i e d w i t h a h t R h e n o u e h s u l f u r c o n t e n t t o D e r m i t m e a n i n e f u l qas a n a l v s i s n u f f e d i n t h e low t e m p e r a t u r e r a n e e .
I f a s a m p l e is h e a t e d t o t h e t e m p e r a t u r e a t w h i c h t h e s u l f u r f i r s t b e g i n s t o e v o l v e a n d i s h e l d a t t h a t t e m g e r a t u r e u n t i l t h e d e s u l f u r i z a t i o n i s e s s e n t t a l l v c o m n l e t e , d e f o r m a t i o n o f t h e s a m ~ l e o c c u r s o n l v a t t h i s t e F n e r a t u r e , s e e P i e u r e 4 . T h e r e i s l i t t l e d o u b t t h a t p u f f i n e r e s u l t s f r o m i n t e r n a l u r e s s u r e s g e n e r a t e d bv t h e s u d d e n e x n u l s i o n o f HZS.
D T J c a r e f u l l y m e a s u r i n e t h e c r y s t a l l i t e d i m e n s i o n s d u r i n q t h e c o u r s e o f t h e d e f o r n a t i o n bv means o f x - r a y d i f f r a c t i o n , i t b e c o m e s a u u a r e n t t h a t t h e D U ~ f i n e is a n i n t e r - c r y s t a l l i n e phenomenon . However , i n o n e e x n e r i m e n t i n w h i c h a s a m n l e made f r o m a c o k e h a v i n g an u n u s u a l l y h i e h s u l f u r c o n t e n t w a s n u s h e d d i r e c t 1 7 7 i n t o a f u r n a c e a t 1 4 0 0 " C , a n a n o m a l o u s x - r a y att tern w a s o b t a i n e d f r o m t h e s n n n l e . The O O L d i f f r a c - t i o n Deaks were s n l i t , o n e p o r t i o n o f t h e ~ e a k h e i n q l o c a t e d a t t h e e x q e c t e d 2 0 a n a l e a n d t h e o t h e r o c c u r r i n a a t a s l i ~ h t l v h i g h e r a n a l e , s ee F i g u r e 5. Unon f u r t h e r h e a t t r e a t m e n t a c o a l e s c e n c e i n t o a s i n g l e p e a k o c c u r s , t h e l o w e r a n e l e n o r t i o n o f t h e n e a k o v e t t a k i n e t h e o t h e r . One u o s s i b l e e x D l a n a t i o n is t h a t t h e h i q h i n t e r n a l u r e s s u r e R e n e r a t e d w i t h i n t h e sample h a s a c t u a l l v f o r c e d n a r t o f t h e s a m n l e t o a more E r a D h i t i c s t a t e . I t i s c e r t a i n l v w e l l known t h a t e x t e r n a l l v a D u l i e d n r e s s u r e f a c i l i t a t e s * r a u h i t i z a t i o n . 2
The po re s t r u c t u r e of t n e s a n ~ l e s d u r i n e n u f f i n q was e v a l u a t e d b v m e a n s o f r n e r c u r v a o r o s i m e t r v . T v n i c a l u o r e size d i s t r i b u t i o n c u r v e s a r e p r e s e n t e d i n T i e u r e 6 . P u f f i n g is c h a r a c t e r i z e d b y a n i n c r e a s e i n

83.
p o r e s h a v i n g d i a m e t e r s i n t h e 0 .1 - ,015 u r a n a e . The t o t a l d e f o r m a t i o n o f t h e s a m n l e c a n b e a c c o u n t e d f o r bv t h e c r e a t i o n o f t h i s a d d i t i o n a l p o r o s i t y r e s u l t i n g f r o m t h e h o t e x D a n d i n e g a s c h a n n e l i n q i t s wav to t h e s a m p l e s u r f a c e .
The m a g n i t u d e o f t h e d e f o r m a t i o n d o e s n o t d e p e n d e n t i r e l y upon t h e s u l f u r c o n t e n t o f t h e c o k e , The m i c r o s t r u c t u r e o f t h e c o k e is a l s o i m p o r t a n t . As w o u l d b e e x p e c t e d , h a r d c a r b o n s c h a r a c t e r i z e d b y a h i g h d e g r e e o f c r o s s - l i n k i n g b e t w e e n c r y s t a l l i t e s a r e much more r e s i s t - a n t t o d e f o r m a t i o n t h a n t h e more g r a p h i t i c " s o f t e r " t y u e c a r b o n s . F o r t h i s r e a s o n t h e r e a r e s e v e r a l c o k e s w h i c h d o n o t p u f f a l t h o u q h t h e y h a v e a s u l f u r c o n t e n t c o m p a r a b l e t o t h a t o f a p u f f i n g s o f t e r t y p e c o k e a n d t h e s u l f u r i s e v o l v e d o v e r t h e same t e m p e r a t u r e r a n g e a t t h e same r a t e . T h i s m i c r o s t r u c t u r a l d e p e n d e n c e was f u r t h e r i l l u s t r a t e d by n r o d u c i n g a s o f t e r t v p e c a r b o n f r o m a f e e d s t o c k w h i c h o r d i n a r i l y f o r m s a r e l a t i v e l y h a r d c a r b o n bv m a k i n g c e r t a i n c h a n q e s i n p r o c e s s i n g a n d c o m p a r i n g t h e p u f f i n g c h a r a c t e r i s t i c s o f t h e t w o c o k e s . T h e s u l f u r c o n t e n t o f t h e more g r a o h i t i z a b l e c a r b o n e x h i b i t i n g a l i n e a r CTE o f 5 . 0 x 10-7/OC w a s e x a c t l y t h e same a s t h e l e s s g r a p h i t i z a b l e c a r b o n h a v i n g a CTE o f 23 .0 x 10-7/OC. The s o f t e r c a r b o n , h o w e v e r , p u f f e d w h i l e t h e o t h e r c o k e e x h i b i t e d n o m e a s u r a b l e d e f o r m a t i o n .
Mechan i sm o f P u f f i n e I n h i b i t i o n
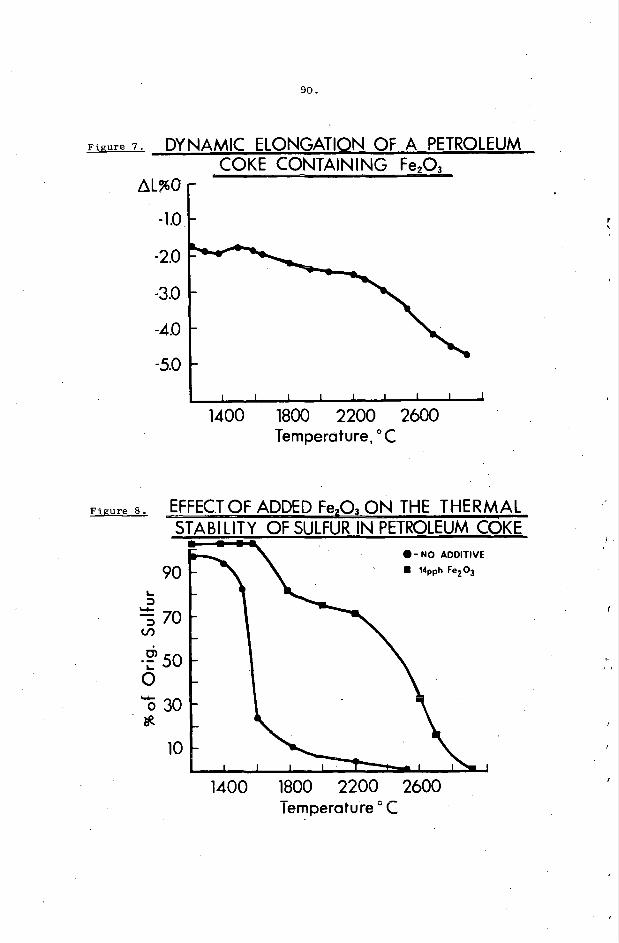
A s i l l u s t r a t e d i n F i g u r e 7 f o r t h e case o f i r o n o x i d e , c e r t a i n m a t e r i a l s when a d d e d t o t h e c a r b o n s a m p l e e l i m i n a t e o r a t l e a s t d i m i n - i s h i n m a g n i t u d e t h e p u f f i n g e f f e c t . T h e t e m p e r a t u r e r e q u i r e d t o i n i t i a t e t h e v o l a t i l i z a t i o n o f s u l f u r i s h i g h e r a n d t h e r a t e o f t h e s u b s e q u e n t g a s e o u s e v o l u t i o n i s l o w e r i n t h e s a m p l e s c o n t a i n i n g a n . i n h i b i t o r , see F i g u r e 8 . An a n a l y s i s o f t h e e f f l u e n t g a s r e v e a l s t h a t t h e s u l f u r i s p r i n c i p a l l y i n t h e f o r m o f e l e m e n t a l s u l f u r r a t h e r t h a n H2S. The c o m p o s i t i o n o f t h e s u l f u r v a p o r a t t h e s e t e m p e r a t u r e s i n g o v e r n e d b y t h e f o l l o w i n p e q u i l i b r i a :
800OC 190OoC - S - s ' 6 .-- s 4 - __ 2 ~
- Even a b o v e 1 9 0 0 ° C t h e s u l f u r v a D o r i s 5 5 % a s s o c i a t e d . 3 An i n c r e a s e i n a s s o c i a t i o n o f t h e s u l f u r a t o m s w o u l d , o f c o u r s e , r e s u l t i n a d e c r e a s e i n g a s v o l u m e . By f o l l o w i n g t h e c o m p o s i t i o n o f t h e i n h i b - i t o r a s a f u n c t i o n o f t e m p e r a t u r e bv means o f x - r a y d i f f r a c t i o n , t h e m e c h a n i s m o f i n h i b i t i o n b e c o m e s a p p a r e n t . T h i s t y p e o f a n a l y s i s f o r i r o n o x i d e i s g i v e n i n F i g u r e 9 . T h e i n h i b i t o r r e a c t s w i t h t h e s u l f u r t o f o r m a s u l f i d e w h i c h s u b s e q u e n t l y d e c o m p o s e s a t a h i g h e r t e m p e r a t u r e l i b e r a t i n g s u l f u r i n i t s e l e m e n t a l f o r m a n d a t a r e d u c e d r a t e . The e f f e c t i v e n e s s o f t h e metal i n p r e v e n t i n g p u f f i n g is a f u n c t i o n o f t h e s t a b i l i t y o f i t s s u l f i d e . Sod ium, f o r e x a m p l e , f o r m s a s u l f i d e w h i c h i s e x p e l l e d r a p i d l y a t a r e l a t i v e l y l o w t e m p e r a t u r e r e s u l t i n g i n d i s t o r t i o n o f t h e s a m p l e , see F i g u r e 1 0 .
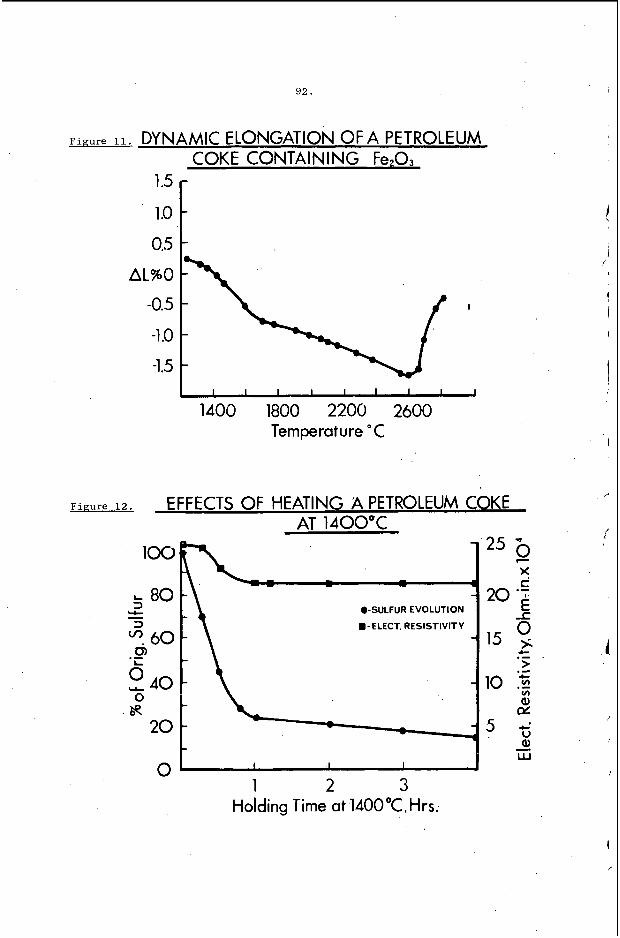
A s e c o n d a r y d e f o r m a t i o n o f r e d u c e d m a g n i t u d e w a s o b s e r v e d to o c c u r a t a r o u n d 2500°C i n t h e m o s t g r a p h i t i c or n e e d l e t y p e c a r b o n s s t u d i e d upon i n h i b i t i o n w i t h i r o n o x i d e , see F i g u r e 11, A g a s e o u s e v o l u t i o n r e s u l t i n g f r o m t h e d e c o m p o s i t i o n o f t h e i r o n s u l f i d e i s o c c u r r i n g a t t h i s t e m p e r a t u r e , h o w e v e r , t h e r a t e o f v o l a t i l i z a t i o n a t 2500°C i s n o t s u b s t a n t i a l l v d i f f e r e n t f r o m t h a t a t t e m p e r a t u r e s i m m e d i a t e l y b e l o w t h i s d e l a v e d p u f f i n g r a n g e . T h i s i n d i c a t e s t h a t s t r u c t u r a l c h a n g e s m u s t b e o c c u r r i n g i n t h e cacrbon b o d y w h i c h

a4.
e f f e c t i v e l y r e d u c e i t s r e s i s t a n c e to D u f f i n q . I t i s w e l l known t h a t t h e m e c h a n i c a l s t r e n g t h o f e r a p h i t e i n c r e a s e s w i t h t e m p e r a t u r e t o a b o u t 2500°C a n d t h e n d e c r e a s e s s h a r p l y w i t h t e m n e r a t u r e a b o v e 2 5 O O O C . 4 A s u b s t a n t i a l amoun t o f C r e e 9 o c c u r s i n e r a n h i t e a t 2 5 0 O o C a n d h i p , h e r .
. T h i s s u d d e n d e c r e a s e i n s t r e n g t h o f t h e bodv c o u p l e d w i t h t h e i n t e r n a l p r e s s u r e g e n e r a t e d by t h e d e c o m p o s i t i o n o f t h e metal s u l f i d e p r o v i d e s a l o g i c a l e x p l a n a t i o n f o r t h e o b s e r v e d d e l a y e d p u f f i n e .
L a m e l l a r R e s i d u e Compounds
Lamellar a n d l a m e l l a r r e s i d u e compounds a r e known t o h a v e a p r o n o u n c e d e f f e c t on t h e r e s i s t i v i t v o f t h e c a r b o n . D i l u t e r e s i d u e ComDounds w i t h a c o m n o s i t i o n C l o o X (X = i n t e r c a l a t e d s p e c i e s ) are r e p o r t e d t o decrease t h e r e s i s t i v i t y o f g r a p h i t e t o b e t w e e n 1 1 2 t o 1 / 1 0 o f i t s o r i g i n a l v a l u e , b o t h f o r n- a n d p - t y p e c o m p o u n d s . 1 The r e s i s t i v i t y o f a s a m ~ l e h e a t e d t o a t e m p e r a t u r e a t w h i c h p u f f i n q i s i n i t i a t e d s h o u l d i n c r e a s e w i t h t i m e as t h e r e s i d u e compound d e c o m p o s e s . We h a v e n o t f o u n d t h i s t o b e t h e case . I n some c a r b o n s , i n f a c t , t h e r e s i s t i v i t y a s i l l u s t r a t e d i n F i e u r e 1 2 i n w h i c h t h e w e i g h t p e r c e n t s u l f u r l o s s and r e s i s t i v i t v a r e p l o t t e d a e a i n s t h o l d i n g t i m e a c t u a l l v b e a r s a d i r e c t r e l a t i o n s h i p t o s u l f u r e v o l u t i o n . I n a d e c r e a s e i n d - s p a c i n g a n d r a p i d c r y s t a l l i t e e r o w t h d e c t e a s e i n r e s i s t i v i t y , s e e F i g u r e 1 3 . T h i s i s a d d t h a t p r e m a t u r e g r a p h i t i z a t i o n i s i n d u c e d b y t h e h i g h o f t h e s u l f u r o u s Rases.
t h e s e m a t e r i a l s a c c omp a n i e d t h e t i o n a l e v i d e n c e i n t e r n a l p r e s s u r e
t h e d - s p a c i n g i n a r . r e s i d u e com- '
The p r e s e n c e o f s u l f u r p e r s e d o e s n o t a f f e c t c a r b o n . T h e r e f o r e , t h e p r o p o s e d c a r b o n s u l f u r lame1 p o u n d s c a n n o t b e l o c a t e d b e t w e e n t h e l a y e r p l a n e s s i n c e a d i f f e r e n c e i n d - s p a c i n g w o u l d b e o b s e r v a b l e d u e t o t h e i r p r e s e n c e . I However , r e s i d u e compounds l o c a t e d a t i m p e r f e c t i o n s i n t h e p r a p h i t e s t r u c t u r e w o u l d b e u n l i k e l v t o c a u s e a c h a n g e i n t h e c a x i s o f t h e g r a p h i t e i f t h e i m p e r f e c t i o n s a r e r a n d o m l y d i s t r i b u t e d . The d i f f r a c t i o n p a t t e r n w o u l d e i t h e r n o t b e c h a n g e d o r e l s e o n l y a s l i g h t l i n e b r o a d e n i n g w o u l d o c c u r d u e t o t h e e n l a r g e m e n t o r c r e a t i o n o f new random i m p e r f e c - t i o n s . T h e e x i s t e n c e o f t h e p a r e n t l a m e l l a r compounds w o u l d b e e x p e c t e d t o b e d e t e c t a b l e by means o f x - r a v d i f f r a c t i o n e x c e p t f o r t h e f a c t t h a t t h e x - r a v p a t t e r n o f c a r b o n h e a t e d o n l v t o t h e low t e m p e r a t u r e s , b e l o w 12OO0C, a t w h i c h t h e v a r e t h o u g h t t o e x i s t is q u i t e d i f f u s e .
S i m i l a r l y , t h e r e s i s t i v i t y o f a n i n h i b i t e d s a m p l e is n o t a d v e r s e l y a f f e c t e d b v t h e r e m o v a l o f t h e s u l f u r a n d i n h i b i t o r b y h e a t t r e a t m e n t . V o l k n o t e d t h a t t h e r e s i s t i v i t v o f t h e s a m p l e w a s a p p a r e n t l y i n d e p e n d e n t o f t h e i n h i b i t o r c o n c e n t r a t i o n . F o r t h i s r e a s o n , h e p o s t u l a t e d t h a t t h e c a r b o n - s u l f u r - i r o n compounds were t e r n a r y l ame l l a r c o m p o u n d s i n w h i c h - i r o n f u n c t i o n s as a s p a c e r a n d i s t h e r e f o r e n o t i o n i z e d . However , a l a m e l l a r compound s u c h as t h i s s h o u l d b e e a s i l y d e t e c t a b l e b y x - r a v d i f f r a c t i o n a n a l y s i s . T h e x - r a y s p e c t r a o f an i n h i b i t e d c a r b o n i s e s s e n t i a l l y t h e same b e f o r e e l i m i n a t i o n o f i n h i b i t o r b y means o f h e a t t r ea tmen t a l o n e o r w i t h t h e a i d o f a p u r i f v i n g gas a s a f t e r r e m o v a l . I n a d d i t i o n , t h e d i f f r a c t i o n p a t t e r n o f a n i n h i b i t e d p u f f i n g c a r b o n i s n o t s i g n i f i c a n t l y d i f f e r e n t f r o m t h a t o f a n o n - p u f f i n g c a r b o n w i t h t h e same m e t a l c o n c e n t r a t i o n . The e x i s t e n c e o f a t e r n a r y l a m e l l a r compound i s , t h e r e f o r e , c e r r a i n i v d o u b r f u i .

8 5 .
c ONC LUS 1 ON s
P u f f i n g o f c a r b o n b o d i e s r e s u l t s f r o m i n t e r n a l p r e s s u r e gen- e r a t e d by t h e s u d d e n f o r m a t i o n of s u l f u r o u s R a s e s , p r i m a r i l y h v d r o g e n s u l f i d e . T h i s p r e s s u r e i s s u f f i c i e n t , i n some c a s e s , t o c a u s e p r e - m a t u r e g r a p h i t i z a t i o n . The i n c r e a s e d v o l u m e of t h e b o d y i s i n t h e f o r m o f s m a l l m i c r o p o r e s 0 . 1 t o . 015 p i n d i a m e t e r . V a r i o u s m e t a l s a c t as i n h i b i t o r s by r e a c t i n s w i t h s u l f u r t o f o r m s u l f i d e s w h i c h s u b s e q u e n t l y d e c o m p o s e a t a t e m p e r a t u r e a n d w i t h a rate w h i c h is d e p e n d e n t upon t h e s t a b i l i t y o f t h e s u l f i d e . The m a g n i t u d e o f t h e d e f o r m a t i o n is a l s o a f u n c t i o n of t h e c o k e s t r u c t u r e . T h e ha rd , c r o s s - l i n k e d c a r b o n s are much more r e s i s t a n t t o d e f o r m a t i o n t h a n t h e s o f t e r , more g r a p h i t i c c a r b o n s . No e v i d e n c e vas f o u n d f o r t h e
1
\ e x i s t e n c e o f l a m e l l a r o r l a m e l l a r r e s i d u e compounds i n v o l v i n g s u l f u r ' o r t h e i n h i b i t o r .
i
,
1

1.
2 .
3.
4 .
8 6 .
RE F E R E N.C E S
H . C . V o l k , " L a m e l l a r Compounds o f N o n - C r a n h i t i z e d p e t r o l e u m Coke", \{ADD Tech . 3 e p o r t 6 1 - 7 2 , Vol . X X V , ( A u ~ u s t , 1 9 6 3 ) .
T . N o d a , " G r a p h i t i z a t i o n o f C a r b o n u n d e r Hiqh P r e s s u r e " , P a p e r resented a t E i v h t B i e n n i a l C o n f e r e n c e o n C a r b o n , J u n e 1 9 - 2 3 , 1 9 6 7 , B u f f a l o , N. Y.
R . C . B r a s t e d ( e d . ) , C o m n r e h e n s i v e I n o r g a n i c C h e m i s t r y , V o l . 8 , D . Van B o s t r a n d Co., L n c . , P r i n c e t o n , X , J . , 1 9 6 1 , p-29 .
S . I l r o z o w s k i , " Y e c h a n i c a l S t r e n p t h , T h e r m a l E x n a n s i o n a n d S t r u c t u r e o f C o k e s a n d C a r b o n " , P r o c e e d i n g s o f t h e F i r s t a n d S e c o n d C o n f e r - e n c e s o n C a r b o n , U n l v . o f B u f f a l o ( 1 9 5 6 ) p - 3 1 .

8 7 .
-re 1,
I 1
AL%O - -0.5 - -1.0 -
1
1400 1800 2200 2600 Temperature," C
Fipure 2.
2x)
1.5 1.0
AWO -0.5 -1x) -1 .5
DYNAMIC ELONGATION OF A PETROLEUM COKE (RATE l$Clmin
1 4 0 0 1 8 0 0 2200 2600 Temperature "C
F i g u r e
S 8 .
- 3 . EVOLUTION OF SULFUR AND DYNAMIC ELONGATION OF PETROLEUM
COKE VS. TEMPERATURE - 100 90 0 - DYNAMIC ELONGATION-
1400 1800 2 2 0 0 2400 Temperature "C
F i z u r e 4 . DYNAMIC ELONGATION OF PETROLEUM COKE AT CONSTANT TEMP.
(Held at 1400% 35 hts, then to 2900tGll4f3n)
I I I I I I I I
1400 1800 2200 2600 Temperature * G

Fivure 5.
89.
3
n
\
2a 27 26 25 24 Degrees 2 8
Figure 6 . PORE SIZE DISTRIBUTION IN PETROLEUM COKE HEATED TO VARIOUS TEMPERATURE
0.20 - - - 16OO0C
U U r- 0
- - .- c .lo -
c Q, -
- 2 140O0C - -
0.00 1 0 1 .o OJO
Pore Dia.(Microns)
\
90.
Figure 8.
-1.0 - r \
!
-3.0
-4.0
-
-
-5.0 -
I I I I I I 1 I 1
1400 1800 2200 2600 Temperature, "C
6 ii
0 SQ
HE THERMAL STAB1 LITY OF SULFUR IN PETROLEUM COKE )IC)..,
0 - NO ADDITIVE ' Idpph Fe203 90
1400 1800 2200 2600 - lemperature C
i r

91.
Fimre 9. BEHAVIOR OF IRON OXIDE I N CARBON BODY ON HEATING
I I I I I I I I I I I 1000 1400 1800 2200 2600
Temperature O C
Figure 10. DYNAMIC F LONGATION OF A PETROLEUM COKE CONTAINING NazC03 - -
-
-
1400 1800 2200 2600 Temperature O C
9 2 .
1.0
0.5
-
-
-
- I - .-SULFUR EVOLUTION
m- ELECT. RESISTIVITY -
-
- - -
0 1 1 I A
25 6 P-
x c
20.: L 0
15 >;
10 .Y
4- .- > .- c v)
a, &
- 5 t; - Q) UJ

'\
I ,
93.
~ l ~ u r e 13. D-SPACING AND CRYSTALLITE GROWTH IN COKE HEATED AT 1400°C
3.48 100 - -
- 75 0- D-SPACING .-CRYSTALLITE GROWTH
- 5 o L c , A
- 2 5
1 I I
1 2 3 Holding Time, Hrs.
I
94.
"GRAFOIL" GRAPHITE TAPE - ITS MANUFACTURE. PROPERTIES AND USES
Joseph F. Revi lock
Union Carbide C o r p o r a t i o n , Carbon Products D i v i s i o n , N e w York, N . y .
S W R Y
This paper w i l l d e s c r i b e a new form o f g r a p h i t e - GRAFOIL g r a p h i t e t a p e , paper- l i k e i n s t r u c t u r e and h a v i n g unusual p r o p e r t i e s i n c l u d i n g a h igh degree pf f l e x i b i l i t y and c o m p r e s s i b i l i t y . The paper w i l l d i s c u s s b r i e f l y t h e manufacture o f GRAFOIL tape p r o d u c t s , t h e i r p r o p e r t i e s and t h e i r u s e s i n r e s e a r c h and development and i n chemica l and o t h e r i n d u s t r i a l a p p l i c a t i o n s .
MANUFACTURE
GRAFOIL is Union C a r b i d e ' s t r a d e mark for g r a p h i t e t a p e which is made up o f i n t e r l o c k i n g and s e l f - a d h e r i n g g r a p h i t e p a r t i c l e s . a g e n t s such as a d h e s i v e s , r e s i n s o r rubber compounds. The p a r t i c l e s and t h e l a y e r s which give t h e t a p e a laminar s t r u c t u r e through i t s t h i c k n e s s are h e l d t o g e t h e r by Van d e r Waal f o r c e s . GRAFOIL g r a p h i t e t a p e is manufactured by a p a t e n t e d process i n which g r a p h i t e p a r t i c l e s are r o l l e d i n t o s h e e t s .005 or .010 i n c h e s i n t h i c k n e s s . These 5 and 10 m i l t h i c k t a p e s are f l e x i b l e as can b e seen by t h e s p i r a l i n F i g u r e I. The normal d e n s i t y o f t h e t a p e i s 70-75 pounds per c u b i c f o o t , and by v a r y i n g t h e r o l l i n g p r e s s u r e , t h e d e n s i t y of t h e t a p e can be c o n t r o l l e d down t o 12 pounds p e r c u b i c f o o t .
From t h e s e b a s i c g r a p h i t e t a p e forms, GRAFOIL lamina tes (F igure I) are made by cementing l a y e r s o f t a p e t o g e t h e r w i t h a r e s i n cement which is then carbonized w h i l e t h e laminate is h e l d under p r e s s u r e . As t h e t h i c k n e s s o f t h e s e lamina tes i n c r e a s e , t h e f l e x i b i l i t y c h a r a c t e r i s t i c o f t h e GRAFOIL t a p e d e c r e a s e s . However, t h e y are s t i l l f l e x i b l e compared t o s o l i d g r a p h i t e and they are s t i l l compressible .
Two o t h e r forms of GRAFOIL t a p e i l l u s t r a t e d i n F igure I are foam and molded forms, made by compressing g r a p h i t e p a r t i c l e s i n a mold under p r e s s u r e . is s t r i c t l y a p a r t i c l e s u r f a c e phenomenom, no bonding a g e n t s be ing used. materials are l i g h t , h a v i n g a d e n s i t y i n t h e range of 3 t o 6 pounds p e r c u b i c f o o t , whereas t h e molded m a t e r i a l s have d e n s i t i e s i n t h e range o f 70 t o 100 pounds p e r c u b i c foot, depending on t h e i r c o n f i g u r a t i o n and end use .
The t a p e c o n t a i n s no bonding
Again the bond Foam
PROPERTIES
The p h y s i c a l p r o p e r t i e s of GRAFOIL t a p e are shown i n Table I . A s can be seen from t h e d a t a , GRAFOIL t a p e h a s a r e l a t i v e l y h igh t e n s i l e s t r e n g t h f o r g r a p h i t e m a t e r i a l . Compressive s t r e n g t h i s more than adequate f o r most a p p l i c a t i o n s . The low p e r m e a b i l i t y of GRAFOIL t a p e is shown by i t s hel ium admi t tance o f 2 x s q . cm./sec. , which is comparable t o t h a t o f c a s t b r a s s . g r a p h i t e s have a d m i t t a n c e s of lo2 t o l o 3 sq. cm./sec. , w h i l e premium g r a p h i t e s have he l ium admi t tances i n t h e r a n g e o f 10-2 sq. cm./sec.)
(Convent ional ex t ruded

95.
, TABLE I
PROPERTIES OF "GRAFOIL" TAPE
Property Approximate Value
I
i
,
Bulk Density (lb./cu.ft.) 60-80
Ash Content (Weight X ) 0.1
Melting Point
Tensile strength (surface plane or ''a" direct ion) (lb . /sq/ in. )
Does not melt; sublimes at 6600°F
1500-2500
Elastic Modulus, Tensile (lo6 lb./sq.in.)
Helium Admittance: 0.005 in. thick foil (sq. cm./sec.) 2 10-4 laminated bodies (sq. cm./sec .) 5 10-5
0.2
15,000 Ultimate Compressive Strength (lb ./sq. in.)
Coefficient of Friction (against stainless steel 0.05 9 8 lb/sq.Cn.)
The material is very anisotropic and this is shown by the directional nature of the electrical resistances. which are given in Table 11. In this respect, GRAFOIL material is similar to pyrolytic graphite.
Table 11.
ELECTRICAL RESISTANCE OF ~~GRAPOIL" TAPE
- Form Surface Plane or Across Surface Plane 'Ratio to "all <la" Direction or "c" Direction WC"
Direct ion
Tape .00046 ohm-cm 70 ohm-cm 150.000
Laminate .0008 " 0.4 500
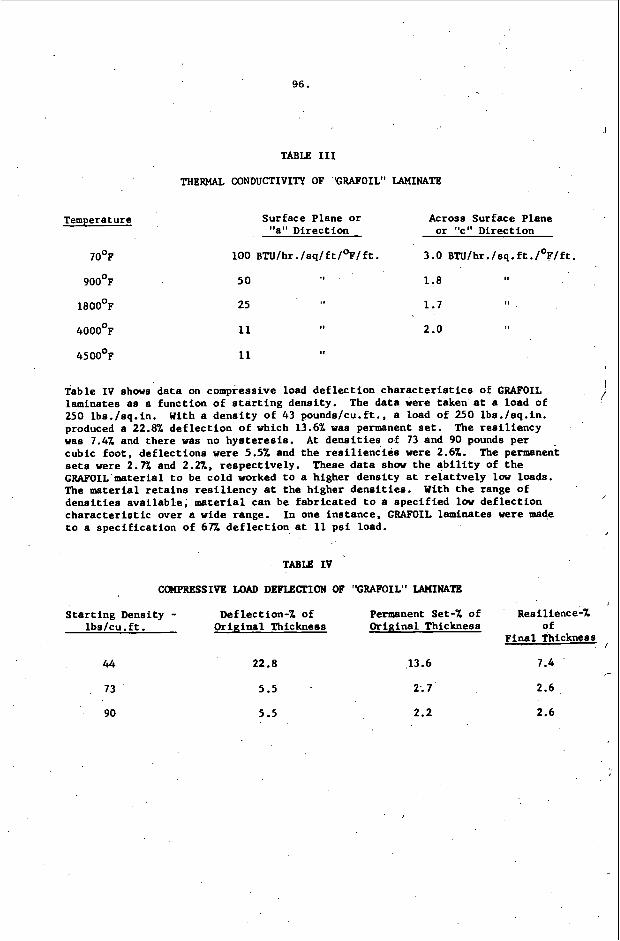
fie thermal conductivity of GRAFOIL graphite tape in the surface plane or direction is similar to that of most graphite materials in that it decreases with increasing temperature. Table 111 ehows thermal conductivities at various temperatures for a GRAPOIL graphite tape laminate with a density of 70 lbs/cu.ft.
"a"
96.
TABLE 111
THERMAL CONDUCTIVITY OF 'GRAFOIL" LAMINAl'Jl
Temperature Sur face P lane o r Across Sur face Plane o r "c" Di rec t ion 11 , I a D i r e c t i o n
70°F 100 BTU/hr . / sq / f t /OF/f t . 3.0 BTU/hr . /sq.f t . /OF/f t .
900°F 5 0 I 1.8 I t
1800°F 25 1.7 I,
II 2 .o 4000°F 11 I
4500°F 11 I t
I
/ Table I V shows d a t a on compress ive load d e f l e c t i o n c h a r a c t e r i s t i c s of GRAFOIL lamina tes a s a func t ion o f s t a r t i n g d e n s i t y . 250 lbs . / sq . in . produced a 22.8% d e f l e c t i o n o f which 13.6% was permanent set. was 7.4% and t h e r e w a s no h y s t e r e s i s . cub ic f o o t , d e f l e c t i o n s were 5.5% and t h e r e s i l i e n c i e s were 2.6%. s e t s v e r e 2.7% and 2.27.. r e s p e c t i v e l y . GRAFOIL meterial t o be c o l d worked t o a h ighe r d e n s i t y a t r e l a t f v e l y l o w loads . The m a t e r i a l r e t a i n s r e s i l i e n c y at t h e h ighe r d e n s i t i e s . d e n s i t i e s a v a i l a b l e , material can be f a b r i c a t e d t o a s p e c i f i e d low d e f l e c t i o n c h a r a c t e r i s t i c Over a wide range . t o a s p e c i f i c a t i o n of 67% d e f l e c t i o n at 11 p s i load.
The d a t a were taken a t a load of With a d e n s i t y o f 43 pounds /cu . f t . , a load of 250 l b s . / sq . in .
The r e s i l i e n c y A t d e n s i t i e s o f 73 and 90 pounds pe r
These d a t a show t h e a b i l i t y of t h e The permanent
With t h e range o f , I n one i n s t a n c e , GRAFOIL lamina tes were made
TABLE IV
C(MPRESS1VE LOAD DEFLECIXON OF "GRAFOIL" LAliINATB
S t a r t i n g Densi ty - D e f l e c t i o n - % of Permanent Set-% o f 1 b s l c u . f t . O r i g i n a l Thickness O r i g i n a l Thickness
44 22.8
73 5.5
-13.6
2; 7
Reef l ience-% of
F i n a l Thickness
1.4
2.6
2.6
I -
90 5.5 2.2

97.
I, \
',
\\
1
I I
A s GRAFOIL g r a p h i t e t a p e is a l l g r a p h i t e wi thout any b i n d e r s , its c o r r o s i o n and tempera ture r e s i s t a n c e are t h o s e of g r a p h i t e . from t h o s e o f c ryogenic l i q u i d s , such as l i q u i d oxygen, t o t h o s e o f molten meta ls , such as molten aluminum and steel . o t h e r t h a n t h o s e o f a h i g h l y o x i d i z i n g n a t u r e , such as air above 740°F, h o t c o n c e n t r a t e d n i t r i c a c i d and hot w e t c h l o r i n e . t h e material has been used at tempera tures up t o 30OO0C. T a b l e V is a b r i e f list o f c o r r o s i v e s t o which GRAFOIL materials are r e s i s t a n t . The c o r r o s i o n r e s i s t a n c e a t h i g h e r tempera tures is i l l u s t r a t e d by t h e r e f e r e n c e s t o mol ten c a u s t i c , high p r e s s u r e steam and molten aluminum.
I t c a n b e used a t tempera tures
It c a n b e used i n any chemical environments
I n n e u t r a l and reducing atmospheres ,
TABLE V
CORROSION RESISTANCE OF "GRAFOIL" MATERIAL
Conc . Hydrochlor ic Acid S u l f u r i c Acid Phosphoric Acid Hydrof luor ic Acid N i t r i c Acid C a u s t i c Soda A 1 uminum Steam C h l o r i n a t e d Organics Organic Alcohols Organic Esters Benzene A i r
APPLICATIONS
A 1 1 To 95%
A l l A 1 1
To 6OX A 1 1 - -
A1 1 A l l A 1 1 A l l -
A 1 1 300°F A 1 1 A 1 1
7 0% 75 O°F
135Oop 1000°F .A1 1 A l l A 1 1 A l l 740°F
Corros ion and tempera ture r e s i s t a n c e combined w i t h their r e s i l i e n c e and c o m p r e s s i b i l i t y make GRAFOIL materials o u t s t a n d i n g as g a s k e t s f o r f l a n g e j o i n t s and as packings f o r seals i n r o t a t i n g and r e c i p r o c a t i n g equipment. S p i c a 1 g a s k e t s and packings are s h a m i n F i g u r e 11. GRAFOIL t a p e ' s s e a l i n g c h a r a c t e r i s t i c s are similar t o t h o s e o f r u b b e r - l i k e materials. N e i t h e r c o l d f low nor c r e e p are exper ienced w i t h t h e material and no s p e c i a l f l a n g e face c o n d i t i o n s are r e q u i r e d . T a b l e VI shows a p p l i c a t i o n s i n which GRAFOIL g a s k e t s g i v e e x c e l l e n t s e r v i c e .

98
TABLE V I
'GRAFOIL" GASKET APPLICATIONS
Chemica 1 Env i r o n s e n t Temperature-OF
Molten Aluminum 1350 Molten P o l y e s t e r Res i n s 600 Dowtherm 660 Anhydrous Hydrogen F l u o r i d e 660 Molten Caus t ic 650 Anhydrous Hydrogen Chlor ide 1000 Steam 490 Hydrogen Chlor ide ;Chlor ine ; Organics 100 C h l o r i n e p l u s Organics 650 Ti tan ium T e t r a c h l o r i d e 1800 C h l o r i n a t e d Hydrocarbons 212
Pressure-Lbs/Sq.In.
5000 6000
80 5 0 25
Atmospheric 600 ,
25 10 10
200
Of even g r e a t e r importance t o t h e Chemical Process I n d u s t r i e s is t h e u s e of GRAFOIL packings i n pumps, v a l v e s , mixers , e t c . To t a k e advantage of t h e m a t e r i a l ' s d i r e c t i o n a l thermal c o n d u c t i v i t y , t h e packing is f a b r i c a t e d w i t h t h e h i g h 'a" d i r e c t i o n thermal c o n d u c t i v i t y p e r p e n d i c u l a r t o t h e s h a f t s o t h a t f r i c t i o n a l h e a t developed i n t h e s t u f f i n g box is t r a n s m i t t e d r a p i d l y away from t h e s h a f t , p revent ing o v e r h e a t i n g and p o s s i b l e impairment o f t h e s t r e n g t h and c o r r o s i o n r e s i s t a n c e o f t h e s h a f t . Conversely i f t h e s t u f f i n g box must b e hea ted , GRAFOIL packing w i l l r a p i d l y conduct t h e h e a t throughout t h e bok. A s t h e r e are no b i n d e r s or a d d i t i v e s i n GRAFOIL packing , thermal breakdown, chemica l a t t a c k , l e a c h i n g o r squeezing o u t of a d d i t i v e s commonly used i n o t h e r t y p e s of packings can not degrade performance. GRAFOIL packing is s e l f - l u b r i c a t i n g , has a low c o e f f i c i e n t of f r i c t i o n and p r e v e n t s s h a f t , s t e m o r p lunger s c o r i n g .
F i g u r e I I I l l l u s t r a t e s equipment i n which GRAFOIL packing is g i v i n g ex tened packing l i f e wi thout s h a f t damage i n a wide v a r i e t y of c o r r o s i v e environments . Table V I 1 l i s ts some o f t h e r e s u l t s o b t a i n e d i n commercial i n s t a l l a t i o n s of GRAFOIL packing.
TABLE VI1
"GRAFOIL ' PACKING APPLICATIONS
Equipment Corros ive Temp. -OF P r e s s u r e - l b l s q . i n .
Plunger Pump Acid Water 200 1,500
Plunger Pump Organics 70 2,500
C e n t r i f u g a l Pump Organics 100 80
50
Comments
L i f e up 50 times. No s c o r i n g .
L i f e up 10 times. No l u b r i c a t i o n requi red . 1
Out-performed mechanical seal; leak- f r e e o p e r a t i o n
L i f e up 12 t i m e s . No s c o r i n g .
<

Equipment
Centrifugal P u p
Control Valve
Control Valve
Pressure Control Valve
/
99.
TABLE VI1 (Continued)
"GRAFOIL" PACKING APPLICATIONS
Corrosive Temp. -OF Pressure-lb/sq.in. Connnents
Mobiltherm-600 400
Chlorinated 35 0 Organics
50 No leakage after 6 months.
100 Life up 9 times. No scoring.
Dovtherm 660 80: Life 'up 4 times.
Steam 490 600 Life up 3 times.
Other uses of GRAFOIL tape take advantage of its flexibility together vith its electrical conductivity, its chemical inertness and its low thermal conductivity in the "c" direction at extremely high temperatures. Thin film batteries designed for high power outputs use GRAFOIL tape as internal conductors and anodes. GRAFOIL is an excellent separator in multiple hot pressing of refractory metal compounds and ceramic items since its laminar codstruction allows easy separation of adjacent pressed parts.
The low "c" direction thermal conductivity and dimensional stability at extremely high temperatures of GRAFOSL materials are being put t o use in insulating barriers used in missiles, nuclear reactors, and high temperature vacuum furnaces. GRAFOIL tapes cut into narrow strips are used as electric resistance heating elements. Research and development laboratories throughout the country stock GRAE'OIL tape for uae in high temperature experimental work.
In conclusion, GRAFOIL tape is a unique form of graphite. Properties such as directional thermal and electrical conductivities, excellent corrosion resistance, low permeability and temperature stability are available in a thin, flexible, compressible, easily fabricated form for a vide range of demanding chemical, metallurgical, nuclear and aerospace uses.

LAMINATE
FIGURE I
FOAM
-
MOLDED RING

101.
FIGURE II
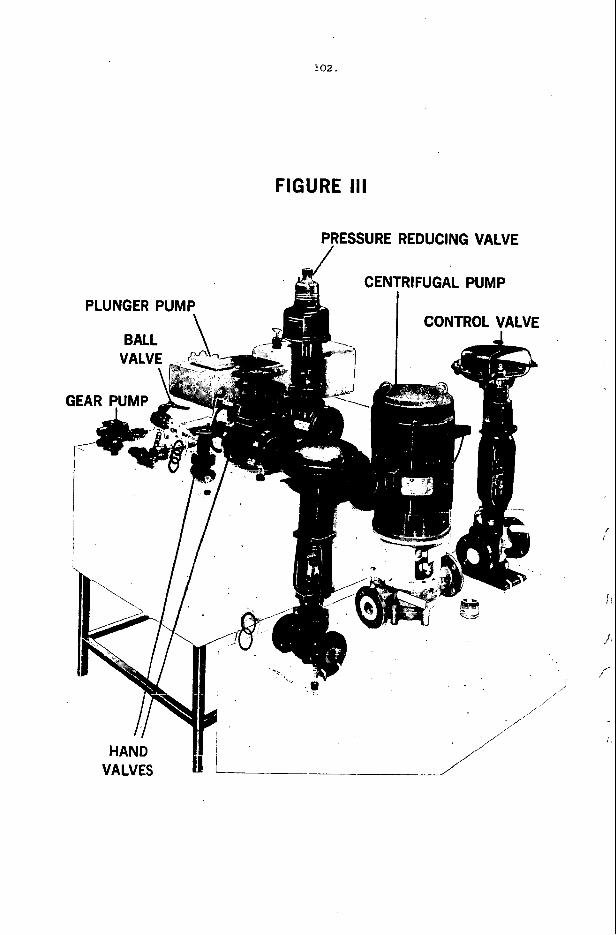
102.
FIGURE 111
PRESSURE REDUCING VALVE /
HAND VALVES
i

103.
CARBON FOAM - ITS PREPARATION AND PROPERTIES
i
R. A. Mercuri, T. R. Wessendorf, and J. M. Criscione . .
Union Carbide Corporation Carbon Products Division Parma Technical Center
Parma, Ohio 44130
I. INTRODUCTION
Light weight cellular carbons a r e widely used in many industrial and aerospace applications a s high temperature thermal insulators and as structural support materials. Carbide Corporation h a s for many years been engaged in the research and development of carbon foams made by means of the pyrolysis of thermo- setting organic foam precursors. properties of two types of carbon foams, one based on a phenolic foam and the other on a polyurethane foam precursor. By varying the conditions of preparing the precursor foams and also the rate of pyrolysis, a very broad fange of product properties can be obtained.
11. PREPARATION OF CARBON FOAMS
The Carbon Products Division of Union
This paper describes the preparation and
Many factors determine the density and suitability of an organic foam as a carbon precursor; the density of the resins, the temperature and resin balance of the formulation, the molding procedures, and various post curing operations a r e important example 8 .
contains four components: the resin; a surfactant to maintain cell integrity during the foaming process; a foaming aid to obtain a smooth even foaming action starting at low temperatures; and, finally, a catalyst, which is used to initiate the resin polymerization reaction.
'
A typical foam formulation
The organic foam is converted to cellular carbon by heating in a The heating rate depends on both the precursor
If the foam is heated improperly, the struc- controlled environment. thickness and formulation. ture may melt, rupture, o r even explode.
A. PYROLYSIS OF PHENOLIC FOAM
The pyrolysis of the phenolic foam is accomplished in a nonoxi- dizing environment which may be provided by the product gases. r a t e s from l o to 200°C/hour have been employed in t h e pyrolysis of phenolic foams. The rate depends on sample size, density, and the strength require- ments of the products carbon. Fo r example, samples of low density (0. 05 g/cc) phenolic foam with dimensions of 16" x 16" x 2'' may be heated at a rate of 10O0C/hour to 1000°C to effect the conversion to carbon.
Heating
The preferred pyrolysis schedule fo r any starting foam represents a compromise between product yield and properties. When 0.25 g / cc carbon foams were prepared from phenolic foam a t a heating rate which gave a 90 percent yield of crack-free pieces, the compressive strength ranged from 500 to 820 psi. When the heating rate was extended over twice t h a t period of time, the yield of crack-free pieces was increased only slightly but the compressive strength was nearly doubled, to 1000 - 1480 psi. hand, when the original heating rate was doubled, the yield was l e s s than 50 percent acceptable pieces.
On t h e other

104.
The weight and volume changes which occur during pyrolysis vary with the density of the p recu r so r foam. lose 60 percent of their weight and 70 percent of their volume when heated t o 2600°C. The shrinkage is anisotropic to the extent that t h e change in length is usually 3 or 4 percent g rea t e r than the change in diameter. Table I shows the changes in weight and density for high density phenolic foam (0. 25 g/cc) at various temperatures f rom 100" to 2600°C. density indicates t h a t the ma jo r weight and volume losses do not occur at the same temperatures. phenolic foam samples approximately 19" diameter and 7" long; but the t rends have been verified with samples as long as 24". 2000°C and higher a r e averages of at least 30 semi-cylindrical samples 19" diameter and 7" long. than four samples.
The high density phenolic foams
The cyclic behavior of the
Most of the work was done with semi-cylindrical
The resul ts at
The lower temperature studies involved no fewer
TABLE I
Heat Treatment of 0.25 g / cc Phenolic Foam
Temperature Weight Density "C Loss, 70 Change, 70
100 200 300 400 500 600 700 800 900
1000 2000 2200 2400 2600
2.7 5.6
14. 1 26. 8 44.2 50. 0 54.9 54.4 56..0 56. I 60 61. 61 61
- 1.4 .t . 6 - 4.7 - 2.9 -12.8 - 8.2 - 4.2 - 1 .2 - 0.9
0.1 - 3.0 - 1 t 18 t26
The data in Table I are characteristic of phenolic foam over the ent i re range of densit ies; however, low density foam tends to shrink slightly more at treatment tempera tures above 700°C. / I
B. PYROLYSIS OF URETHANE FOA'M
The heat t rea tment of the urethane foams involves a two-step oxida- tion pr ior to pyrolysis in an inert atmosphere. The specific temperature and dwell t ime used in the polymerization-oxidation s tep var ies with the s ize and density of the urethane precursor . Typically, t h e foam is held at 150°C and again at 250°C for 24 hours t o prevent fusion during pyrolysis. and volume changes which occur during pyrolysis t o 1000°C are about 55 and 60 percent respectively. The re is a density increase of about 10 percent for rhe iow density, and 10 percent for the high density carbonized urethane foam.
The weight
Union Carbide has patents ( 2 ) granted and pending which'describe in detail the preparation of organic precursor carbon foam.
,
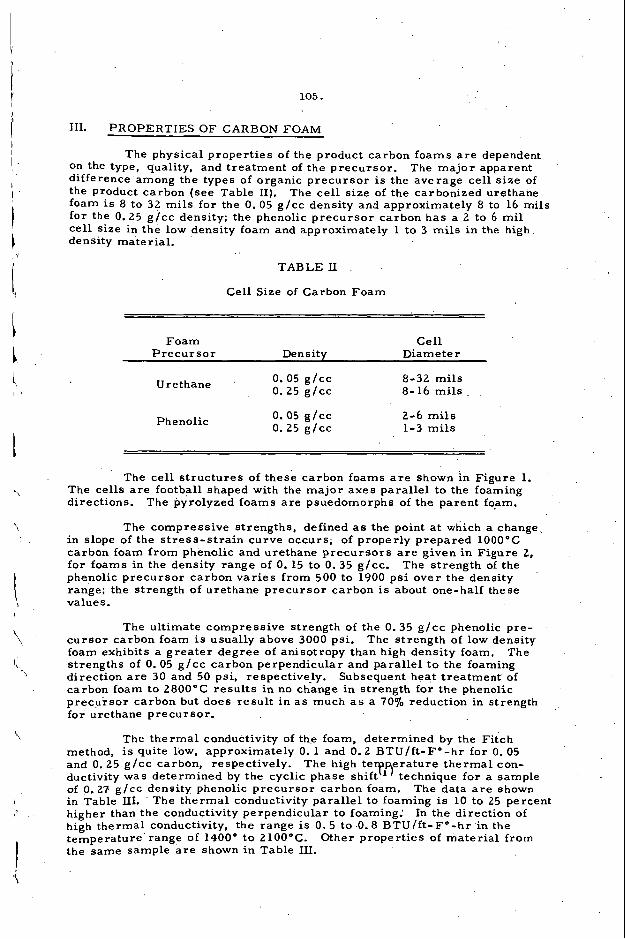
105.
111. PROPERTIES OF CARBON FOAM
I I
I
The physical properties of the product carbon foams a r e dependent on the type, quality, and treatment of the precursor. difference among the types of organic precursor is the average cell size of the product carbon (see Table 11). The cell size of the carbonized urethane foam i s 8 to 32 mils for the 0. 05 g/cc density and approximately 8 to 16 mils for the 0.25 g / cc density; the phenolic precursor carbon has a 2 to 6 mi l cell size in the low density foam and approximately 1 to 3 mi l s i n the high density material.
The major apparent
TABLEII . .
Cell Size of Carbon Foam
Foam Cell P recu r so r Density Diameter
Urethane '
Phenolic
0.05 g / c c 8-32 mils 0.25 g / cc 8-16 mils
0.05 g / c c 0.25 g / c c
2-6 m i l s 1-3 mi l s
The cell s t ructures of these carbon foams a r e shown in Figure 1. The cells a r e football shaped with the major axes parallel to the foaming directions. The pyrolyzed foams a r e psuedomorphs of t h e parent fqam.
The compressive strengths, defined as the point a t which a change^ in slope of the s t ress-s t ra in curve occurs, of properly prepared 1000°C carbon foam from phenolic and urethane precursors a r e given in Figure 2, for foams in the density range of 0. 15 to 0. 35 g/cc. The strength of the phenolic precursor carbon var ies from 500 to 1900 psi over the density range; the strength of urethane precursor carbon is about one-half these values.
The ultimate compressive strength of the 0.35 g / c c phenolic pre- The strength of low density
The cursor carbon foam i s usually above 3000 psi. foam exhibits a greater degree of anisotropy than high density foam. strengths of 0.05 g / cc carbon perpendicular and parallel t o the foaming direction are 30 and 50 psi, respectively. Subsequent heat treatment of carbon foam to 2800°C results in no change in strength for the phenolic precursor carbon but does result in a s much a s a 70% reduction in strength for urethane precursor.
The thermal conductivity of the foam, determined by the Fitch method, is quite low, approximately 0. 1 and 0.2 BTU/ft-F"-hr for 0. 05 and 0.25 g / c c carbon, respectively. The high te e ra tu re thermal con- ductivity was determined by the cyclic phase shiflPP) technique for a sample of 0.27: g/cc density phenolic precursor carbon foam. in Table HI. higher than the conductivity perpendicular to foaming: high thermal conductivity, the range i s 0.5 to 0.8 BTU/ft-F"-hr in the temperature range of 1400" to 2100°C. the same sample a r e shown in Table III.
The data a r e shown
In the direction of The thermal conductivity parallel to foaming is 10 to 25 percent
Other properties of material from
i

106.
TABLE I11
Properties of 0.27 g / cc Phenolic P recu r so r Carbon Foam
Direction Direction Property Perpendicular Paral le l
Density. lb/ft3 0.27 g/cc 0.27 g / c c Compressive Strength, p s i 1,350 2, 150 Shear Strength, p s i 725 570
RT -100°C 0. 18 0.20 1400°C 0.47 0.'53 1800°G 0.45 0.57 210OOC 0.60 0.75
. Thermal Conductivity, BTU/ft-Fa - h r
Of particular interest is t h e high shear strength which demowtrates. that when the material is used as an insulator, it can be firmly bonded to the surface to be insulated.
The permeabili t ies of various carbon foams a r e shown in Table I V
The best commerc ia l grades of graphite with densities in the along with the permeabili t ies of graphite and PC-45 a high density porous carbon. range of 1.6 t o 1.73 g / c c have permeabilities i n the range of 0.5 to 0. 02 Darcy's. The permeability of phenolic carbon foam is in the range of 1.9 to 0.36 Darcy's. roughly a n order of magnitude greater than tha t of graphite; the permeability of the urethane precursor carbon foam is in the range of 22.6 to 71.5 Darcyls. two o r d e r s of magnitude greater than that of graphite. Porous carbon, PC-45, has a porosity almost identical with that of the high density urethane precursor carbon, approximately 22 Darcy's.
TABLE IV
Permeabili ty of Carbon Foam
Precursor Permeability in Darcy's
1000.C Treat g l c c ' to Foam to Foam Material Density, Paral le l Perpendicular
Urethane Urethane
0. 05 71. 5 0.30 24.3
31. 0 22.6
Phenolic 0.08 1.9 1.1 Phenolic 0.30 0.95 0.36
PC-45 1.04 20 20 ATL Graphite 1. 78 0.068 0.064
- In summary. carbon foam is a light weight , high strength mater ia l
which is stable above 2800OC. It may be used as an insulator, filter, o r s t ructural support mater ia l and i s presently available in s izes a s large a s 14" diameter by 18" long.
,f

107.
\
Figure 1
CARBON FOAM 1000°C HEAT-TREAT
The upper row i s phenolic precursor carbons in both directions of 0.05 and 0 .25 g / cc density. precursor carbons.
T h e lower row is corresponding urethane
\

108.
F i g u r e 2
COMPRESSIVE STRENGTH VS. DENSITY FOR CARBON FOAM
2000 I 1 I800
1600
1400
I200
I O 0 0
800
600
400
200
0 0.15 0.20 0.25 0.30 0.35 0.40
I I 1 1 I
DENSITY GMSKC
/ I R e f e r e n c e s
( 1 ) " M e a s u r e m e n t s of T h e r m a l Diffusivi ty and T h e r m a l Conduct iv i ty of G r a p h i t e with C a r b o n A r c I m a g e F u r n a c e , M. R. Nul l and W. W. L o z i e r , 5th T h e r m a l Conduct iv i ty C o n f e r e n c e , Denver , C o l o r a d o , O c t o b e r 20, 1965. r
i i j U. S. P a t e n t 3 , l Z i , 0 5 0 ; E. S. P a t e n t 3 , 3 0 2 , 999; ii. S. P a t e n t 3 , 387, 940.
I ,
i
I'
I
',
I il
\ .
109.
Some Experimental Techniques Used i n Carbon Reaction Studies
L. Kurylko, Stackpole Fellow Combustion Laboratory, The Pennsylvania S ta te University
University Park, Pennsylvania
R. W. Froberg, Research Sc ien t i s t Stackpole Carbon Company, S t . Marys, Pennsylvania
R. H. Essenhigh, Associate Professor Combustion Laboratory, The Pennsylvania S ta te University
University Park, Pennsylvania
1. IRTRODUCTION
Although research on carbon has prol i ferated unbelievably i n the last decade, there a re indications of a growing dichotomy between two somewhat disparate points of V i e w regarding the objectives of t he research. oriented work has tended t o be of the so-called "pure" o r "fundamental" var ie ty , often concentrating on small, very specialized points and u t i l i z i n g many highly- elaborate techniques of an impressive l eve l of sophistication. on the other hand has, of necessity, t o be of an applied nature, and of ten con- t a ins a high component of empiricism. engineering studies. The two respective points of view can he summed up i n the phrases "Know Why" and "Know How."
On the one hand, university-
Indus t r ia l research
These l a t t e r are sometimes referred t o as
It is a truism t o say t ha t t h e Know why ought t o illuminate the Know How, but recently there has been increasing skepticism of t h e par t of some investigators t ha t t h i s i s possible, and in t h i s l i e s the source of the dichotomy. The problem is best seen by way OF an example. for instance, it seemed possible a t one t i m e t h a t i f the energies could be measured for d i f fe ren t carbons under known conditions then the value, o r range of values fo r the d i f fe ren t carbons, was l ike ly , t o imply a par t icu lar mechanism. recent work [ l ] on the adsorption isotherms a t low temperatures have shown the evident existence of a range of possible and overlapping a l te rna te s teps i n the react ion each with its own individual energy. act ivat ion energy not determined by these very precise methods must be only an average with an evident ambiguity of interpretat ion. vhen we consider t h a t , vhen the detai led mechanisms were elucidated, t h i s was by using ul t rapure, highly specialized "research" carbons, such as Spheron 6, whereas indus t r ia l carbons have the additional complexities of d i f fe ren t degrees of graphi- t i za t ion , access ib i l i ty , and reac t iv i ty , of binder and f i l l e r , together with modi- w ing fac tors due t o ash, permeability, porosity, isotropism o r lack of it, e t c . It is, therefore , a very real question whether the "pure" and so-called "engineer- ing" studies r ea l ly have suf f ic ien t i n common t o make attempts at croes-correla- t ions and interpretat ions worthwhile.
In the measurement of ac t iva t ion energies,
However,
Therefore, it would seem tha t any
The problem is then compounded
As we have ourselves been concerned primarily with more "engineering" studies, ve have therefore been somewhat exercised by t h i s very question. ing the description suf f ic ien t ly inrportant t o quarrel about, it docs nevertheless B e e m t o us tha t our s tudies do i n f ac t l i e more o r less between the tw (what might therefore legi t imately be c d l e d technologicd s tudies i f one looka for 8
n a e ) . out conclusions are tha t cross-correlations betveen s tudies 02 di f fe ren t leve ls of iundamentality a re i n fac t possible, i f applied with caution; and also t h a t the unfortunate dichotonly tha t has s ta r ted t o develop Vi11 have t o be closed.
Whilst not find-

1 [
I
110.
The first consideration t o be examined. w a s vhether the lack of interpretat ion i n terms of fundamental mechanisms actual ly mattered.
charcoal burning) without access t o t h e information now being developed. HOvever, t h e last 10 or 20 years has been an increasing sophistication i n carbon manufacture, paralleled by much more varied and extreme uses, vhich has been i t s e l f largely the stimulus for the increased research; and it is clear t h a t we now require a matching sophistication i n knowledge of react ion behavior of actual carbons as manufactured f o r indus t r ia l processes.
After all', the carbon industry has existed qui te successfully f o r decades (centuries i f one includes
Now, when we consider the behavior of indus t r ia l carbons with the attendant complexity of reaction i n rea l s i t u a t i o n s , i t seems t o w t h a t , so long as we can unravel the complexity due t o t h e real s i tuat ion, the only factor l ike ly t o dis turb any mechanistic interpretat ion i s the parameter modification due t o the presence of two o r more components (such as f i l l e r , binder, ash, e tc . ) . k inet ic parameters such as frequency factors , act ivat ion energies and so on will be avereges of some sort; but t h i s does not seem t o be an insuperable objection since all it means is tha t behind the average we measure is some (unknown) s t a t i s t i c a l dis t r ibut ion of the parameter values. be determined by composition and other material properties; and t h e use of an average value does not seem t o be any l e s s relevant than t h e use, for exaaple, of average properties of gasses such as velocity, o r energy, o r temperature. I n the case of carbon studies, t h e more fundamental work may i n time determine t h e statis- t i c a l dis t r ibut ions of t h e relevant parameters due t o variable material camposi- t ions and properties, and t h i s w i l l be of immense assistance in f i l l i n g out any interpretat ion. In t h e meantime, lacking such information, we may legit imately assume ( t i l l proved otherwise) that t h e background dis t r ibut ions a re ra ther narrov, so that any kine t ic constants obtained by experiment are presumed t o be close to u n i q u e - e d therefore mechanistically interpretable--values.
mental determination of these ( s t a t i s t i c a l ) property parameters, and t h i s is primarily a m t t e r of experimental design. applied (engineering) methods of experimentation lack def ini t ion so that there can be considerable uncertainty what property a measured value i s r e a l l y re la ted to- w e n before one e t a r t s t o consider the problem of t h e s t a t i s t i c a l average. act ivat ion energy, for example: it is t r u e t h a t the value measured i s t h e weighted s t a t i s t i c a l average of all possible adsorption energies; or could it be t h e average of all possible desorption energies? This is typ ica l of t h e type of ambiguity that can ar ise .
Bere it i s t r u e that
Any such s t a t i s t i c a l dis t r ibut ion lust i t s e l f I
1
To us, t h e more important problem at t h i s stage is the unambiguoue experi-
The problem is that many of t h e more
1 The
TO eliminate such ambiguities requires good experimental design, and t h i s i s j o i n t l y a matter of technique and of instrumentation. Recently we described a technique, with acme brief out l ine of the instrumentation t h a t we were able t o shov did eliminate much ambiguity [2]. I n t h i s paper our purpose is t o re-sum- marize t h e technique ( f o r completeness) and to amplifp t h e information on t h e instrumentation i n the be l ie f that t h i s mey-be of value t o those concerned with t h e more precise, unamiriguoua "engineering" ~ d i i e s measured on such a basis that t h e r e i s some hope of applying a val id mechanistic interpretat ion. This is not t o s8y t h a t we think t h i s i s the only technique able to develop k ine t ic information on t h e basis required, but w e believe it t o be t h e most f u l l y developed so far. s t a r t closing the gap between t h e "fundamental" and "engineering" s tudies on carbon reactions, 80 that the l a t t e r are a6 val id as the former f o r obtaining kinet ic data and mechanistic interpretat ions of behavior.
J
kine t ic constants, but still
The point we are making is t h a t the time has come t o
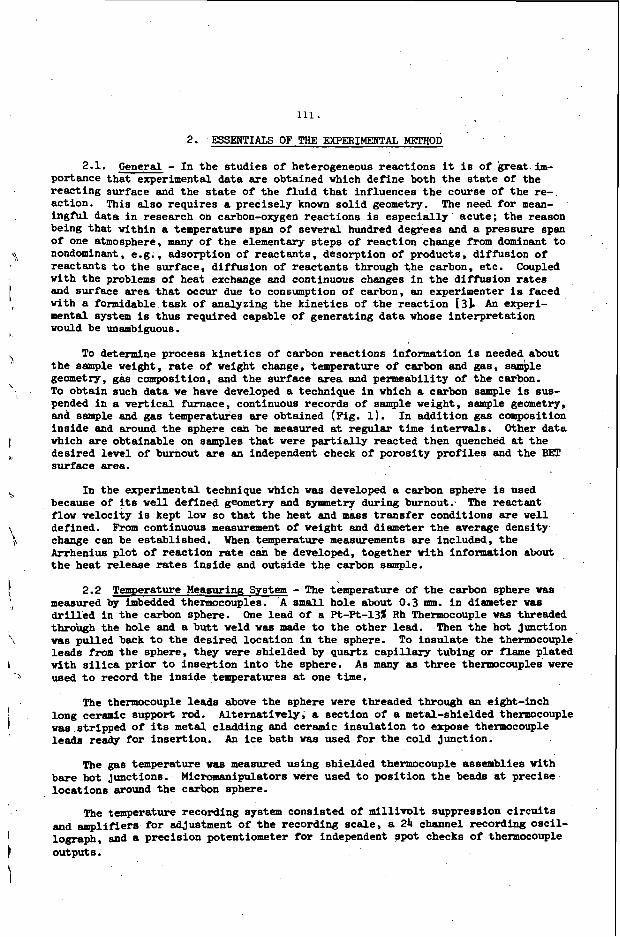
B
t n
\
I I ,
\ P
\
L ‘h
111.
2. ESSENTIALS OF THE EXPERIMENTAL METHOD
2.1. General - In the s tudies of heterogeneous react ions it i s of great im- portance that experimental data a re obtained which define both the s t a t e of the reacting surface and the s t a t e of the f lu id tha t influences t h e course of the re- action. The need for mean- ingful data i n research on carbon-oxygen reactions i s especial ly scu te ; t h e reason being that within a temperature span of several hundred degrees and a pressure span Of One atmosphere, many of the elementary s teps of reaction change from dominant t o nondominant, e.g., adsorption of reactants , desorption of products, diffusion of reactants t o the surface, diffusion of reactants through the carbon, e tc . Coupled wi th the problems of heat exchange and continuous changes i n t h e diffusion r a t e s and surface area tha t occur due t o consumption of carbon, an experimenter is faced with a formidable task of analyzing the k ine t ics of the reaction [3l. An experi- mental system is thus required capable of generating data whose interpretat ion vould be unambiguous.
the sample veight, r a t e of weight change, temperature of carbon and gas, sa&le geometry, gas composition, and t he surface area and permeability of t he carbon. To obtain such data we have developed a technique i n which a carbon sample i s sus- pended i n a ve r t i ca l furnace, continuous records of sample weight, sample geometry, and sample and gas temperatures a re obtained (Fig. 1). In addition gas composition inside and around t he sphere can be measured at regular t h e in te rva ls . Other data vhich a re obtainable on samples tha t were p a r t i a l l y reacted then quenched at t he desired level of burnout are an independent check of porosity prof i les and t h e BET surface area.
This a lso requires a precisely knovn so l id geometry.
To determine process kinet ics of carbon reactions information is needed about
In t h e experimental technique which ya8 developed a carbon sphere i s used because of its v e l l defined geometry and symmetry during burnout. f lov velocity i s kept low so that the heat and maas t r ans fe r conditions a re v e l l defined. From continuous measurement of weight and diameter t he average density change can be established. Arrheniua plot of reaction rate can be developed, together with information about t he heat release rates inside and outside t h e carbon sample.
The reactant
When temperature measurements a re included, t he
2.2 Temperature Measuring System - The temperature of t h e carbon sphere was memured by imbedded thermocouples. d r i l l ed in t h e carbon sphere. through t h e hole and a butt weld VM made t o the other lead. vas pulled beck t o the desired location in t he sphere. To insulate t he thermocouple leads from the sphere, they were shielded by quartz capi l la ry tubing o r flame plated with s i l i c a pr ior t o inser t ion in to the sphere. As many as t h ree thenwcouples were used t o record t h e inside temperatures at one time.
A small hole about 0.3 mm. i n diameter wae One lead of a Pt-Pt-13b Rh Themocouple was threaded
Then the hot junction
The thermocouple leads above the sphere were threaded through an eight-inch long ceranic support rod. vas stripped of its m e t a l cladding and ceramic insulat ion t o expose thermocouple le&s ready fo r insertion.
Alternatively, a section of a metal-shielded thermocouple
An i ce bath w a s used for t he cold junction.
The gas temperature vas measured using shielded thermocouple assemblies with Micromanipulators were used t o posi t ion t h e beads a t precise
The temperature recording system consisted of mil l ivo l t suppression c i r cu i t s
bare hot junctions. locations around the carbon sphere.
and w l i f i e r s for sdjustment of t he recording scale , a 24 channel recording osci l - lograph, and a precision potentiometer fo r independent ppot checks of thermocouple outputs.

112 I
2.3. The Weighing System - The weighing of t h e carbon sphere w a s made using a conventional analyt ical balance with an automatic recording attachment. A continu- ous record of t h e sample weight was obtained e i t h e r on a potentiometric recorder o r using one of the channels i n t h e recording oscillograph. Typical reduced records of weight loss and temperature measurements a re shown i n Figure 2.
In the base of the balance a hole w a s d r i l l e d t o receive a ceramic rod t h a t w a s connected t o one of t he balance pans. A t t h e other end of t h e ceramic rod was a s m a l l platinum wire loop t o which t h e ceramic rod with t h e thermocouples and the carbon sphere was connected. The carbon sphere w a s thus suspended from the balance on two ceramic rods connected by hooks w.d loops. This arrangement permitted easy disconnection of t h e thermocouple assembly from t h e balance and allowed the furnace t o be moved f o r inser t ion of a new t e s t sample.
Pr ior t o each run t h e t e s t samples were weighed on an analyt ical balance t o determine the exact or ig ina l weight. balance, a cal ibrat ion run w a s made t o simulate weight changes tha t would occur during sample burnout by adding weights t o t h e proper pan.
Also with t h e cold sample suspended from the
2.4. The Sample Size Measuring System - The diameter of t h e carbon sphere was measured with a micrometer p r i o r t o placing of thermocouples i n the sphere. t h e inser t ion of t h e sphere i n t h e furnace and i ts suspension from t h e balance, the s i z e changes would be measured opt ical ly . constructed through which one could measure the sphere visual ly or obtain a photo- graph a t desired time in t e rva l s . Figure 1 shows t h e schematic of t h e s i ze measuring system. Above the top of t h e furnace we have a 45' mirror which sends a projected l i g h t source through a t ransparent watch g l a s s (with a hole t o allow t h e ceramic rod t o connect t o t h e rod from t h e balance). furnace tube exi t ing through a quartz window a t t h e bottom of t h e f'urnace. A second 45' mirror connected t o a movable telescope def lec ts t h e l i g h t through an iris diaphram and focusing eye piece t o a ground g la s s screen. A f t e r focusing, t h e ground g la s s screen was normally removed and a camera inser ted i n i t s place.
After
To do t h i s a telescope-projector was
The l i g h t passes v e r t i c a l l y through the
When t h e temperature of t h e carbon w a s l e s s than about 800°c,a 1500 joule flash w a s used t o project t h e shadow of t h e sphere onto t h e film. A t higher temperatures t h e radiat ion intensi ty from t h e carbon sphere w a s suf f ic ien t f o r self-recording of t he sphere image on ASA 125 fi lm. A n e l e c t r i c sequential timing svi tch w a s used t o t r i g g e r t h e f lash gun, camera, and a timing mark on t h e oscillograph. During a normal run t h e sphere w a s photographed about s i x t y times at X 8 magnification.
2.5. The hvnace and G a s Feeding System - The e l e c t r i c a l furnace contained a v e r t i c a l tube vhich w a s t w o ( 2 ) inches i n diameter by eighteen (18) inches long. The hot zone of nearly uniform temperature w a s about twelve (12) inches long located i n t h e center of t he furnace. On t h e bottom of t h e furnace was a water cooled brass cap containing various gas i n l e t por t s and a quartz window i n t h e center. thermocouple extended through t h e brass cap t o measure gas temperatures below t h e suspended carbon sphere. The furnace temperature-control thermocouple was located behind t h e heating elements. A proportional band control ler w a s used t o keep the P n m c e tempereture constant; transparent glass l i d . w e l l as the carbon suoport rod t o pass through.
One
The top of t h e furnace w a s covered by a loose-fitting A hole w a s d r i l l e d i n t h e l i d t o allow thermocouples as
The gasses were nomal ly passed through molecular sieves and Drierite columns before being aetered through rotameters Rnd passed t o the furnace. gas entering t h e rotameters vas a l so monitored.
The pressure of
3.6. I . E . c q i l k r y s t e e l tcSe wos at t iched t o t h e thermocouple assembly and suspended froui t h e balance together w i t h t he carbon b a l l .
Cas Sampling - A gas samnling system w a s developed i n which a 0.1 ~III.
i I
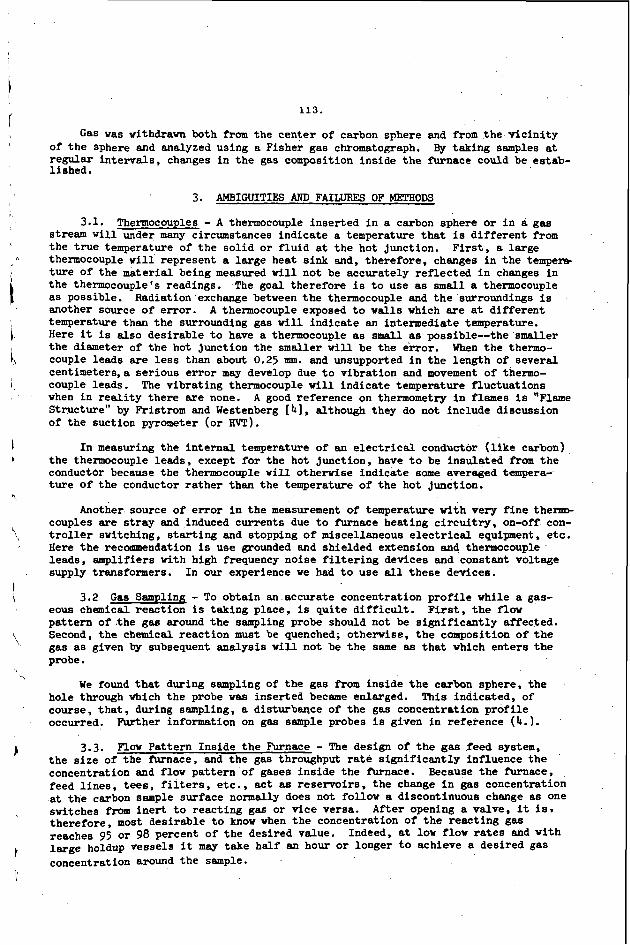
113.
Gas was withdrawn both from the center of carbon sphere and from the v i c in i ty By taking samples a t of the sphere and analyzed using a Fisher gas chromatograph.
regular intervals , changes i n the gas composition inside the furnace could be estab- lished.
3. AMBIGUITIES AM) FAILURES OF METHODS
3.1. Thermocouples - A thermocouple inser ted i n a carbon sphere or i n a gas stream w i l l under many circumstances indicate a temperature t h a t is d i f fe ren t from the t rue temperature of the so l id or f lu id a t the hot junction. thermocouple w i l l represent a la rge heat sink and, therefore , changes i n the tempela ture of the material being measured w i l l not be accurately re f lec ted i n changes i n the thermocouple's readings. The goal therefore is t o use as small a thermocouple as possible. another source of e r ror . temperature than the surrounding gas will indicate an intermediate temperature. Here it is a l so desirable t o have a thermocouple as small as possible--the smaller t he diameter of the hot junction the smaller will be t h e error . couple leads are l e s s than about 0.25 mm. and unsupported i n t h e length of several centimeters,a ser ious e r ror may develop due t o vibrat ion and movement of thermo- couple leads. The vibrat ing thermocouple w i l l indicate temperature f luctuat ions when i n r ea l i t y there a re none. Structure" by F'ristrom and Westenberg [4], although they do not include discussion of the suction pyrometer (or HW).
F i r s t , a large
Radiation'exchange between t h e thermocouple and t he surroundings i s A thermocouple exposed t o walls which are at d i f fe ren t
When the thermo-
A good reference on thermometry i n flames is "Flame
In measuring the in t e rna l temperature of an e l e c t r i c a l conductor ( l i k e carbon) the thermocouple leads, except for the hot junction, have t o be insulated from t he conductor because t h e thennocouple will otherwise indicate some averaged tempera- t u re of the conductor ra ther than the temperature of the hot junction.
Another source of er ror i n t he measurement of temperature with very f i n e thenm- couples are s t r ay and induced currents due t o furnace heating c i r cu i t ry , on-off con- t r o l l e r switching, s t a r t i ng and stopping of miscellaneous electrical equipment, e tc . Here the recommendation is use grounded and shielded extension and thermocouple leads, amplifiers wi th high frequency noise f i l t e r i n g devices and constant voltage supply transformers. In our experience w e had t o use all these devices.
3.2 G a s Sanmling - To obtain an accurate concentration p ro f i l e while a gas- eous chemical react ion i s taking place, i s qui te d i f f i cu l t . pat tern o f . t h e gas around the sampling probe should not be s ign i f icant ly affected. Second, the chemical react ion must be quenched; otherwise, t he composition o f t h e gas as given by subsequent analysis w i l l not be the same as t h a t which enters the prabe .
F i r s t , t h e flow
We found that during sampling of the gas from inside t h e carbon sphere, the hole through vhich the probe was inserted became enlarged. This indicated, of course, t h a t , during sampling, a disturbance of the gas concentration p ro f i l e occurred. F v t h e r information on gas sample probes i s given i n reference (4.).
3.3. the s i ze of the furnace, and the gas throughput rate s igni f icant ly influence the concentration and flow pat tern of gases inside the furnace. feed l i nes , t ee s , f i l ters, e t c . , ac t as reservoirs , the change i n gas concentration at the carbon sample surface normally does not follow a discontinuous change as one switches from i n e r t t o react ing gas or vice versa. therefore, most desirable t o know when the concentration of the react ing gas reaches 95 or 98 percent of the desired value. l a rge holdup vessels it may take half an hour or longer t o achieve a desired gas
Flow Pattern Inside the Furnace - The design of t he gas feed system,
Because the furnace,
A f t e r opening a valve, it is,
Indeed, a t low flow r a t e s and with
concentration around the sample.

114.
To determine whether t he flow pat tern inside t h e furnace meets t he desired charac te r i s t ics , a plot of logarithm of concentration a t the desired locat ion versus t i m e w i l l indicate e i the r the degree of back mixing, or the extent t o which t h e re- actor approaches plug flow conditions. described, the c loser the reac tor approaches plug flow conditions (Fig. 3) . If the concentration of the gas t o be displaced, (ni t rogen) , approaches an asymptotic con- d i t i on , then there ex i s t s the poss ib i l i t y o f dead-end hold-up storage zones i n the feed system, or of leakage of undesirable gas in to the system.
, The steeper the negative slope on the plot
.
I
4. SOME RECENT RESULTS
During the f ive years t h a t the experimental technique has been i n operation, and in process of gradual improvement, several s ignif icant experimental findings about carbon-oxygen react ions have been obtained. .
F i r s t , the simultaneous measurement of both sample s i ze and weight provided a d i rec t method by which the da t a could be separated in to the three zones of reaction. Thus, it w a s possible t o construct an Arrhenius plot of the r a t e data i n which the three major zones could be ident i f ied . the t rue sample temperature (not the furnace or gas temperature) which w a s measured by thermocouples within the carbon sphere. No meaningful analysis of t he e f fec t of oxygen concentration on the apparent react ion rate could be made without the sample temperature measurements. It was found t ha t the apparent rate increased with in- creasing oxygen concentration but so did the sample temperature. was t h a t , regardless of t he oxygen concentration, a l l data described a s ingle ra te curve at low temperatures (Zone I ) . reaction w a s zero order.
The Arrhenius plot was constructed using
The net r e su l t
It w a s concluded, therefore , t h a t t he chemical
In the fur ther analysis of t he data a de f in i t e conf l ic t w a s apparent. react ion order was t r u l y zero i n the chemically dominant regime, why'did the tem- perature of the carbon sphere react ing i n oxygen exceed its temperature when re- act ing in a i r ? This conf l i c t was resolved only a f t e r temperature p ro f i l e measure- ments were made of the sphere and of the surrounding gas. change balances were made between the react ing sphere and the surrounding environ- ment using a d i g i t a l computer. heat release for t he carbon-oxygen react ion amounted t o t h a t required t o convert all carbon t o C02 within t h e carbon sphere. t r a t i o n w a s low, such complete burn-up of t he primary reaction product, CO, did not occur within the carbon boundaries; thus the temperature of the carbon reacting in air did not rise t o as high a value a s it did i n pure oxygen.
If the
From these, heat ex-
These calculat ionsgrevealed tha t i n Zone 1 the
But, fo r the case when oxygen concen-
I
In Zones I1 and 111, t h e burn-up of carbon monoxide occurred outs ide the carbon sphere, as substantiated by gas sampling and temperature p ro f i l e measurements and /I
confirmed by heat balance calculat ions. It was also found tha t within a cer ta in carbon porosity range a region of combustion i n s t a b i l i t y exis ted between Zone I1 and Zone I11 during which t h e temperature of carbon osc i l la ted by as much as 70 degrees and with a period of up t o 100 seconds (Fig. 4) .
5. CONCLUSIONS
Temperature, weight and s i z e measurements of reacting carbon spheres can be m a d e simultaneously i n an e l e c t r i c a l l y heated furnace. with gas sampling, surface a rea , and density prof i le determinations, t he progress and process of heterogeneous solid-gas and of subsequent gas phase reactions can be est=blished.
Combining these measurements
!+2&i-e=eiit.s of a tmspher ic conditions gave res-fits revealing the t F G 2

115. , .
order of chemical react ion of carbon with oxygen, allowed the determination of t he depth of penetration of t he reaction zone i n t o carbon, established the presence of an osc i l la tory combustion phenomena, e tc . experimenter w i t h the above techniques a re pointed out.
Problem areas t o be encountered by the
These results show the importance and value of adequate experimental techniques designed t o del iver results whose in te rpre ta t ion w i l l be unambiguous.
i.
2.
3.
4.
REFERENCES
Bansal, R. C . , F. J. Vastola, and P. L. Walker, Paper C130, Eighth Carbon Con- ference, S ta te University of Hew York a t Buffalo, June 19-23, 1967.
Essenhigh, R. H., and R. W. F'roberg, Papers C l l l and C112, Eighth Carbon Con- ference, S ta te University of New York at Buffalo, June 19-23, 1967.
Wicke, E., F i f t h Symposium on Combustion, New York: Reinhold, p. 245, 1955.
Fristrom, R. M. and A. A. Westenberg, Flame Structure, McGraw-Bill, New York, 1965.
ACKNOWLEDCMEATS
This work was carr ied out i n the Combustion Laboratory of the Department of Fuel Science, The Pennsylvania S ta te University, for t he Office of Naval Research under Contract Nom 656-29 whose support is acknowledged. We a lso have pleasure i n acknowledging j o i n t support for the project from t he Stackpole Carbon Company, S t . Marys, Pennsylvania, by provision of Research Fellowships t o the f i rs t t w o authors.

, . 116.
ON THE USE OF PHOSPHATES TO INHIBIT OXIDATION OF INDUSTRIAL CARBONS
Robert W. Froberg
Stackpole Carbon Company, S t . Marys, Pennsylvania 15857
I . INTRODUCTION
The use o f addi t ives t o i n h i b i t t h e oxidation of carbon-graphites has been well-known i n t h e indus t ry f o r many years. t h e use of phosphorus-containing addi t ives was Wicke [l]. f e c t of phosphoryl ch lor ide which was added t o t h e gas phase during oxidation. Others who have examined t h e e f f e c t s of ox ida t ion- inhib i t ing addi t ives include Arthur [2,3], Hadman e t a1 [ 4 ] , Day [SI , and Hedden [6].
Among t h e earliest t o r epor t on He s tudied t h e e f -
The exact mechanism by which phosphates, i n pa r t i cu la r , i n h i b i t t h e oxi- da t ion of carbon is s t i l l a moot question. t h a t both chemical and physical processes a r e involved. That i s , t h e phosphate covers po ten t i a l ly ac t ive sites on t h e carbon sur face both by a s t rongly chemi- sorbed layer (71 and/or a physical b a r r i e r of e i t h e r a glassy or c r y s t a l l i n e na ture as i n t h e case of some oxides [a]. The l a t t e r would appear t o be t h e case i n t h e work reported by Paxton [9].
include t h e chemical composition of t h e impregnant, t h e molar concentration of t he s t a r t i n g solut ion, t h e amount of material f i n a l l y deposited within t h e pore system o f t h e carbon, t h e d i s t r ibu t ion of t h e treatment within t h e car- bon, and the r e a c t i v i t y of t h e o r ig ina l carbon-graphite [lo-131. O f impor- tance a l s o i s t h e Permeabili ty of t he o r ig ina l carbon t o t h e so lu t ion or l iquid used f o r t h e impregnation.
However, it is generally agreed
Factors which determine t h e e f fec t iveness of a given phosphate treatment
The oxidation of un t rea ted carbon a t some temperature is usua l ly expressed as t h e Spec i f i c Reaction Rate [14, 151. That is, weight l o s s pe r u n i t time pe r u n i t area [15]. or apparent surface a r e a of t h e sample [14], t h e B.E.T. or nitrogen adsorption area, o r some f r a c t i o n of t h e t o t a l sur face area [16]. vantages and shortcomings involved i n t h e use of a l l of these [l, 171. r a t e of reac t ion is known t o be dependent upon both chemical and d i f fus iona l mechanisms [MI . temperature below 1800°F may be s t rongly a f fec ted by t h e na ture of t h e carbon i tself . Such va r i ab le s as hea t treatment h i s to ry , impurity content, c rys t a l - l i n i t y , porosi ty , and permeabili ty are a l l inherent proper t ies of t h e sample mater ia l which can, i n f a c t , influence t h e rate of oxidation [14, 17, 191.
The a r e a used t o ca l cu la t e t h e rate may be the geometric
There are c e r t a i n ad- The
In addi t ion , t he rate o f oxidation of an untreated carbon a t
In t h e case of a t r e a t e d material, an addi t iona l set of var iab les (men- t ioned e a r l i e r ) are introduced which a r e concerned with impregnant and its in t e rac t ion with t he bese Eteria l . list given above t o produce the e n t i r e co l l ec t ion of f a c t o r s which may be changed so as t o a f f e c t t h e r e su l t i ng reac t ion r a t e of t r ea t ed carbon with oxygen. many of these q u a n t i t i e s a constant before meaningful da t a may be obtained on t h e react ion.
The work described i n t h i s paper concerns the evaluation of phosphate i m - pregnants for improving t h e oxidation r e s i s t ance of commercial carbon-graphites. Impregnation of t h e carbon may be done by a va r i e ty of methods including molten
m.ere new var iab les are ther? edded t o the
I t is obvious t h a t t he system must be s impl i f ied g rea t ly by making

s a l t s , water-or acid-based so lu t ions , and vapor deposit ion. The technique used t o t r e a t the mater ia ls described was a solut ion impregnation v i a a vacuum- pressure cycle. and discuss some of the fac tors which make these phosphate treatments e f f e c t i v e inh ib i tors of the oxidation of carbon.
The object ive herein i s t o examine the experimental r e s u l t s
11. EXPERIMENTAL
The TGA equipment used i n t h i s work i s shown i n Fig. 1. electrobalance (Cahn RH) mounted above a v e r t i c a l tube furnace. suspended within the furnace, from the balance, on a Mulli te rod and the sample weight is continuously recorded as the material is burned o f f . control i s such t h a t t h e temperature may be var ied with a preselected program o r held constant. held constant a t 1200'F f o r a l l the runs i n order t o minimize t h e var iables described e a r l i e r .
I t is s i m p l y an
The furnace
The sample is
For the purpose of t h i s work, t h e furnace temperature was
The samples were preheated in nitrogen before the oxidizing gas was ad- mitted i n t o the tube furnace. For t h i s work, only a i r was used t o burn the smples . The equipment, however, includes t h e necessary metering system t o feed various oxygen-nitrogen mixtures i n t o the furnace, i f required.
The test d a t a a e reported as the time required f o r ten percent burnoff of the sample under test. With c e r t a i n qua l i f ica t ions , the longer it takes t h e material t o lose t e n percent of its or ig ina l weight, the more e f fec t ive is its oxidation res i s tance (OR).
A l l samples used were i n t h e form of 3/4-inch cubes. With a few excep- t ions , the same base mater ia l was used f o r a l l t e s t s i n order t o minimize t h e var ia t ion of the data due t o the r e a c t i v i t y of the carbon.
111. RESULTS
Table I is a compilation of the primary experimental da ta t o be d i s - cussed i n t h i s paper. p a r t i c u l a r points . The base grades and.treatments are given l e t t e r names be- cause the nature of these mater ia ls is not v i t a l t o following t h e discussion.
Some addi t ional data w i l l be presented l a t e r t o c l a r i f y
TABLE I EXPERIMENTAL RES-R 1200'F IN A I R
Base Grade G 1 G L2 L L L L L Glassy Carbon
Treatment3 None
A None
A B C D E
None
0 Treatment
10.4
. 7.5 4.65 8.2 9 .o
12.6
- -
-
Hours t o 10% Burnoff. 0.08
3.4 54
54 103 106 134 .
36 10.5
1 graphi t ized material, pitch-bonded na tura l graphi te 2 = graphi t ized mater ia l , pitch-bonded lampblack 3 E a l l treatments a r e meta l l ic phosphates
'Average values

118.
IV. DISCUSSION
The data given i n Table I represent average values f o r a number of samples of each material . perimental data is usua l ly about 20 percent. a few d a t a points may be very misleading when one draws conclusions concerning the OR e f fec t iveness of a given treatment and/or mater ia l .
This i s a point worth emphasizing s ince the spread i n ex- Therefore, a re l iance upon only
A. Uniformity of Treatment:
I t is usually not s u f f i c i e n t t o know only how much of a given treatment i s deposited i n t h e carbon (percent pickup), but one should a l s o have some in- formation concerning t h e d i s t r ibu t ion of t he impregnant within the carbon. To exemplify t h i s po in t , d a t a a re presented in Fig. 2 , which resu l ted from suc- cess ive weighing and grinding of a number of t r ea t ed cubes. I t is clear from t h e curves in Fig. 2 t h a t t he loca l concentration of impregnant decreases toward t h e center of t h e cubes. Several reasons f o r t h i s uneven d i s t r i b u t i o n may be suggested: f i r s t , t he degree t o which the impregnant pene t ra tes t h e sample i s determined by t h e permeability of t he carbon and the v i scos i ty of the so lu t ion ; and, second, t h e uniformity of t he treatment may be adversely a f - f ec t ed i f the impregnant i s a suspension and not a t r u e so lu t ion . suspension is coarse enough, the s o l i d p a r t i c l e s may be f i l t e r e d out and only t h e clear l i qu id may, i n f a c t , reach t h e center of t he sample. however, t ha t treatments used i n t h i s work were t r u e so lu t ions . Another reason suggested fo r t h i s concentration gradient within t h e t r ea t ed carbon i s t h a t when the t r ea t ed mater ia l i s being dr ied , t he impregnant may migrate toward t h e sur face of t h e sample. Whatever t he reason, it i s clear t h a t , f o r t h e da t a shown i n Fig. 2 . there is a concentration gradient. The effect t h a t t h i s has on OR is obvious i f t he treatment is i n the form of a s h e l l and i f t he oxygen penet ra tes t h e pore system beyond the t r ea t ed she l l . ,Therefore, a l a rge amount o f treatment does not necessar i ly insure a high OR. t o t h i s occurs when t h e pores a r e physically blocked as seems t o be t h e case f o r t h e molten sa l t t rea tments described by Paxton [9].
I f t he
I t i s noted,
An exception
B. tlygroscopic Behavior:
A c h a r a c t e r i s t i c of many phosphate t r ea t ed carbons, which is undesirable from t h e viewpoint of product use, i s t h e tendency t o absorb moisture and u l t ima te ly exude d rop le t s of s t i cky l i qu id from t h e pore mouths. behavior t ha t mles ou t t h e use of a number of treatments which a re , i n f a c t , q u i t e e f f e c t i v e i n i n h i b i t i n g the oxidation reaction. t e r i a l ca l l ed "Treatment D" ( l i n e 5 , Table I ) i s q u i t e reasonable as an OR treatment. However, t h e t r ea t ed carbon becomes tacky and moist a f t e r severa l days i n room a i r .
I t i s t h i s
For example, t h e ma-
An improvement can be made with coa t ings , cure cycles, and s torage condi- t i o n s i n t h a t some delay can be r e a l i z e d - i n moisture pickup. however, usua l ly do not e l imina te the prohlem: The so lu t ion is ; of course, t o f i n d a phosphate treatment which is not hygroscopic while, a t t he same time, it possesses exce l l en t OR proper t ies .
These measures,
While c e r t a i n phosphate compounds such as those of tungsten and molybdenum a r e apparently hygroscopic, it a l s o is poss ib le t h a t some o the r treatments ex- h i b i t t h i s behavior because of excess phosphoric acid within t h e f in i shed piece. Therefore, i n eva lua t ing the moisture pickup behavior of phosphate treatments, i t i s advisable t o cons ider the excess ac id present , i f any.
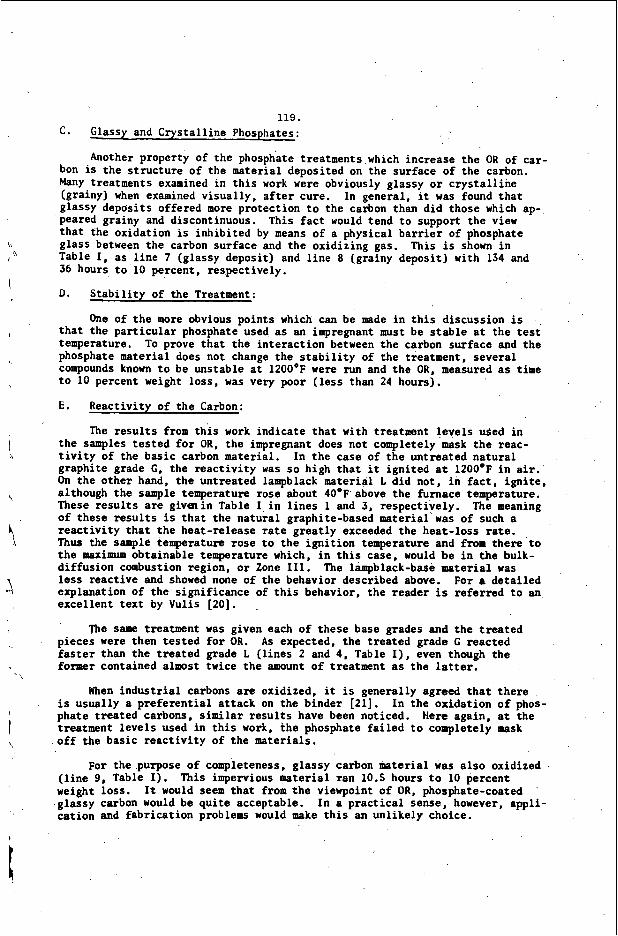
119. C. Glassy and Crys ta l l ine Phosphates:
bon is the s t r u c t u r e of the material deposited on the surface of the carbon. Many treatments examined i n t h i s work were obviously glassy o r c r y s t a l l i n e (grainy) when examined v isua l ly , a f t e r cure. glassy deposi ts offered more protect ion t o the carbon than d i d those which ap- peared grainy and discontinuous. t h a t the oxidation is inhib i ted by means of a physical b a r r i e r of phosphate g lass between the carbon surface and t h e oxidizing gas. Table I , as l i n e 7 (glassy deposit) and l i n e 8 (grainy deposi t ) with 134 and 36 hours t o 10 percent, respect ively.
Another property of the phosphate treatments which increase the OR of car-
In general , it was found t h a t
This f a c t would tend t o support t h e view
This i s shown i n
0 . S t a b i l i t y of the Treatment:
One of t h e more obvious points which can be made i n t h i s discussion is t h a t the p a r t i c u l a r phosphate used as an impregnant must be s t a b l e a t the test temperature. To prove t h a t the in te rac t ion between t h e carbon surface and the phosphate mater ia l does not change t h e s t a b i l i t y of t h e treatment, severa l compounds known t o be unstable at 1200'F were run and t h e OR, measured as time t o 10 percent weight loss , was very poor ( l e s s than 24 hours).
E. React ivi ty of the Carbon:
The r e s u l t s from t h i s work ind ica te t h a t with treatment levels used i n t h e samples t e s t e d f o r OR, the impregnant does not completely mask t h e reac- t i v i t y of the bas ic carbon material . graphi te grade G, t h e r e a c t i v i t y was so high t h a t it igni ted a t 1200.F i n air. On the o ther hand, the untreated lampblack material L did not , i n fact, i g n i t e , although the sample temperature rose about 40'F above the furnace temperature. These r e s u l t s are giver in Table I i n l i n e s 1 and 3, respect ively. The meaning of these r e s u l t s is t h a t the na tura l graphite-based material was of such a r e a c t i v i t y t h a t the heat-release rate g r e a t l y exceeded the heat- loss r a t e . Thus the sample temperature rose t o t h e i g n i t i o n temperature and from there t o t h e maximum obtainable temperature which, i n t h i s case, would be i n t h e bulk- d i f fus ion combustion region, o r Zone 111. The lampblack-base material was less reac t ive and showed none of the behavior described above. For a deta i led explanation of the s ignif icance of t h i s behavior, the reader is refer red t o an exce l len t text by Vulis [20].
In t h e case of t h e untreated na tura l
The same treatment was given each of these base grades and t h e t r e a t e d pieces were then t e s t e d f o r OR. As expected, t h e t rea ted grade G reacted faster than the t rea ted grade L ( l i n e s 2 and 4, Table I ) , even though t h e former contained almost twice t h e amount of treatment as the latter.
When i n d u s t r i a l carbons are oxidized, it i s generally agreed t h a t there is usual ly a p r e f e r e n t i a l a t tack on the binder [21]. phate t rea ted carbons, similar r e s u l t s have been noticed. treatment l e v e l s used i n t h i s work, the phosphate f a i l e d t o completely mask off the basic r e a c t i v i t y of the materials.
I n the oxidat ion o f phos- Here again, a t the
For the purpose of completeness, glassy carbon material was a l s o oxidized ( l i n e 9 , Table I). weight loss . glassy carbon would be q u i t e acceptable. ca t ion and fabr ica t ion problems would make t h i s an unl ike ly choice.
This impervious material ran 10.5 hours t o 10 percent I t would seem t h a t from t h e viewpoint of OR, phosphate-coated
In a p r a c t i c a l sense, however, appl i -

120. V . CONCLUSIONS
When evaluat ing phosphate treatments f o r oxidation res i s tance , one should have information not only on t h e t o t a l amount of treatment within the carbon but the d i s t r i b u t i o n of t h a t treatment as well. explain r e s u l t s which otherwise would appear q u i t e contradictory.
o ther than percent pickup and d i s t r i b u t i o n , include the glassy proper t ies of the treatment, t h e thermal s t a b i l i t y of the compounds formed a t the test tem- perature (1200'F i n t h i s work) and, i n some cases, the r e a c t i v i t y of t h e base grade.
Such information could he lp t o
The fac tors which determine the effect iveness of a p a r t i c u l a r OR treatment,
Propert ies o t h e r than OR my disqual i fy an impregnation fm being cen- s idered fo r commercial use. s t i c k y so lu t ion i s usua l ly the most troublesome behavior.
I n the case of phosphates, t h e tendency t o exude a
V I . REFERENCES
Wicke, E., "Fifth Symposium on Combustion," New York: Reinhold, p. 245, 1955.
, , 47, 164, 1951. him. Phys., 47, 540, 1950.
Hadman, G., H. L. Thompson, and C. N . Hinshelwood, Proc. of Royal SOC.,
Day, R . J . , Ph.D. Thesis, The Pennsylvania S t a t e University, 1949. Hedden, W.L., G. J. Dienes, Advances i n Catalysis , 9, 398, 1957. Pallmer, P.G., Carbon, New York: Schul t t , D.A., P.H. Higgs, and J . D . Cannon, authors, "Oxid8tion-
Paxton, R.R. and G.I. Beyer, U.S. Patent 3,342,627, 1967. hoodburn, J. , and R.F. Lynch, U.S. Patent 2,685,539, 1954. Woodburn, J. , and R.F. Lynch, U. S. Patent 2,685,540, 1954. Woodburn, J., and R. F. Lynch, U.S. Patent 2,685,541, 1954. Woodburn, J., and R.F. Lynch, U S . Patent 2,685,542, 1954. Walker, P.L., F. Rusinko, and L.G. Austin, Advances i n C a t a l y s i s , G ,
Khitrin, L.N., "Sixth Symposium ( In te rna t iona l ) on Combustion,'' New York:
Lain, N . R . , F. J. Vastola, and P.L. Walker, J. Phys. Chem., 67, p. 2030,
Austin, L.G.. Ph.D. Thesis. The Pennsylvania S t a t e University. 1961.
(London), A137, 87, 1932.
Pergamon Press Ltd., i, p. 145, 1966.
Resistant Coatings f o r Graphite," WADD TR61-72, Vol. XXXIV, Union Carbide C o r p . , June, 1964.
134, 1959.
Reinhold, 1951.
1963.
Essenhigh, R;H., R. Froberg, J.B. Howird, Ind. Eng. Chem., 57; p.. 33, 1965.
Gregg, S.J., and R.F.S. Tyson, Carbon, New York: Pergamn Press Ltd.,
VuiiS, L.A., Thenual Regimes of Combustion, New York: Froberg, R.ii., Pn.D. Tnesis, Tne Pennsyivania Srare University, 1967.
3, p. 39, 1965. & C r a w - H i l l , 1961.

121.
'1
3" DIA.VERTlCAL TUBE FURNACE
IR.OXYGEN, ARGON a ITROGEN (FILTERED.
WATER COOLED RlED AND METERED
FIG. I OXIDATION RESISTANCE T E S T SYSTEM
10.0
LOCAL WEIGHT 5.0 PERCENT TREATMENT
1 0 0.1 0.2 03 0.4
DISTANCE FROM CENTER OF CUBE ( I N C H E S ) ,
FIG. 2 LOCAL DISTRIBUTION OF PHOSPHATE TREATMENT WITHIN CUBE OF GRADE L (LAMPBLACK BASE 1 i