preparation of functionalized and metal-impregnated activated carbon by a single-step activation...
TRANSCRIPT
Pc
Sa
b
a
ARR2AA
KAMCIS
1
(tchr(bhc
bwitdmt
o
0h
Applied Surface Science 290 (2014) 92– 101
Contents lists available at ScienceDirect
Applied Surface Science
jou rn al h omepa g e: www.elsev ier .com/ locate /apsusc
reparation of functionalized and metal-impregnated activatedarbon by a single-step activation method
eyed A. Dastgheiba,∗, Jianli Rena,1, Massoud Rostam-Abadia, Ramsay Changb
Illinois State Geological Survey, Prairie Research Institute, University of Illinois, 615 East Peabody Dr., Champaign, IL 61820, United StatesElectric Power Research Institute, 3412 Hillview Avenue, Palo Alto, CA 94304, United States
r t i c l e i n f o
rticle history:eceived 27 June 2013eceived in revised form9 September 2013ccepted 2 November 2013vailable online 13 November 2013
a b s t r a c t
A rapid method to prepare functionalized and metal-impregnated activated carbon from coal is describedin this paper. A mixture of ferric chloride and a sub-bituminous coal was used to demonstrate simultane-ous coal activation, chlorine functionalization, and iron/iron oxides impregnation in the resulting porouscarbon products. The FeCl3 concentration in the mixture, the method to prepare the FeCl3-coal mixture(solid mixing or liquid impregnation), and activation atmosphere and temperature impacted the surfacearea and porosity development, Cl functionalization, and iron species impregnation and dispersion in
◦
eywords:ctivated carbonicroporous materialsoalmpregnationingle-step method
the carbon products. Samples activated in nitrogen or a simulated flue gas at 600 or 1000 C for 1–2 minhad surface areas up to ∼800 m2/g, bulk iron contents up to 18 wt%, and surface chlorine contents up to27 wt%. Potential catalytic and adsorption application of the carbon materials was explored in catalyticwet air oxidation (CWAO) of phenol and adsorption of ionic mercury from aqueous solutions. Results indi-cated that impregnated activated carbons outperformed their non-impregnated counterparts in both theCWAO and adsorption tests.
. Introduction
Functionalized and/or metal impregnated activated carbonsACs) are promising catalysts and sorbents for various indus-rial applications. For example, iron-impregnated ACs are effectiveatalysts for Fischer–Tropsch synthesis, water–gas-shift reaction,ydrocracking of heavy oil, removal of trace metals from water,emediation of chlorinated pollutants, catalytic wet air oxidationCWAO) of phenol and other refractory compounds, and removal ofacteria from water [1–12]. Activated carbons functionalized withalogens (including chlorine) enhance the removal of mercury fromoal combustion flue gases [13].
Adsorption affinity and catalytic performance of activated car-on is tailored by surface functionalization or metal impregnationith proper chemical agents [e.g., 14–17]. Functionalized and/or
mpregnated porous carbon materials are conventionally preparedhrough separate post-activation stages. Porosity in carbon is first
eveloped by a physical or chemical activation process of a feedaterial such as coal or biomass. The porous carbon is then func-ionalized by treating it with a proper chemical agent, either a
Abbreviations: SFG, simulated flue gas; CWAO, catalytic wet air oxidation.∗ Corresponding author. Tel.: +1 217 265 6274; fax: +1 217 333 8566.
E-mail address: [email protected] (S.A. Dastgheib).1 Visiting scholar from the College of Mechanical Engineering, Zhejiang University
f Technology, China.
169-4332/$ – see front matter © 2013 Elsevier B.V. All rights reserved.ttp://dx.doi.org/10.1016/j.apsusc.2013.11.005
© 2013 Elsevier B.V. All rights reserved.
gaseous or a liquid phase, in a post activation process [e.g., 14–17].Metal impregnation of a porous carbon is performed by excesssolution, incipient wetness, ion exchange, or chemical vapor depo-sition techniques followed by a calcination/reduction step [14]. Forexample, iron-impregnated activated carbons were prepared by awet impregnation method using ferric chloride solution followedby heat treatment in nitrogen [16]. In an alternative approach,iron-impregnated carbon catalysts were produced by stirring coalpowder in FeCl3 solution for 24 h under a controlled pH condition.The slurry then was filtered, washed, and pyrolyzed at 798 ◦C for6–60 min in steam [3,4]. In another similar approach, iron-loadedcarbon catalysts were prepared by precipitating iron species ontocoal followed by devolatalization at 500–950 ◦C for 30 min and acti-vation in CO2 at 900–950 ◦C for 10–30 min [18].
Combining the activation, functionalization, and metal impreg-nation processes into a single-step process offers a simple and fastmethod to prepare functionalized carbon sorbents/catalysts in amore cost-effective manner than conventional methods. Single-step methods for activation and metal impregnation of carbonmaterials include spray pyrolysis (SP) and hydro-thermal treat-ment (HTT) [5,19–23]. In the SP method, including ultrasonic spraypyrolysis (USP), an aerosol stream containing a mixture of a car-bonaceous precursor and a metal catalyst precursor is generated
and pyrolyzed at temperatures above 500 ◦C in <20 s. Porous car-bon materials containing well-dispersed iron nanoparticles wereprepared by SP methods [19–22]; however, the yield of the carbonproduct was low because a substantial amount of the carbonaceous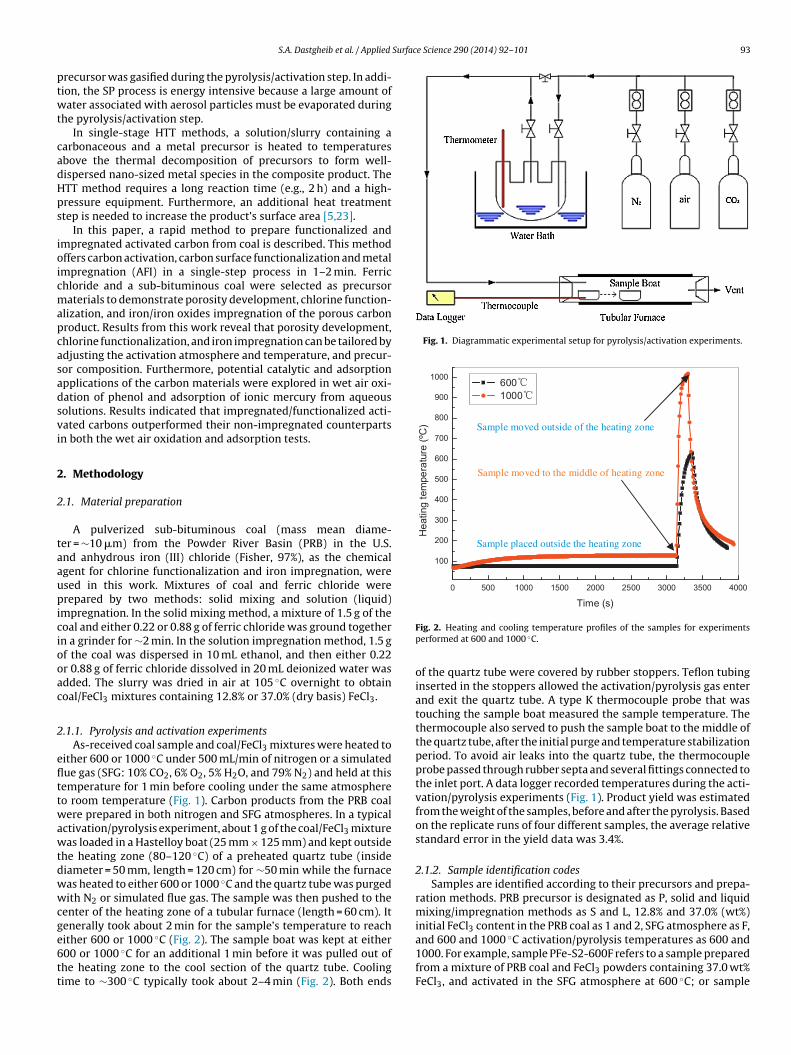
Surface Science 290 (2014) 92– 101 93
ptwt
cadHps
ioicmapcasadsvi
2
2
taaupiciooac
2
eflttwawtdwwcge6tt
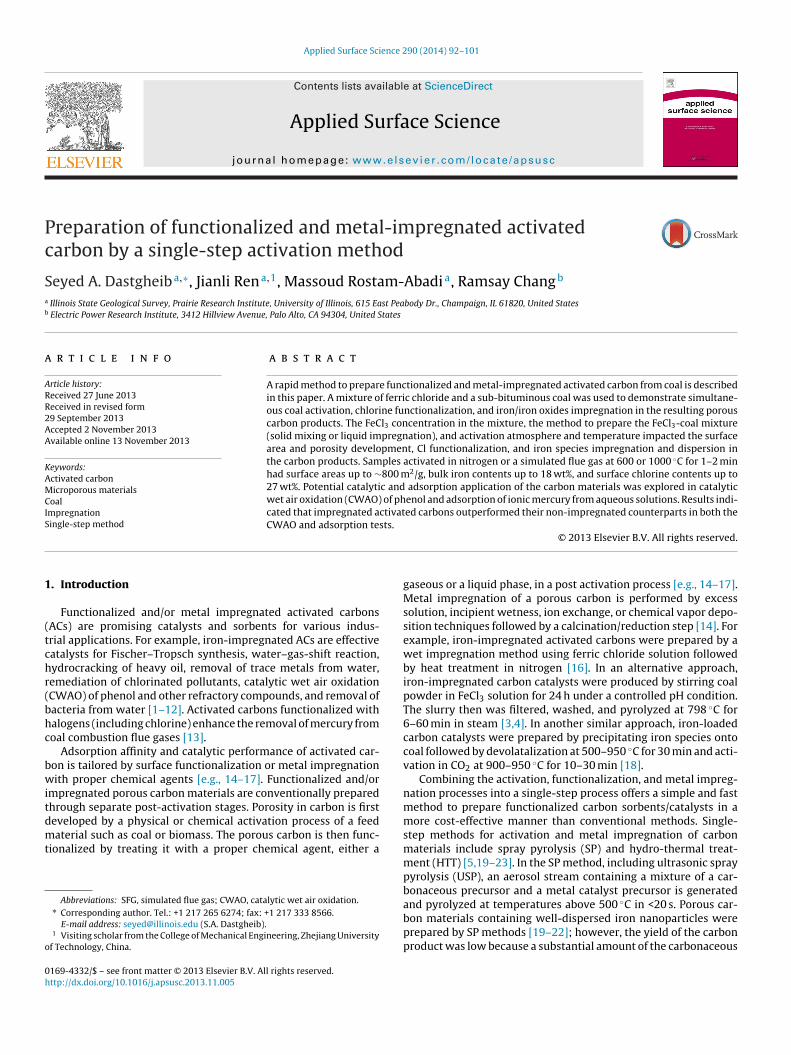
Fig. 1. Diagrammatic experimental setup for pyrolysis/activation experiments.
0 50 0 100 0 150 0 200 0 2500 300 0 350 0 400 0
100
200
300
400
500
600
700
800
900
1000 600 1000
Hea
ting
tem
pera
ture
(ºC
)
Time (s )
Sample pla ced outside the heating zone
Sample moved to the middle of heating zone
Sample moved outside of the he ating zone
S.A. Dastgheib et al. / Applied
recursor was gasified during the pyrolysis/activation step. In addi-ion, the SP process is energy intensive because a large amount ofater associated with aerosol particles must be evaporated during
he pyrolysis/activation step.In single-stage HTT methods, a solution/slurry containing a
arbonaceous and a metal precursor is heated to temperaturesbove the thermal decomposition of precursors to form well-ispersed nano-sized metal species in the composite product. TheTT method requires a long reaction time (e.g., 2 h) and a high-ressure equipment. Furthermore, an additional heat treatmenttep is needed to increase the product’s surface area [5,23].
In this paper, a rapid method to prepare functionalized andmpregnated activated carbon from coal is described. This methodffers carbon activation, carbon surface functionalization and metalmpregnation (AFI) in a single-step process in 1–2 min. Ferrichloride and a sub-bituminous coal were selected as precursoraterials to demonstrate porosity development, chlorine function-
lization, and iron/iron oxides impregnation of the porous carbonroduct. Results from this work reveal that porosity development,hlorine functionalization, and iron impregnation can be tailored bydjusting the activation atmosphere and temperature, and precur-or composition. Furthermore, potential catalytic and adsorptionpplications of the carbon materials were explored in wet air oxi-ation of phenol and adsorption of ionic mercury from aqueousolutions. Results indicated that impregnated/functionalized acti-ated carbons outperformed their non-impregnated counterpartsn both the wet air oxidation and adsorption tests.
. Methodology
.1. Material preparation
A pulverized sub-bituminous coal (mass mean diame-er = ∼10 �m) from the Powder River Basin (PRB) in the U.S.nd anhydrous iron (III) chloride (Fisher, 97%), as the chemicalgent for chlorine functionalization and iron impregnation, weresed in this work. Mixtures of coal and ferric chloride wererepared by two methods: solid mixing and solution (liquid)
mpregnation. In the solid mixing method, a mixture of 1.5 g of theoal and either 0.22 or 0.88 g of ferric chloride was ground togethern a grinder for ∼2 min. In the solution impregnation method, 1.5 gf the coal was dispersed in 10 mL ethanol, and then either 0.22r 0.88 g of ferric chloride dissolved in 20 mL deionized water wasdded. The slurry was dried in air at 105 ◦C overnight to obtainoal/FeCl3 mixtures containing 12.8% or 37.0% (dry basis) FeCl3.
.1.1. Pyrolysis and activation experimentsAs-received coal sample and coal/FeCl3 mixtures were heated to
ither 600 or 1000 ◦C under 500 mL/min of nitrogen or a simulatedue gas (SFG: 10% CO2, 6% O2, 5% H2O, and 79% N2) and held at thisemperature for 1 min before cooling under the same atmosphereo room temperature (Fig. 1). Carbon products from the PRB coalere prepared in both nitrogen and SFG atmospheres. In a typical
ctivation/pyrolysis experiment, about 1 g of the coal/FeCl3 mixtureas loaded in a Hastelloy boat (25 mm × 125 mm) and kept outside
he heating zone (80–120 ◦C) of a preheated quartz tube (insideiameter = 50 mm, length = 120 cm) for ∼50 min while the furnaceas heated to either 600 or 1000 ◦C and the quartz tube was purgedith N2 or simulated flue gas. The sample was then pushed to the
enter of the heating zone of a tubular furnace (length = 60 cm). Itenerally took about 2 min for the sample’s temperature to reach
ither 600 or 1000 ◦C (Fig. 2). The sample boat was kept at either00 or 1000 ◦C for an additional 1 min before it was pulled out ofhe heating zone to the cool section of the quartz tube. Coolingime to ∼300 ◦C typically took about 2–4 min (Fig. 2). Both endsFig. 2. Heating and cooling temperature profiles of the samples for experimentsperformed at 600 and 1000 ◦C.
of the quartz tube were covered by rubber stoppers. Teflon tubinginserted in the stoppers allowed the activation/pyrolysis gas enterand exit the quartz tube. A type K thermocouple probe that wastouching the sample boat measured the sample temperature. Thethermocouple also served to push the sample boat to the middle ofthe quartz tube, after the initial purge and temperature stabilizationperiod. To avoid air leaks into the quartz tube, the thermocoupleprobe passed through rubber septa and several fittings connected tothe inlet port. A data logger recorded temperatures during the acti-vation/pyrolysis experiments (Fig. 1). Product yield was estimatedfrom the weight of the samples, before and after the pyrolysis. Basedon the replicate runs of four different samples, the average relativestandard error in the yield data was 3.4%.
2.1.2. Sample identification codesSamples are identified according to their precursors and prepa-
ration methods. PRB precursor is designated as P, solid and liquidmixing/impregnation methods as S and L, 12.8% and 37.0% (wt%)initial FeCl3 content in the PRB coal as 1 and 2, SFG atmosphere as F,
◦
and 600 and 1000 C activation/pyrolysis temperatures as 600 and1000. For example, sample PFe-S2-600F refers to a sample preparedfrom a mixture of PRB coal and FeCl3 powders containing 37.0 wt%FeCl3, and activated in the SFG atmosphere at 600 ◦C; or sample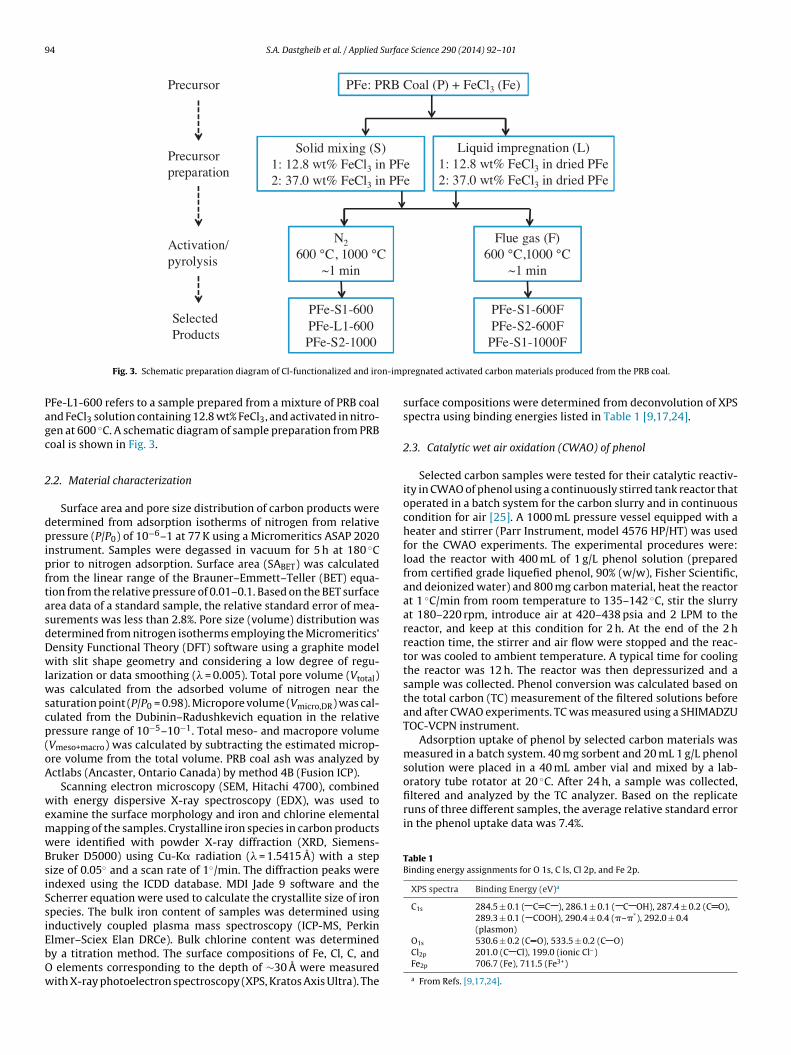
94 S.A. Dastgheib et al. / Applied Surface Science 290 (2014) 92– 101
PFe: PRB Coal (P) + FeCl3 (Fe)Precursor
Solid mixing (S)1: 12.8 wt% FeCl3 in PFe2: 37.0 wt% FeCl3 in PFe
Liquid imp regn ation (L)1: 12.8 wt% FeCl3 in dried PFe2: 37.0 wt% FeCl3 in dried PFe
Precursorpreparation
Activation/pyrolysi s
N2
600 °C, 1000 °C~1 mi n
Flue gas (F)600 °C,1 000 °C
~1 mi n
Sele ctedProducts
PFe-S1-600PFe-L1-600
PFe-S1-600FPFe-S2-600F
n-imp
Pagc
2
dpipftasdDwlwscp(oA
wemwBsiSsiEbOw
oratory tube rotator at 20 C. After 24 h, a sample was collected,filtered and analyzed by the TC analyzer. Based on the replicateruns of three different samples, the average relative standard errorin the phenol uptake data was 7.4%.
Table 1Binding energy assignments for O 1s, C ls, Cl 2p, and Fe 2p.
XPS spectra Binding Energy (eV)a
C1s 284.5 ± 0.1 ( C C ), 286.1 ± 0.1 ( C OH), 287.4 ± 0.2 (C O),289.3 ± 0.1 ( COOH), 290.4 ± 0.4 (�–�*), 292.0 ± 0.4(plasmon)
PFe-S2-1000
Fig. 3. Schematic preparation diagram of Cl-functionalized and iro
Fe-L1-600 refers to a sample prepared from a mixture of PRB coalnd FeCl3 solution containing 12.8 wt% FeCl3, and activated in nitro-en at 600 ◦C. A schematic diagram of sample preparation from PRBoal is shown in Fig. 3.
.2. Material characterization
Surface area and pore size distribution of carbon products wereetermined from adsorption isotherms of nitrogen from relativeressure (P/P0) of 10−6–1 at 77 K using a Micromeritics ASAP 2020
nstrument. Samples were degassed in vacuum for 5 h at 180 ◦Crior to nitrogen adsorption. Surface area (SABET) was calculatedrom the linear range of the Brauner–Emmett–Teller (BET) equa-ion from the relative pressure of 0.01–0.1. Based on the BET surfacerea data of a standard sample, the relative standard error of mea-urements was less than 2.8%. Pore size (volume) distribution wasetermined from nitrogen isotherms employing the Micromeritics’ensity Functional Theory (DFT) software using a graphite modelith slit shape geometry and considering a low degree of regu-
arization or data smoothing (� = 0.005). Total pore volume (Vtotal)as calculated from the adsorbed volume of nitrogen near the
aturation point (P/P0 = 0.98). Micropore volume (Vmicro,DR) was cal-ulated from the Dubinin–Radushkevich equation in the relativeressure range of 10−5–10−1. Total meso- and macropore volumeVmeso+macro) was calculated by subtracting the estimated microp-re volume from the total volume. PRB coal ash was analyzed byctlabs (Ancaster, Ontario Canada) by method 4B (Fusion ICP).
Scanning electron microscopy (SEM, Hitachi 4700), combinedith energy dispersive X-ray spectroscopy (EDX), was used to
xamine the surface morphology and iron and chlorine elementalapping of the samples. Crystalline iron species in carbon productsere identified with powder X-ray diffraction (XRD, Siemens-ruker D5000) using Cu-K� radiation (� = 1.5415 A) with a stepize of 0.05◦ and a scan rate of 1◦/min. The diffraction peaks werendexed using the ICDD database. MDI Jade 9 software and thecherrer equation were used to calculate the crystallite size of ironpecies. The bulk iron content of samples was determined usingnductively coupled plasma mass spectroscopy (ICP-MS, Perkin
lmer–Sciex Elan DRCe). Bulk chlorine content was determinedy a titration method. The surface compositions of Fe, Cl, C, andelements corresponding to the depth of ∼30 A were measuredith X-ray photoelectron spectroscopy (XPS, Kratos Axis Ultra). The
PFe-S1-1000F
regnated activated carbon materials produced from the PRB coal.
surface compositions were determined from deconvolution of XPSspectra using binding energies listed in Table 1 [9,17,24].
2.3. Catalytic wet air oxidation (CWAO) of phenol
Selected carbon samples were tested for their catalytic reactiv-ity in CWAO of phenol using a continuously stirred tank reactor thatoperated in a batch system for the carbon slurry and in continuouscondition for air [25]. A 1000 mL pressure vessel equipped with aheater and stirrer (Parr Instrument, model 4576 HP/HT) was usedfor the CWAO experiments. The experimental procedures were:load the reactor with 400 mL of 1 g/L phenol solution (preparedfrom certified grade liquefied phenol, 90% (w/w), Fisher Scientific,and deionized water) and 800 mg carbon material, heat the reactorat 1 ◦C/min from room temperature to 135–142 ◦C, stir the slurryat 180–220 rpm, introduce air at 420–438 psia and 2 LPM to thereactor, and keep at this condition for 2 h. At the end of the 2 hreaction time, the stirrer and air flow were stopped and the reac-tor was cooled to ambient temperature. A typical time for coolingthe reactor was 12 h. The reactor was then depressurized and asample was collected. Phenol conversion was calculated based onthe total carbon (TC) measurement of the filtered solutions beforeand after CWAO experiments. TC was measured using a SHIMADZUTOC-VCPN instrument.
Adsorption uptake of phenol by selected carbon materials wasmeasured in a batch system. 40 mg sorbent and 20 mL 1 g/L phenolsolution were placed in a 40 mL amber vial and mixed by a lab-
◦
O1s 530.6 ± 0.2 (C O), 533.5 ± 0.2 (C O)Cl2p 201.0 (C Cl), 199.0 (ionic Cl–)Fe2p 706.7 (Fe), 711.5 (Fe3+)
a From Refs. [9,17,24].

S.A. Dastgheib et al. / Applied Surface Science 290 (2014) 92– 101 95
Table 2Physical characteristics of materials.
Sample SABET (m2/g) Vtotal (cm3/g) Vmicro, DR (cm3/g) Vmeso+macro (cm3/g) DFT pore volume distribution (%)
<7 ´A 7–20 ´A >20 ´A
PRB-600 190 0.079 0.079 0 0 100 0PFe-S1-600 245 0.126 0.097 0.029 16 42 41PFe-S2-600 27 0.028 0.012 0.016 4 25 71PFe-L1-600 393 0.156 0.153 0.003 73 26 1PFe-L2-600 14 0.014 0.006 0.008 0 22 78PRB-1000 228 0.104 0.092 0.012 9 84 7PFe-S1-1000 365 0.168 0.143 0.025 18 59 23PFe-S2-1000 505 0.204 0.196 0.008 63 37 0PRB-600F 265 0.102 0.096 0.006 14 86 0PFe-L1-600F 369 0.147 0.147 0 84 16 0PFe-L2-600F 19 0.007 0.007 0 0 100 0PFe-S1-600F 356 0.136 0.136 0 67 32 1PFe-S2-600F 9 0.003 0.003 0 0 100 0PFe-L1-1000 338 0.133 0.133 0 61 39 0PFe-L2-1000 689 0.272 0.266 0.006 59 40 1PRB-1000F 621 0.282 0.243 0.039 55 32 14PFe-L1-1000F 589 0.239 0.228 0.011 70 25 5
2
sa42tApwre
3
pcrgd
TC
N
PFe-L2-1000F 816 0.348 0.315
PFe-S1-1000F 568 0.243 0.221
PFe-S2-1000F 697 0.289 0.271
.4. Mercury uptake from aqueous solutions
Adsorption of mercury from aqueous solutions onto selectedamples was measured in a batch system. 20 mg AC sample wasdded to 20 mL of a 10 mg/L HgCl2 solution that was placed in a0 mL plastic vial and mixed by a laboratory tube rotator for 24 h at0 ◦C. A stock mercury solution was prepared by dissolving a cer-ified ACS grade HgCl2 salt (Fisher Scientific) in 1 g/L NaCl solution.
certified ACS grade NaCl salt, and deionized water were used torepare NaCl solution. Mercury concentration in filtered solutionsas measured by a LECO AMA254 mercury analyzer. Based on the
eplicate runs of six different samples, the average relative standardrror in the mercury uptake data was 2.4%.
. Results and discussion
Physical and chemical characteristics of carbon products areresented in Tables 2 and 3. Carbon porosity is developed through a
ombination of physical and chemical activation mechanisms. Fer-ic chloride is converted to different iron species and Cl2 and HClases are released during the one-step process. Iron species areeposited in the carbon matrix while Cl2/HCl is reacted with carbonable 3hemical characteristics of materials.
Sample Bulk composition (wt%) Surface composition (wt%)a
Cl Fe Cl Fe C
PRB-600 0.09 0.50 0.00 0.49 81.6PFe-S1-600 2.71 8.82 14.61 6.73 65.4PFe-S2-600 13.24 16.88 27.43 16.88 39.8PFe-L1-600 2.38 6.54 8.27 4.36 78.0PRB-1000 0.02 0.56 ND ND ND
PFe-S1-1000 0.03 6.30 5.63 2.09 82.8PFe-S2-1000 0.06 12.25 8.67 7.73 75.3PFe-L2-1000 0.02 12.39 2.18 1.90 87.0PRB-600F 0.06 0.47 ND ND ND
PFe-S1-600F 0.59 9.25 6.20 1.66 74.3PFe-S2-600F 9.70 18.11 26.74 15.00 42.3PRB-1000F 0.02 1.06 ND ND ND
PFe-S1-1000F 0.12 12.02 0.00 0.00 90.1PFe-S2-1000F 0.09 15.62 0.23 1.29 89.0
D, not determined.a Excluding H.b Not detectable with accuracy.
0.033 57 41 20.022 60 33 70.018 53 41 6
active sites to form C Cl surface groups. The results are discussedin the following sections.
3.1. Porosity development
As-received PRB coal contained 20.8 wt% moisture, 42.3 wt%volatile matter, 6.4 wt% ash, 30.5 wt% fixed carbon, and a negli-gible porosity. The coal ash contained 40.29 wt% SiO2, 23.72 wt%Al2O3, 7.13 wt% Fe2O3, 0.03 wt% MnO, 23.47 wt% CaO, 1.08 wt%Na2O, 0.35 wt% K2O, 1.69 wt% TiO2, 1.35 wt% P2O5, and 0.89 wt%trace elements on a dry basis. Two baseline porous carbon prod-ucts with surface areas of 190 m2/g (sample PRB-600) and 228 m2/g(sample PRB-1000) were prepared by pyrolyzing the PRB coal innitrogen at 600 and 1000 ◦C (Table 2). Both samples PRB-600 andPRB-1000 were microporous with 84–100% of their pore volumesin the super-micropore region (7–20 A) (Table 2).
Samples PRB-600F and PRB-1000F which were prepared in
the SFG had significantly higher surface areas and micropore vol-umes than those prepared in nitrogen (Table 2). This is mainlybecause in the SFG, coal devolatalization and partial carbon gasi-fication/oxidation reactions occurred simultaneously resulting inCrystalline iron particle form and diameter (nm)
O
5 17.86 b
9 13.17 Fe3O4 (55.2 ± 11.0)3 15.86 Fe3O4 (36.4 ± 7.3)7 9.31 Fe3O4 (12.8 ± 3.1), Fe0.942O (14.0 ± 2.8), Fe (39.8 ± 10.4)
ND b
7 9.41 Fe (36.7 ± 4.0)8 8.22 Fe (20.6 ± 2.3)2 8.90 Fe (30.0 ± 2.6)
ND b
9 17.75 Fe3O4 (51.9 ± 4.2), Fe2O3 (42.8 ± 20.9)6 15.89 Fe3O4 (38.4 ± 5.9), Fe2O3 (38.3 ± 6.4)
ND b
1 9.89 Fe3O4 (21.8 ± 5.0), Fe2O3 (24.5 ± 6.6), Fe (46.7 ± 12.7)5 9.43 Fe3O4 (15.0 ± 2.3), Fe2O3 (26.9 ± 6.9), Fe (32.3 ± 4.5)

96 S.A. Dastgheib et al. / Applied Surfac
40
50
60
30
40
50
60
30405060
30405060
PFe-S1-100 0
PFe-S2-600
PFe-S1-600PRB-600
PFe-L2-100 0
PFe-L1-1000
PRB-1000
PFe-L2-600
PFe-L1-600PRB-600
PFe-S2-1000F
PFe-S1-1000F
PRB-1000F
PFe-S2-600 F
PFe-S1-600FPRB-600 F
Prod
uct Y
ield
(w
t%)
PFe-L2-1000F
PFe-L1-1000F
PRB-1000 F
PFe-L2-600F
PFe-L1-600FPRB-600F
bm
ostrtmomsvsPami
ctaSuF(wfl6HtCaL(mmmeaSf
sbg
30 PFe-S2-1000PRB-10 00
Fig. 4. Product yield of different samples prepared from the PRB coal.
oth lower product yields and higher porous structure develop-ent (Fig. 4, Table 2).The impact of carbon gasification/oxidation on porosity devel-
pment is more significant at 1000 ◦C than at 600 ◦C because theurface area of sample PRB-1000F (621 m2/g) is 2.3 times largerhan sample PRB-600F. It is well known that in the 600–1000 ◦Cange, carbon gasification rate sharply increases with increasingemperature [26]. Samples PRB-1000F and PRB-600F are highly
icroporous carbons, but the majority of the micropore volumef sample PRB-1000F is in the ultra-micropore region (<7 A) whileost of the micropore volume of sample PRB-600F is in the
uper-micropore range (Table 2). In addition, 14% of total poreolume of sample PRB-1000F is in mesopore region but a con-iderably lower amount of mesoporosity is observed for sampleRB-600F. A comparison of pore size distributions of PRB-1000Fnd PRB-1000 reveals that activation in the SFG developed pri-arily ultra-micropores while super-micropores were dominant
n samples prepared in nitrogen.The surface area development of the samples prepared from PRB
oal and FeCl3 mixtures was impacted by the initial FeCl3 content ofhe PRB-FeCl3 mixture, precursor preparation method, activationtmosphere, and temperature. The surface area of sample PFe-1-600 was 245 m2/g, 29% higher than sample PRB-600 activatednder similar conditions from the PRB coal alone. Increasing theeCl3 content of the mixture to 37% produced a carbon productsample PFe-S2-600) with only 27 m2/g surface area. A similar trendas observed for other samples prepared at 600 ◦C in the simulatedue gas (PFe-S2-600F and PFe-L2-600F) or in nitrogen (PFe-L2-00). These results suggest that FeCl3 served as an activation agent.owever, at a higher concentration (37 wt%) iron species plugged
he pores in the carbon products, thus lowering the surface area.arbon products prepared using the liquid impregnation methodnd activated in nitrogen or SFG (samples PFe-L1-600 and PFe-1-600F) or by the solid mixing method and activated in the SFGsample PFe-S1-600F) had significantly higher surface areas and
icropore volumes than sample PFe-S1-600 (Table 2). The highericroporosity in the liquid-impregnated samples is attributed to aore intimate contact of FeCl3 molecules with coal particles, thus
nhancing the chemical activation reactions. The greater surfacerea and microporosity of sample PFe-S1-600F than sample PFe-1-600 is attributed to the slightly higher carbon burn off of theormer sample during the activation process (Fig. 4).
Samples prepared at 1000 ◦C in nitrogen (or SFG) had higherurface areas and microporosities than samples prepared at 600 ◦Cecause more volatile matter was released and more carbon wasasified at the higher pyrolysis temperature, as confirmed by the
e Science 290 (2014) 92– 101
product yield data (Fig. 4). Surface areas of samples PFe-S2-1000and PFe-L2-1000 were 505 m2/g, and 689 m2/g, respectively, con-siderably higher than the 365 m2/g for sample PFe-S1-1000 (or338 m2/g for PFe-L1-1000), because a higher degree of chemicalactivation occurred for samples that contained higher concentra-tions of FeCl3. Furthermore, carbon products prepared at 1000 ◦Cfrom mixtures containing 37 wt% FeCl3 did not show any evidenceof the pore blockage as was observed for samples prepared at600 ◦C. The mechanism by which iron-containing species partici-pate in plugging carbon pores remains to be determined.
Porosity of carbon products prepared in the SFG at 1000 ◦C fromboth impregnated (PFe-S1-1000F, PFe-L1-1000F, PFe-L2-1000F andPFe-S2-1000F) and non-impregnated (PRB-1000F) samples werecomparable and higher than samples prepared in nitrogen (Table 2).These results suggest that the additional porosity development forsamples prepared in the SFG is caused by carbon physical/chemicalactivation, which is also in agreement with the higher carbon burn-off and lower product yield results (Fig. 4).
It is reported that ferric chloride acts as a Lewis acid activationagent and enhances coal porosity development during pyrolysisand steam gasification [27]. Ferric chloride is also used as an acti-vation agent to develop carbon porosity and introduce iron catalystsites in carbon/iron materials prepared from lignin [12]. Further-more, iron species catalyze coal gasification in CO2 [27]. Samplesprepared from a mixture of 5–35% FeCl3 and a coking coal in nitro-gen at 750 ◦C for 2 h had CO2-based surface areas up to 340 m2/g,compared to 71 m2/g for the pyrolyzed coal alone. Steam gasifi-cation of the iron-impregnated char at 800 ◦C to a 50% burn-offincreased the surface area of the char from 71 to ∼700 m2/g, com-pared to ∼500 m2/g for the steam-gasified coal char alone. Ourresults also confirm the role of FeCl3 and the produced iron speciesin porosity development during pyrolysis and activation of coal.
3.2. Iron impregnation
Characterization data indicate that AC products contain differ-ent iron species including Fe, FeO, Fe2O3, Fe3O4, and FeCl3. Thefollowing discussion describes possible pathways for the formationof iron species in carbon/iron materials.
Ferric chloride may either directly react with coal oxygen func-tionalities or react with oxygen and water vapor in the activationgas and convert to iron oxides and Cl2/HCl (Reactions 1 and 2). Thereaction of ferric chloride with oxygen or water vapor to Fe2O3 isthermodynamically feasible at 600 ◦C. Furthermore, Reaction 1 isreported to be instantaneous at 600 ◦C [28]. Produced Fe2O3 con-tributes to further carbon gasification and porosity development(Reactions 3–5) and the released Cl2/HCl molecules functionalizeactive sites of the carbon material.
FeCl3 + 3/4O2 = 1/2Fe2O3 + 3/2Cl2 �G600 ◦C = −56.2 kJ (1)
FeCl3 + 3/2H2O = 1/2Fe2O3 + 3HCl �G600 ◦C = −56.8 kJ (2)
In co-pyrolysis reaction of ferric chloride and organic com-pounds (e.g., alcohols) different iron oxides are produced [29–32].Fe3+ is partially reduced to a mixture of Fe2+ and Fe3+ and Fe3O4is produced which is further oxidized to Fe2O3 in the presence ofan oxidizing agent [29]. We have recently reported that magnetiteis formed when a mixture of sucrose and ferric chloride solution ispyrolyzed in nitrogen at 500–800 ◦C [19]. Similarly, ferric chloridemay react with the oxygen functionalities of coal to produce Fe3O4and Fe2O3.
Catalytic gasification reactions of carbon with CO and H O in
2 2the presence of iron species follow an oxygen transfer mechanism[18,33]:FexOy + CO2 → FexOy(O) + CO (3)
S.A. Dastgheib et al. / Applied Surface Science 290 (2014) 92– 101 97
10 20 30 40 50 60 70
2-Theta (d eg. )
PRB-60 0
PFe-S1 -60 0
Fe0.942
O
PFe-S2- 600
Fe3O
4 PFe-L1- 600Fe
10 20 30 40 50 60 70
2- Theta (d eg. )
PRB-100 0
PFe-S1-10 00
PFe-S2- 100 0
PFe-L2- 100 0Fe
10 20 30 40 50 60 70
PRB-600 F
PFe-S1- 600 F
Fe2O3
PFe-S2-60 0FFe3O4
10 20 30 40 50 60 70
PRB-10 00F
PFe-S1-1000 F
Fe2O
3
PFe-S2-1000 FFe
3O
4Fe
(a) (b)
(c) (d)
ateri
F
F
dpir
0siutAaia
m6nc(
po
2-Theta (d eg. )
Fig. 5. XRD patterns of carbon m
exOy + H2O → FexOy(O) + H2 (4)
exOy(O) + C → FexOy + CO (5)
In addition to catalytic gasification, carbon is also gasified byirect reactions with O2, H2O, and CO2 at elevated temperatures toroduce CO and H2 which reduce iron oxides [33]. Fe2O3 is reduced
n three steps to Fe3O4, FeO, and Fe and magnetite can be directlyeduced to Fe [34].
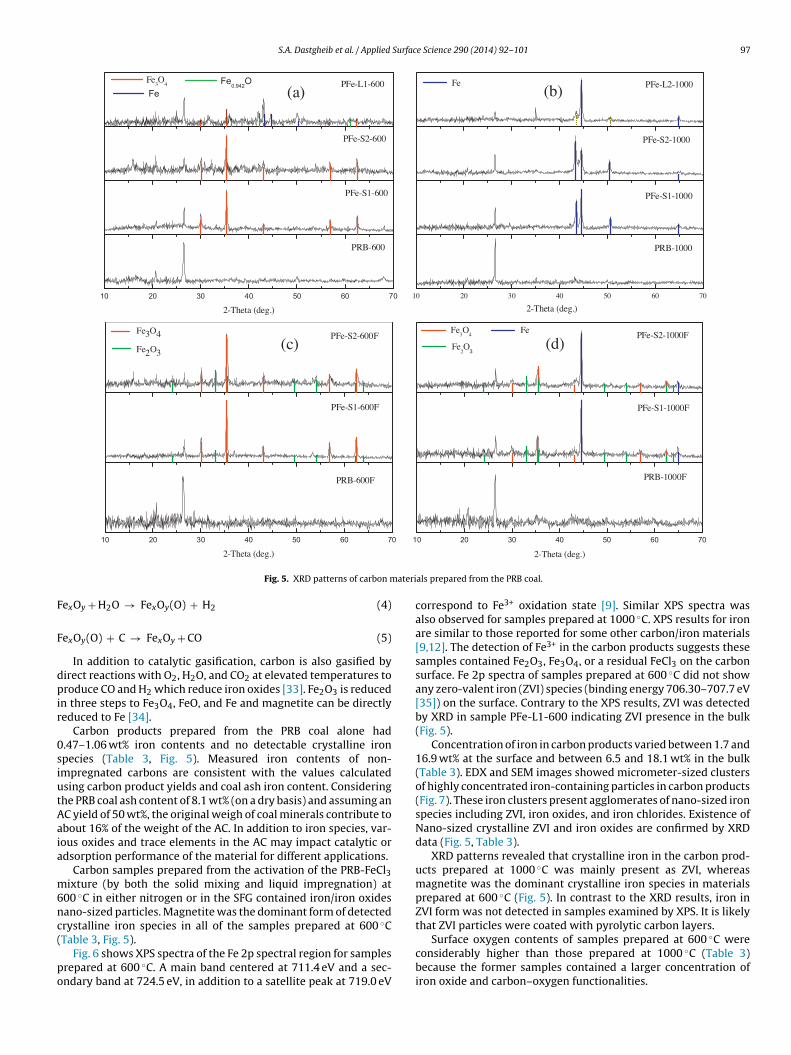
Carbon products prepared from the PRB coal alone had.47–1.06 wt% iron contents and no detectable crystalline ironpecies (Table 3, Fig. 5). Measured iron contents of non-mpregnated carbons are consistent with the values calculatedsing carbon product yields and coal ash iron content. Consideringhe PRB coal ash content of 8.1 wt% (on a dry basis) and assuming anC yield of 50 wt%, the original weigh of coal minerals contribute tobout 16% of the weight of the AC. In addition to iron species, var-ous oxides and trace elements in the AC may impact catalytic ordsorption performance of the material for different applications.
Carbon samples prepared from the activation of the PRB-FeCl3ixture (by both the solid mixing and liquid impregnation) at
00 ◦C in either nitrogen or in the SFG contained iron/iron oxidesano-sized particles. Magnetite was the dominant form of detectedrystalline iron species in all of the samples prepared at 600 ◦C
Table 3, Fig. 5).Fig. 6 shows XPS spectra of the Fe 2p spectral region for samplesrepared at 600 ◦C. A main band centered at 711.4 eV and a sec-ndary band at 724.5 eV, in addition to a satellite peak at 719.0 eV
2-Theta (deg.)
als prepared from the PRB coal.
correspond to Fe3+ oxidation state [9]. Similar XPS spectra wasalso observed for samples prepared at 1000 ◦C. XPS results for ironare similar to those reported for some other carbon/iron materials[9,12]. The detection of Fe3+ in the carbon products suggests thesesamples contained Fe2O3, Fe3O4, or a residual FeCl3 on the carbonsurface. Fe 2p spectra of samples prepared at 600 ◦C did not showany zero-valent iron (ZVI) species (binding energy 706.30–707.7 eV[35]) on the surface. Contrary to the XPS results, ZVI was detectedby XRD in sample PFe-L1-600 indicating ZVI presence in the bulk(Fig. 5).
Concentration of iron in carbon products varied between 1.7 and16.9 wt% at the surface and between 6.5 and 18.1 wt% in the bulk(Table 3). EDX and SEM images showed micrometer-sized clustersof highly concentrated iron-containing particles in carbon products(Fig. 7). These iron clusters present agglomerates of nano-sized ironspecies including ZVI, iron oxides, and iron chlorides. Existence ofNano-sized crystalline ZVI and iron oxides are confirmed by XRDdata (Fig. 5, Table 3).
XRD patterns revealed that crystalline iron in the carbon prod-ucts prepared at 1000 ◦C was mainly present as ZVI, whereasmagnetite was the dominant crystalline iron species in materialsprepared at 600 ◦C (Fig. 5). In contrast to the XRD results, iron inZVI form was not detected in samples examined by XPS. It is likelythat ZVI particles were coated with pyrolytic carbon layers.
Surface oxygen contents of samples prepared at 600 ◦C wereconsiderably higher than those prepared at 1000 ◦C (Table 3)because the former samples contained a larger concentration ofiron oxide and carbon–oxygen functionalities.

98 S.A. Dastgheib et al. / Applied Surface Science 290 (2014) 92– 101
740 730 720 710 700
100
150
200
250
300
120
140
160
120
140
160
724.7 eV 711.5 eV
Ele ctron bind ing ene rgy (eV)
PFe-S2-60 0
724.7 eV 711.5 eV
CP
S (A
rbitr
ary
Uni
ts)
PFe-S1 -60 0
PFe-L1-60 0
711.5 eV724.7 eV
210 20 5 20 0 195 19 0
25
50
75
100
50
100
150
25
50
75
C-Cl
ioni c ClPFe-S1- 600
Electron Binding En ergy (eV)
C-Clionic Cl
PFe-S2-60 0
CPS
(A
rbit
rary
Uni
ts)
PFe-L1-60 0 ionic Cl
C-Cl
gure)
iSchhcsrr
cpbtt
iiwm
p6Ftcftt
3
c(
Fig. 6. XPS Fe 2p (left figure) and Cl 2p (right fi
Surface concentrations of iron in carbon products increased byncreasing the FeCl3 content in the PRB coal (i.e., PFe-S1-600 vs. PFe-2-600; and PFe-S1-1000 vs. PFe-S2-1000) (Table 3). The bulk ironontent of carbon products (except PFe-S2-600) was significantlyigher than the surface iron concentration. Similar observationsave been reported for an iron/carbon material prepared from ferrichloride and lignin [12]. This is likely due to partial coating of ironpecies by pyrolytic carbon formed during the pyrolysis/activationeaction, similar to the formation of carbon encapsulated iron mate-ials [22,23].
Iron contents of samples prepared in the SFG at 600 ◦C wereomparable to those prepared in nitrogen. However, samples pre-ared at 1000 ◦C in the SFG contained a larger concentration ofulk iron because the yield of carbon product was lower at 1000 ◦Chan 600 ◦C (Fig. 4) due to higher carbon burn-off at the higheremperature.
Sample PFe-L1-600 contained crystalline Fe, Fe0.942O and Fe3O4ron species; however, sample PFe-S1-600 prepared by the solidmpregnation method contained only crystalline Fe3O4. ZVI species
ere detected for samples prepared by solid or liquid impregnationethod at 1000 ◦C (PFe-L2-1000 and PFe-S2-1000) (Table 3, Fig. 5).Fe3O4 was the only crystalline iron species identified in samples
repared by the solid mixing method and activated in nitrogen at00 ◦C; however, samples activated in the SFG contained crystallinee3O4 and Fe2O3. Samples activated in nitrogen at 1000 ◦C con-ained crystalline ZVI, but samples prepared in the SFG containedrystalline Fe2O3 and Fe3O4 (Table 3, Fig. 5). Iron oxide species areormed at 1000 ◦C in samples activated in the SFG (compared tohose prepared in nitrogen) because oxidizing gases are present inhe pyrolysis atmosphere.
.3. Surface functionalization with chlorine
PRB coal had a negligible chlorine content while the surfacehlorine content of the prepared samples were up to 27.4 wt%Table 3). Surface chlorine concentrations in carbon products
spectra of selected samples prepared at 600 ◦C.
increased with increasing the amount of FeCl3 mixed with the PRBcoal (i.e., PFe-S1-600 vs. PFe-S2-600; and PFe-S1-1000 vs. PFe-S2-1000) (Table 3).
Cl 2p spectra of samples prepared at 600 ◦C showed peaks forboth covalent C Cl bond and ionic chloride [24] on the carbon sur-faces (Fig. 6). Insufficient reaction time for complete conversion ofFeCl3 to iron/iron oxide species during the activation process couldhave contributed to the presence of iron chlorides in the sample. Nocrystalline FeCl3/FeCl2 was detected by XRD in any of the samples.
Surface composition XPS data of the top ∼30 A layers indicatethat the concentration of surface chlorine in the carbon productsproduced at 600 ◦C was between 6.2 and 27.4 wt% compared tobetween 0.6 and 13.2 wt% total bulk chlorine. EDX elemental map-ping revealed that chlorine was more uniformly dispersed than iron(Fig. 7) in the carbon products, confirming a previously reportedobservation [27].
Samples prepared at 600 ◦C in nitrogen or in the SFG containedlarge amounts of well-dispersed chlorine (Table 3, Fig. 7) in theform of either C Cl or ionic Cl (Fig. 6). The surface Cl concen-tration was higher than the bulk Cl concentration, indicating apreferential surface rather than bulk Cl incorporation (Table 3).Formation of C Cl bonds at the edges of graphene layers hasbeen reported for chlorinated activated carbon and carbon black[36,37].
Carbon products prepared at 1000 ◦C in nitrogen had a negli-gible Cl bulk content but a considerable surface Cl concentration.XPS results of samples prepared at 1000 ◦C showed Cl 2p spectrasimilar to those observed for samples prepared at 600 ◦C. Samplesprepared at 1000 ◦C contained lesser amounts of surface chlorinethan samples prepared at 600 ◦C (Table 3) because the C Cl bondis less stable at 1000 ◦C than 600 ◦C. The thermal stability of C Clfunctionalities at carbon graphene edges significantly decreases at
temperatures above 700 ◦C [37].Sample PFe-S1-600, prepared by the solid mixing method,had a comparable bulk Cl content but a considerably higher sur-face Cl content than sample PFe-L1-600 prepared by the liquid

S.A. Dastgheib et al. / Applied Surface Science 290 (2014) 92– 101 99
iron fo
ipmsi
Fig. 7. SEM pictures and EDX elemental mapping of chlorine and
mpregnation method. A similar trend was observed for sam-les PFe-S2-1000 and PFe-L2-1000 (Table 3). In the solid mixing
ethod, FeCl3 powder is mainly in contact with the externalurfaces of the coal particles and has limited access into thenternal pore structure of the coal. In contrast, FeCl3 molecules
r samples prepared from the PRB coal under different conditions.
penetrate into the internal pore structure of the coal during theliquid impregnation method because FeCl3 is dissolved in water.
FeCl3 or products from its reactions preferentially react at externalsurfaces of coal, thus, forming a higher concentration of chlorine onthe external surfaces of carbon particles. Another possibility is that
100 S.A. Dastgheib et al. / Applied Surface Science 290 (2014) 92– 101
Fr
sc
sSaoc
3
iikccm[
ctatplfensciparo
AuLn
alytic wet air oxidation (CWAO) of phenol or mercury adsorption
ig. 8. Conversion of phenol by selected materials after 2 h reaction in CWAO slurryeactor at 135–142 ◦C and 420–438 psia.
amples prepared by solid impregnation method retain a higheroncentration of residual iron chlorides on their external surfaces.
Samples prepared in the SFG had lower chlorine contents thanamples prepared in nitrogen at 600 and 1000 ◦C (i.e., sample PFe-1-600F vs. PFe-S1-600; sample PFe-S1-1000F vs. PFe-S1-1000;nd sample PFe-S2-1000F vs. PFe-S2-1000). This is likely becausether reactive gases (e.g., H2O and O2 in the SFG) compete with thehlorine species to react with carbon surface sites.
.4. Application potential of materials prepared by AFI method
Catalytic reactivity of three AC products for CWAO of phenoln a semi-continuous slurry reactor was measured. Phenol andts derivatives exist in different industrial wastewaters. They arenown as refractory compounds that are not easily treatable byonventional biological treatment processes. CWAO by activatedarbon is a promising process for phenol oxidation, and transitionaletals deposited on carbon supports can enhance phenol oxidation
2].Results of phenol oxidation are shown in Fig. 8. Phenol oxidation
onversion by the baseline carbon (PRB-600F) is 0.45 while those ofhe two iron impregnated carbons (PFe-S1-600F and PFe-L1-600)re about 0.8. Based on the batch adsorption data at 20 ◦C (usinghe same carbon-to-phenol ratio used in the CWAO experiments),henol adsorption uptake of the three AC samples corresponds to
ess than 20% reduction in the initial phenol concentration. There-ore, the observed decrease in the phenol concentration in CWAOxperiments is primarily due to phenol oxidation. Enhanced phe-ol oxidation by iron-impregnated carbons is attributed to theirignificantly higher iron content and surface area. However, ironontent appears to be more critical because PFe-S1-600F with anron content of 9.25% and surface area of 356 m2/g showed a higherhenol conversion than PFe-L1-600 with an iron content of 6.54%nd surface area of 393 m2/g. These AC samples also contain chlo-ine species. Possible catalytic impacts of chlorine species on phenolxidation are not known.
Adsorption of mercury from a 10 ppm HgCl2 solution onto three◦
C samples was measured at 20 C. Results indicate that mercuryptakes by two FeCl3-impregnated samples, PFe-S1-600F and PFe-1-600, were almost double the uptake by PRB-600F that wasot impregnated with iron chloride (Fig. 9). The size of hydrated
Fig. 9. Mercury removal from 10 ppm HgCl2 solution at 20 ◦C by selected sorbents.
mercury ion (Hg(H2O)62+) is estimated as 7.36 ´A based on a Hg O
distance of 2.34 ´A, size of oxygen atom (1.34 ´A) in the coordinatedwater molecule, and an octahedron configuration [38]. Therefore
AC pores that are smaller than 7 ´A are not available to mercury. Pore
volumes larger than 7 ´A in samples PFe-S1-600F and PFe-L1-600 are0.045 cm3/g and 0.042 cm3/g, respectively, that are about half ofthat in sample PRB-600F (i.e., 0.088 cm3/g) (Table 1). This indicatesthat enhanced mercury adsorption observed for iron-impregnatedand functionalized carbons cannot be explained on the basis ofaccessible surface area alone and the presence of iron species and/orchlorine contributed to their enhanced performances.
4. Summary and conclusions
A single-step method to prepare functionalized and impreg-nated activated carbon (AFI method) from a sub-bituminous coal isdescribed in this paper. Experimental results revealed:
• Surface area development in carbon products prepared from amixture of the coal and FeCl3 was impacted by the initial FeCl3content of the mixture, the method used (dry or wet) to preparethe mixture, and the activation atmosphere and temperature.Carbon products were microporous with surface areas up to∼800 m2/g and their pore volume distributions depended on thepreparation method. FeCl3 served as an activation agent, but ironspecies also contributed to pore plugging in some carbon prod-ucts.
• Activation conditions and the method of precursor preparationimpacted the concentration, chemical composition, and disper-sion of chlorine and iron species in carbon products. The formof iron depended on the activation conditions. Fe3O4 was thedominant form of crystalline iron in carbon products preparedat 600 ◦C while at 1000 ◦C it was Fe (zero-valent iron).
• Carbon products may contain both adsorption and catalytic sitesand may be useful environmental multi-functional materials toremove or destroy various pollutants. Catalytic or adsorptionperformance of prepared carbon materials was explored for cat-
from aqueous solutions. Results indicated that impregnated acti-vated carbons outperformed similar non-impregnated materialsfor both CWAO of phenol and mercury adsorption applications.
Surfac
A
aTDCKiXrwu
R
[
[
[
[
[
[[[[
[
[[[[[[
[[
[[
[
[
[
[
[
[
S.A. Dastgheib et al. / Applied
cknowledgments
The Electric Power Research Institute (EPRI) is acknowledgeds the main funding source for this work. Zhejiang University ofechnology, China, is recognized for its partial financial support ofr. Jianli Ren while visiting the University of Illinois at Urbana-hampaign. Authors would like to thank Dr. Xinhuai Ye and Ruthaplan from the Illinois State Geological Survey for their assistance
n performing CWAO and mercury adsorption experiments. SEM,PS, and XRD testes were carried out in the Frederick Seitz Mate-ials Research Laboratory Central Facilities, University of Illinois,hich are partially supported by the U.S. Department of Energynder Grants DE-FG02-07ER46453 and DE-FG02-07ER46471.
eferences
[1] F. Derbyshire, M. Jagtoyen, R. Andrews, A. Rao, I. Martin-Gullon, E.A. Grulke,in: L.R. Radovic (Ed.), Chemistry and Physics of Carbon, vol. 27, Marcel Dekker,New York, 2001, pp. 1–65.
[2] F. Stüber, J. Font, A. Fortuny, C. Bengoa, A. Eftaxias, A. Fabregat, Top. Catal. 33(2005) 3–50.
[3] J. Yu, F.J. Tian, C.Z. Li, Energy Fuels 21 (2007) 395–398.[4] J. Yu, F.J. Tian, L.J. Mckenzie, C.Z. Li, Trans. IChemE: B 84 (2006) 125–130.[5] G. Yu, B. Sun, Y. Pei, S. Xie, S. Yan, M. Qiao, K. Fan, X. Xhang, B. Zong, J. Am. Chem.
Soc. 132 (2010) 935–937.[6] S. Terai, H. Fukuyama, K. Uehara, K. Fujimoto, Sekiyu Gakkaishi 43 (2000) 17–24.[7] Q. Chang, W. Lin, W. Ying, J. Hazard. Mater. 184 (2010) 515–522.[8] B. Sunkara, J. Zhan, I. Kolesnichenko, Y. Wang, J. He, J.E. Holland, G.L. McPherson,
V.T. John, Langmuir 27 (2011) 7854–7859.[9] A. Rey, M. Faraldos, J.A. Casas, J.A. Zazo, A. Bahamonde, J.J. Rodríguez, Appl.
Catal. B: Environ. 86 (2009) 69–77.10] F. Duarte, F.J. Maldonado-Hódar, L.M. Madeira, Appl. Catal. B: Environ. 103
(2011) 109–115.11] H. Kim, S. Park, C. Lee, S. Kim, K. Kim, Colloids Surf. B: Biointerfaces 74 (2000)
196–201.12] J.A. Zazo, J. Belia, C.M. Fierro, G. Pliego, J.A. Casas, J.J. Rodriguez, Catal. Today
187 (2012) 115–121.
[[
[
e Science 290 (2014) 92– 101 101
13] E.J. Granite, H.W. Pennline, R.A. Hargis, Ind. Eng. Chem. Res. 39 (2000)1020–1029.
14] L.R. Radovic, F. Rodriguez-Reinoso, Carbon materials in catalysis, in: P.A.Thrower (Ed.), Chemistry and Physics of Carbon, vol. 25, Marcel Dekker, NewYork, 1997, pp. 243–358.
15] C.L. Mangun, K.R. Benak, J. Economy, K.L. Foster, Carbon 39 (2001) 1809–1820.16] S.A. Dastgheib, T. Karanfil, W. Cheng, Carbon 42 (2004) 547–557.17] W. Shen, Z. Li, Y. Liu, Recent Patents Chem. Eng. 1 (2008) 27–40.18] K. Asami, P. Sears, E. Furimsky, Y. Ohtsuka, Fuel Process. Technol. 47 (1996)
139–151.19] J.D. Atkinson, M.E. Fortunato, S.A. Dastgheib, M. Rostam-Abadi, M.J. Rood, K.S.
Suslick, Carbon 49 (2011) 587–598.20] R. Zheng, X. Meng, F. Tang, Eur. J. Inorg. Chem. 20 (2009) 3003–3007.21] F. Yu, J.N. Wang, Z.M. Sheng, L.F. Su, Carbon 43 (2005) 3002–3039.22] J.N. Wang, L. Zhang, F. Yu, Z.M. Sheng, J. Phys. Chem. B 111 (2007) 2119–2124.23] Z. Wang, P. Xiao, N. He, Carbon 44 (2006) 3277–3284.24] S. Suzer, O. Birer, U.A. Sevil, O. Guven, Turk. J. Chem. 22 (1998) 59–65.25] F. Stüber, I. Polaert, H. Delmas, J. Font, A. Fortuny, A. Fabregat, J. Chem. Technol.
Biotechnol. 76 (2001) 743–751.26] K. Miura, M. Aimi, T. Naito, K. Hasimoto, Fuel 65 (1986) 407–411.27] A. Albiniak, D. Bégin, E. Alain, G. Furdin, E. Broniek, J. Kaczmarczyk, Fuel 76
(1997) 1383–1387.28] A.W. Henderson, T.T. Campbell, F.E. Block, Metall. Trans. 3 (1972) 2579–2583.29] P. Tartaj, M.D.-P. Morales, S. Veintemillas-Verdaguer, T. Gonzalez-Carreno, C.J.
Serna, J. Phys. D: Appl. Phys. 36 (2003) R182–R197.30] J.D. Desai, H.M. Pathan, S.K. Min, K.D. Jung, O.S. Joo, Appl. Surf. Sci. 252 (2006)
2251–2258.31] J.D. Desai, H.M. Pathan, S.K. Min, K.D. Jung, O.S. Joo, Appl. Surf. Sci. 252 (2006)
8039–8042.32] J.D. Desai, H.M. Pathan, S-K. Min, K-D. Jung, O.-S. Joo, FT-IR, XPS and PEC char-
acterization of spray deposited hematite thin films, Appl. Surf. Sci. 252 (2005)1870–1875.
33] D.W. McKee, in: P.A. Walker Jr., P.A. Thrower (Eds.), Chemistry and Physics ofCarbon, vol. 16, Marcel Dekker, New York, 1981, pp. 2–112.
34] R. Longbottom, L. Kolbeinsen, Proceedings of the 4th UIcos Seminar – NewDirect Reduction (DR), October 2008.
35] M. Descostes, F. Mercier, N. Thromat, C. Beaucaire, M. Gautier-Soyer, Appl. Surf.
Sci. 165 (2000) 288–302.36] E. Papirer, R. Lacroix, J. Donnet, G. Nansé, P. Fioux, Carbon 33 (1995) 63–72.37] A.F. Pérez-Cadenas, F.J. Maldonado-Hódar, C. Moreno-Castilla, Carbon 41
(2003) 473–478.38] I. Persson, Pure Appl. Chem. 82 (2010) 1901–1917.