prepared by afra`a sayah. introduction. weekly tasks. plane phase. analysis phase. design phase....
TRANSCRIPT
ICS 413SOFTWARE ENGINEERING
Prepared by
Afra`a Sayah
OUTLINE
Introduction.
Weekly Tasks.
Plane Phase.
Analysis Phase.
Design Phase.
Report Rules.
Conclusion.2
OBJECTIVES Learn the software development life
cycle (project management, requirements engineering, systems modeling, software design, prototyping, and testing).
Perform the software phases by developing a complete and consist software.
Learn how to work in a team and develop leadership skills.
Learn the UML for visual modeling.
3
INTRODUCTION
In this course Lab you will perform the software development life cycle by creating a project in a team work environment and use the UML for analyzing and designing your project. you will go through three phases:
1. Plane Phase.2. Analysis Phase.3. Design Phase.
4
PROJECT WEEKLY TASKS
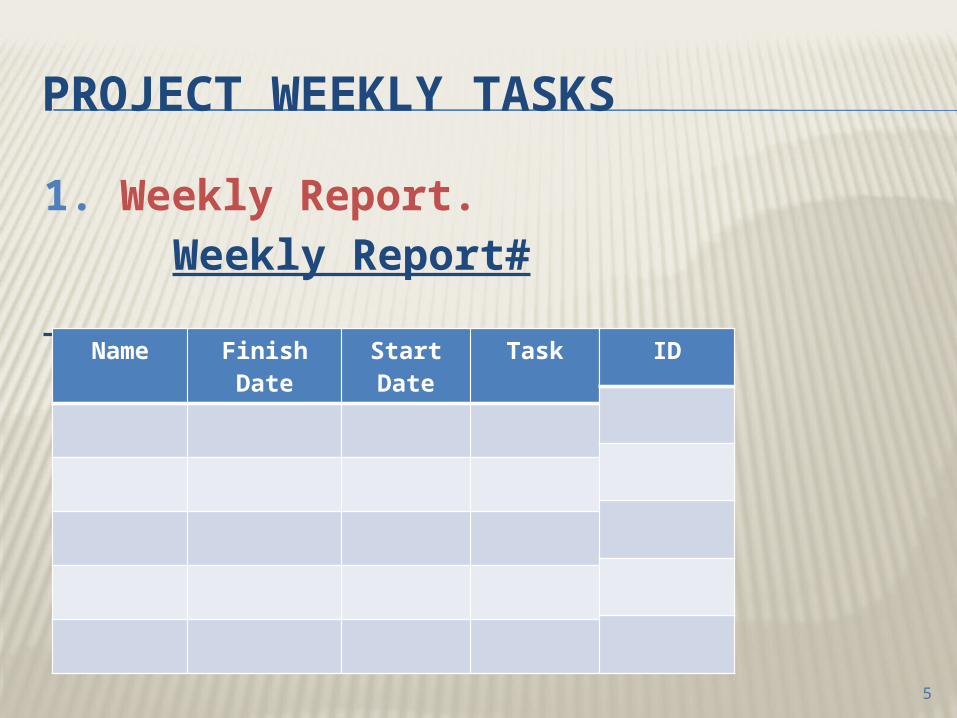
1. Weekly Report.Weekly Report#
Name Finish Date Start Date Task ID
5
PROJECT WEEKLY TASKS
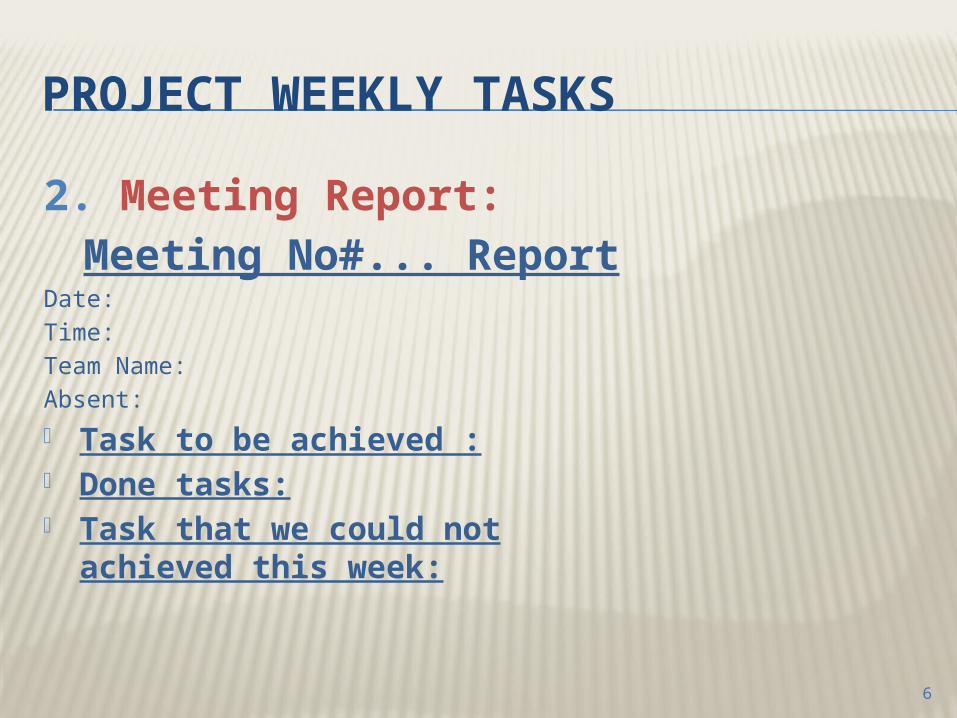
2. Meeting Report:Meeting No#... Report
Date: Time:Team Name:Absent:
Task to be achieved : Done tasks: Task that we could not achieved
this week:
6
PLANE PHASE1. Description: Define the place or the activity that your system will work on, the problem that it face and the solutions and new activity that your system will provide generally.
7
PLANE PHASE2. Problem Statement. Identify all problems that led you to develop your system.3. Benefits of the
System. Describe the solutions
that the system provides or the new functions that it adds.
4. Solution Methodology.
8
PLANE PHASE
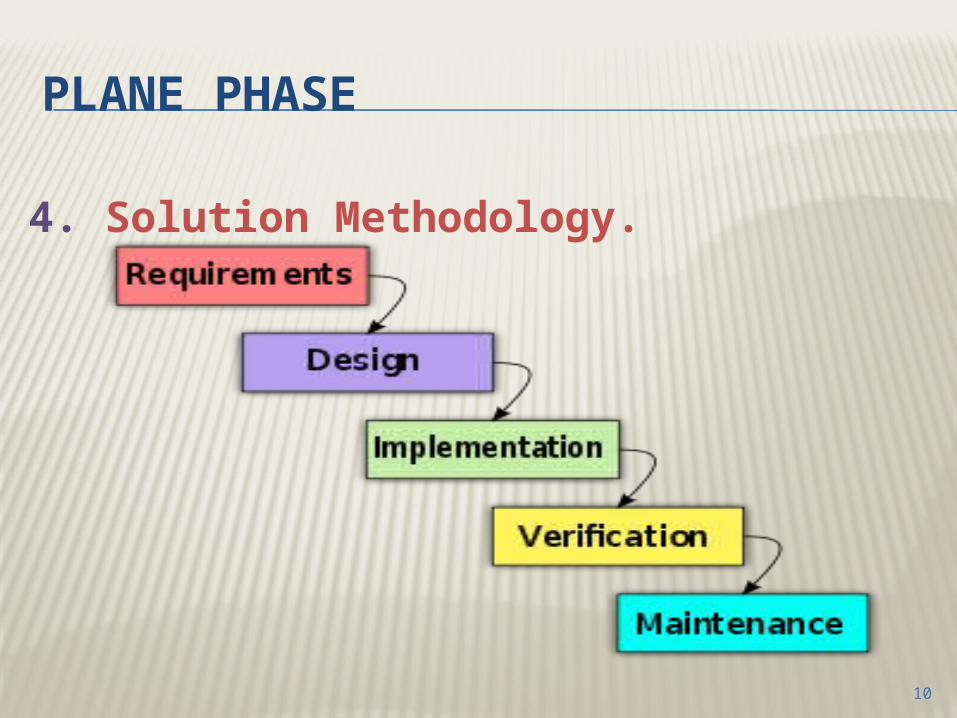
4. Solution Methodology. We are going to use the waterfall model which
is a system development life cycle model that uses a linear and sequential approach. This model contain five phases as following:
9
PLANE PHASE
4. Solution Methodology.
10
PLANE PHASE
5. Environment: Indorse or outdoors.
11
PLANE PHASE
5. Requirements Analysis: Requirements analysis is critical to the success of a software development. Requirements must be actionable, measurable, testable, clear and meets the needs or constrains, and defined to a level of detail sufficient for system design. 12
PLANE PHASE
1.Identifaying Stakeholders: Stakeholders: Any person who has an interest (direct or indirect) in the project. A stakeholder is not necessarily an actor. But an actor is usually a stakeholder.
13
PLANE PHASE
2. Elicit Requirements:1. Interviewing: Avoid misleading questions. Keep questions short and precise. Check that questions are understood.
14
PLANE PHASE
2. Elicit Requirements:2. Questioner: You will ask about Context and background. Current system or operations. Problems and limitations in the current
system. Requirements for a new system,
improvement, new functions etc.
15
PLANE PHASE
3. Requirement Gathering: Document all the system functions that you have generate from the electing requirement stage.
16
PLANE PHASE
4. Define the Types of Requirements:1. Functional Requirements: What the system should do.2. Non Functional Requirements: Properties and constrains the system
should acquire.
17
PLANE PHASE
Non Functional Requirements: You will study them from the
fallowing views: Business Goals View. Security View. Accessibility and Look-and-Feel View. Efficiency View. The Interface Metaphor or Analogy. Interface Structure Design.
18
ANALYSIS PHASE
ANALYSIS PHASE
The analysis phase is where we show how the system will operates by dividing it into component and understand each one and how they interact with each other.
20
ANALYSIS PHASE
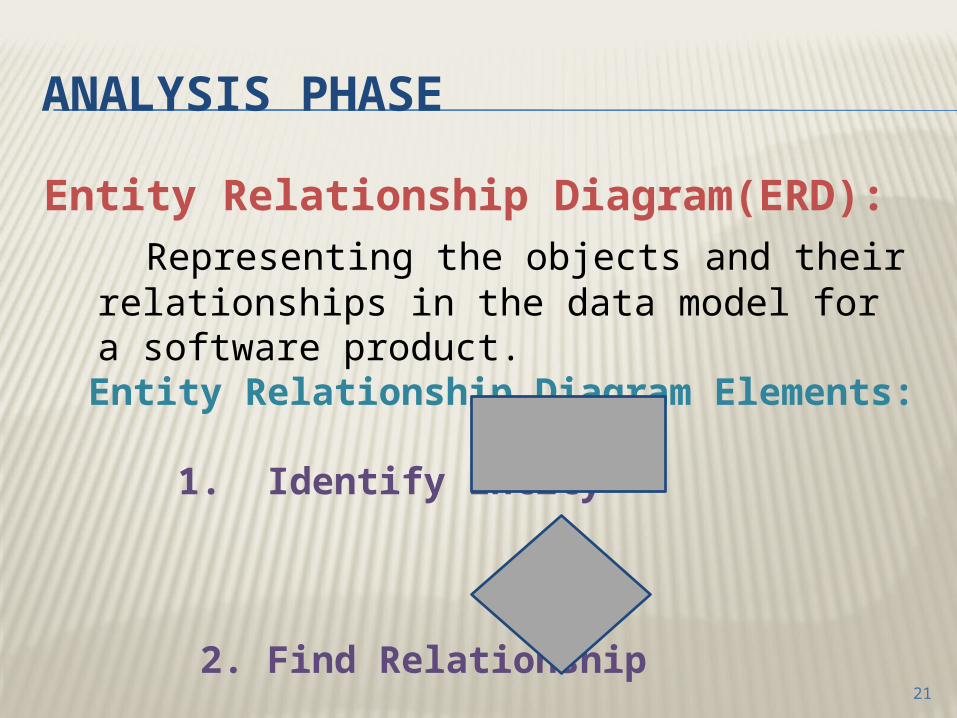
Entity Relationship Diagram(ERD):
Representing the objects and their relationships in the data model for a software product.
Entity Relationship Diagram Elements: 1. Identify Entity
2. Find Relationship
21
ANALYSIS PHASE
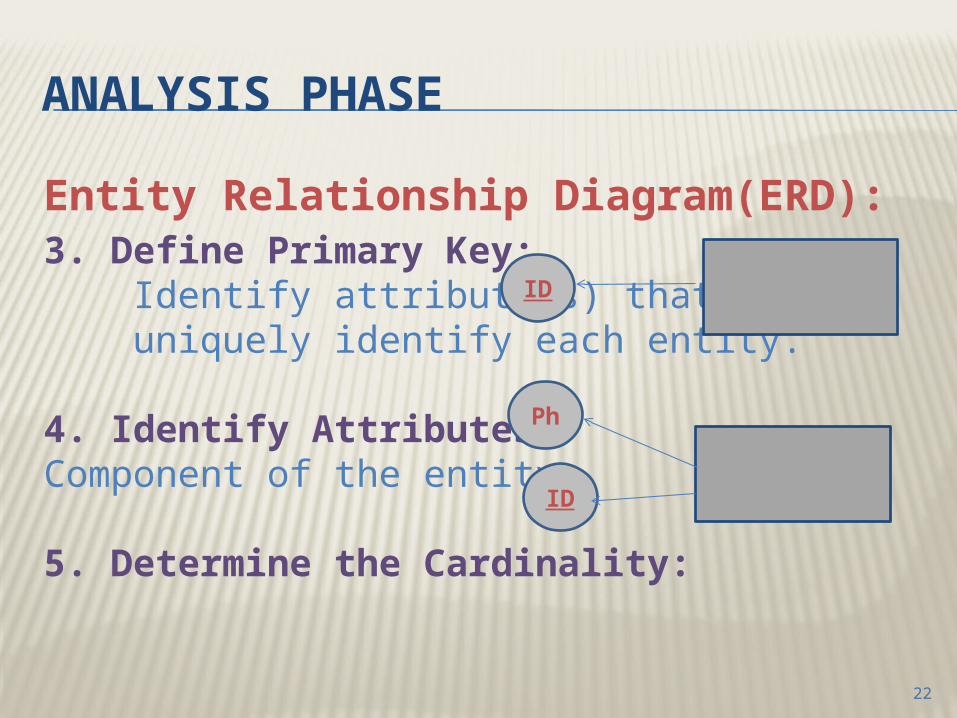
Entity Relationship Diagram(ERD):3. Define Primary Key: Identify attribute(s) that uniquely identify each entity.
4. Identify Attributes:Component of the entity.
5. Determine the Cardinality:
ID
Ph
ID
22
ANALYSIS PHASE
UML Diagrams:Unified Modeling Language (UML) is a
standardized general-purpose modeling language.
It `s capture the structure and behavior of the system components , show how the elements of the system interact together in an unambiguous way and it`s gives consistency between a design and its implementation.
23
ANALYSIS PHASE
UML Diagrams: Consists of: Use Case Diagram.Class Diagram. Interaction Diagrams Sequence Diagram. Collaboration Diagram. Object Diagram.
24
ANALYSIS PHASE
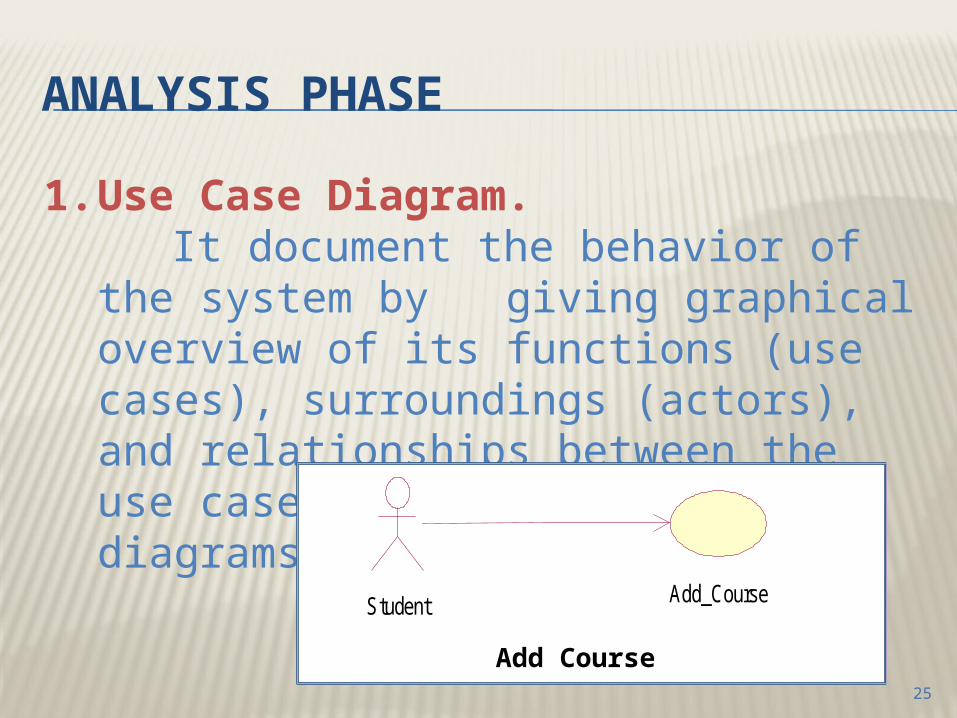
1. Use Case Diagram. It document the behavior of the system by
giving graphical overview of its functions (use cases), surroundings (actors), and relationships between the use cases and actors (use case diagrams).
Student Add_Course
Add Course25
ANALYSIS PHASE
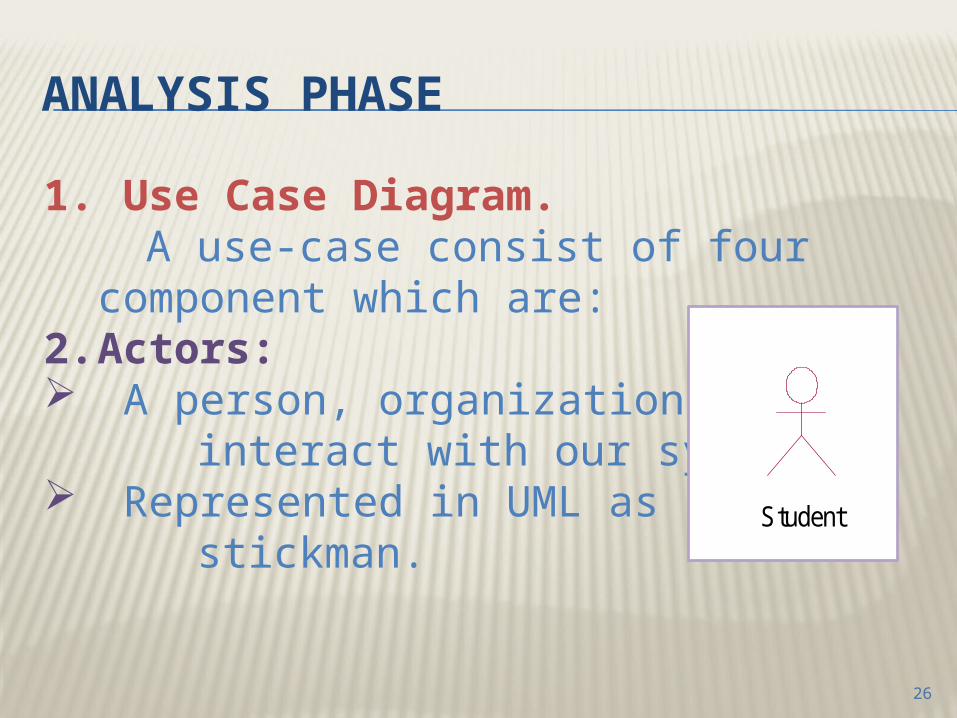
1. Use Case Diagram. A use-case consist of four component which are:2. Actors: A person, organization, that interact with our system. Represented in UML as a stickman.
Student
26
ANALYSIS PHASE
1. Use Case Diagram.
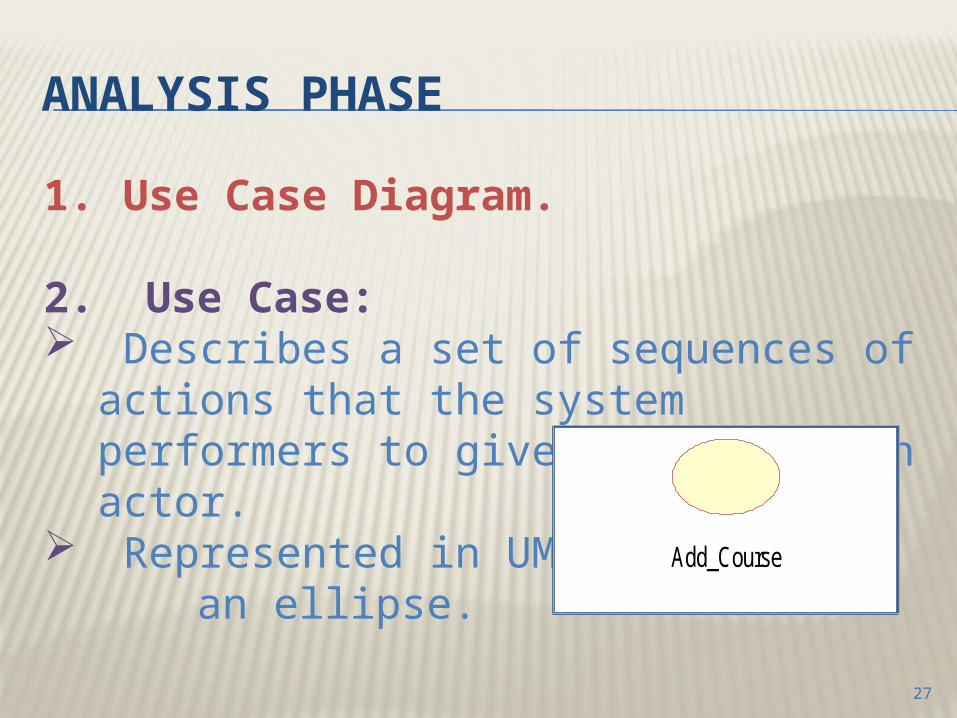
2. Use Case: Describes a set of sequences of actions that the
system performers to give a value to an actor. Represented in UML as an ellipse.
Add_Course
27
ANALYSIS PHASE
1. Use Case Diagram.
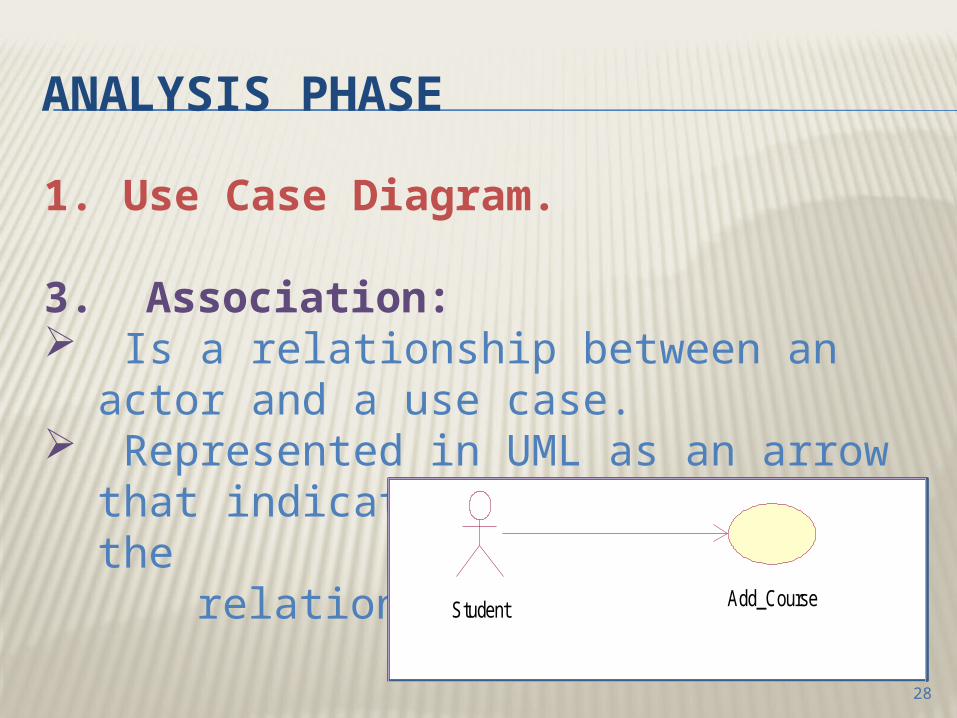
3. Association: Is a relationship between an actor and a use
case. Represented in UML as an arrow that indicates
who initiates the relationship.
Student Add_Course
28
ANALYSIS PHASE
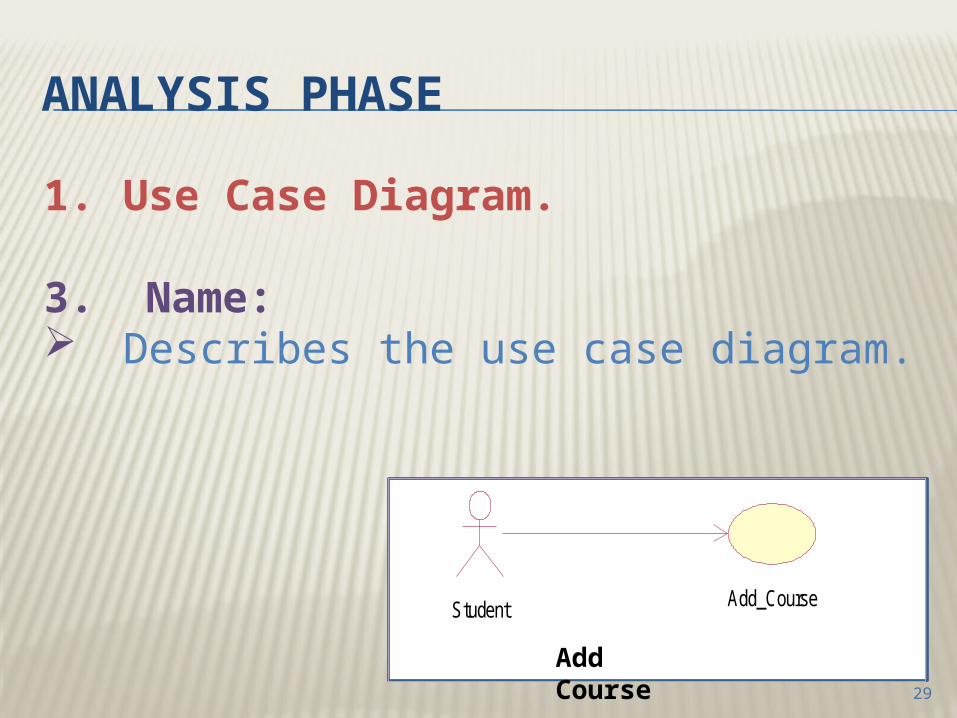
1. Use Case Diagram.
3. Name: Describes the use case diagram.
Student Add_Course
Add Course29
ANALYSIS PHASE
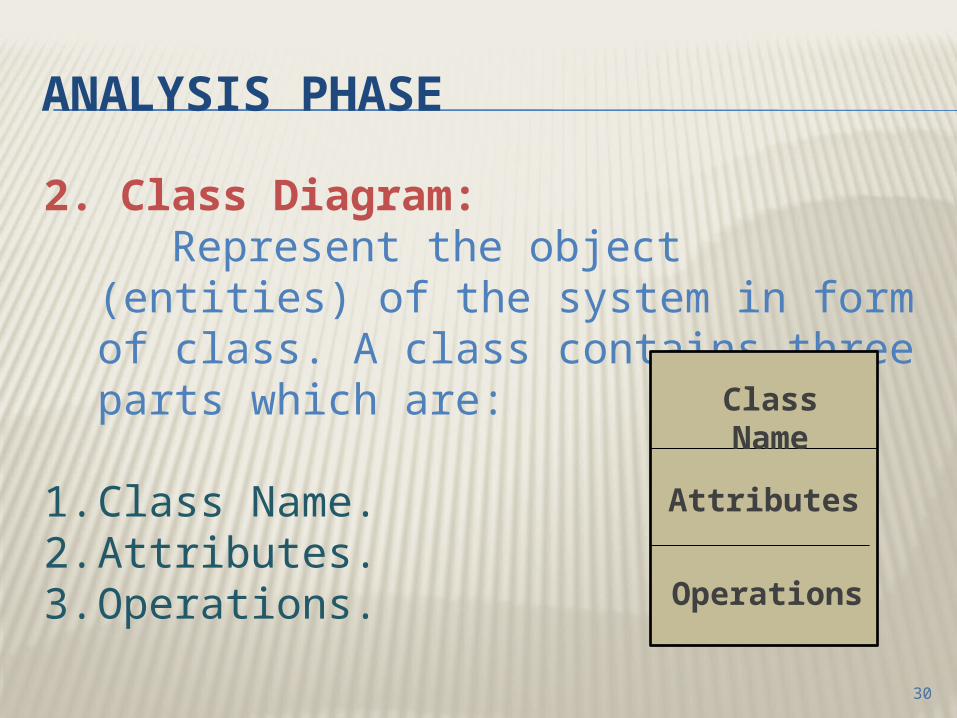
2. Class Diagram: Represent the object (entities) of the system in
form of class. A class contains three parts which are:
1. Class Name.2. Attributes.3. Operations.
Attributes
Class Name
Operations
30
ANALYSIS PHASE
3. Interaction Diagram: 1.Sequence Diagram:A sequence diagram in Unified Modeling
Language (UML) is a kind of interaction diagram that shows how processes operate with one another and in what order. It is a construct of a message sequence chart. Sequence diagrams are sometimes called event diagrams, event scenarios, and timing diagrams.
31
32
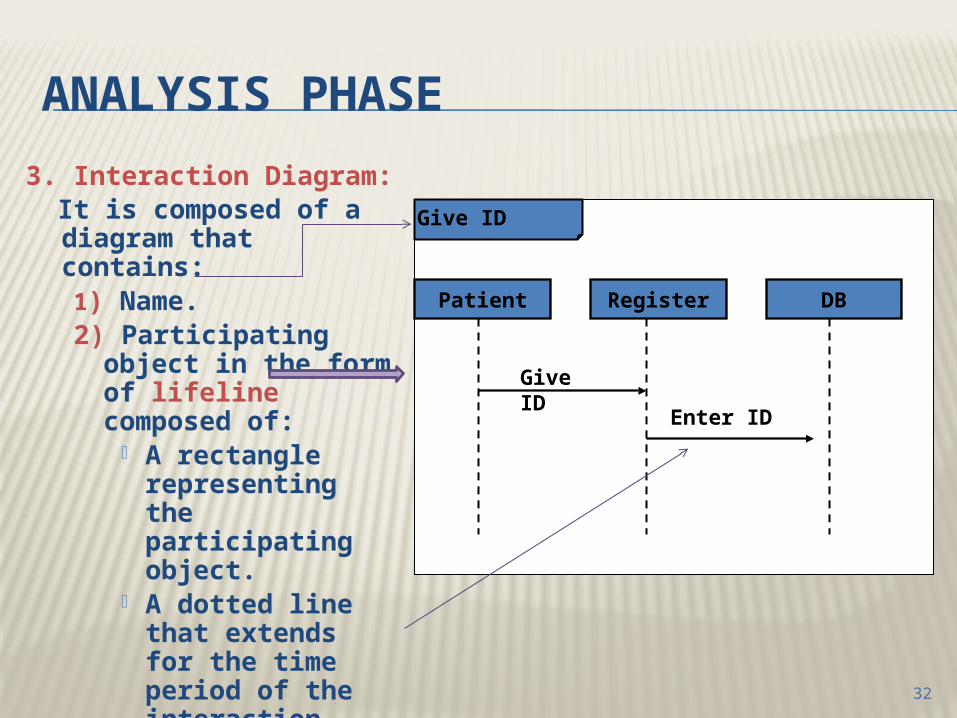
ANALYSIS PHASE 3. Interaction Diagram: It is composed of a diagram
that contains:1) Name.2) Participating object in
the form of lifeline composed of:
A rectangle representing the participating object.
A dotted line that extends for the time period of the interaction.
3) Messages to communicate among the participating object.
Give ID
Patient Register DB
Give ID
Enter ID
33
ANALYSIS PHASE
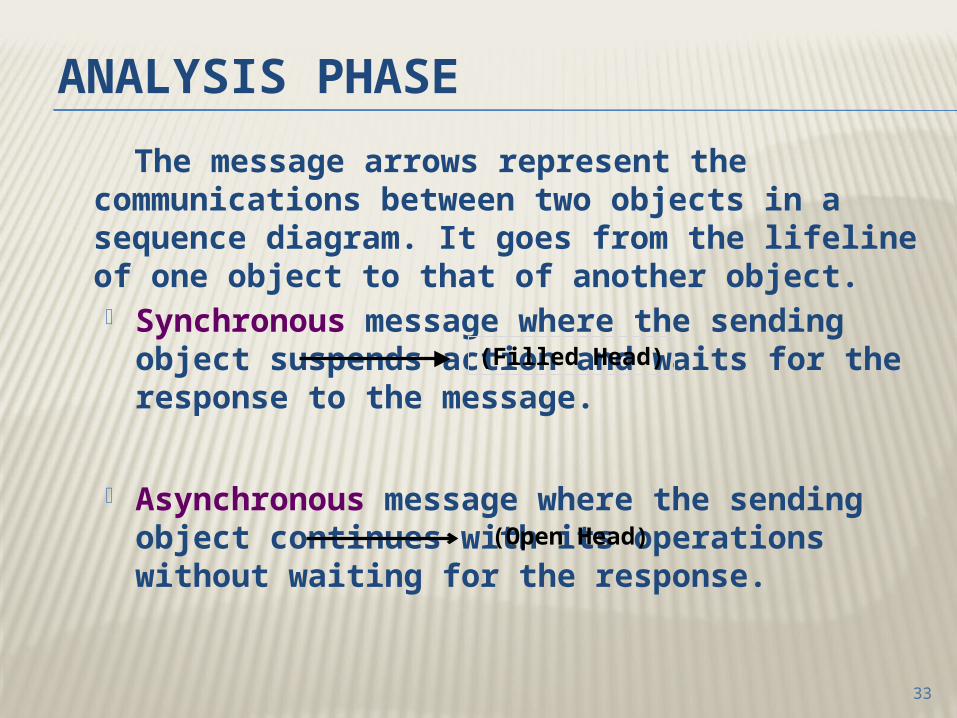
The message arrows represent the communications between two objects in a sequence diagram. It goes from the lifeline of one object to that of another object. Synchronous message where the sending object suspends
action and waits for the response to the message.
Asynchronous message where the sending object continues with its operations without waiting for the response.
(Filled Head)
(Open Head)
34
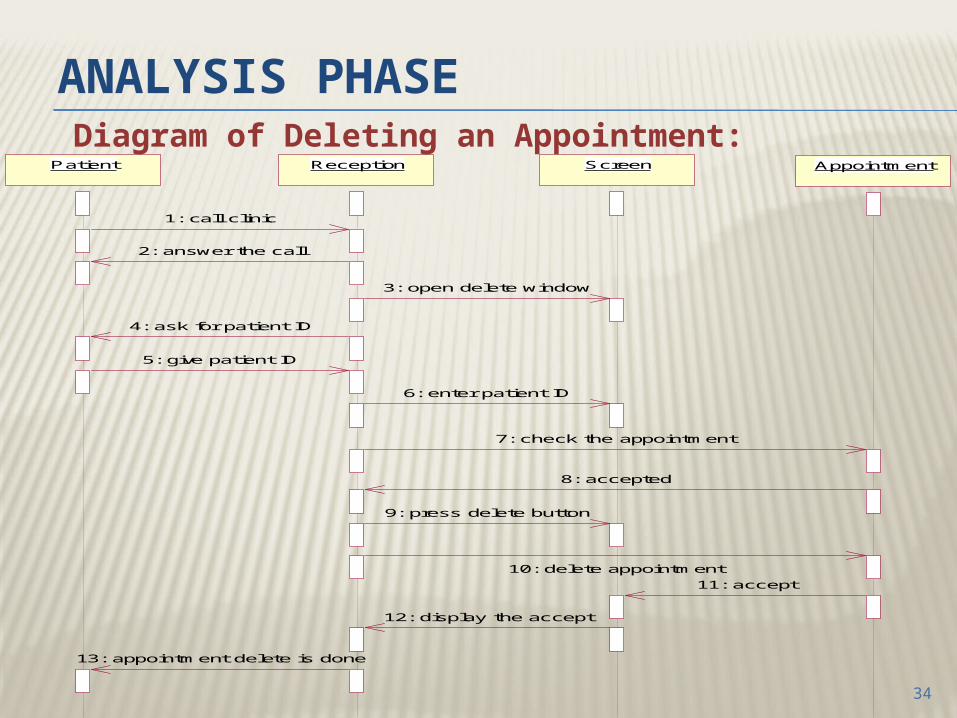
ANALYSIS PHASE
PatientPatient ReceptionReception ScreenScreen AppointmentAppointment
1: call clinic
2: answer the call
3: open delete window
4: ask for patient ID
5: give patient ID
6: enter patient ID
7: check the appointment
10: delete appointment
8: accepted
9: press delete button
11: accept
12: display the accept
13: appointment delete is done
Diagram of Deleting an Appointment:
35
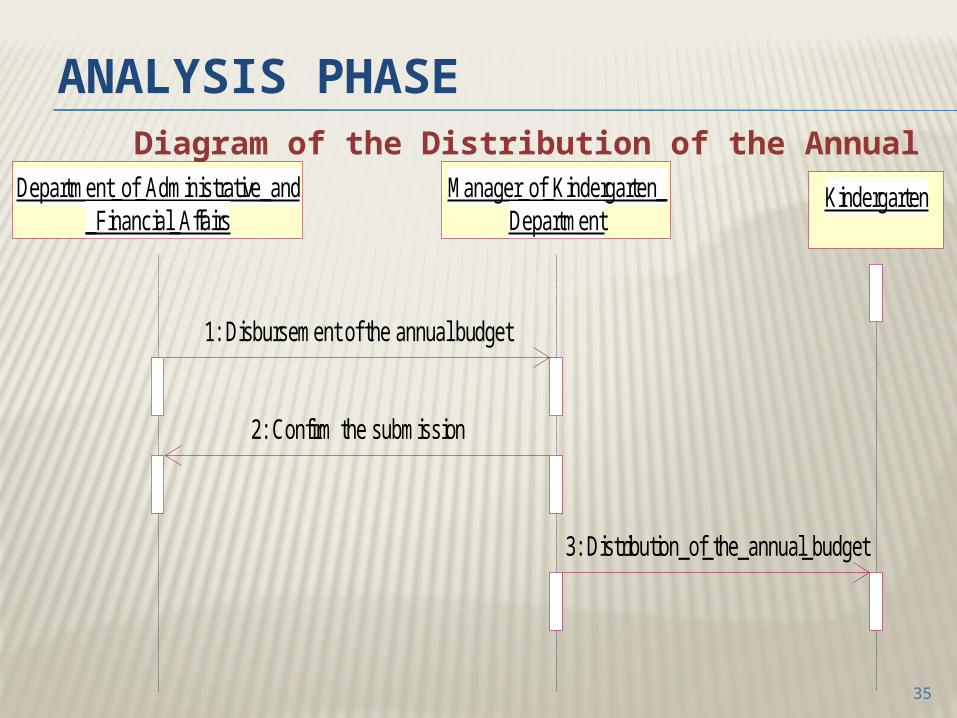
ANALYSIS PHASE Diagram of the Distribution of the Annual Budget:
Department_of_Administrative_and_Financial_Affairs
Department_of_Administrative_and_Financial_Affairs
Manager_of_Kindergarten_Department
Manager_of_Kindergarten_Department
KindergartenKindergarten
1: Disbursement of the annual budget
2: Confirm the submission
3: Distribution_of_the_annual_budget
36
ANALYSIS PHASE
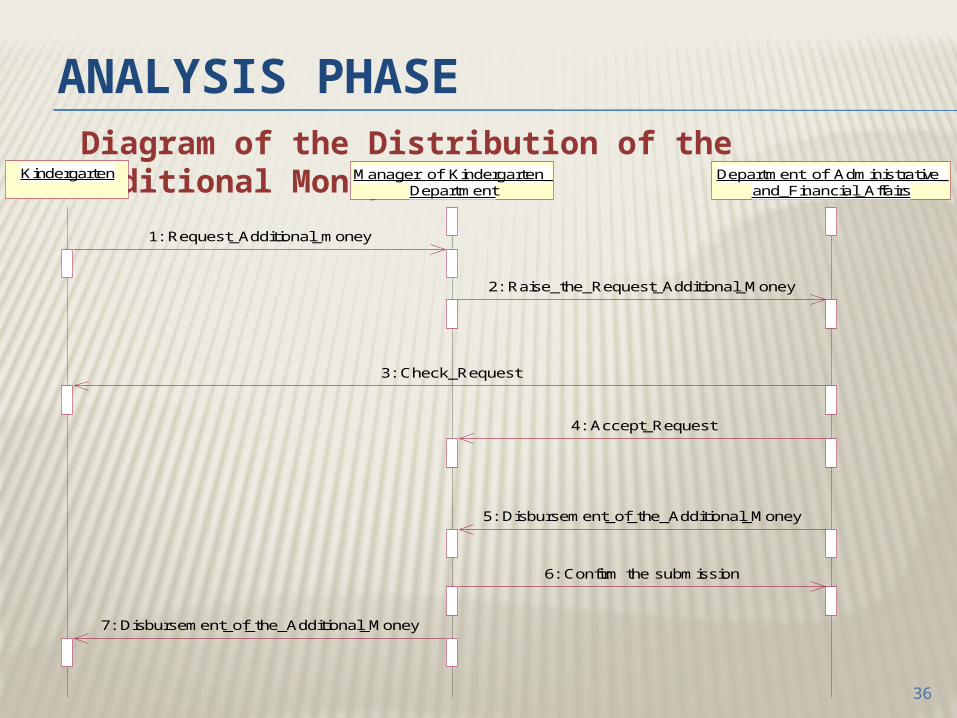
Diagram of the Distribution of the Additional Money:
KindergartenKindergarten Manager_of_Kindergarten_Department
Manager_of_Kindergarten_Department
Department_of_Administrative_and_Financial_Affairs
Department_of_Administrative_and_Financial_Affairs
1: Request_Additional_money
2: Raise_the_Request_Additional_Money
3: Check_Request
4: Accept_Request
5: Disbursement_of_the_Additional_Money
6: Confirm the submission
7: Disbursement_of_the_Additional_Money
37
ANALYSIS PHASE
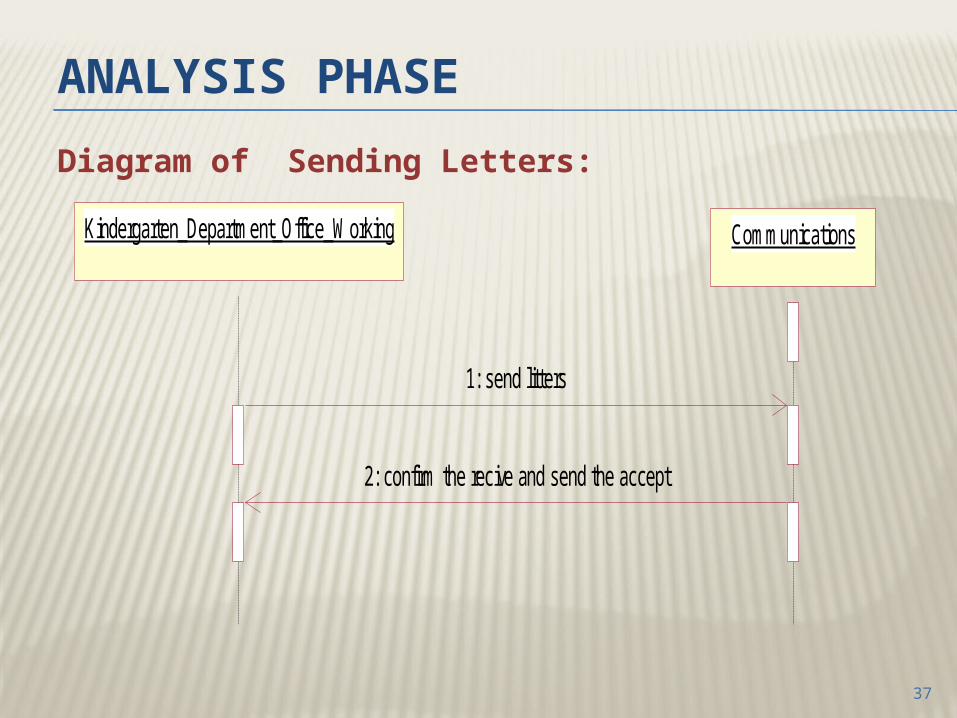
Diagram of Sending Letters:
Kindergarten_Department_Office_WorkingKindergarten_Department_Office_Working CommunicationsCommunications
1: send litters
2: confirm the recive and send the accept
ANALYSIS PHASE
3. Interaction Diagram: 2.Collaboration Diagram: Collaboration diagrams belong to a
group of UML diagrams called interaction diagrams. Collaboration diagrams, like sequence diagrams, show how objects interact over the course of time. However, instead of showing the sequence of events by the layout on the diagram, collaboration diagrams show the sequence by numbering the messages on the diagram.
38
ANALYSIS PHASE
3. Interaction Diagram: 2.Collaboration Diagram: This makes it easier to show how the
objects are linked together, but harder to see the sequence at a glance.
You can develop a collaboration diagram in IBM Rational rose by selecting a sequence and then click on F5.
39
ANALYSIS PHASE
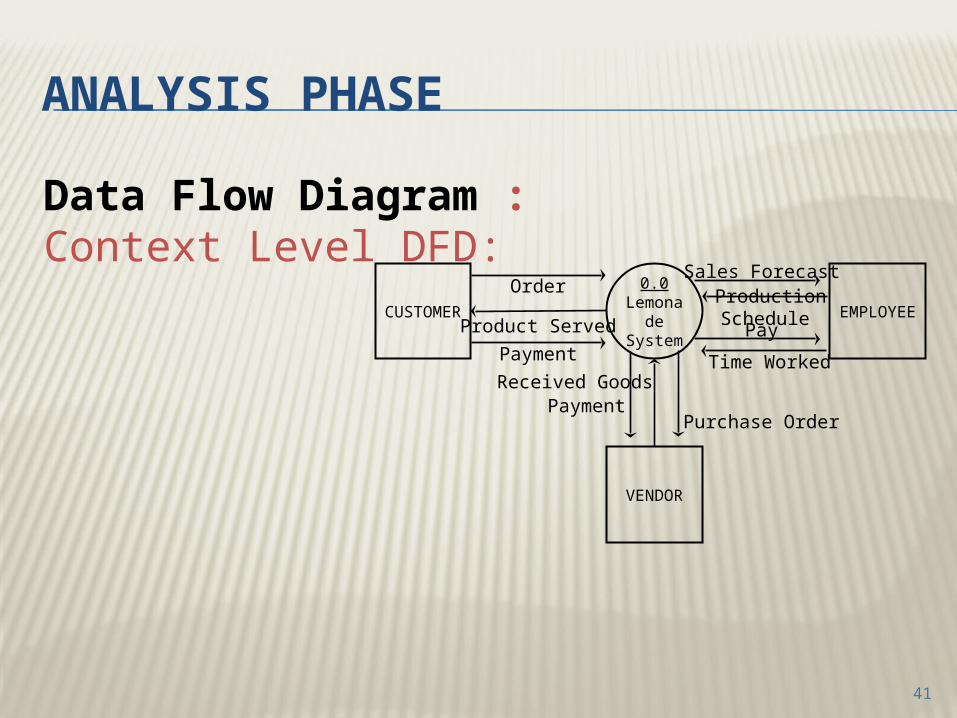
Data Flow Diagram : A data flow data diagram demonstrate the
functional model of a software product. DFDs do not represent program logic like flowcharts do.
40
ANALYSIS PHASE
Data Flow Diagram :Context Level DFD:
41
0.0Lemonade
SystemEMPLOYEECUSTOMER
PayPayment
Order
VENDOR
PaymentPurchase Order
Production Schedule
Received GoodsTime Worked
Sales Forecast
Product Served
ANALYSIS PHASE
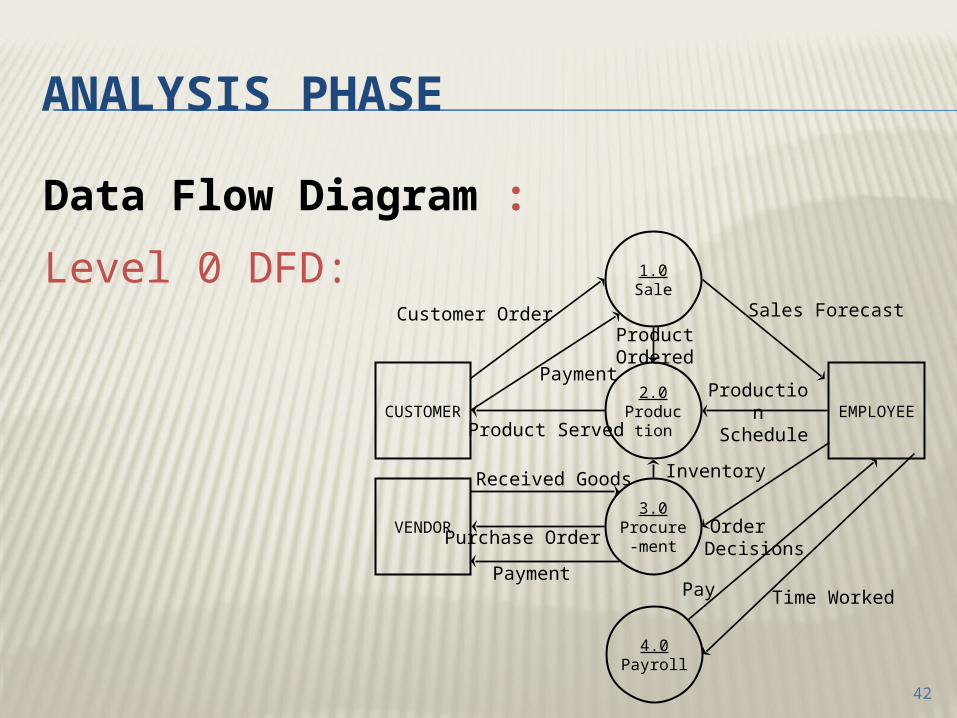
Data Flow Diagram :
Level 0 DFD:
42
2.0Production EMPLOYEEProduction
Schedule
1.0Sale
3.0Procure-
ment
Sales Forecast
Product Ordered
CUSTOMER
Pay
Payment
Customer Order
VENDOR
Payment
Purchase Order Order Decisions
Received Goods
Time Worked
Inventory
Product Served
4.0Payroll

44