prepared by charlie cook the university of west alabama © 2009 south-western, a part of cengage...
Post on 19-Dec-2015
224 views
TRANSCRIPT
Prepared by Charlie CookThe University of West Alabama
© 2009 South-Western, a part of Cengage Learning
Business Statistics: Assignments
Business Statistics: Assignments
Chapter 24

24–2© 2009 South-Western, a part of Cengage Learning
24–3© 2009 South-Western, a part of Cengage Learning
• Business statistics
• Statistics
• Purposes of statistics
• To summarize and report performance
• To analyze options in making decisions
• Average
• Mean
• Median
• Mode
1
T E R M S

24–4© 2009 South-Western, a part of Cengage Learning
Statistical Averages: Computing the Mean
1
E X A M P L E

24–5© 2009 South-Western, a part of Cengage Learning
Determining the Median
2
E X A M P L E
24–6© 2009 South-Western, a part of Cengage Learning
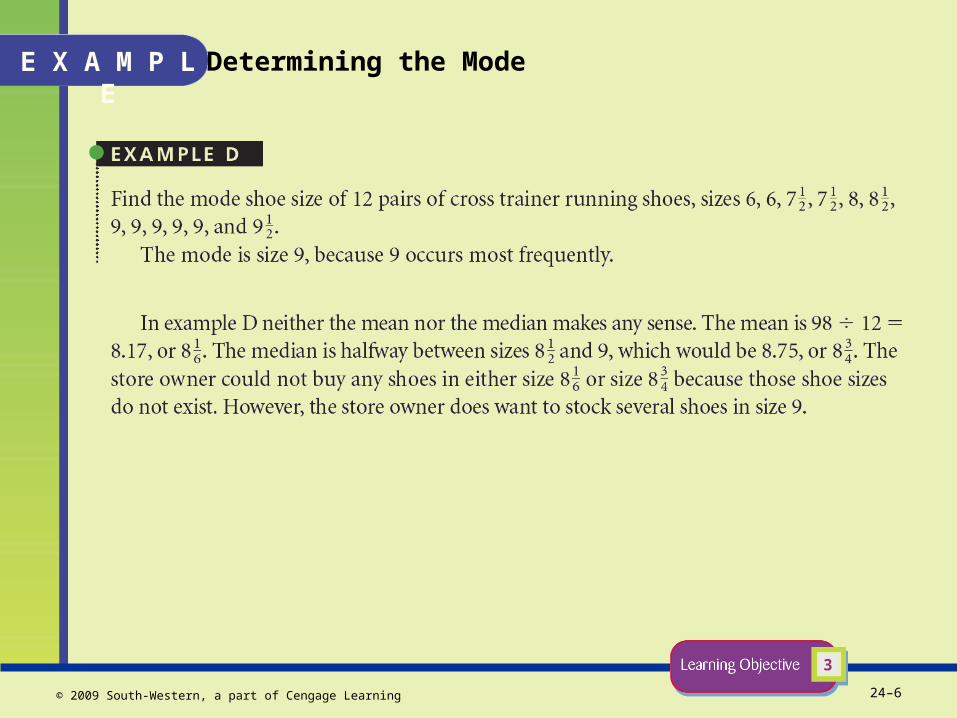
Determining the Mode
3
E X A M P L E

24–7© 2009 South-Western, a part of Cengage Learning
to Develop a Frequency Table
1. Determine the classes of data, and list the classes in one column.
2. Tally the data by making one mark for each data item in the column next to the appropriate class.
3. Count the tally marks for each class and write the number in the column next to the tally marks.
4

24–8© 2009 South-Western, a part of Cengage Learning
Figure 24.1 Frequency Table

24–9© 2009 South-Western, a part of Cengage Learning
to Compute the Mean for a Large Data Set
1. Add all the numbers in each column.
2. Add all the numbers in each row.
3. Compute the grand total by adding all the column totals.
4. Check the grand total by adding all the row totals.
5. Divide the grand total by the number of values to get the mean.
4

24–10© 2009 South-Western, a part of Cengage Learning
Figure 24.2 Histogram
24–11© 2009 South-Western, a part of Cengage Learning
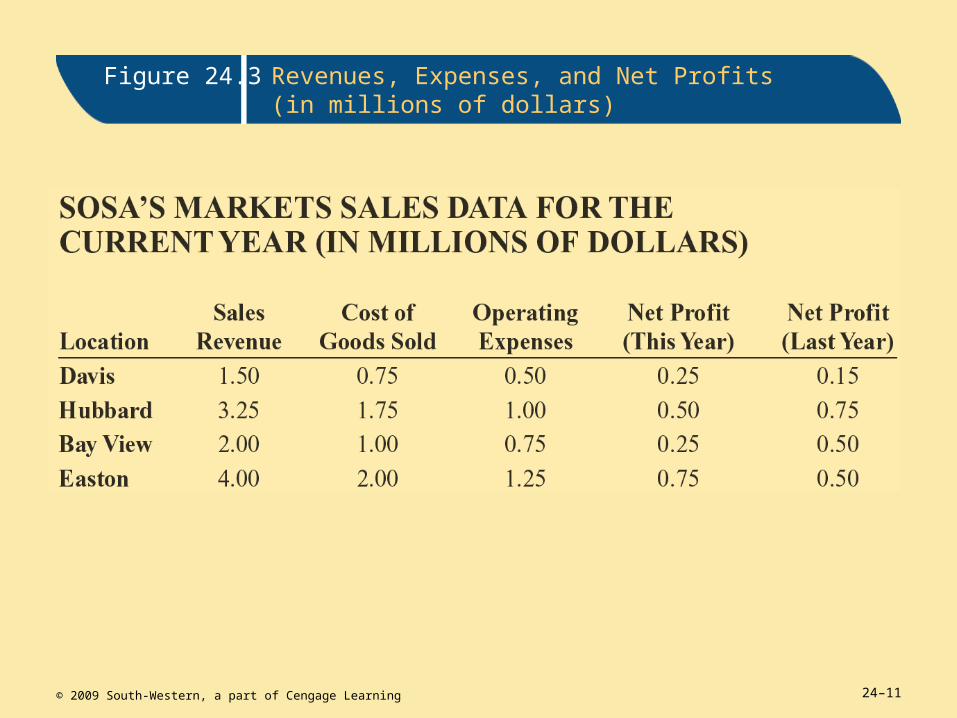
Figure 24.3 Revenues, Expenses, and Net Profits (in millions of dollars)
24–12© 2009 South-Western, a part of Cengage Learning
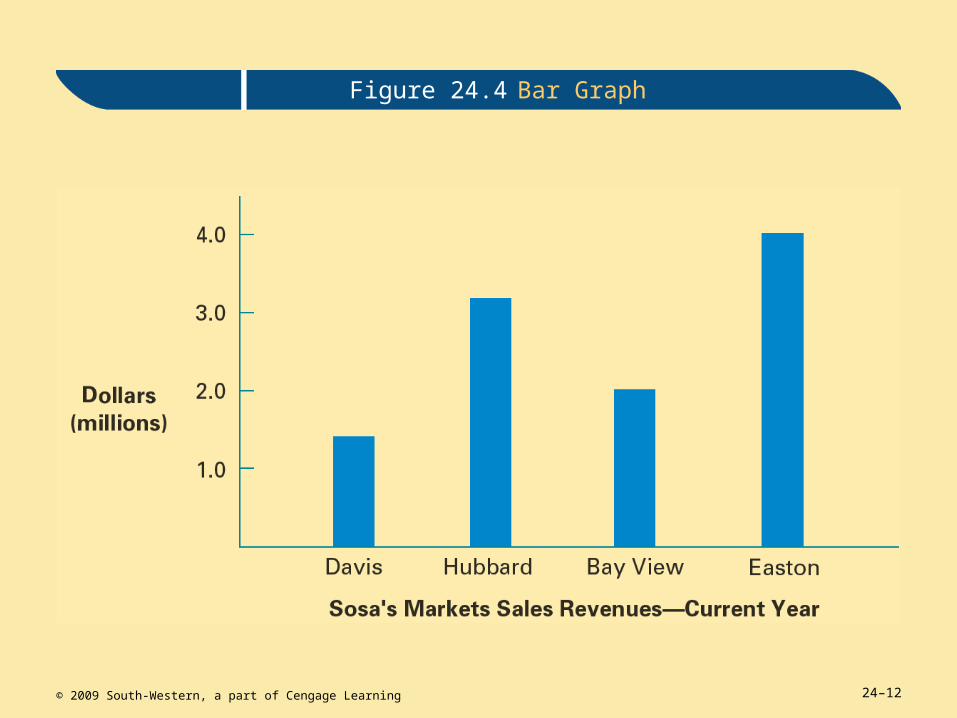
Figure 24.4 Bar Graph

24–13© 2009 South-Western, a part of Cengage Learning
Figure 24.5 Comparative Bar Graph

24–14© 2009 South-Western, a part of Cengage Learning
Figure 24.6 Component Bar Graph

24–15© 2009 South-Western, a part of Cengage Learning
Figure 24.7 Comparative Bar Graph

24–16© 2009 South-Western, a part of Cengage Learning
Figure 24.8 Line Graph
24–17© 2009 South-Western, a part of Cengage Learning
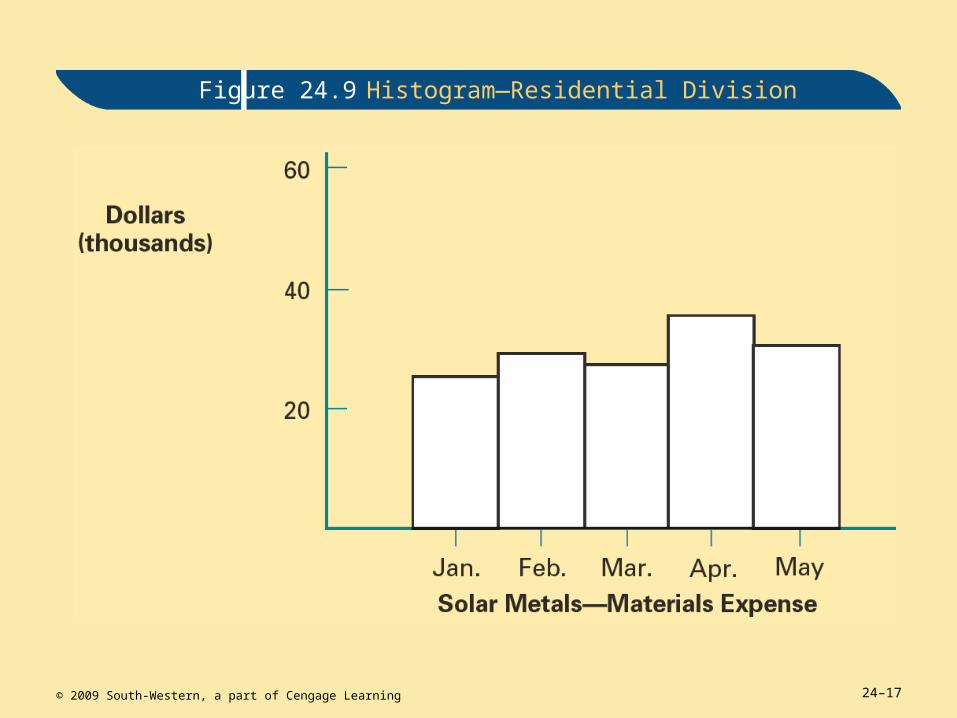
Figure 24.9 Histogram—Residential Division

24–18© 2009 South-Western, a part of Cengage Learning
Figure 24.10 Histogram—Commercial Division

24–19© 2009 South-Western, a part of Cengage Learning
Figure 24.11 Sales Revenue for Bay View Market—Current Year
24–20© 2009 South-Western, a part of Cengage Learning
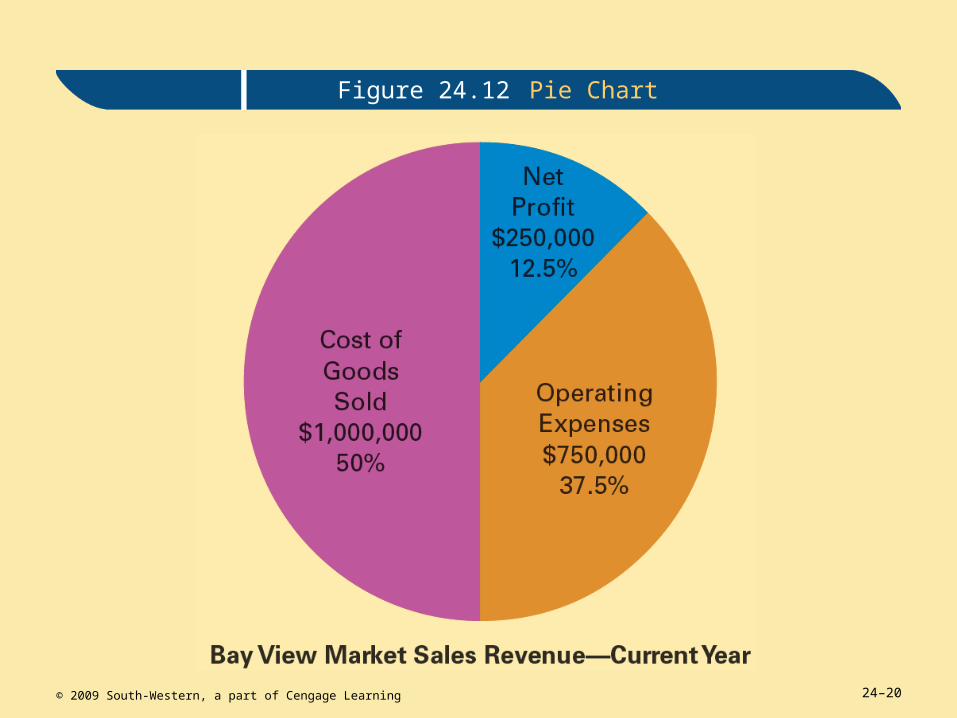
Figure 24.12 Pie Chart

24–21© 2009 South-Western, a part of Cengage Learning
Assignment 24.1: Statistical Averages
A Solve the following problems.

24–22© 2009 South-Western, a part of Cengage Learning
Assignment 24.1: Statistical Averages
A Solve the following problems.

24–23© 2009 South-Western, a part of Cengage Learning
Assignment 24.1: Statistical Averages
A Solve the following problems.
24–24© 2009 South-Western, a part of Cengage Learning
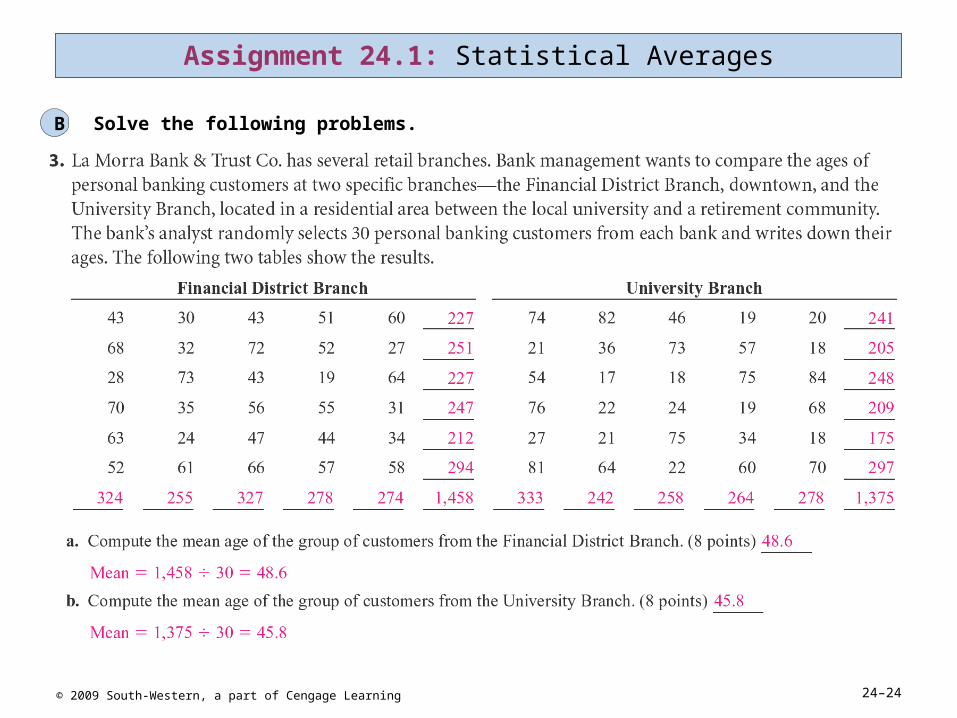
Assignment 24.1: Statistical Averages
B Solve the following problems.
24–25© 2009 South-Western, a part of Cengage Learning
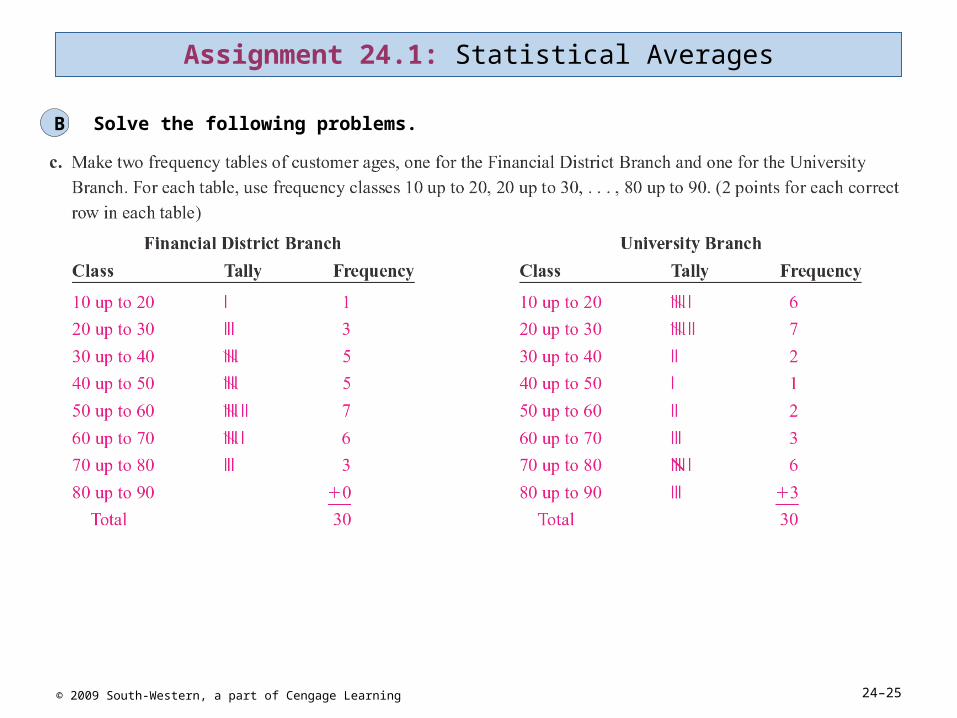
Assignment 24.1: Statistical Averages
B Solve the following problems.

24–26© 2009 South-Western, a part of Cengage Learning
Assignment 24.2: Graphs and Charts
A Complete the following problem as directed.

24–27© 2009 South-Western, a part of Cengage Learning
Assignment 24.2: Graphs and Charts
A Complete the following problem as directed.

24–28© 2009 South-Western, a part of Cengage Learning
Assignment 24.2: Graphs and Charts
B Complete the following problem as directed.
a. Make a comparative bar graph showing the monthly sales revenue for each shop. Label each axis, and write a title under the graph. Shade the bars for each shop differently.

24–29© 2009 South-Western, a part of Cengage Learning
Assignment 24.2: Graphs and Charts
B Complete the following problem as directed.
a. On the same grid, make line graphs showing the monthly sales revenue for each shop. Label each axis, and write a title under the graph. Use a solid line for Cortez Printing and a dashed line for Carla’s Copies.

24–30© 2009 South-Western, a part of Cengage Learning
Assignment 24.2: Graphs and Charts
B Complete the following problem as directed.

24–31© 2009 South-Western, a part of Cengage Learning
Assignment 24.2: Graphs and Charts
C Complete the following problem.

24–32© 2009 South-Western, a part of Cengage Learning
Assignment 24.2: Graphs and Charts
C Complete the following problem.

24–33© 2009 South-Western, a part of Cengage Learning
Assignment 24.2: Graphs and Charts
C Complete the following problem.

24–34© 2009 South-Western, a part of Cengage Learning
Chapter Terms for Review
average
bar graph
business statistics
classes of data
comparative bar graph
component bar graph
frequency
frequency table
grouped data
histogram
line graph
mean
median
mode
pie chart
statistics
ungrouped data