prepared for: city of yuma north service area yuma, arizona€¦ · city of yuma north service area...
TRANSCRIPT
DRAFTInfrastructureImprovementsPlan
Preparedfor:CityofYumaNorthServiceArea
Yuma,Arizona
May11,2017
4701SangamoreRoad
SuiteS240
Bethesda,MD20816
301.320.6900
www.TischlerBise.com

DRAFTInfrastructureImprovementsPlanCityofYumaNorthServiceArea
[PAGEINTENTIONALLYLEFTBLANK]
DRAFTInfrastructureImprovementsPlanCityofYumaNorthServiceArea
i
TABLEOFCONTENTSEXECUTIVESUMMARY........................................................................................................................1
LegalRequirements......................................................................................................................................2ConceptualFeeCalculation...........................................................................................................................3GeneralMethods..........................................................................................................................................4UpdatedDevelopmentFees..........................................................................................................................5
PARKSINFRASTRUCTUREIMPROVEMENTSPLAN....................................................................6Methodology................................................................................................................................................6RegionalandCommunityParkImprovements..............................................................................................7
LevelofService...............................................................................................................................................8ProjectedNeed...............................................................................................................................................9
NeighborhoodParkImprovements.............................................................................................................10LevelofService.............................................................................................................................................10ProjectedNeed.............................................................................................................................................10
BikePaths...................................................................................................................................................11LevelofService.............................................................................................................................................11ProjectedNeed.............................................................................................................................................11
IIPandDevelopmentFeeReport.................................................................................................................12
POLICEINFRASTRUCTUREIMPROVEMENTSPLAN................................................................13Methodology..............................................................................................................................................13PoliceFacilities...........................................................................................................................................13
LevelofService.............................................................................................................................................14ProjectedNeed.............................................................................................................................................15
PoliceVehicles............................................................................................................................................16LevelofService.............................................................................................................................................16ProjectedNeed.............................................................................................................................................16
PoliceEquipment........................................................................................................................................17ProjectedNeed.............................................................................................................................................17
FleetServices..............................................................................................................................................18ExistingInventory..........................................................................................................................................18LevelofService.............................................................................................................................................18ProjectedNeed.............................................................................................................................................19
IIPandDevelopmentFeeReport.................................................................................................................20
FIREINFRASTRUCTUREIMPROVEMENTSPLAN.....................................................................21FireCosts....................................................................................................................................................21FireFacilities...............................................................................................................................................21
LevelofService.............................................................................................................................................22ProjectedNeed.............................................................................................................................................22
FireApparatus............................................................................................................................................24LevelofService.............................................................................................................................................24ProjectedNeed.............................................................................................................................................25
Ambulances................................................................................................................................................25LevelofService.............................................................................................................................................26ProjectedNeed.............................................................................................................................................26
DRAFTInfrastructureImprovementsPlanCityofYumaNorthServiceArea
ii
FleetServices..............................................................................................................................................27ExistingInventory..........................................................................................................................................27LevelofService.............................................................................................................................................27ProjectedNeed.............................................................................................................................................28
IIPandDevelopmentFeeReport.................................................................................................................29
GENERALGOVERNMENTINFRASTRUCTUREIMPROVEMENTSPLAN..............................30Methodology..............................................................................................................................................30CityHall......................................................................................................................................................30DebtServiceCredit.....................................................................................................................................31CIPSoftware...............................................................................................................................................31IIPandDevelopmentFeeReport.................................................................................................................32
STREETINFRASTRUCTUREIMPROVEMENTSPLAN...............................................................33StreetComponents.....................................................................................................................................33
YumaTravelDemand....................................................................................................................................33Arterials......................................................................................................................................................37ImprovedIntersections...............................................................................................................................38BikeLanes...................................................................................................................................................39
ProjectedNeed.............................................................................................................................................40IIPandDevelopmentFeeReport.................................................................................................................41
APPENDIXA:LANDUSEASSUMPTIONS.....................................................................................42SummaryofGrowthIndicators...................................................................................................................42ResidentialDevelopment............................................................................................................................44
RecentResidentialConstruction...................................................................................................................44HouseholdSize..............................................................................................................................................44PopulationEstimates....................................................................................................................................45PopulationProjections..................................................................................................................................46
NonresidentialDevelopment......................................................................................................................48EmploymentEstimates.................................................................................................................................48NonresidentialSquareFootageEstimates....................................................................................................48EmploymentandNonresidentialFloorAreaProjections..............................................................................49
AverageDailyVehicleTrips.........................................................................................................................51TripRateAdjustments..................................................................................................................................51AdjustmentforJourney-To-WorkCommuting.............................................................................................51AdjustmentforPass-ByTrips........................................................................................................................52EstimatedVehicleTrips.................................................................................................................................52FunctionalPopulation...................................................................................................................................56
DetailedDevelopmentProjections..............................................................................................................57
APPENDIXB:ARIZONAREVISEDSTATUTES............................................................................58APPENDIXC:IMPLEMENTATIONANDADMINISTRATION..................................................71
ResidentialDevelopment............................................................................................................................71NonresidentialDevelopment......................................................................................................................72

DRAFTInfrastructureImprovementsPlanCityofYumaNorthServiceArea
1
EXECUTIVESUMMARYTheCityofYuma,Arizona,contractedwithTischlerBisetoupdatetheInfrastructureImprovementsPlan(IIP)fornewdevelopmentandresultingdevelopmentfeeswithintheCityofYumaNorthServiceArea.The updated IIP includes (1) Parks, (2) Police, (3) Fire, (4) General Government, and (5) Streets.Development feesarecollected fromnewconstructionat the timeabuildingpermit is issued for thepurpose of constructing system improvements needed to accommodate new development. Adevelopment fee representsnewgrowth’s proportionate shareof capital facility needs.Developmentfees do have limitations and should not be regarded as the total solution for infrastructure funding.Rather,theyareonecomponentofacomprehensivefundingstrategytoensureprovisionofadequatepublic facilities. Development fees may only be used for capital improvements or debt service forgrowth-related infrastructure. In contrast to general taxes, development fees may not be used foroperations,maintenance,replacementofinfrastructure,orcorrectingexistingdeficiencies.
Figure1:CityofYumaNorthServiceArea
South Service Area
Currently no development fees
North Service Area
Development fees collected
§̈¦8
SR 195 HIGHWAY
YUMA
COUNTY
CITY OF
YUMA
AV
E C
8TH ST
1ST ST
16TH ST
40TH ST
AV
E 9
E24TH ST
32ND ST
AV
E 1
0 E
SO
ME
RT
ON
AV
E
80TH ST
FO
RT
UN
AR
D
MAIN ST
COUNTY 14TH ST
HWY 95
AV
E A
1/2
AV
E 6
E
AV
E 1
E
COUNTY 13TH ST
AV
E E
COUNTY 19TH ST
PAC
IFIC
AV
E
AV
E 3
E
AV
E 4
E
AV
E B
AV
E 5
E
4THA
VE
AV
E B
1/2 A
VE
A
AV
E 7
E
City of YumaCity of YumaLimitsLimits
Information Technology ServicesEnterprise GISJanuary 2017
GPF355
40 23,000 46,00011,500
Feet
Legend
GovernmentalCITY OF YUMAYUMA COUNTY
The user(s) of this map acknowledges through their use that there are limitations to the data presented and there are no warranties or guarantees of accuracy of the data either positional or factual.
DRAFTInfrastructureImprovementsPlanCityofYumaNorthServiceArea
2
LEGALREQUIREMENTS
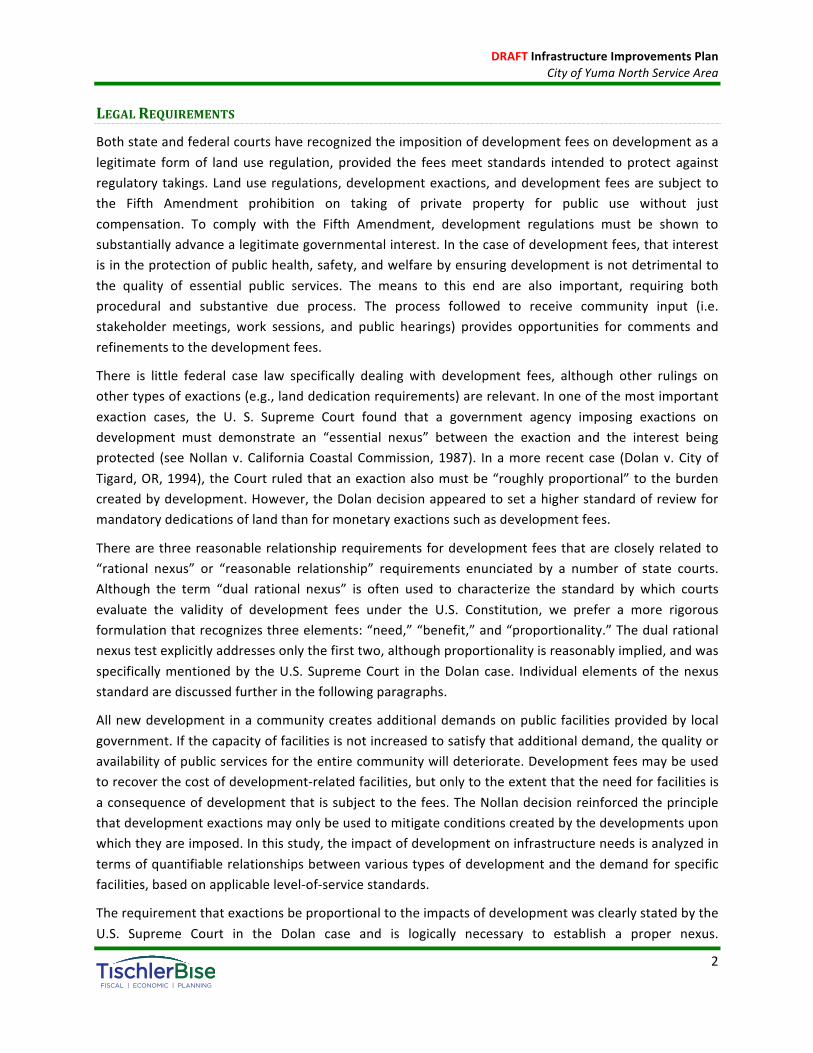
Bothstateandfederalcourtshaverecognizedtheimpositionofdevelopmentfeesondevelopmentasalegitimate formof landuse regulation, provided the feesmeet standards intended toprotect againstregulatorytakings.Landuseregulations,developmentexactions,anddevelopmentfeesaresubjecttothe Fifth Amendment prohibition on taking of private property for public use without justcompensation. To comply with the Fifth Amendment, development regulations must be shown tosubstantiallyadvancealegitimategovernmentalinterest.Inthecaseofdevelopmentfees,thatinterestisintheprotectionofpublichealth,safety,andwelfarebyensuringdevelopmentisnotdetrimentaltothe quality of essential public services. The means to this end are also important, requiring bothprocedural and substantive due process. The process followed to receive community input (i.e.stakeholder meetings, work sessions, and public hearings) provides opportunities for comments andrefinementstothedevelopmentfees.
There is little federal case law specifically dealing with development fees, although other rulings onothertypesofexactions(e.g.,landdedicationrequirements)arerelevant.Inoneofthemostimportantexaction cases, the U. S. Supreme Court found that a government agency imposing exactions ondevelopment must demonstrate an “essential nexus” between the exaction and the interest beingprotected (seeNollanv.CaliforniaCoastalCommission,1987). Inamore recentcase (Dolanv.CityofTigard,OR,1994),theCourtruledthatanexactionalsomustbe“roughlyproportional”totheburdencreatedbydevelopment.However,theDolandecisionappearedtosetahigherstandardofreviewformandatorydedicationsoflandthanformonetaryexactionssuchasdevelopmentfees.
Therearethreereasonablerelationshiprequirementsfordevelopmentfeesthatarecloselyrelatedto“rational nexus” or “reasonable relationship” requirements enunciated by a number of state courts.Although the term “dual rational nexus” is often used to characterize the standard by which courtsevaluate the validity of development fees under the U.S. Constitution, we prefer a more rigorousformulationthatrecognizesthreeelements:“need,”“benefit,”and“proportionality.”Thedualrationalnexustestexplicitlyaddressesonlythefirsttwo,althoughproportionalityisreasonablyimplied,andwasspecificallymentionedby theU.S. SupremeCourt in theDolancase. Individualelementsof thenexusstandardarediscussedfurtherinthefollowingparagraphs.
Allnewdevelopment inacommunitycreatesadditionaldemandsonpublic facilitiesprovidedby localgovernment.Ifthecapacityoffacilitiesisnotincreasedtosatisfythatadditionaldemand,thequalityoravailabilityofpublicservicesfortheentirecommunitywilldeteriorate.Developmentfeesmaybeusedtorecoverthecostofdevelopment-relatedfacilities,butonlytotheextentthattheneedforfacilitiesisaconsequenceofdevelopmentthatissubjecttothefees.TheNollandecisionreinforcedtheprinciplethatdevelopmentexactionsmayonlybeusedtomitigateconditionscreatedbythedevelopmentsuponwhichtheyareimposed.Inthisstudy,theimpactofdevelopmentoninfrastructureneedsisanalyzedintermsofquantifiablerelationshipsbetweenvarioustypesofdevelopmentandthedemandforspecificfacilities,basedonapplicablelevel-of-servicestandards.
TherequirementthatexactionsbeproportionaltotheimpactsofdevelopmentwasclearlystatedbytheU.S. Supreme Court in the Dolan case and is logically necessary to establish a proper nexus.

DRAFTInfrastructureImprovementsPlanCityofYumaNorthServiceArea
3
Proportionality is established through the procedures used to identify development-related facilitycosts,andinthemethodsusedtocalculateimpactfeesforvarioustypesoffacilitiesandcategoriesofdevelopment.Thedemandforfacilities ismeasured intermsofrelevantandmeasurableattributesofdevelopment(e.g.atypicalhousingunit’saverageweekdayvehicletrips).
A sufficient benefit relationship requires that development fee revenues be segregated from otherfundsandexpendedonlyonthefacilitiesforwhichthefeeswerecharged.Developmentfeesmustbeexpendedinatimelymannerandthefacilitiesfundedbythefeesmustservethedevelopmentpayingthe fees.However,benefitmayextendtoageneralarea includingmultiplerealestatedevelopments.Proceduresfortheearmarkingandexpenditureoffeerevenuesarediscussedneartheendofthisstudy.All of these procedural, aswell as, substantive issues are intended to ensure that new developmentbenefits from the impact fees they are required to pay. The authority and procedures to implementdevelopment fees is separate from and complementary to the authority to require improvements aspartofsubdivisionorzoningreview.
Arizona Revised Statutes (ARS) 9-463.05 authorizes a city to impose development impact fees (seeAppendixB). In accordancewith state law, this report includesCapital ImprovementsPlans forParks,Police,Fire,andTransportationthatareneededtoaccommodatenewdevelopment.Asdocumentedinthis report,Yumahascompliedwithapplicable legalprecedents.Development feesareproportionateand reasonably related to the capital improvement demands of new development,with the projectsidentified in this study reflected in Yuma’s Capital Improvements Plan (CIP). Specific costs have beenidentified using local data and current dollars. With input from city staff, TischlerBise determineddemandindicatorsforeachtypeofinfrastructureandcalculatedproportionatesharefactorstoallocatecostsbytypeofdevelopment.Thisreportdocumentstheformulasandinputvariablesusedtocalculatethedevelopmentfeesforeachtypeofpublicfacility.Developmentfeemethodologiesalsoidentifytheextent to which new development is entitled to various types of credits to avoid potential doublepaymentofgrowth-relatedcapitalcosts.
CONCEPTUALFEECALCULATION
In contrast to project-level improvements, development fees fund growth-related infrastructure thatwill benefit multiple development projects, or the entire jurisdiction (referred to as systemimprovements).Thefirststepistodetermineanappropriatedemandindicatorfortheparticulartypeofinfrastructure. The demand indicator measures the number of demand units for each unit ofdevelopment.Forexample,anappropriateindicatorofthedemandforparksispopulationgrowthandthe number of demand or service units per development unit, can be estimated from the averagenumber of persons per housing unit. The second step in the impact fee formula is to determineinfrastructure units per demandunit, typically called level-of-service (LOS) standards. In keepingwiththeparkexample,acommonLOSstandard isparkacreageperthousandpeople.Thethirdstepintheimpactfeeformulaisthecostofvariousinfrastructureunits.Tocompletetheparkexample,thispartoftheformulawouldestablishthecostperacreforlandacquisitionand/orparkimprovements.

DRAFTInfrastructureImprovementsPlanCityofYumaNorthServiceArea
4
GENERALMETHODS
Thereare threegeneralmethods forcalculatingdevelopment fees.Thechoiceofaparticularmethoddependsprimarilyonthetimingofinfrastructureconstruction(past,concurrent,orfuture)andservicecharacteristicsofthefacilitytypebeingaddressed.Eachmethodhasadvantagesanddisadvantagesinaparticularsituation,andcanbeusedsimultaneouslyfordifferentcostcomponents.
Reducedtoitssimplestterms,theprocessofcalculatingdevelopmentfeesinvolvestwomainsteps:(1)determining the cost of development-related capital improvements and (2) allocating those costsequitablytovarioustypesofdevelopment.Inpractice,though,thecalculationofdevelopmentfeescanbecomequitecomplicatedbecauseofthemanyvariablesinvolvedindefiningtherelationshipbetweendevelopment and theneed for facilitieswithin thedesignated service area. The followingparagraphsdiscussbasicmethodsforcalculatingdevelopmentfeesandhowthosemethodscanbeapplied.
• CostRecovery(pastimprovements)-Therationaleforrecoupment,oftencalledcostrecovery,is that new development is paying for its share of the useful life and remaining capacity offacilities already built, or land already purchased, from which new growth will benefit. Thismethodologyisoftenusedforutilitysystemsthatmustprovideadequatecapacitybeforenewdevelopmentcantakeplace.
• Incremental Expansion (concurrent improvements) - The incremental expansion methoddocuments current level-of-service (LOS) standards for each typeof public facility, using bothquantitative and qualitative measures. This approach assumes there are no existinginfrastructuredeficienciesorsurpluscapacityininfrastructure.Newdevelopmentisonlypayingits proportionate share for growth-related infrastructure. Revenuewill be used to expand orprovide additional facilities, as needed, to accommodate new development. An incrementalexpansion cost method is best suited for public facilities that will be expanded in regularincrementstokeeppacewithdevelopment.
• Plan-Based(futureimprovements)-Theplan-basedmethodallocatescostsforaspecifiedsetofimprovementstoaspecifiedamountofdevelopment.Improvementsaretypicallyidentifiedinalong-rangefacilityplananddevelopmentpotentialisidentifiedbyalanduseplan.Therearetwobasicoptionsfordeterminingthecostperdemandunit:(1)totalcostofapublicfacilitycanbedividedbytotaldemandunits(averagecost),or(2)thegrowth-shareofthepublicfacilitycostcanbedividedbythenetincreaseindemandunitsovertheplanningtimeframe(marginalcost).
• Credits - Regardless of the methodology, a consideration of credits is integral to thedevelopment of a legally defensible development fee methodology. There are two types ofcredits with specific characteristics, both of which should be addressed in development feestudiesandordinances.Thefirstisarevenuecreditduetopossibledoublepaymentsituations,which could occurwhen other revenuesmay contribute to the capital costs of infrastructurecovered by the development fee. This type of credit is integrated into the development feecalculation, thus reducing the fee amount. The second is a site-specific credit, or developerreimbursement, for dedication of land or construction of system improvements. This type ofcreditisaddressedintheadministrationandimplementationofthedevelopmentfeeprogram.
DRAFTInfrastructureImprovementsPlanCityofYumaNorthServiceArea
5
UPDATEDDEVELOPMENTFEES
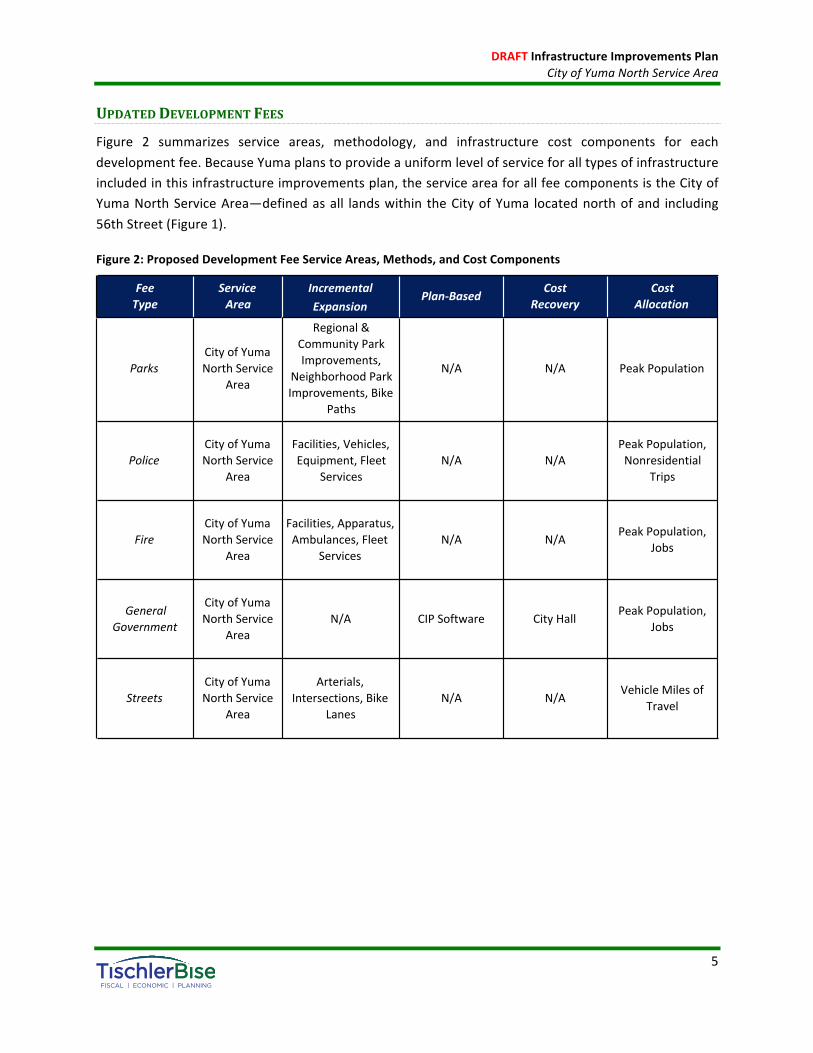
Figure 2 summarizes service areas, methodology, and infrastructure cost components for eachdevelopmentfee.BecauseYumaplanstoprovideauniformlevelofserviceforalltypesofinfrastructureincludedinthisinfrastructureimprovementsplan,theserviceareaforallfeecomponentsistheCityofYumaNorthServiceArea—definedasall landswithin theCityofYuma locatednorthofand including56thStreet(Figure1).
Figure2:ProposedDevelopmentFeeServiceAreas,Methods,andCostComponents
IncrementalExpansion
ParksCityofYumaNorthService
Area
Regional&CommunityParkImprovements,
NeighborhoodParkImprovements,Bike
Paths
N/A N/A PeakPopulation
PoliceCityofYumaNorthService
Area
Facilities,Vehicles,Equipment,Fleet
ServicesN/A N/A
PeakPopulation,Nonresidential
Trips
FireCityofYumaNorthService
Area
Facilities,Apparatus,Ambulances,Fleet
ServicesN/A N/A PeakPopulation,
Jobs
GeneralGovernment
CityofYumaNorthService
AreaN/A CIPSoftware CityHall PeakPopulation,
Jobs
StreetsCityofYumaNorthService
Area
Arterials,Intersections,Bike
LanesN/A N/A VehicleMilesof
Travel
CostAllocation
FeeType
ServiceArea Plan-Based Cost
Recovery

DRAFTInfrastructureImprovementsPlanCityofYumaNorthServiceArea
6
PARKSINFRASTRUCTUREIMPROVEMENTSPLANDevelopment fees for parks are one of the infrastructure categories allowed under Arizona law(Appendix B). Parks development fees include 1) regional and community park improvements, 2)neighborhood park improvements, and 3) bike paths. Park improvements do not include the cost ofland;however,Yuma’sinventoryofundevelopedregionalandcommunityparkacreageissufficientfordevelopmentofpark improvements identified inthisreport.Yumaexpectsdeveloperstoprovidelandfor stormwater detention, which is jointly used for neighborhood parks, so the purchase ofneighborhoodparklandisexcludedfromthecalculationofparkfees.StatelawrequiresYumatohaveanadoptedinfrastructureimprovementsplan(IIP)inordertoassessdevelopmentfees.Theserviceareaforallparks fees is theCityofYumaNorthServiceArea—definedasall landswithin theCityofYumalocatednorthofandincluding56thStreet.
METHODOLOGY
Parks development fees use an incremental expansion methodology and allocate capital costs toresidentialdevelopmentbasedonpeakpopulation.Residentialdevelopmentaccountsfor100percentof the demand for parks infrastructure, so nonresidential development is not assessed a parksdevelopment fee. This methodology allows Yuma to maintain the current LOS standard as growthoccurs. Development fee revenue collected using this methodology may not be used to replace orrehabilitateexistingimprovements.
DRAFTInfrastructureImprovementsPlanCityofYumaNorthServiceArea
7
REGIONALANDCOMMUNITYPARKIMPROVEMENTS
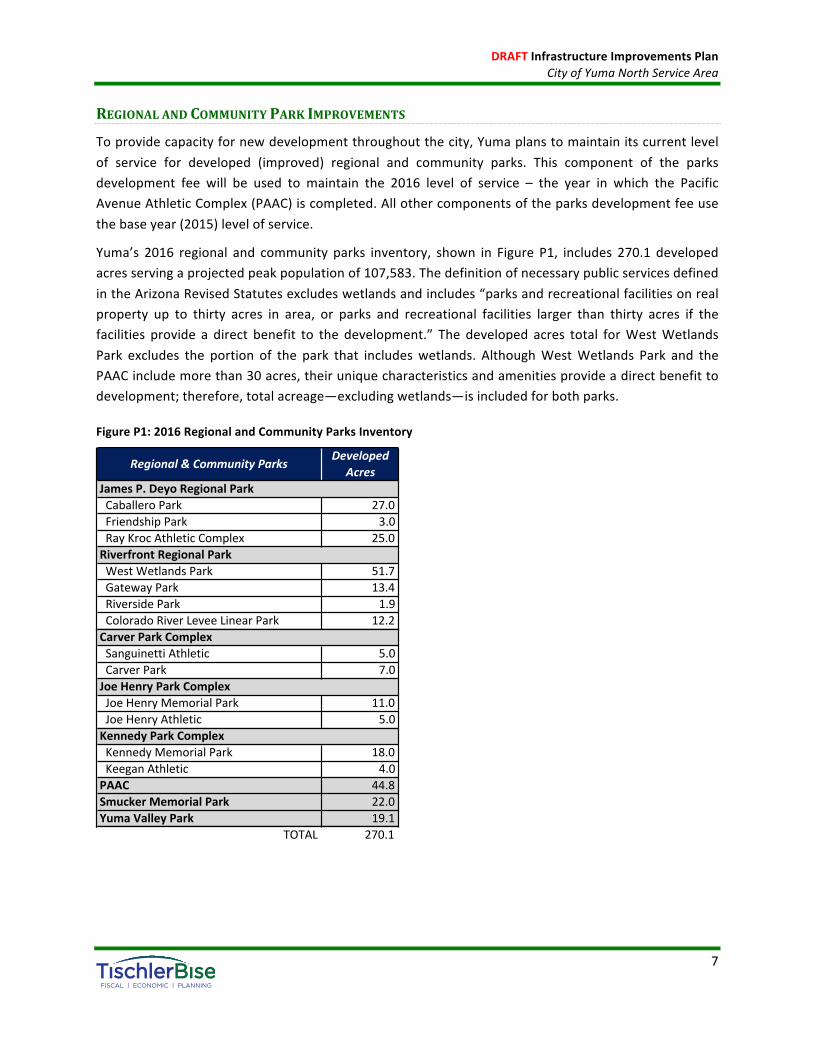
Toprovidecapacityfornewdevelopmentthroughoutthecity,Yumaplanstomaintainitscurrentlevelof service for developed (improved) regional and community parks. This component of the parksdevelopment fee will be used to maintain the 2016 level of service – the year in which the PacificAvenueAthleticComplex(PAAC)iscompleted.Allothercomponentsoftheparksdevelopmentfeeusethebaseyear(2015)levelofservice.
Yuma’s 2016 regional and community parks inventory, shown in Figure P1, includes 270.1 developedacresservingaprojectedpeakpopulationof107,583.ThedefinitionofnecessarypublicservicesdefinedintheArizonaRevisedStatutesexcludeswetlandsandincludes“parksandrecreationalfacilitiesonrealproperty up to thirty acres in area, or parks and recreational facilities larger than thirty acres if thefacilities provide a direct benefit to the development.” The developed acres total forWestWetlandsPark excludes the portion of the park that includeswetlands. AlthoughWestWetlands Park and thePAACincludemorethan30acres,theiruniquecharacteristicsandamenitiesprovideadirectbenefittodevelopment;therefore,totalacreage—excludingwetlands—isincludedforbothparks.
FigureP1:2016RegionalandCommunityParksInventory
Regional&CommunityParks DevelopedAcres
JamesP.DeyoRegionalParkCaballeroPark 27.0FriendshipPark 3.0RayKrocAthleticComplex 25.0RiverfrontRegionalParkWestWetlandsPark 51.7GatewayPark 13.4RiversidePark 1.9ColoradoRiverLeveeLinearPark 12.2CarverParkComplexSanguinettiAthletic 5.0CarverPark 7.0JoeHenryParkComplexJoeHenryMemorialPark 11.0JoeHenryAthletic 5.0KennedyParkComplexKennedyMemorialPark 18.0KeeganAthletic 4.0PAAC 44.8SmuckerMemorialPark 22.0YumaValleyPark 19.1
TOTAL 270.1
DRAFTInfrastructureImprovementsPlanCityofYumaNorthServiceArea
8
LevelofService
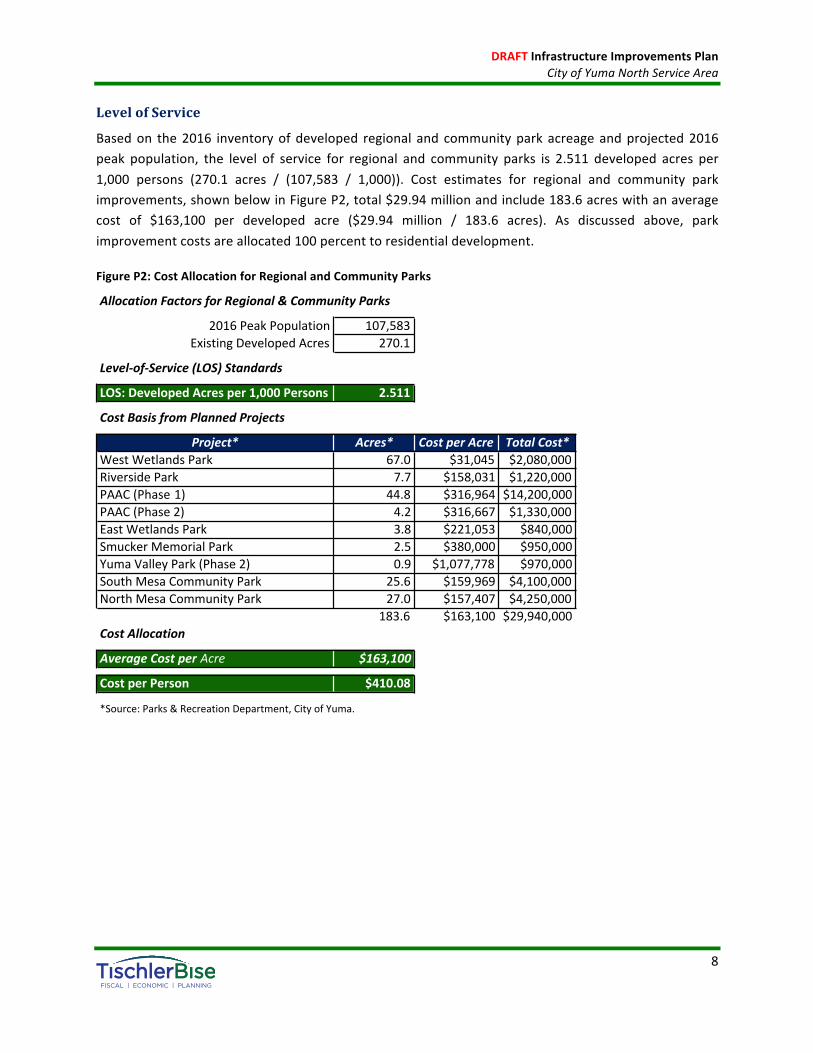
Basedon the2016 inventoryofdeveloped regional and communityparkacreageandprojected2016peak population, the level of service for regional and community parks is 2.511 developed acres per1,000 persons (270.1 acres / (107,583 / 1,000)). Cost estimates for regional and community parkimprovements,shownbelowinFigureP2,total$29.94millionandinclude183.6acreswithanaveragecost of $163,100 per developed acre ($29.94 million / 183.6 acres). As discussed above, parkimprovementcostsareallocated100percenttoresidentialdevelopment.
FigureP2:CostAllocationforRegionalandCommunityParks
AllocationFactorsforRegional&CommunityParks
2016PeakPopulation 107,583ExistingDevelopedAcres 270.1
Level-of-Service(LOS)Standards
LOS:DevelopedAcresper1,000Persons 2.511
CostBasisfromPlannedProjects
Project* Acres* CostperAcre TotalCost*WestWetlandsPark 67.0 $31,045 $2,080,000RiversidePark 7.7 $158,031 $1,220,000PAAC(Phase1) 44.8 $316,964 $14,200,000PAAC(Phase2) 4.2 $316,667 $1,330,000EastWetlandsPark 3.8 $221,053 $840,000SmuckerMemorialPark 2.5 $380,000 $950,000YumaValleyPark(Phase2) 0.9 $1,077,778 $970,000SouthMesaCommunityPark 25.6 $159,969 $4,100,000NorthMesaCommunityPark 27.0 $157,407 $4,250,000
183.6 $163,100 $29,940,000CostAllocation
AverageCostperAcre $163,100
CostperPerson $410.08
*Source:Parks&RecreationDepartment,CityofYuma.

DRAFTInfrastructureImprovementsPlanCityofYumaNorthServiceArea
9
ProjectedNeed
ShowninFigureP3,peakpopulationisprojectedtoequal124,208in2025—anincreaseof16,625from2016. When applied to the 2016 LOS, new residential development will demand 41.8 additionaldeveloped acres of regional and community parks (2.511 LOS X (16,625 peak population increase /1,000) = 41.8). Based on the average cost per acre of $163,100, the growth-related expenditure onregionalandcommunityparkimprovementsis$6.82million(41.8acresX$163,100=$6,817,580),andthecostperpersonis$410.08($6,817,580/16,625peakpopulationincrease=$410.08).
FigureP3:ProjectedDemandforParkInfrastructure
ParksInfrastructureLevel-of-ServiceStandards
DemandUnit
AverageCost
2.511 Dev.Acres 1,000Persons $163,1000.672 Dev.Acres 1,000Persons $40,0000.143 Miles 1,000Persons $475,000
Year PeakPopulation
Regional&Community(Acres)
Neighborhood(Acres)
BikePaths(Miles)
Base 2015 106,641 71.7 15.2Year1 2016 107,583 270.1 72.3 15.3Year2 2017 108,656 272.8 73.0 15.5Year3 2018 109,866 275.9 73.8 15.7Year4 2019 111,218 279.3 74.7 15.9Year5 2020 112,719 283.0 75.7 16.1Year6 2021 114,479 287.5 76.9 16.3Year7 2022 116,509 292.6 78.3 16.6Year8 2023 118,822 298.4 79.8 16.9Year9 2024 121,435 304.9 81.6 17.3Year10 2025 124,208 311.9 83.5 17.7
Ten-YrIncrease 17,567 41.8 11.8 2.5
Growth-RelatedExpenditures=> $6,817,580 $472,000 $1,187,500
$8,477,080Growth-RelatedExpenditureonParksInfrastructure
BikePaths
NeedforParksInfrastructure
TypeofInfrastructure LevelofService
Regional&CommunityParksNeighborhoodParks
DRAFTInfrastructureImprovementsPlanCityofYumaNorthServiceArea
10
NEIGHBORHOODPARKIMPROVEMENTS
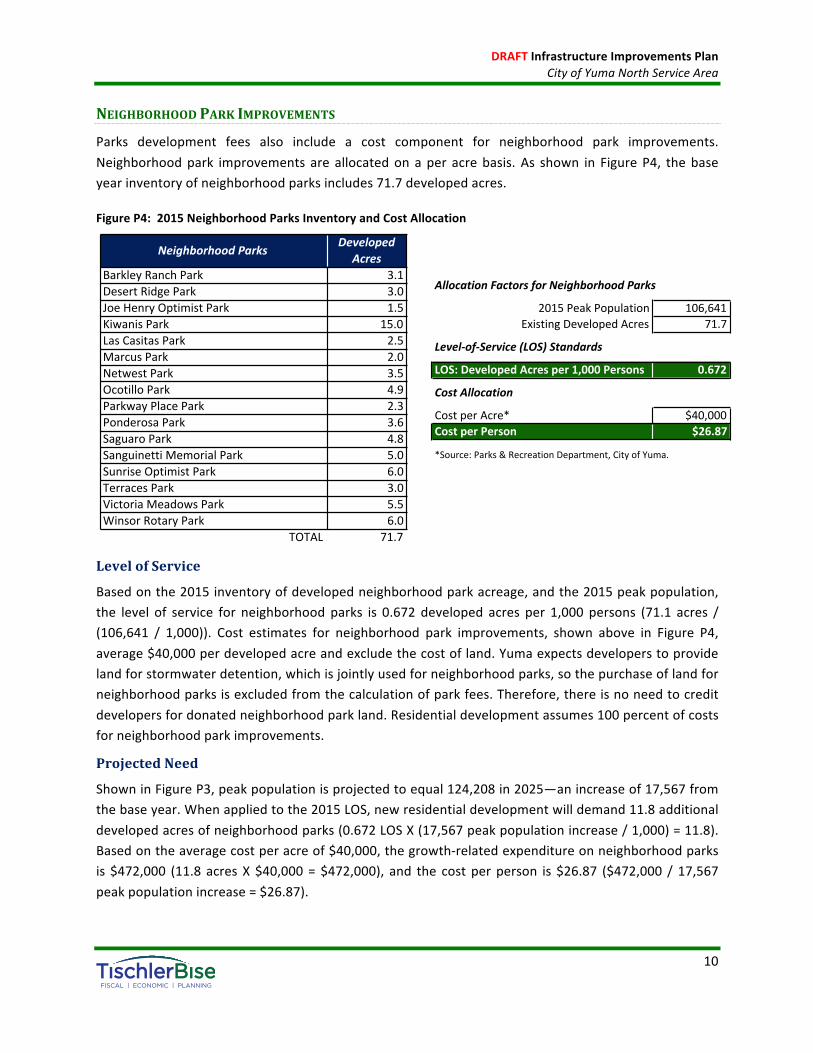
Parks development fees also include a cost component for neighborhood park improvements.Neighborhoodpark improvements are allocatedonaper acrebasis. As shown in FigureP4, thebaseyearinventoryofneighborhoodparksincludes71.7developedacres.
FigureP4:2015NeighborhoodParksInventoryandCostAllocation
LevelofService
Basedonthe2015inventoryofdevelopedneighborhoodparkacreage,andthe2015peakpopulation,the level of service for neighborhood parks is 0.672 developed acres per 1,000 persons (71.1 acres /(106,641 / 1,000)). Cost estimates for neighborhood park improvements, shown above in Figure P4,average$40,000perdevelopedacreandexcludethecostofland.Yumaexpectsdeveloperstoprovidelandforstormwaterdetention,whichisjointlyusedforneighborhoodparks,sothepurchaseoflandforneighborhoodparksisexcludedfromthecalculationofparkfees.Therefore,thereisnoneedtocreditdevelopersfordonatedneighborhoodparkland.Residentialdevelopmentassumes100percentofcostsforneighborhoodparkimprovements.
ProjectedNeed
ShowninFigureP3,peakpopulationisprojectedtoequal124,208in2025—anincreaseof17,567fromthebaseyear.Whenappliedtothe2015LOS,newresidentialdevelopmentwilldemand11.8additionaldevelopedacresofneighborhoodparks(0.672LOSX(17,567peakpopulationincrease/1,000)=11.8).Basedontheaveragecostperacreof$40,000,thegrowth-relatedexpenditureonneighborhoodparksis $472,000 (11.8 acresX$40,000=$472,000), and the costperperson is $26.87 ($472,000 / 17,567peakpopulationincrease=$26.87).
NeighborhoodParks DevelopedAcres
BarkleyRanchPark 3.1DesertRidgePark 3.0JoeHenryOptimistPark 1.5KiwanisPark 15.0LasCasitasPark 2.5MarcusPark 2.0NetwestPark 3.5OcotilloPark 4.9ParkwayPlacePark 2.3PonderosaPark 3.6SaguaroPark 4.8SanguinettiMemorialPark 5.0SunriseOptimistPark 6.0TerracesPark 3.0VictoriaMeadowsPark 5.5WinsorRotaryPark 6.0
TOTAL 71.7
AllocationFactorsforNeighborhoodParks
2015PeakPopulation 106,641ExistingDevelopedAcres 71.7
Level-of-Service(LOS)Standards
LOS:DevelopedAcresper1,000Persons 0.672
CostAllocation
CostperAcre* $40,000CostperPerson $26.87
*Source:Parks&RecreationDepartment,CityofYuma.

DRAFTInfrastructureImprovementsPlanCityofYumaNorthServiceArea
11
BIKEPATHS
Parksdevelopmentfeesalsoincludeacostcomponentforbikepaths.Yuma’sexistinginventoryofbikepathsis15.2milesanddoesnotincludebikelanesfoundwithinastreetright-of-way.
LevelofService
Basedonthe2015 inventoryofbikepathsandthe2015peakpopulation,the levelofserviceforbikepaths is0.1426milesper1,000persons(15.2acres/ (106,641/1,000)).Costestimatesforbikepathsaverage$475,000permilewith100percentofcostsallocatedtoresidentialdevelopment.
FigureP5:CostAllocationforBikePaths
ProjectedNeed
ShowninFigureP3,peakpopulationisprojectedtoequal124,208in2025—anincreaseof17,567fromthebaseyear.Whenappliedtothe2015LOS,newresidentialdevelopmentwilldemand2.5additionalmilesofbikepaths(0.143LOSX(17,567peakpopulationincrease/1,000)=2.5).Basedontheaveragecost permileof $475,000, the growth-relatedexpenditureonbikepaths is $1.19million (2.5milesX$475,000 = $1,187,500), and the cost per person is $67.60 ($1,187,500 / 17,567 peak populationincrease=$67.60).
AllocationFactorsforBikePaths
2015PeakPopulation 106,641
ExistingMilesofBikePaths 15.2
Level-of-Service(LOS)Standards
LOS:Milesper1,000Persons 0.1426
CostBasisfromPlannedProjects
EligibleProjects Miles TotalCost*PacificAvenue-12thStreettoLevee 0.8 $356,250
ThackerLateral-WMainCanalto32ndSt 4.0 $1,900,000
TOTAL 4.8 $2,256,250
CostAllocation
CostperMile:BikePaths $475,000
CostperPerson $67.60
*YumaEngineeringDepartment.

DRAFTInfrastructureImprovementsPlanCityofYumaNorthServiceArea
12
IIPANDDEVELOPMENTFEEREPORT
ThecosttopreparetheParksIIPanddevelopmentfeestotals$17,800.Yumaplanstoupdateitsreportevery five years.Basedon this cost, proportionate share, and five-yearprojectionsofnew residentialdevelopmentfromtheLandUseAssumptions,thecostperpersonis$2.93.
FigureP6:IIPandDevelopmentFeeReport
NecessaryPublicService Cost Assessed
AgainstProportionate
Share DemandUnit FY2015 FY2020 Change CostperDemandUnit
Parks $17,800 Residential 100% PeakPopulation 106,641 112,719 6,078 $2.93
Residential 61% PeakPopulation 106,641 112,719 6,078 $1.34Nonresidential 39% Nonres.Trips 207,689 224,857 17,168 $0.30Residential 45% PeakPopulation 106,641 112,719 6,078 $0.99Nonresidential 55% Jobs 48,654 52,673 4,019 $1.83Residential 73% PeakPopulation 106,641 112,719 6,078 $1.07Nonresidential 27% Jobs 48,654 52,673 4,019 $0.60ResidentialNonresidential
TOTAL $89,000
$0.91$35,600
Police
Fire
GeneralGovernment
Streets
$13,350
$13,350
$8,900
100% VMT 543,995 583,119 39,124
DRAFTInfrastructureImprovementsPlanCityofYumaNorthServiceArea
13
POLICEINFRASTRUCTUREIMPROVEMENTSPLANPolicedevelopmentfeesareoneoftheinfrastructurecategoriesallowedunderArizonalaw(AppendixB).Policedevelopmentfeesincludefacilities,vehicles,equipment,andthepoliceshareoffleetservices.State lawrequiresYumatohaveanadopted infrastructure improvementsplan (IIP) inorder toassessdevelopmentfees.TheserviceareaforallpolicefeesistheCityofYumaNorthServiceArea—definedasalllandswithintheCityofYumalocatednorthofandincluding56thStreet.
METHODOLOGY
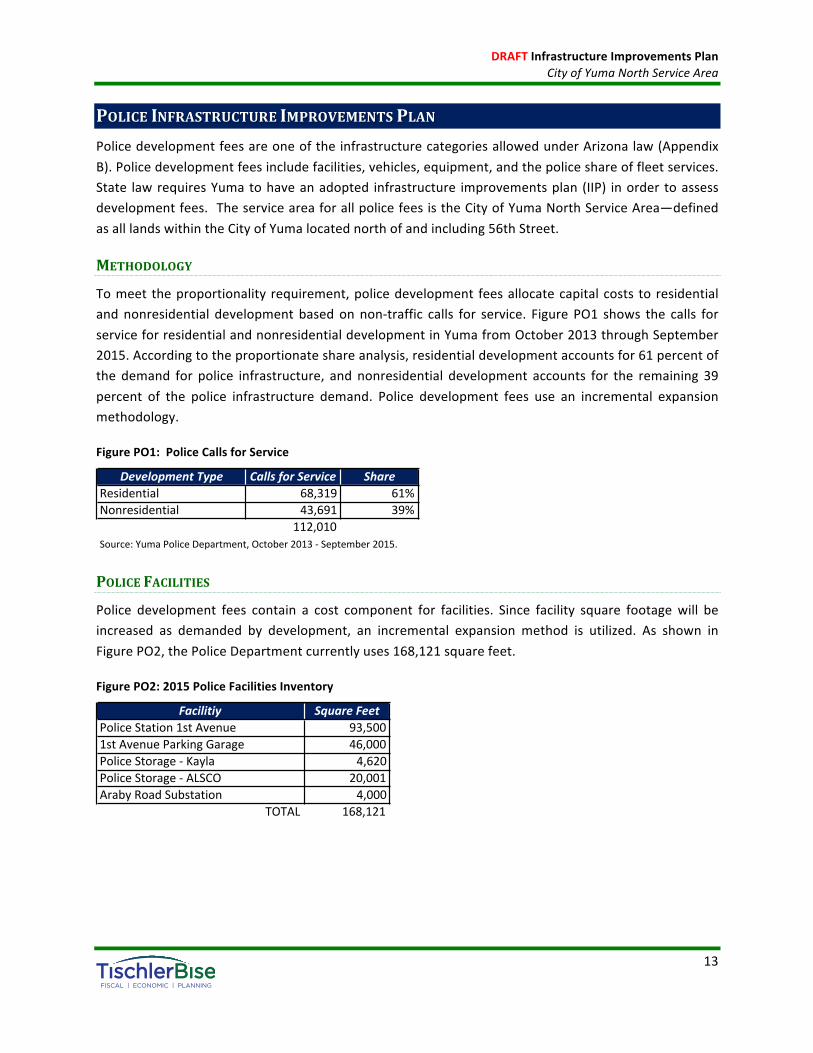
Tomeet theproportionality requirement,policedevelopment feesallocatecapitalcosts to residentialandnonresidential development basedonnon-traffic calls for service. Figure PO1 shows the calls forserviceforresidentialandnonresidentialdevelopmentinYumafromOctober2013throughSeptember2015.Accordingtotheproportionateshareanalysis,residentialdevelopmentaccountsfor61percentofthe demand for police infrastructure, and nonresidential development accounts for the remaining 39percent of the police infrastructure demand. Police development fees use an incremental expansionmethodology.
FigurePO1:PoliceCallsforService
POLICEFACILITIES
Police development fees contain a cost component for facilities. Since facility square footagewill beincreased as demanded by development, an incremental expansion method is utilized. As shown inFigurePO2,thePoliceDepartmentcurrentlyuses168,121squarefeet.
FigurePO2:2015PoliceFacilitiesInventory
DevelopmentType CallsforService ShareResidential 68,319 61%Nonresidential 43,691 39%
112,010Source:YumaPoliceDepartment,October2013-September2015.
Facilitiy SquareFeetPoliceStation1stAvenue 93,5001stAvenueParkingGarage 46,000PoliceStorage-Kayla 4,620PoliceStorage-ALSCO 20,001ArabyRoadSubstation 4,000
TOTAL 168,121

DRAFTInfrastructureImprovementsPlanCityofYumaNorthServiceArea
14
LevelofService
The current level of service is based on the residential and nonresidential shares of police calls forservice and the 2015 demand units—peak population of 106,641 for residential development andnonresidentialtripstotaling207,689fornonresidentialdevelopment.Therefore,thecurrentresidentiallevelofserviceis0.9617squarefeetperperson(168,121X61percentresidentialshare/106,641peakpopulation), and the nonresidential level of service equals 0.3157 square feet per nonresidential trip(168,121squarefeetX39percentnonresidentialshare/207,689nonresidential trips).Costestimatesforplannedprojects,shownbelowinFigurePO3,total$5.0millionandinclude62,000squarefeetwithanaveragecostof$81persquarefoot($5.0million/62,000squarefeet).
FigurePO3:CostAllocationforPoliceFacilities
AllocationFactorsforPoliceFacilities
2015PeakPopulation 106,6412015Nonres.Trips 207,689
ExistingPoliceFacilitySquareFeet 168,121ResidentialShare 61%
NonresidentialShare 39%
Level-of-Service(LOS)Standards
LOS:SquareFeetperPerson 0.9617LOS:SquareFeetperNonres.Trip 0.3157
CostBasisfromPlannedProjects
Project* SquareFeet* CostperSF TotalCost*StorageFacility:Vehicle(Indoor) 50,000 $70 $3,500,000StorageFacility:Evidence 8,000 $100 $800,000EvidenceProcessing(Covered) 4,000 $175 $700,000
62,000 $81 $5,000,000
CostAllocation
AverageCostperSquareFoot $81
CostperPerson $79.26CostperNonres.Trip $24.90
*Source:CityofYuma.

DRAFTInfrastructureImprovementsPlanCityofYumaNorthServiceArea
15
ProjectedNeed
Shown in Figure P04, peak population is projected to increase by 17,567 persons by 2035, andnonresidentialvehicle tripswill increaseby35,749 tripsduring thesameperiod.Whenapplied to the2015LOS,futuredevelopmentwilldemand28,179squarefeetofpolicefacilities[(0.9617LOSX17,567peakpopulation increase) + (0.3157 LOSX35,749nonresidential trip increase) =28,179 square feet).Basedontheaveragecostof$81persquarefoot,thegrowth-relatedexpenditureonpolicefacilitiesis$2.28million(21,179squarefeetX$81=$2,282,499).Thecostperpersonis$79.26($2,282,499X61percentresidentialshare/17,567peakpopulationincrease=$79.26),andthecostpernonresidentialvehicle trip is $24.90 ($2,282,499 X 39 percent nonresidential share / 35,749 nonresidential vehicleincrease=$24.90).
FigurePO4:ProjectedDemandforPoliceInfrastructure
DemandUnitResidential 0.9617 perPersonNonresidential 0.3157 perNonres.TripResidential 0.00097 perPersonNonresidential 0.00032 perNonres.TripResidential 0.00007 perPersonNonresidential 0.00002 perNonres.TripResidential 0.03468 perPersonNonresidential 0.01139 perNonres.Trip
Year PeakPopulation
Nonres.Trips
Facilities(SF) Vehicles Equipment FleetServices
(SF)Base 2015 106,641 207,689 168,121 169 12 6,063Year1 2016 107,583 211,008 170,075 171 12 6,133Year2 2017 108,656 214,392 172,175 173 12 6,209Year3 2018 109,866 217,827 174,423 175 13 6,290Year4 2019 111,218 221,313 176,824 178 13 6,377Year5 2020 112,719 224,857 179,386 180 13 6,469Year6 2021 114,479 228,451 182,213 183 13 6,571Year7 2022 116,509 232,111 185,321 186 13 6,683Year8 2023 118,822 235,828 188,718 190 14 6,806Year9 2024 121,435 239,599 192,422 193 14 6,939Year10 2025 124,208 243,438 196,300 197 14 7,079
Ten-YrIncrease 17,567 35,749 28,179 28 2 1,016
Growth-RelatedExpenditures=> $2,282,499 $1,472,800 $15,000 $365,760
$4,136,059
Equipment
FleetServices
Growth-RelatedExpenditureonPoliceInfrastructure
NeedforPoliceInfrastructure
Units
SquareFeet $360 perSF
$7,500 perUnit
TypeofInfrastructure LevelofService AverageCost
SquareFeet
Vehicles
$81 perSF
$52,600 perVehicle
Facilities
Vehicles
DRAFTInfrastructureImprovementsPlanCityofYumaNorthServiceArea
16
POLICEVEHICLES
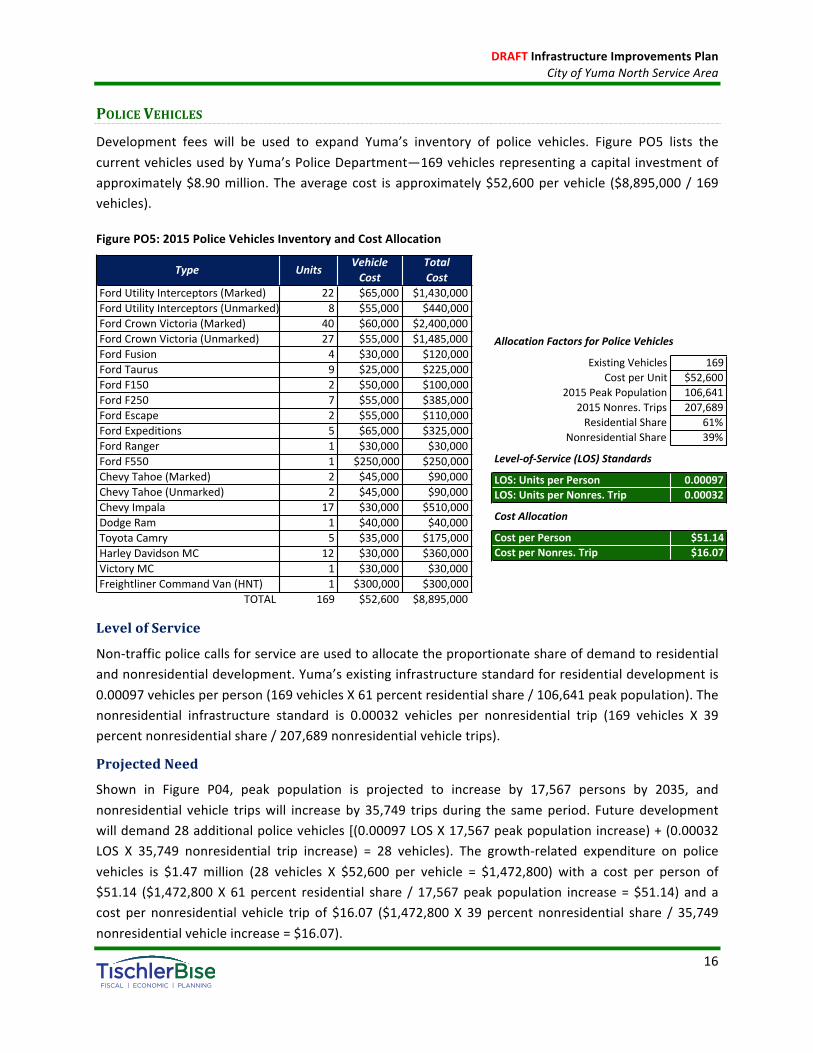
Development fees will be used to expand Yuma’s inventory of police vehicles. Figure PO5 lists thecurrentvehiclesusedbyYuma’sPoliceDepartment—169vehiclesrepresentingacapital investmentofapproximately$8.90million.Theaveragecost isapproximately$52,600pervehicle ($8,895,000/169vehicles).
FigurePO5:2015PoliceVehiclesInventoryandCostAllocation
LevelofService
Non-trafficpolicecallsforserviceareusedtoallocatetheproportionateshareofdemandtoresidentialandnonresidentialdevelopment.Yuma’sexistinginfrastructurestandardforresidentialdevelopmentis0.00097vehiclesperperson(169vehiclesX61percentresidentialshare/106,641peakpopulation).Thenonresidential infrastructure standard is 0.00032 vehicles per nonresidential trip (169 vehicles X 39percentnonresidentialshare/207,689nonresidentialvehicletrips).
ProjectedNeed
Shown in Figure P04, peak population is projected to increase by 17,567 persons by 2035, andnonresidential vehicle tripswill increaseby35,749 tripsduring the sameperiod.Futuredevelopmentwilldemand28additionalpolicevehicles[(0.00097LOSX17,567peakpopulationincrease)+(0.00032LOS X 35,749 nonresidential trip increase) = 28 vehicles). The growth-related expenditure on policevehicles is $1.47 million (28 vehicles X $52,600 per vehicle = $1,472,800) with a cost per person of$51.14 ($1,472,800X61percent residential share / 17,567peakpopulation increase=$51.14) andacost per nonresidential vehicle trip of $16.07 ($1,472,800X 39 percent nonresidential share / 35,749nonresidentialvehicleincrease=$16.07).
Type Units VehicleCost
TotalCost
FordUtilityInterceptors(Marked) 22 $65,000 $1,430,000FordUtilityInterceptors(Unmarked) 8 $55,000 $440,000FordCrownVictoria(Marked) 40 $60,000 $2,400,000FordCrownVictoria(Unmarked) 27 $55,000 $1,485,000FordFusion 4 $30,000 $120,000FordTaurus 9 $25,000 $225,000FordF150 2 $50,000 $100,000FordF250 7 $55,000 $385,000FordEscape 2 $55,000 $110,000FordExpeditions 5 $65,000 $325,000FordRanger 1 $30,000 $30,000FordF550 1 $250,000 $250,000ChevyTahoe(Marked) 2 $45,000 $90,000ChevyTahoe(Unmarked) 2 $45,000 $90,000ChevyImpala 17 $30,000 $510,000DodgeRam 1 $40,000 $40,000ToyotaCamry 5 $35,000 $175,000HarleyDavidsonMC 12 $30,000 $360,000VictoryMC 1 $30,000 $30,000FreightlinerCommandVan(HNT) 1 $300,000 $300,000
TOTAL 169 $52,600 $8,895,000
AllocationFactorsforPoliceVehicles
ExistingVehicles 169CostperUnit $52,600
2015PeakPopulation 106,6412015Nonres.Trips 207,689ResidentialShare 61%
NonresidentialShare 39%
Level-of-Service(LOS)Standards
LOS:UnitsperPerson 0.00097LOS:UnitsperNonres.Trip 0.00032
CostAllocation
CostperPerson $51.14CostperNonres.Trip $16.07
DRAFTInfrastructureImprovementsPlanCityofYumaNorthServiceArea
17
POLICEEQUIPMENT
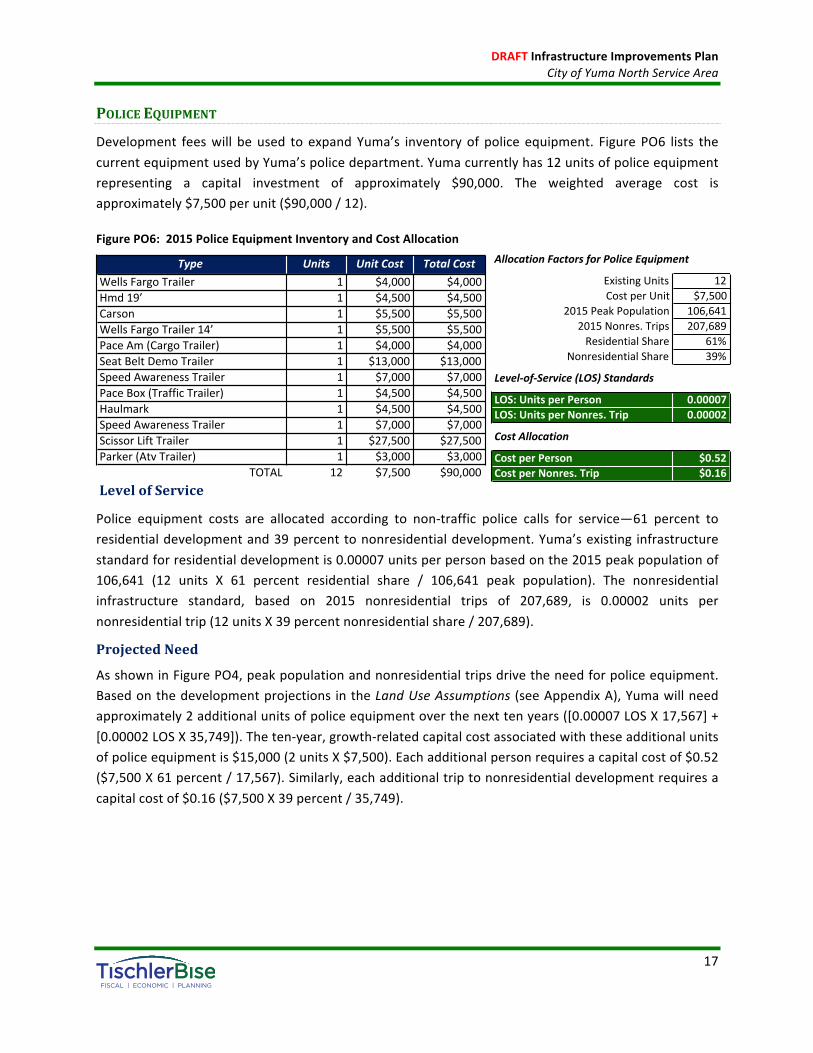
Development feeswill beused to expand Yuma’s inventoryof police equipment. FigurePO6 lists thecurrentequipmentusedbyYuma’spolicedepartment.Yumacurrentlyhas12unitsofpoliceequipmentrepresenting a capital investment of approximately $90,000. The weighted average cost isapproximately$7,500perunit($90,000/12).
FigurePO6:2015PoliceEquipmentInventoryandCostAllocation
LevelofService
Police equipment costs are allocated according to non-traffic police calls for service—61 percent toresidentialdevelopmentand39percenttononresidentialdevelopment.Yuma’sexisting infrastructurestandardforresidentialdevelopmentis0.00007unitsperpersonbasedonthe2015peakpopulationof106,641 (12 units X 61 percent residential share / 106,641 peak population). The nonresidentialinfrastructure standard, based on 2015 nonresidential trips of 207,689, is 0.00002 units pernonresidentialtrip(12unitsX39percentnonresidentialshare/207,689).
ProjectedNeed
AsshowninFigurePO4,peakpopulationandnonresidentialtripsdrivetheneedforpoliceequipment.Basedonthedevelopmentprojections intheLandUseAssumptions (seeAppendixA),Yumawillneedapproximately2additionalunitsofpoliceequipmentoverthenexttenyears([0.00007LOSX17,567]+[0.00002LOSX35,749]).Theten-year,growth-relatedcapitalcostassociatedwiththeseadditionalunitsofpoliceequipmentis$15,000(2unitsX$7,500).Eachadditionalpersonrequiresacapitalcostof$0.52($7,500X61percent/17,567).Similarly,eachadditionaltriptononresidentialdevelopmentrequiresacapitalcostof$0.16($7,500X39percent/35,749).
Type Units UnitCost TotalCostWellsFargoTrailer 1 $4,000 $4,000Hmd19’ 1 $4,500 $4,500Carson 1 $5,500 $5,500WellsFargoTrailer14’ 1 $5,500 $5,500PaceAm(CargoTrailer) 1 $4,000 $4,000SeatBeltDemoTrailer 1 $13,000 $13,000SpeedAwarenessTrailer 1 $7,000 $7,000PaceBox(TrafficTrailer) 1 $4,500 $4,500Haulmark 1 $4,500 $4,500SpeedAwarenessTrailer 1 $7,000 $7,000ScissorLiftTrailer 1 $27,500 $27,500Parker(AtvTrailer) 1 $3,000 $3,000
TOTAL 12 $7,500 $90,000
AllocationFactorsforPoliceEquipment
ExistingUnits 12CostperUnit $7,500
2015PeakPopulation 106,6412015Nonres.Trips 207,689ResidentialShare 61%
NonresidentialShare 39%
Level-of-Service(LOS)Standards
LOS:UnitsperPerson 0.00007LOS:UnitsperNonres.Trip 0.00002
CostAllocation
CostperPerson $0.52CostperNonres.Trip $0.16
DRAFTInfrastructureImprovementsPlanCityofYumaNorthServiceArea
18
FLEETSERVICES
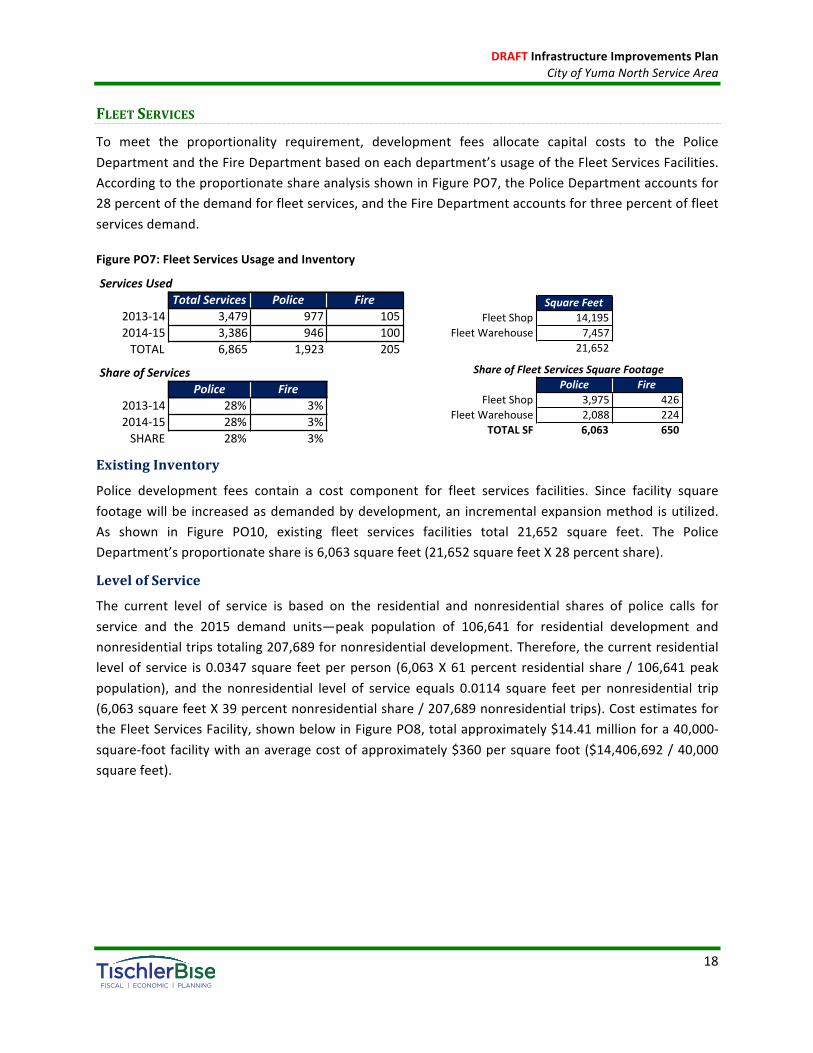
To meet the proportionality requirement, development fees allocate capital costs to the PoliceDepartmentandtheFireDepartmentbasedoneachdepartment’susageoftheFleetServicesFacilities.AccordingtotheproportionateshareanalysisshowninFigurePO7,thePoliceDepartmentaccountsfor28percentofthedemandforfleetservices,andtheFireDepartmentaccountsforthreepercentoffleetservicesdemand.
FigurePO7:FleetServicesUsageandInventory
ExistingInventory
Police development fees contain a cost component for fleet services facilities. Since facility squarefootagewillbe increasedasdemandedbydevelopment,an incrementalexpansionmethod isutilized.As shown in Figure PO10, existing fleet services facilities total 21,652 square feet. The PoliceDepartment’sproportionateshareis6,063squarefeet(21,652squarefeetX28percentshare).
LevelofService
The current level of service is based on the residential and nonresidential shares of police calls forservice and the 2015 demand units—peak population of 106,641 for residential development andnonresidentialtripstotaling207,689fornonresidentialdevelopment.Therefore,thecurrentresidentiallevelof service is0.0347square feetperperson (6,063X61percent residential share/106,641peakpopulation), and the nonresidential level of service equals 0.0114 square feet per nonresidential trip(6,063squarefeetX39percentnonresidentialshare/207,689nonresidentialtrips).CostestimatesfortheFleetServicesFacility,shownbelowinFigurePO8,totalapproximately$14.41millionfora40,000-square-footfacilitywithanaveragecostofapproximately$360persquarefoot($14,406,692/40,000squarefeet).
ServicesUsedTotalServices Police Fire
2013-14 3,479 977 1052014-15 3,386 946 100TOTAL 6,865 1,923 205
ShareofServicesPolice Fire
2013-14 28% 3%2014-15 28% 3%SHARE 28% 3%
SquareFeetFleetShop 14,195
FleetWarehouse 7,45721,652
ShareofFleetServicesSquareFootagePolice Fire
FleetShop 3,975 426FleetWarehouse 2,088 224
TOTALSF 6,063 650
DRAFTInfrastructureImprovementsPlanCityofYumaNorthServiceArea
19
FigurePO8:CostAllocationforFleetServices–PoliceShare
ProjectedNeed
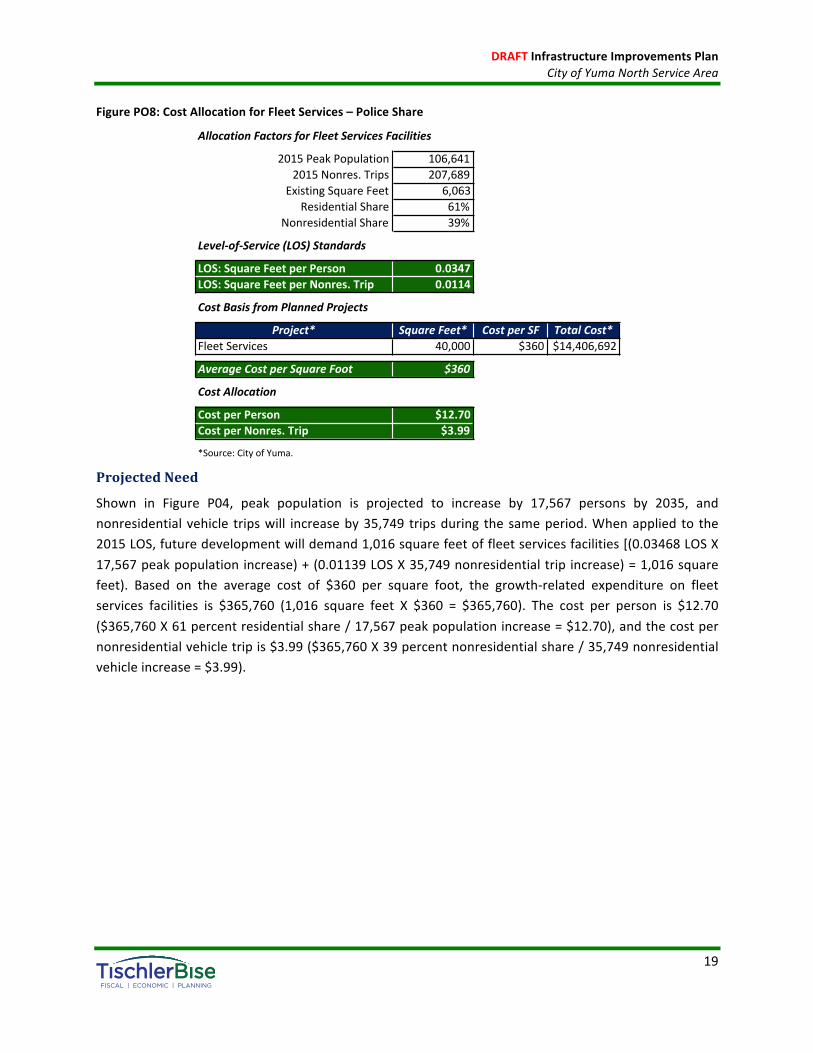
Shown in Figure P04, peak population is projected to increase by 17,567 persons by 2035, andnonresidentialvehicle tripswill increaseby35,749 tripsduring thesameperiod.Whenapplied to the2015LOS,futuredevelopmentwilldemand1,016squarefeetoffleetservicesfacilities[(0.03468LOSX17,567peakpopulationincrease)+(0.01139LOSX35,749nonresidentialtripincrease)=1,016squarefeet). Based on the average cost of $360 per square foot, the growth-related expenditure on fleetservices facilities is $365,760 (1,016 square feet X $360 = $365,760). The cost per person is $12.70($365,760X61percentresidentialshare/17,567peakpopulationincrease=$12.70),andthecostpernonresidentialvehicletripis$3.99($365,760X39percentnonresidentialshare/35,749nonresidentialvehicleincrease=$3.99).
AllocationFactorsforFleetServicesFacilities
2015PeakPopulation 106,6412015Nonres.Trips 207,689
ExistingSquareFeet 6,063ResidentialShare 61%
NonresidentialShare 39%
Level-of-Service(LOS)Standards
LOS:SquareFeetperPerson 0.0347LOS:SquareFeetperNonres.Trip 0.0114
CostBasisfromPlannedProjects
Project* SquareFeet* CostperSF TotalCost*FleetServices 40,000 $360 $14,406,692
AverageCostperSquareFoot $360
CostAllocation
CostperPerson $12.70CostperNonres.Trip $3.99
*Source:CityofYuma.

DRAFTInfrastructureImprovementsPlanCityofYumaNorthServiceArea
20
IIPANDDEVELOPMENTFEEREPORT
ThecosttopreparethePoliceIIPanddevelopmentfeestotals$13,350.Yumaplanstoupdateitsreportevery five years.Basedon this cost, proportionate share, and five-yearprojectionsofnew residentialandnonresidentialdevelopmentfromtheLandUseAssumptions,thecostperpersonis$1.34andperjobis$0.30.
FigurePO12:IIPandDevelopmentFeeReport
NecessaryPublicService Cost Assessed
AgainstProportionate
Share DemandUnit FY2015 FY2020 Change CostperDemandUnit
Parks $17,800 Residential 100% PeakPopulation 106,641 112,719 6,078 $2.93
Residential 61% PeakPopulation 106,641 112,719 6,078 $1.34Nonresidential 39% Nonres.Trips 207,689 224,857 17,168 $0.30Residential 45% PeakPopulation 106,641 112,719 6,078 $0.99Nonresidential 55% Jobs 48,654 52,673 4,019 $1.83Residential 73% PeakPopulation 106,641 112,719 6,078 $1.07Nonresidential 27% Jobs 48,654 52,673 4,019 $0.60ResidentialNonresidential
TOTAL $89,000
$0.91$35,600
Police
Fire
GeneralGovernment
Streets
$13,350
$13,350
$8,900
100% VMT 543,995 583,119 39,124
DRAFTInfrastructureImprovementsPlanCityofYumaNorthServiceArea
21
FIREINFRASTRUCTUREIMPROVEMENTSPLANFiredevelopmentfeesareoneoftheinfrastructurecategoriesallowedunderArizonalaw(AppendixB).Fire development fees include fire stations, apparatus, ambulances, and fleet services. State lawrequires Yuma to have an adopted infrastructure improvements plan (IIP) in order to assessdevelopmentfees.TheserviceareaforallfirefeesistheCityofYumaNorthServiceArea—definedasalllandswithintheCityofYumalocatednorthofandincluding56thStreet.
FIRECOSTS
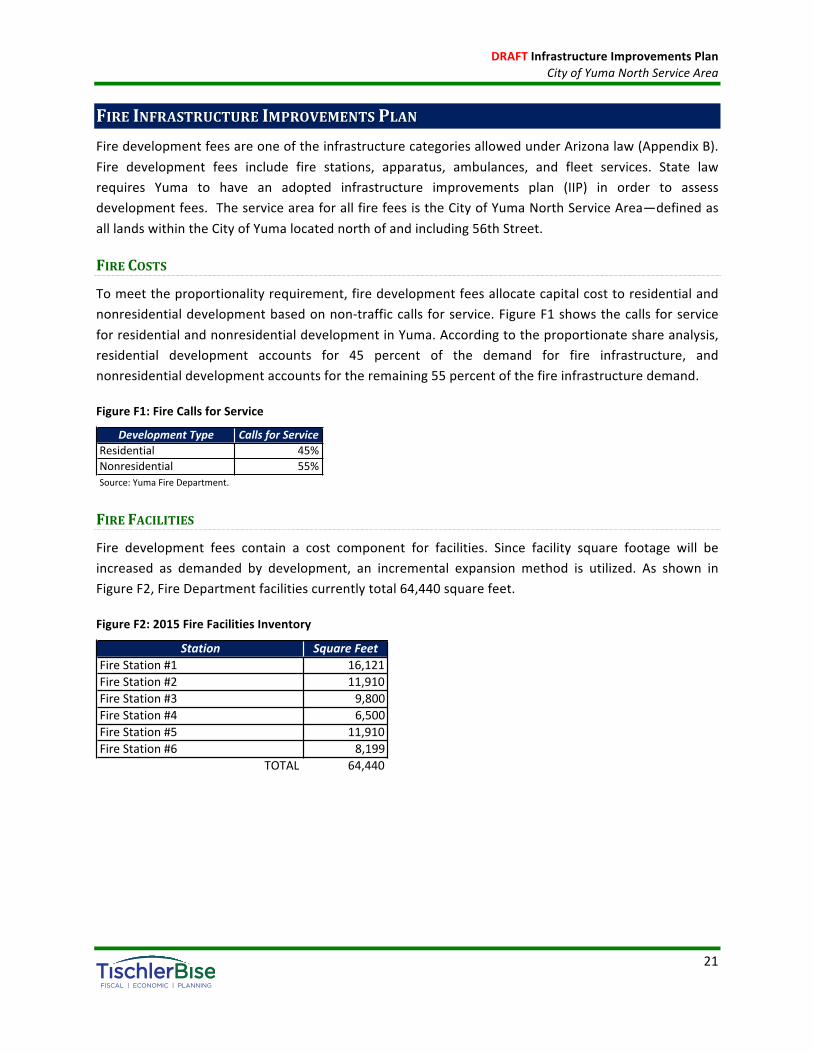
Tomeettheproportionalityrequirement,firedevelopmentfeesallocatecapitalcosttoresidentialandnonresidentialdevelopmentbasedonnon-trafficcallsforservice.FigureF1showsthecallsforserviceforresidentialandnonresidentialdevelopmentinYuma.Accordingtotheproportionateshareanalysis,residential development accounts for 45 percent of the demand for fire infrastructure, andnonresidentialdevelopmentaccountsfortheremaining55percentofthefireinfrastructuredemand.
FigureF1:FireCallsforService
FIREFACILITIES
Fire development fees contain a cost component for facilities. Since facility square footage will beincreased as demanded by development, an incremental expansion method is utilized. As shown inFigureF2,FireDepartmentfacilitiescurrentlytotal64,440squarefeet.
FigureF2:2015FireFacilitiesInventory
DevelopmentType CallsforServiceResidential 45%Nonresidential 55%Source:YumaFireDepartment.
Station SquareFeetFireStation#1 16,121FireStation#2 11,910FireStation#3 9,800FireStation#4 6,500FireStation#5 11,910FireStation#6 8,199
TOTAL 64,440
DRAFTInfrastructureImprovementsPlanCityofYumaNorthServiceArea
22
LevelofService
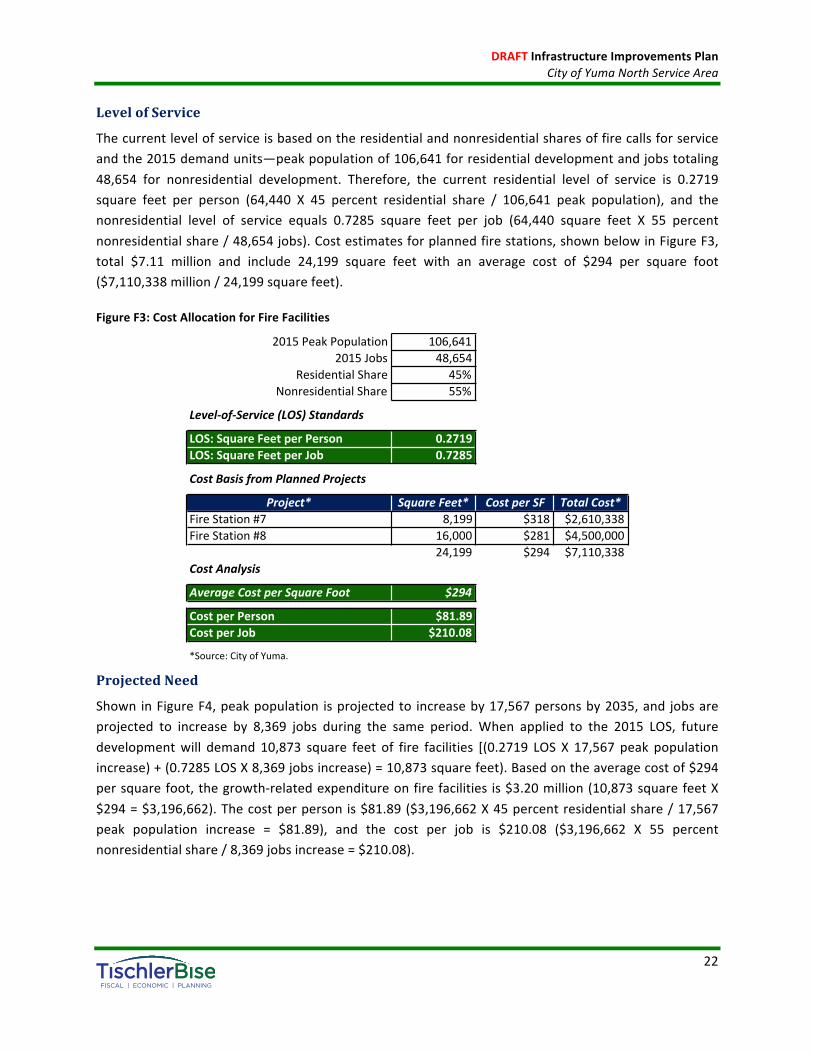
Thecurrentlevelofserviceisbasedontheresidentialandnonresidentialsharesoffirecallsforserviceandthe2015demandunits—peakpopulationof106,641forresidentialdevelopmentandjobstotaling48,654 for nonresidential development. Therefore, the current residential level of service is 0.2719square feet per person (64,440 X 45 percent residential share / 106,641 peak population), and thenonresidential level of service equals 0.7285 square feet per job (64,440 square feet X 55 percentnonresidentialshare/48,654jobs).Costestimatesforplannedfirestations,shownbelowinFigureF3,total $7.11 million and include 24,199 square feet with an average cost of $294 per square foot($7,110,338million/24,199squarefeet).
FigureF3:CostAllocationforFireFacilities
ProjectedNeed
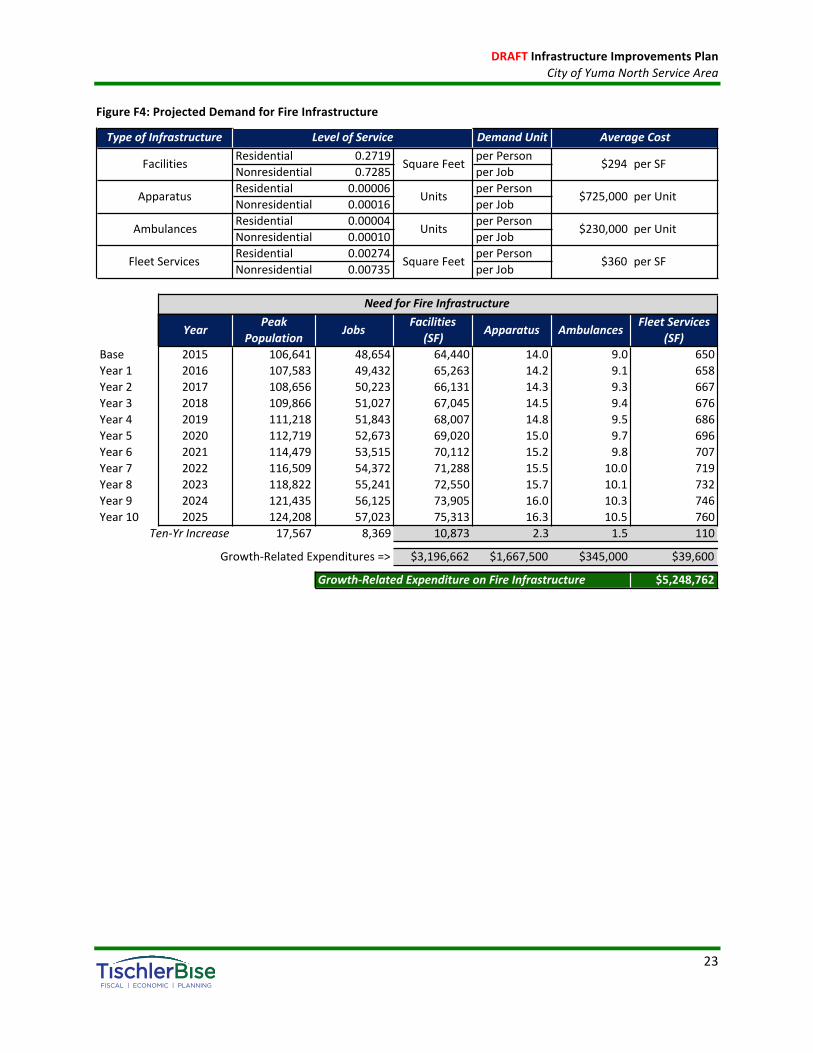
Shown inFigureF4,peakpopulation isprojectedto increaseby17,567personsby2035,and jobsareprojected to increase by 8,369 jobs during the same period.When applied to the 2015 LOS, futuredevelopmentwill demand 10,873 square feet of fire facilities [(0.2719 LOS X 17,567 peak populationincrease)+(0.7285LOSX8,369jobsincrease)=10,873squarefeet).Basedontheaveragecostof$294persquarefoot,thegrowth-relatedexpenditureonfirefacilities is$3.20million(10,873squarefeetX$294=$3,196,662).Thecostperpersonis$81.89($3,196,662X45percentresidentialshare/17,567peak population increase = $81.89), and the cost per job is $210.08 ($3,196,662 X 55 percentnonresidentialshare/8,369jobsincrease=$210.08).
2015PeakPopulation 106,6412015Jobs 48,654
ResidentialShare 45%NonresidentialShare 55%
Level-of-Service(LOS)Standards
LOS:SquareFeetperPerson 0.2719LOS:SquareFeetperJob 0.7285
CostBasisfromPlannedProjects
Project* SquareFeet* CostperSF TotalCost*FireStation#7 8,199 $318 $2,610,338FireStation#8 16,000 $281 $4,500,000
24,199 $294 $7,110,338CostAnalysis
AverageCostperSquareFoot $294
CostperPerson $81.89CostperJob $210.08
*Source:CityofYuma.
DRAFTInfrastructureImprovementsPlanCityofYumaNorthServiceArea
23
FigureF4:ProjectedDemandforFireInfrastructure
DemandUnitResidential 0.2719 perPerson
Nonresidential 0.7285 perJob
Residential 0.00006 perPerson
Nonresidential 0.00016 perJob
Residential 0.00004 perPerson
Nonresidential 0.00010 perJob
Residential 0.00274 perPerson
Nonresidential 0.00735 perJob
Year PeakPopulation Jobs Facilities
(SF) Apparatus Ambulances FleetServices(SF)
Base 2015 106,641 48,654 64,440 14.0 9.0 650
Year1 2016 107,583 49,432 65,263 14.2 9.1 658
Year2 2017 108,656 50,223 66,131 14.3 9.3 667
Year3 2018 109,866 51,027 67,045 14.5 9.4 676
Year4 2019 111,218 51,843 68,007 14.8 9.5 686
Year5 2020 112,719 52,673 69,020 15.0 9.7 696
Year6 2021 114,479 53,515 70,112 15.2 9.8 707
Year7 2022 116,509 54,372 71,288 15.5 10.0 719
Year8 2023 118,822 55,241 72,550 15.7 10.1 732
Year9 2024 121,435 56,125 73,905 16.0 10.3 746
Year10 2025 124,208 57,023 75,313 16.3 10.5 760
Ten-YrIncrease 17,567 8,369 10,873 2.3 1.5 110
Growth-RelatedExpenditures=> $3,196,662 $1,667,500 $345,000 $39,600
$5,248,762Growth-RelatedExpenditureonFireInfrastructure
SquareFeet
Units
Units
SquareFeet
NeedforFireInfrastructure
FleetServices perSF$360
TypeofInfrastructure AverageCost
Facilities
Apparatus
Ambulances
$294 perSF
LevelofService
$725,000 perUnit
$230,000 perUnit
DRAFTInfrastructureImprovementsPlanCityofYumaNorthServiceArea
24
FIREAPPARATUS
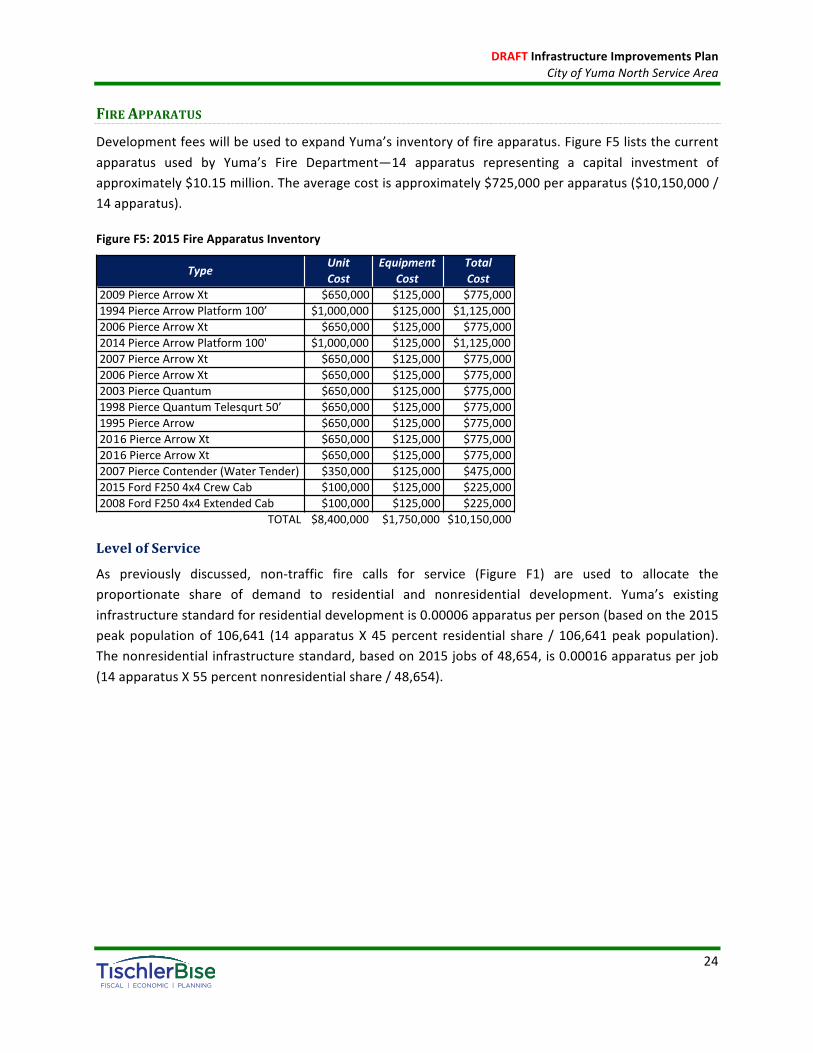
DevelopmentfeeswillbeusedtoexpandYuma’sinventoryoffireapparatus.FigureF5liststhecurrentapparatus used by Yuma’s Fire Department—14 apparatus representing a capital investment ofapproximately$10.15million.Theaveragecostisapproximately$725,000perapparatus($10,150,000/14apparatus).
FigureF5:2015FireApparatusInventory
LevelofService
As previously discussed, non-traffic fire calls for service (Figure F1) are used to allocate theproportionate share of demand to residential and nonresidential development. Yuma’s existinginfrastructurestandardforresidentialdevelopmentis0.00006apparatusperperson(basedonthe2015peakpopulationof 106,641 (14apparatusX45percent residential share / 106,641peakpopulation).Thenonresidentialinfrastructurestandard,basedon2015jobsof48,654,is0.00016apparatusperjob(14apparatusX55percentnonresidentialshare/48,654).
Type UnitCost
EquipmentCost
TotalCost
2009PierceArrowXt $650,000 $125,000 $775,0001994PierceArrowPlatform100’ $1,000,000 $125,000 $1,125,0002006PierceArrowXt $650,000 $125,000 $775,0002014PierceArrowPlatform100' $1,000,000 $125,000 $1,125,0002007PierceArrowXt $650,000 $125,000 $775,0002006PierceArrowXt $650,000 $125,000 $775,0002003PierceQuantum $650,000 $125,000 $775,0001998PierceQuantumTelesqurt50’ $650,000 $125,000 $775,0001995PierceArrow $650,000 $125,000 $775,0002016PierceArrowXt $650,000 $125,000 $775,0002016PierceArrowXt $650,000 $125,000 $775,0002007PierceContender(WaterTender) $350,000 $125,000 $475,0002015FordF2504x4CrewCab $100,000 $125,000 $225,0002008FordF2504x4ExtendedCab $100,000 $125,000 $225,000
TOTAL $8,400,000 $1,750,000 $10,150,000
DRAFTInfrastructureImprovementsPlanCityofYumaNorthServiceArea
25
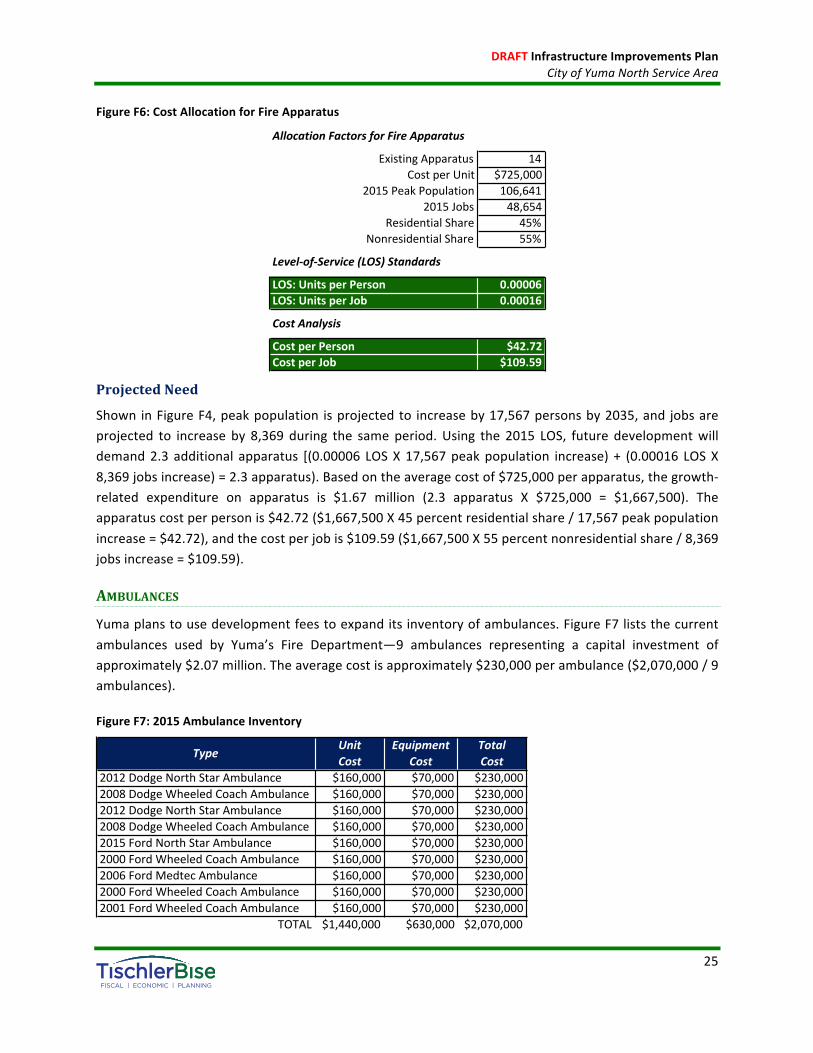
FigureF6:CostAllocationforFireApparatus
ProjectedNeed
Shown inFigureF4,peakpopulation isprojectedto increaseby17,567personsby2035,and jobsareprojected to increase by 8,369 during the sameperiod.Using the 2015 LOS, future developmentwilldemand2.3 additional apparatus [(0.00006 LOSX17,567peakpopulation increase) + (0.00016 LOSX8,369jobsincrease)=2.3apparatus).Basedontheaveragecostof$725,000perapparatus,thegrowth-related expenditure on apparatus is $1.67 million (2.3 apparatus X $725,000 = $1,667,500). Theapparatuscostperpersonis$42.72($1,667,500X45percentresidentialshare/17,567peakpopulationincrease=$42.72),andthecostperjobis$109.59($1,667,500X55percentnonresidentialshare/8,369jobsincrease=$109.59).
AMBULANCES
Yumaplanstousedevelopmentfeestoexpanditsinventoryofambulances.FigureF7liststhecurrentambulances used by Yuma’s Fire Department—9 ambulances representing a capital investment ofapproximately$2.07million.Theaveragecostisapproximately$230,000perambulance($2,070,000/9ambulances).
FigureF7:2015AmbulanceInventory
AllocationFactorsforFireApparatus
ExistingApparatus 14CostperUnit $725,000
2015PeakPopulation 106,6412015Jobs 48,654
ResidentialShare 45%NonresidentialShare 55%
Level-of-Service(LOS)Standards
LOS:UnitsperPerson 0.00006LOS:UnitsperJob 0.00016
CostAnalysis
CostperPerson $42.72CostperJob $109.59
Type UnitCost
EquipmentCost
TotalCost
2012DodgeNorthStarAmbulance $160,000 $70,000 $230,0002008DodgeWheeledCoachAmbulance $160,000 $70,000 $230,0002012DodgeNorthStarAmbulance $160,000 $70,000 $230,0002008DodgeWheeledCoachAmbulance $160,000 $70,000 $230,0002015FordNorthStarAmbulance $160,000 $70,000 $230,0002000FordWheeledCoachAmbulance $160,000 $70,000 $230,0002006FordMedtecAmbulance $160,000 $70,000 $230,0002000FordWheeledCoachAmbulance $160,000 $70,000 $230,0002001FordWheeledCoachAmbulance $160,000 $70,000 $230,000
TOTAL $1,440,000 $630,000 $2,070,000
DRAFTInfrastructureImprovementsPlanCityofYumaNorthServiceArea
26
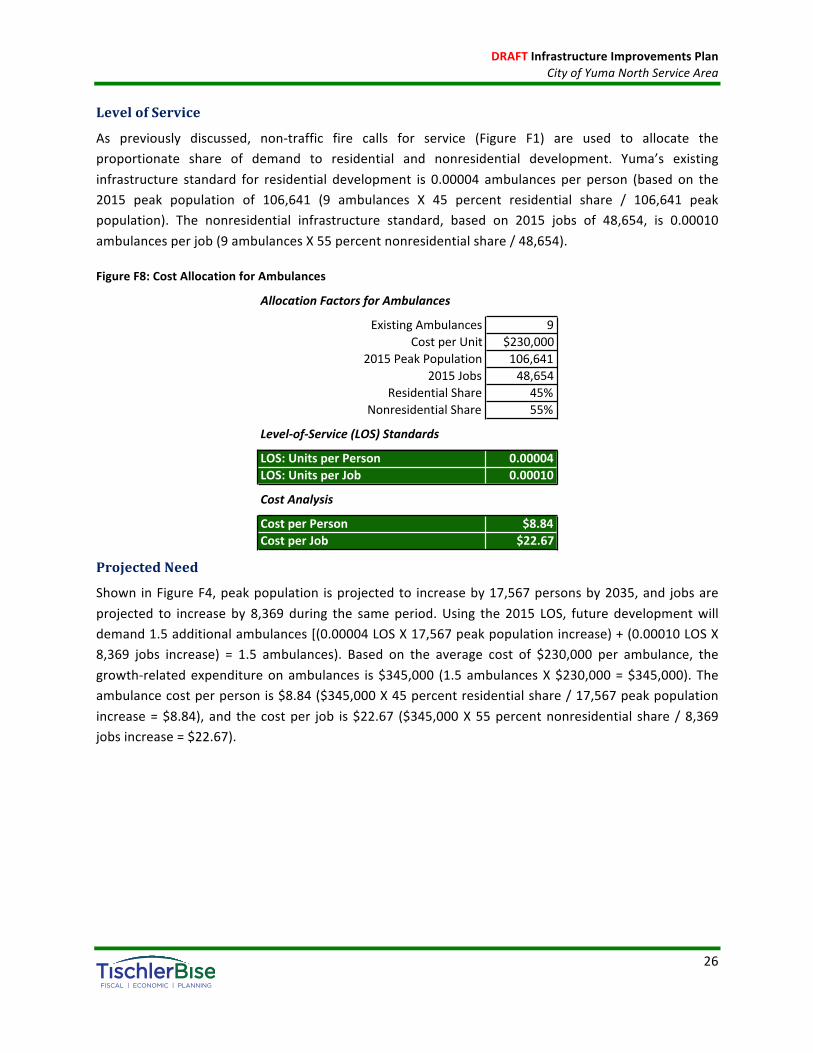
LevelofService
As previously discussed, non-traffic fire calls for service (Figure F1) are used to allocate theproportionate share of demand to residential and nonresidential development. Yuma’s existinginfrastructure standard for residential development is 0.00004 ambulances per person (based on the2015 peak population of 106,641 (9 ambulances X 45 percent residential share / 106,641 peakpopulation). The nonresidential infrastructure standard, based on 2015 jobs of 48,654, is 0.00010ambulancesperjob(9ambulancesX55percentnonresidentialshare/48,654).
FigureF8:CostAllocationforAmbulances
ProjectedNeed
Shown inFigureF4,peakpopulation isprojectedto increaseby17,567personsby2035,and jobsareprojected to increase by 8,369during the sameperiod.Using the 2015 LOS, future developmentwilldemand1.5additionalambulances[(0.00004LOSX17,567peakpopulationincrease)+(0.00010LOSX8,369 jobs increase) = 1.5 ambulances). Based on the average cost of $230,000 per ambulance, thegrowth-relatedexpenditureonambulances is$345,000 (1.5ambulancesX$230,000=$345,000).Theambulancecostperpersonis$8.84($345,000X45percentresidentialshare/17,567peakpopulationincrease=$8.84),and thecostper job is$22.67 ($345,000X55percentnonresidential share /8,369jobsincrease=$22.67).
AllocationFactorsforAmbulances
ExistingAmbulances 9CostperUnit $230,000
2015PeakPopulation 106,6412015Jobs 48,654
ResidentialShare 45%NonresidentialShare 55%
Level-of-Service(LOS)Standards
LOS:UnitsperPerson 0.00004LOS:UnitsperJob 0.00010
CostAnalysis
CostperPerson $8.84CostperJob $22.67
DRAFTInfrastructureImprovementsPlanCityofYumaNorthServiceArea
27
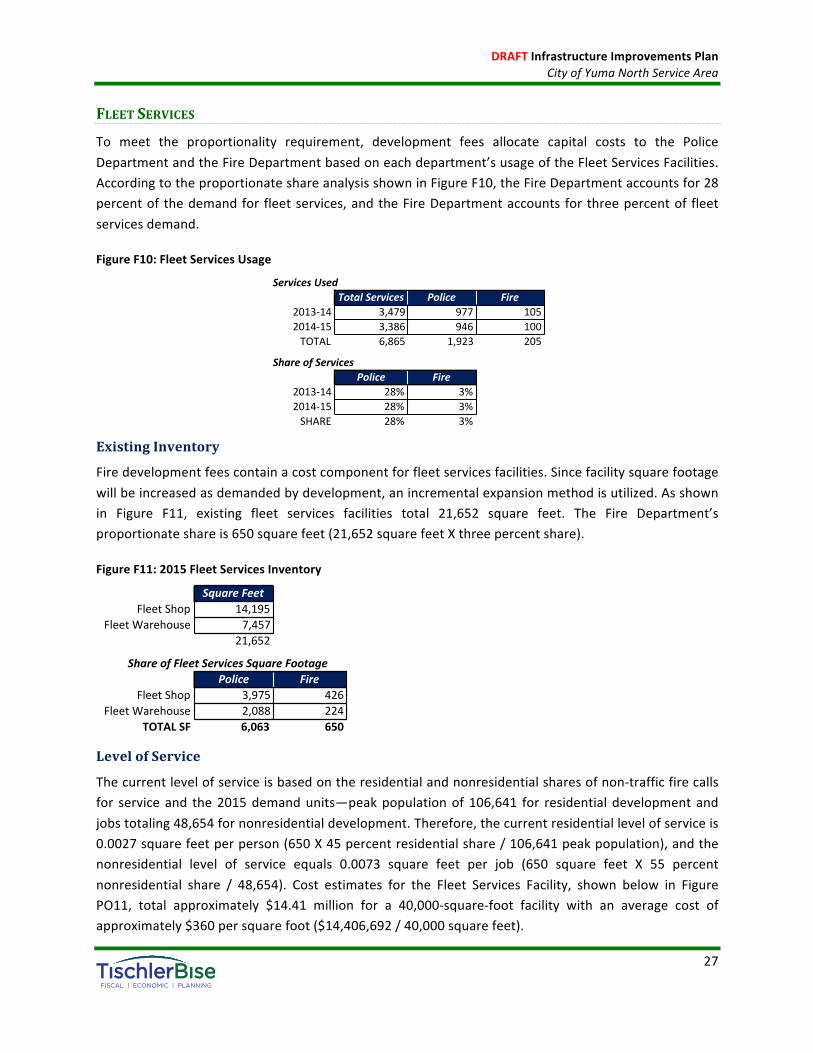
FLEETSERVICES
To meet the proportionality requirement, development fees allocate capital costs to the PoliceDepartmentandtheFireDepartmentbasedoneachdepartment’susageoftheFleetServicesFacilities.AccordingtotheproportionateshareanalysisshowninFigureF10,theFireDepartmentaccountsfor28percentof thedemandfor fleetservices,andtheFireDepartmentaccounts for threepercentof fleetservicesdemand.
FigureF10:FleetServicesUsage
ExistingInventory
Firedevelopmentfeescontainacostcomponentforfleetservicesfacilities.Sincefacilitysquarefootagewillbeincreasedasdemandedbydevelopment,anincrementalexpansionmethodisutilized.Asshownin Figure F11, existing fleet services facilities total 21,652 square feet. The Fire Department’sproportionateshareis650squarefeet(21,652squarefeetXthreepercentshare).
FigureF11:2015FleetServicesInventory
LevelofService
Thecurrentlevelofserviceisbasedontheresidentialandnonresidentialsharesofnon-trafficfirecallsfor serviceand the2015demandunits—peakpopulationof 106,641 for residential developmentandjobstotaling48,654fornonresidentialdevelopment.Therefore,thecurrentresidentiallevelofserviceis0.0027squarefeetperperson(650X45percentresidentialshare/106,641peakpopulation),andthenonresidential level of service equals 0.0073 square feet per job (650 square feet X 55 percentnonresidential share / 48,654). Cost estimates for the Fleet Services Facility, shown below in FigurePO11, total approximately $14.41 million for a 40,000-square-foot facility with an average cost ofapproximately$360persquarefoot($14,406,692/40,000squarefeet).
ServicesUsedTotalServices Police Fire
2013-14 3,479 977 1052014-15 3,386 946 100TOTAL 6,865 1,923 205
ShareofServicesPolice Fire
2013-14 28% 3%2014-15 28% 3%SHARE 28% 3%
SquareFeetFleetShop 14,195
FleetWarehouse 7,45721,652
ShareofFleetServicesSquareFootagePolice Fire
FleetShop 3,975 426FleetWarehouse 2,088 224
TOTALSF 6,063 650

DRAFTInfrastructureImprovementsPlanCityofYumaNorthServiceArea
28
FigureF12:CostAllocationforFleetServices–FireShare
ProjectedNeed
Shown inFigureF4,peakpopulation isprojectedto increaseby17,567personsby2035,and jobsareprojected to increase by 8,369 during the same period. When applied to the 2015 LOS, futuredevelopment will demand 110 square feet of fleet services facilities [(0.0027 LOS X 17,567 peakpopulationincrease)+(0.0073LOSX8,369jobsincrease)=110squarefeet).Basedontheaveragecostof $360 per square foot, the growth-related expenditure on fleet services facilities is $39,600 (110square feetX$360=$39,600).Thecostperperson is$1.01 ($39,600X45percent residential share/17,567 peak population increase = $1.01), and the cost per job is $2.60 ($39,600 X 55 percentnonresidentialshare/8,369jobsincrease=$2.60).
2015PeakPopulation 106,6412015Jobs 48,654
ExistingSquareFeet 650ResidentialShare 45%
NonresidentialShare 55%
Level-of-Service(LOS)Standards
LOS:SquareFeetperPerson 0.0027LOS:SquareFeetperJob 0.0073
CostBasisfromPlannedProjects
Project* SquareFeet* CostperSF TotalCost*FleetServices 40,000 $360 $14,406,692
CostAnalysis
AverageCostperSquareFoot $360
CostperPerson $1.01CostperJob $2.60
*Source:CityofYuma.

DRAFTInfrastructureImprovementsPlanCityofYumaNorthServiceArea
29
IIPANDDEVELOPMENTFEEREPORT
ThecosttopreparetheFireIIPanddevelopmentfeestotals$13,350.Yumaplanstoupdateitsreportevery five years.Basedon this cost, proportionate share, and five-yearprojectionsofnew residentialandnonresidentialdevelopmentfromtheLandUseAssumptions,thecostperpersonis$0.99andperjobis$1.83.
FigureF13:IIPandDevelopmentFeeReport
NecessaryPublicService Cost Assessed
AgainstProportionate
Share DemandUnit FY2015 FY2020 Change CostperDemandUnit
Parks $17,800 Residential 100% PeakPopulation 106,641 112,719 6,078 $2.93
Residential 61% PeakPopulation 106,641 112,719 6,078 $1.34Nonresidential 39% Nonres.Trips 207,689 224,857 17,168 $0.30Residential 45% PeakPopulation 106,641 112,719 6,078 $0.99Nonresidential 55% Jobs 48,654 52,673 4,019 $1.83Residential 73% PeakPopulation 106,641 112,719 6,078 $1.07Nonresidential 27% Jobs 48,654 52,673 4,019 $0.60ResidentialNonresidential
TOTAL $89,000
$0.93$35,600
Police
Fire
GeneralGovernment
Streets
$13,350
$13,350
$8,900
100% VMT 541,603 579,945 38,341

DRAFTInfrastructureImprovementsPlanCityofYumaNorthServiceArea
30
GENERALGOVERNMENTINFRASTRUCTUREIMPROVEMENTSPLANGeneral government development fees are not one of the infrastructure categories allowed underArizonalaw(seeAppendixB).However,facilitieswhichhavebeendebtfinancedcanbeincludedintheIIP and development fees. Since Yuma’s development fee for the repayment of City Hall debt wasadoptedbefore January1,2012and thedebtwas issuedbefore June1,2011,Yumamaycontinue tocollectdevelopmentfeestorepayCityHalldebt.TheserviceareaforallgeneralgovernmentfeesistheCity of Yuma North Service Area—defined as all lands within the City of Yuma located north of andincluding56thStreet.
METHODOLOGY
Tomeettheproportionalityrequirement,generalgovernmentdevelopmentfeesallocatecapitalcoststoresidentialandnonresidentialdevelopmentbasedonfunctionalpopulation(seeAppendixA).
CITYHALL
Toprovidecapacityfornewdevelopment,Yumadebt-financedthe2010improvementstoCityHall.Thisdevelopmentfeewillbeusedtocovernewdevelopment’sshareofCityHalldebtservicepayments.
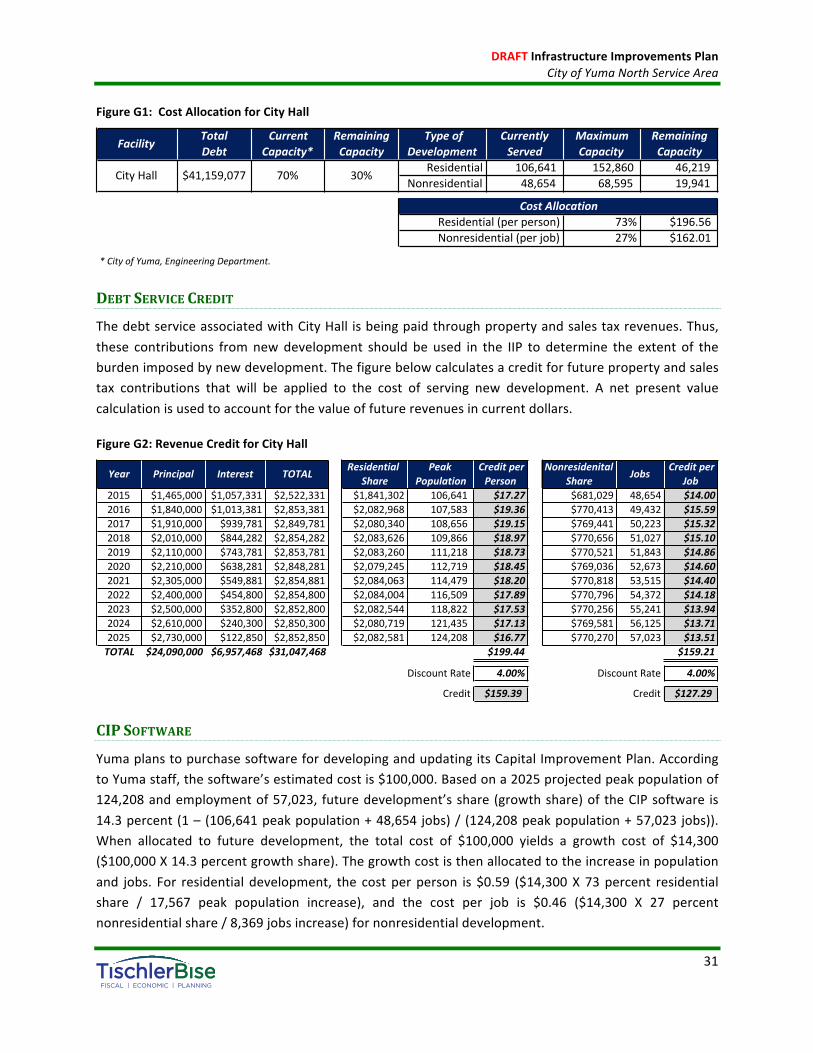
CityHallencompasses150,000squarefeetandwasoversizedtoservenewdevelopment.Basedonthecurrent number of employees and average square feet per work station, Yuma’s EngineeringDepartment estimates the facility is currently at 70 percent capacity. Using 2015 estimates of peakpopulationandjobsfromtheLandUseAssumptionsandtheproportionateshareallocationitispossibleto determine howmuch additional development City Hall can serve before reaching capacity. Usingresidentialdevelopment,thecurrentestimateofpeakpopulationof106,641 isdividedbythecurrentcapacitybeingutilized,which results ina totalpopulationat100percentcapacityof152,860persons(106,641 peak population / 70 percent = 152,860). Therefore, City Hall has capacity to serve anadditional46,219persons(152,860capacity–106,641peakpopulation).Thiscalculationisrepeatedfornonresidentialdevelopmentresultinginanadditional19,941jobstobeservedbyCityHall.
Totaldebt service forCityHall, as shown inFigureG1, is approximately$41.16million. Thedebtwasissuedin2010andwillberetiredin2025.Remainingcapacityisusedtodistributecoststoallusers.Toderivethecostperserviceunit,73percentofthedebtservice isallocatedtoresidentialdevelopmentand27percentisallocatedtononresidentialdevelopment.Thecostperpersonis$196.56($41,159,077totaldebtX73percentresidentialshare/152,860maximumcapacity)andthecostperjobis$162.01($41,159,077totaldebtX27percentnonresidentialshare/68,595maximumcapacity).
DRAFTInfrastructureImprovementsPlanCityofYumaNorthServiceArea
31
FigureG1:CostAllocationforCityHall
DEBTSERVICECREDIT
ThedebtserviceassociatedwithCityHall isbeingpaidthroughpropertyandsalestaxrevenues.Thus,these contributions fromnewdevelopment should be used in the IIP to determine the extent of theburdenimposedbynewdevelopment.Thefigurebelowcalculatesacreditforfuturepropertyandsalestax contributions that will be applied to the cost of serving new development. A net present valuecalculationisusedtoaccountforthevalueoffuturerevenuesincurrentdollars.
FigureG2:RevenueCreditforCityHall
CIPSOFTWARE
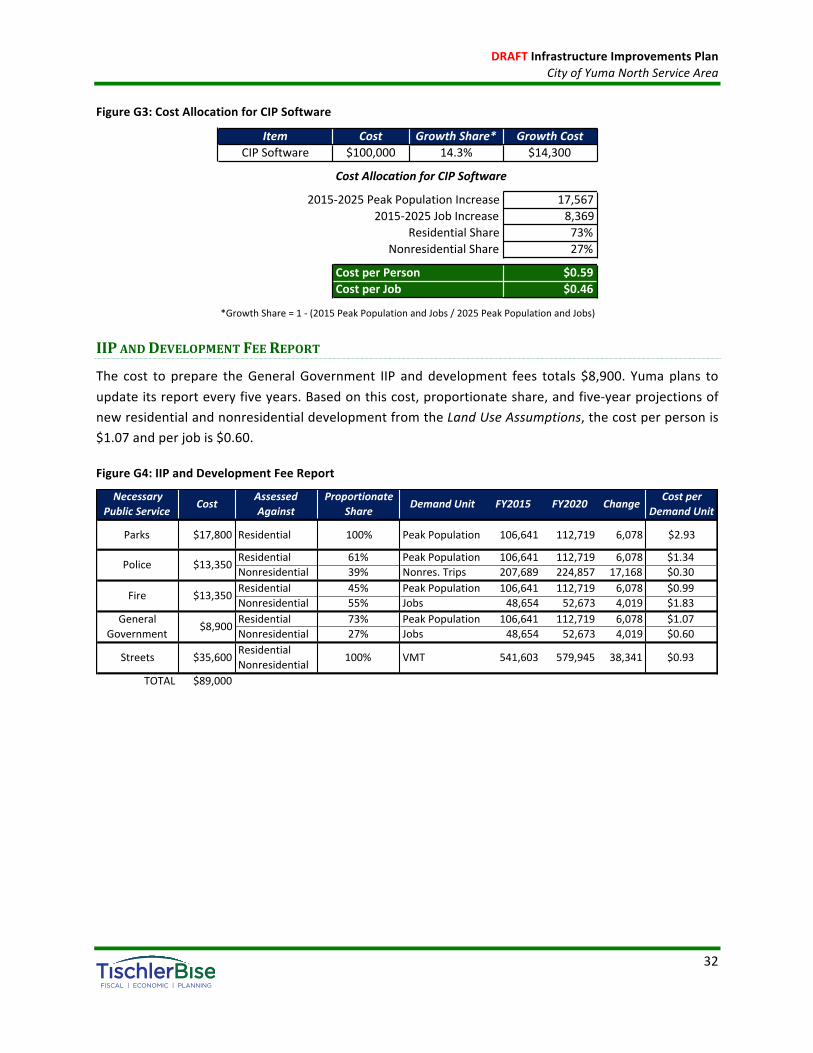
YumaplanstopurchasesoftwarefordevelopingandupdatingitsCapitalImprovementPlan.AccordingtoYumastaff,thesoftware’sestimatedcostis$100,000.Basedona2025projectedpeakpopulationof124,208andemploymentof57,023, futuredevelopment’sshare(growthshare)oftheCIPsoftware is14.3percent(1–(106,641peakpopulation+48,654jobs)/(124,208peakpopulation+57,023jobs)).When allocated to future development, the total cost of $100,000 yields a growth cost of $14,300($100,000X14.3percentgrowthshare).Thegrowthcostisthenallocatedtotheincreaseinpopulationand jobs. For residential development, the costperperson is $0.59 ($14,300X73percent residentialshare / 17,567 peak population increase), and the cost per job is $0.46 ($14,300 X 27 percentnonresidentialshare/8,369jobsincrease)fornonresidentialdevelopment.
Facility TotalDebt
CurrentCapacity*
RemainingCapacity
TypeofDevelopment
CurrentlyServed
MaximumCapacity
RemainingCapacity
Residential 106,641 152,860 46,219Nonresidential 48,654 68,595 19,941
73% $196.5627% $162.01
*CityofYuma,EngineeringDepartment.
CostAllocationResidential(perperson)Nonresidential(perjob)
CityHall 70% 30%$41,159,077
Residential Peak Creditper Nonresidenital CreditperShare Population Person Share Job
2015 $1,465,000 $1,057,331 $2,522,331 $1,841,302 106,641 $17.27 $681,029 48,654 $14.002016 $1,840,000 $1,013,381 $2,853,381 $2,082,968 107,583 $19.36 $770,413 49,432 $15.592017 $1,910,000 $939,781 $2,849,781 $2,080,340 108,656 $19.15 $769,441 50,223 $15.322018 $2,010,000 $844,282 $2,854,282 $2,083,626 109,866 $18.97 $770,656 51,027 $15.102019 $2,110,000 $743,781 $2,853,781 $2,083,260 111,218 $18.73 $770,521 51,843 $14.862020 $2,210,000 $638,281 $2,848,281 $2,079,245 112,719 $18.45 $769,036 52,673 $14.602021 $2,305,000 $549,881 $2,854,881 $2,084,063 114,479 $18.20 $770,818 53,515 $14.402022 $2,400,000 $454,800 $2,854,800 $2,084,004 116,509 $17.89 $770,796 54,372 $14.182023 $2,500,000 $352,800 $2,852,800 $2,082,544 118,822 $17.53 $770,256 55,241 $13.942024 $2,610,000 $240,300 $2,850,300 $2,080,719 121,435 $17.13 $769,581 56,125 $13.712025 $2,730,000 $122,850 $2,852,850 $2,082,581 124,208 $16.77 $770,270 57,023 $13.51TOTAL $24,090,000 $6,957,468 $31,047,468 $199.44 $159.21
DiscountRate 4.00% DiscountRate 4.00%
Credit $159.39 Credit $127.29
Year Principal Interest TOTAL Jobs
DRAFTInfrastructureImprovementsPlanCityofYumaNorthServiceArea
32
FigureG3:CostAllocationforCIPSoftware
IIPANDDEVELOPMENTFEEREPORT
The cost to prepare theGeneralGovernment IIP and development fees totals $8,900. Yumaplans toupdateitsreporteveryfiveyears.Basedonthiscost,proportionateshare,andfive-yearprojectionsofnewresidentialandnonresidentialdevelopmentfromtheLandUseAssumptions,thecostperpersonis$1.07andperjobis$0.60.
FigureG4:IIPandDevelopmentFeeReport
Item Cost GrowthShare* GrowthCostCIPSoftware $100,000 14.3% $14,300
CostAllocationforCIPSoftware
2015-2025PeakPopulationIncrease 17,5672015-2025JobIncrease 8,369
ResidentialShare 73%NonresidentialShare 27%
$0.59$0.46
*GrowthShare=1-(2015PeakPopulationandJobs/2025PeakPopulationandJobs)
CostperPersonCostperJob
NecessaryPublicService Cost Assessed
AgainstProportionate
Share DemandUnit FY2015 FY2020 Change CostperDemandUnit
Parks $17,800 Residential 100% PeakPopulation 106,641 112,719 6,078 $2.93
Residential 61% PeakPopulation 106,641 112,719 6,078 $1.34Nonresidential 39% Nonres.Trips 207,689 224,857 17,168 $0.30Residential 45% PeakPopulation 106,641 112,719 6,078 $0.99Nonresidential 55% Jobs 48,654 52,673 4,019 $1.83Residential 73% PeakPopulation 106,641 112,719 6,078 $1.07Nonresidential 27% Jobs 48,654 52,673 4,019 $0.60ResidentialNonresidential
TOTAL $89,000
$0.93$35,600
Police
Fire
GeneralGovernment
Streets
$13,350
$13,350
$8,900
100% VMT 541,603 579,945 38,341
DRAFTInfrastructureImprovementsPlanCityofYumaNorthServiceArea
33
STREETINFRASTRUCTUREIMPROVEMENTSPLANStreet development fees are one of the infrastructure categories allowed under Arizona law (seeAppendixB).YumawillcollectStreetdevelopmentfeesforarterialstreets,intersections,bikepaths,andbikelanes.StatelawrequiresYumatohaveanadoptedinfrastructureimprovementsplan(IIP)inordertoassessdevelopmentfees.TheserviceareaforallstreetfeesistheCityofYumaNorthServiceArea—definedasalllandswithintheCityofYumalocatednorthofandincluding56thStreet.
STREETCOMPONENTS
Development fees for streets are derived using an incremental approach for growth-related arterial,intersection, and bike lane improvements with vehicle miles of travel as the demand units. EachcomponentusedtoderivevehiclemilesoftravelisdescribedinAppendixA.
YumaTravelDemand
The relationship between the amount of development in Yuma and growth-related systemimprovements isdocumentedbelow.FigureS1summarizes the inputvariablesusedtodeterminetheaverage trip lengthonarterial improvements. In the tablebelowHUmeanshousingunits,KSFmeanssquare feet of nonresidential development, in thousands, Institute of Transportation Engineers isabbreviated ITE,VTEmeansvehicle tripends,andVMTmeansvehiclemilesof travel.TripgenerationratesbytypeofhousingunitaredocumentedinFigureA11andrelatedtext.
ProjecteddevelopmentinYumaoverthenexttenyears,andthecorrespondingneedforadditionallanemiles, is shown in themiddle section of Figure S1. Trip generation rates and trip adjustment factorsconvert projected development into average weekday vehicle trips. A typical vehicle trip, such as aperson leavingtheirhomeandtravelingtowork,generallybeginsona localstreet thatconnects toacollectorstreet,whichconnectstoanarterialroadandeventuallytoastateorinterstatehighway.Thisprogression of travel up and down the functional classification chain limits the average trip lengthdetermination, for thepurposeofdevelopment fees, to the followingquestion, “What is theaveragevehicletriplengthondevelopmentfeesystemimprovements?”
AVehicleMileof Travel (VMT) is ameasurementunit equal toone vehicle travelingonemile. In theaggregate, VMT is the product of daily traffic on a roadway segment (vehicle trips)multiplied by thelengthofthatsegment.Alanemileisarectangularareaofpavement,onelanewideandonemilelong.Thesegmentlengthinthisstudyreflectsthe“consumption”orutilizationoftheroadwaysystemandiscalibrated to the current and planned arterial network of lanemiles and a lane capacity standard of9,700vehiclesperlane.

DRAFTInfrastructureImprovementsPlanCityofYumaNorthServiceArea
34
FigureS1showsthecalibrationofexistingdevelopmenttoYuma’scurrentarterialnetwork.Knowingthecurrentarterial lanemiles (204.7)TischlerBisedetermined theweighted-averagemilesper tripon thecurrentarterialnetworkis5.57miles.
Themethodologyisasfollows:
• With an existing inventory of 204.7 lanemiles of arterials and an average daily lane capacitystandardof 9,700 vehiclesper lane, thearterial network canaccommodate1,985,404 vehiclemilesoftravel(i.e.,9,700vehiclesperdaytravelingtheentire204.7lanemiles).
• To derive the average utilization (expressed in miles per trip) of the existing systemimprovements, we divide vehicle miles of travel by the aggregate number of vehicle tripsassociated with development in Yuma. Existing development in Yuma currently generates anestimated386,570vehicle tripsonanaverageday.Basedon1,985,404vehiclemilesof travelthat canbeaccommodatedon theexistingarterialnetwork,and386,570averagedayvehicletrips,theaverageutilizationofthearterialnetworkisapproximately5.14milespertrip.
• However, to be consistent with the methodology used in the development fee calculations,TischlerBise further refined the average utilization through a series of iterations usingspreadsheet software. This refinement is necessary because the calibration of averageutilizationincludesthesameadjustmentfactorsusedinthedevelopmentfeecalculations(i.e.,residential commuting adjustment, commercial pass-by adjustment, and average trip lengthadjustment by type of land use as discussed below). With these additional refinements,TischlerBisedeterminedtheaverageutilizationonthearterialnetworktobe5.57milespertrip,asshowninFigureS1.

DRAFTInfrastructureImprovementsPlanCityofYumaNorthServiceArea
35
FigureS1:YumaTravelDemandandTripLengthCalibration
Tomaintainthislevelofservice,Yumaneedstoconstruct36.5lanemilesoverthenext10yearstoservegrowth.Developmentprojectionsaremultipliedbythe inputvariablesat thetopofFigureS1toyieldaverageweekdaytraveldemandonarterialsinYuma.Tripgenerationratesandtripadjustmentfactorsconvertprojecteddevelopmentintoaverageweekdayvehicletrips,shownwith lightblueshading.Forexample,in2015the21,427single-familyhousingunitsproduce112,314averageweekdaytrips(21,427single-family units X 9.36 averageweekday vehicle trip ends X 56 percent trip adjustment). Similarly,officeandinstitutionaldevelopmentin2015generates27,070averageweekdayvehicletrips(4,908KSFX11.03averageweekdayvehicletripsper1,000squarefeetX50percenttripadjustment).
Dev ITE Weekday Dev Trip TripLengthType Code VTE Unit Adj WtFactor
SingleFamily 210 9.36 HU 56% 121%
Multi-Family 220 7.09 HU 56% 121%
AllOtherTypesofHousing 240 5.81 HU 56% 121%
Commercial/Retail 820 42.70 KSF 33% 66%
Office/Institutional 710 11.03 KSF 50% 73%
Industrial/Flex 110 6.97 KSF 50% 73%
AvgTripLength(miles) 5.57
VehicleCapacityPerLane 9,700
Base 1 2 3 4 52015 2016 2017 2018 2019 2020
SingleFamily 21,427 21,649 21,902 22,187 22,506 22,860
Multi-Family 7,494 7,582 7,682 7,795 7,922 8,062
AllOtherTypesofHousing 11,315 11,387 11,470 11,563 11,668 11,784
Commercial/RetailKSF 11,904 12,094 12,288 12,485 12,685 12,888
Office/InstitutionalKSF 4,908 4,987 5,067 5,148 5,230 5,314
Industrial/flexKSF 3,698 3,757 3,817 3,878 3,940 4,003
SingleFamilyTrips 112,314 113,475 114,802 116,295 117,967 119,823
Multi-FamilyTrips 29,754 30,104 30,501 30,949 31,454 32,009
AllOtherTypesofHousingTrips 36,814 37,049 37,319 37,621 37,963 38,340
Commercial/RetailTrips 167,732 170,410 173,143 175,919 178,737 181,598
Office/InstitutionalTrips 27,070 27,506 27,947 28,393 28,846 29,309
Industrial/FlexTrips 12,887 13,093 13,302 13,514 13,730 13,950
TotalVehicleTrips 386,570 391,635 397,012 402,693 408,697 415,029VehicleMilesofTravel(VMT) 1,985,404 2,009,633 2,035,770 2,063,797 2,093,855 2,125,955ARTERIALLANEMILES 204.7 207.2 209.9 212.8 215.9 219.2
IMPROVEDINTERSECTIONS 28.0 28.3 28.7 29.1 29.5 30.0
BIKELANES(MILES) 12.4 12.6 12.7 12.9 13.1 13.3
Ten-YearVMTIncrease=>
10202525,569
9,135
12,672
13,953
5,753
4,334
134,022
36,270
41,230
196,605
31,730
15,103
454,9602,339,620
241.2
33.0
14.6
Ten-YearVMTIncrease=>
10-YearIncrease
4,1421,6411,3572,049845636
21,7086,5164,41628,8724,6602,21668,390
354,21636.55.02.2
15.1%
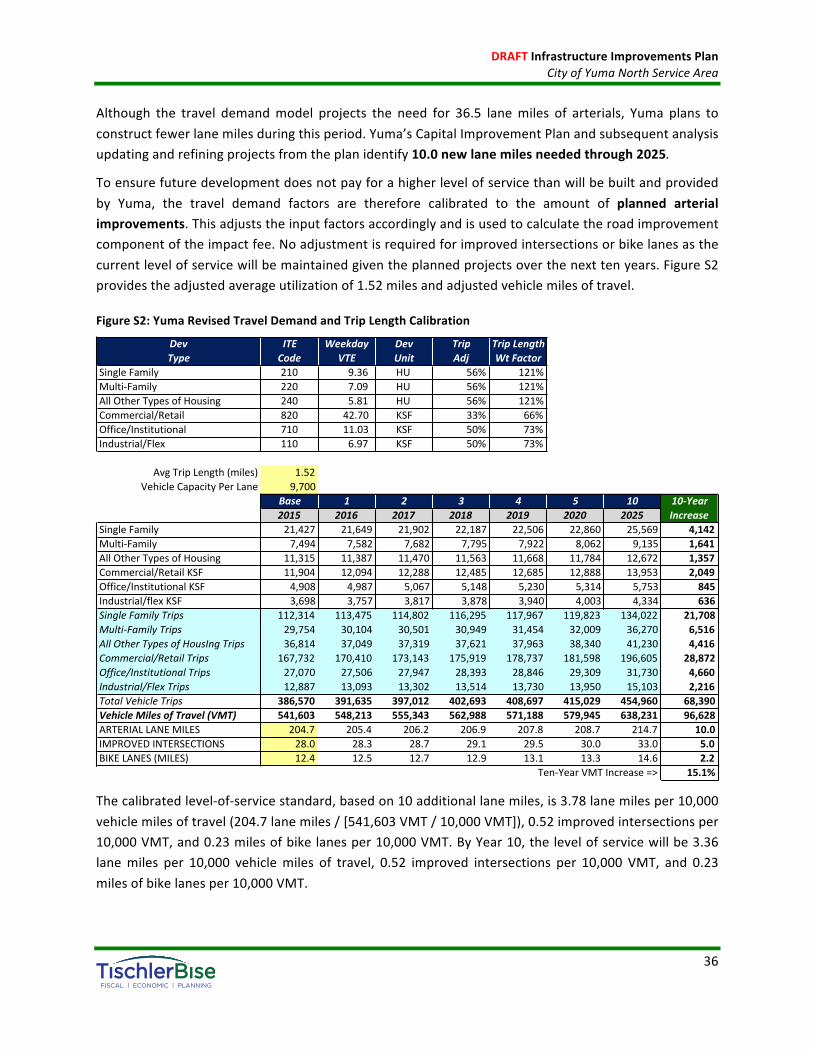
DRAFTInfrastructureImprovementsPlanCityofYumaNorthServiceArea
36
Although the travel demandmodel projects the need for 36.5 lanemiles of arterials, Yuma plans toconstructfewerlanemilesduringthisperiod.Yuma’sCapitalImprovementPlanandsubsequentanalysisupdatingandrefiningprojectsfromtheplanidentify10.0newlanemilesneededthrough2025.
Toensurefuturedevelopmentdoesnotpayforahigherlevelofservicethanwillbebuiltandprovidedby Yuma, the travel demand factors are therefore calibrated to the amount of planned arterialimprovements.Thisadjuststheinputfactorsaccordinglyandisusedtocalculatetheroadimprovementcomponentoftheimpactfee.Noadjustmentisrequiredforimprovedintersectionsorbikelanesasthecurrentlevelofservicewillbemaintainedgiventheplannedprojectsoverthenexttenyears.FigureS2providestheadjustedaverageutilizationof1.52milesandadjustedvehiclemilesoftravel.
FigureS2:YumaRevisedTravelDemandandTripLengthCalibration
Thecalibratedlevel-of-servicestandard,basedon10additionallanemiles,is3.78lanemilesper10,000vehiclemilesoftravel(204.7lanemiles/[541,603VMT/10,000VMT]),0.52improvedintersectionsper10,000VMT,and0.23milesofbikelanesper10,000VMT.ByYear10,thelevelofservicewillbe3.36lanemiles per 10,000 vehiclemiles of travel, 0.52 improved intersections per 10,000 VMT, and 0.23milesofbikelanesper10,000VMT.
Dev ITE Weekday Dev Trip TripLengthType Code VTE Unit Adj WtFactor
SingleFamily 210 9.36 HU 56% 121%
Multi-Family 220 7.09 HU 56% 121%
AllOtherTypesofHousing 240 5.81 HU 56% 121%
Commercial/Retail 820 42.70 KSF 33% 66%
Office/Institutional 710 11.03 KSF 50% 73%
Industrial/Flex 110 6.97 KSF 50% 73%
AvgTripLength(miles) 1.52
VehicleCapacityPerLane 9,700
Base 1 2 3 4 52015 2016 2017 2018 2019 2020
SingleFamily 21,427 21,649 21,902 22,187 22,506 22,860
Multi-Family 7,494 7,582 7,682 7,795 7,922 8,062
AllOtherTypesofHousing 11,315 11,387 11,470 11,563 11,668 11,784
Commercial/RetailKSF 11,904 12,094 12,288 12,485 12,685 12,888
Office/InstitutionalKSF 4,908 4,987 5,067 5,148 5,230 5,314
Industrial/flexKSF 3,698 3,757 3,817 3,878 3,940 4,003
SingleFamilyTrips 112,314 113,475 114,802 116,295 117,967 119,823
Multi-FamilyTrips 29,754 30,104 30,501 30,949 31,454 32,009
AllOtherTypesofHousIngTrips 36,814 37,049 37,319 37,621 37,963 38,340
Commercial/RetailTrips 167,732 170,410 173,143 175,919 178,737 181,598
Office/InstitutionalTrips 27,070 27,506 27,947 28,393 28,846 29,309
Industrial/FlexTrips 12,887 13,093 13,302 13,514 13,730 13,950
TotalVehicleTrips 386,570 391,635 397,012 402,693 408,697 415,029
10202525,569
9,135
12,672
13,953
5,753
4,334
134,022
36,270
41,230
196,605
31,730
15,103
454,960
10-YearIncrease
4,1421,6411,3572,049845636
21,7086,5164,41628,8724,6602,21668,390
VehicleMilesofTravel(VMT) 541,603 548,213 555,343 562,988 571,188 579,945ARTERIALLANEMILES 204.7 205.4 206.2 206.9 207.8 208.7
638,231214.7
96,62810.0
IMPROVEDINTERSECTIONS 28.0 28.3 28.7 29.1 29.5 30.0 33.0 5.0BIKELANES(MILES) 12.4 12.5 12.7 12.9 13.1 13.3 14.6 2.2
Ten-YearVMTIncrease=>Ten-YearVMTIncrease=> 15.1%

DRAFTInfrastructureImprovementsPlanCityofYumaNorthServiceArea
37
ARTERIALS
Based on 2015 vehiclemiles of travel of 541,603 and 204.7 arterial lanemiles, the existing level-of-servicestandardinYumais3.78lanemilesper10,000VMT(204.7lanemiles/[541,603VMT/10,000])andtheplannedlevelofserviceis3.36lanemilesper10,000VMT(214.7lanemiles/[638,231VMT/10,000]).ShownbelowinFigureS3,theaveragecostofapproximately$989,970perarterial lanemile($46,004,013/46.47)isbasedonprojectsfromYuma’sCIP.
Asdiscussedabove,maintainingthecurrentlevelofservicerequiresconstructionof36.5lanemilesofarterialsoverthenexttenyears,butYumaexpectstoconstructten lanemilesofarterialsduringthatperiod.This IIP includes46.47 lanemilesofeligiblearterial improvementsacrossall areasof thecity.Includingmanyprojectsandusingtheaveragecostoftheseprojectsallowstheconstructionofarterialimprovements in areaswhere growth occurs. Previously, if a large development caused the need forarterial improvements not listed in the IIP, Yuma would have been required to update its IIP anddevelopment fees to include the improvement. This hybrid approach gives Yuma the flexibility toidentify awide rangeofpotential improvements and construct specific improvements in theareasofYumaexperiencinggrowth.
FigureS3:ExistingStandardsforArterials
ArterialLaneMiles 204.72015VMT 541,603
Level-of-Service(LOS)Standards
LOS:ArterialLaneMilesper10,000VMT 3.7800
ArterialImprovementCostFactors
EligibleProjects NewLaneMiles*
CostperLaneMile
TotalCost*
Avenue9E-28thStreettoN.FrontageRd 1.00 $912,500 $912,50028thStreet-45thAvenuetoAvenueC 1.00 $912,500 $912,50040thStreet-Avenue3EtoAvenue6E 6.00 $912,500 $5,475,00040thStreet-Avenue63/4EtoAvenue8E 5.00 $912,500 $4,562,50040thStreet-Avenue8EtoAvenue10E 8.00 $912,500 $7,300,000Avenue31/2E-Avenue3Eto48thStreet 8.00 $912,500 $7,300,00012thStreet-PacificAvenuetoAvenue3E 2.00 $912,500 $1,825,00032ndStreet-AvenueBtoAvenueB1/3 0.67 $908,415 $608,63816thStreet-C1/2(45th)to46thDrive 0.50 $912,500 $456,250GissParkway-WBOff-Rampto8thStreettoPacificAvenueto12thStreet 2.25 $912,500 $2,053,125
Avenue9E-24thStreetto28thStreet 1.00 $912,500 $912,500Avenue10E-S.FrontageRoadto40thSt 2.50 $912,500 $2,281,250Avenue10E-40thStreetto48thStreet 4.00 $912,500 $3,650,000Avenue10E-48thStreetto56thStreet 4.00 $912,500 $3,650,00040thSt&HWY195(BridgeDesign) 0.23 $8,647,826 $1,989,00048thSt&HWY195(BridgeDesign) 0.15 $8,840,000 $1,326,0007E&BCanal(BridgeDesign) 0.10 $4,738,500 $473,85048thSt&BCanal(BridgeDesign) 0.07 $4,512,857 $315,900
TOTAL 46.47 $989,970 $46,004,013
CostAnalysis
AverageCostperLaneMile $989,970
CostperVMT $102.45
*YumaEngineeringDepartment.
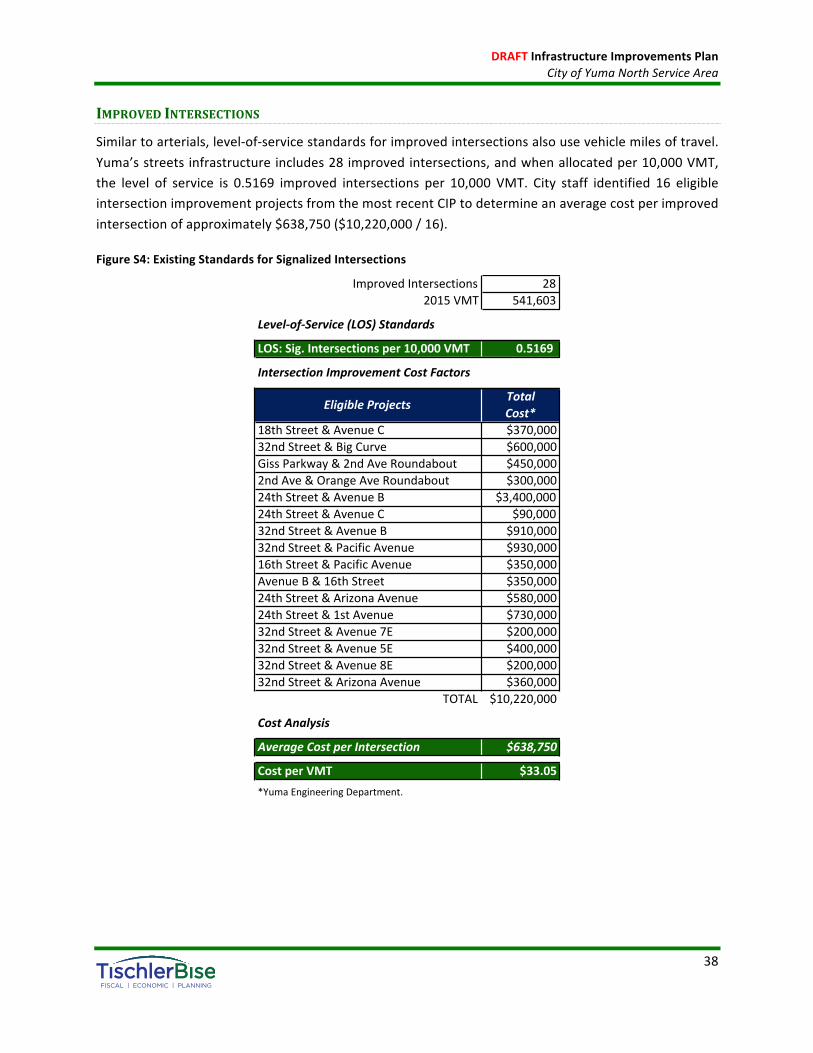
DRAFTInfrastructureImprovementsPlanCityofYumaNorthServiceArea
38
IMPROVEDINTERSECTIONS
Similartoarterials,level-of-servicestandardsforimprovedintersectionsalsousevehiclemilesoftravel.Yuma’sstreetsinfrastructureincludes28improvedintersections,andwhenallocatedper10,000VMT,the level of service is 0.5169 improved intersections per 10,000 VMT. City staff identified 16 eligibleintersectionimprovementprojectsfromthemostrecentCIPtodetermineanaveragecostperimprovedintersectionofapproximately$638,750($10,220,000/16).
FigureS4:ExistingStandardsforSignalizedIntersections
ImprovedIntersections 282015VMT 541,603
Level-of-Service(LOS)Standards
LOS:Sig.Intersectionsper10,000VMT 0.5169
IntersectionImprovementCostFactors
EligibleProjects TotalCost*
18thStreet&AvenueC $370,00032ndStreet&BigCurve $600,000GissParkway&2ndAveRoundabout $450,0002ndAve&OrangeAveRoundabout $300,00024thStreet&AvenueB $3,400,00024thStreet&AvenueC $90,00032ndStreet&AvenueB $910,00032ndStreet&PacificAvenue $930,00016thStreet&PacificAvenue $350,000AvenueB&16thStreet $350,00024thStreet&ArizonaAvenue $580,00024thStreet&1stAvenue $730,00032ndStreet&Avenue7E $200,00032ndStreet&Avenue5E $400,00032ndStreet&Avenue8E $200,00032ndStreet&ArizonaAvenue $360,000
TOTAL $10,220,000
CostAnalysis
AverageCostperIntersection $638,750
CostperVMT $33.05*YumaEngineeringDepartment.
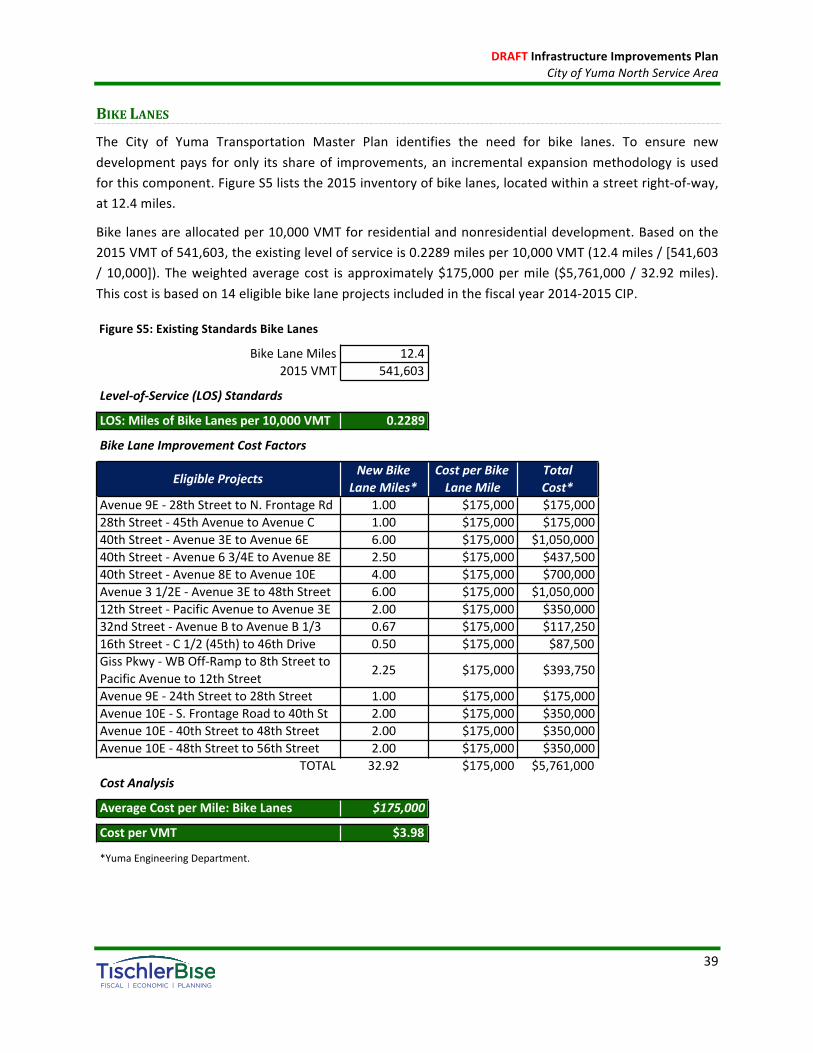
DRAFTInfrastructureImprovementsPlanCityofYumaNorthServiceArea
39
BIKELANES
The City of Yuma Transportation Master Plan identifies the need for bike lanes. To ensure newdevelopmentpays foronly itsshareof improvements,an incrementalexpansionmethodology isusedforthiscomponent.FigureS5liststhe2015inventoryofbikelanes,locatedwithinastreetright-of-way,at12.4miles.
Bikelanesareallocatedper10,000VMTforresidentialandnonresidentialdevelopment.Basedonthe2015VMTof541,603,theexistinglevelofserviceis0.2289milesper10,000VMT(12.4miles/[541,603/10,000]). Theweightedaveragecost is approximately$175,000permile ($5,761,000 /32.92miles).Thiscostisbasedon14eligiblebikelaneprojectsincludedinthefiscalyear2014-2015CIP.
FigureS5:ExistingStandardsBikeLanes
BikeLaneMiles 12.42015VMT 541,603
Level-of-Service(LOS)Standards
LOS:MilesofBikeLanesper10,000VMT 0.2289
BikeLaneImprovementCostFactors
EligibleProjects NewBikeLaneMiles*
CostperBikeLaneMile
TotalCost*
Avenue9E-28thStreettoN.FrontageRd 1.00 $175,000 $175,00028thStreet-45thAvenuetoAvenueC 1.00 $175,000 $175,00040thStreet-Avenue3EtoAvenue6E 6.00 $175,000 $1,050,00040thStreet-Avenue63/4EtoAvenue8E 2.50 $175,000 $437,50040thStreet-Avenue8EtoAvenue10E 4.00 $175,000 $700,000Avenue31/2E-Avenue3Eto48thStreet 6.00 $175,000 $1,050,00012thStreet-PacificAvenuetoAvenue3E 2.00 $175,000 $350,00032ndStreet-AvenueBtoAvenueB1/3 0.67 $175,000 $117,25016thStreet-C1/2(45th)to46thDrive 0.50 $175,000 $87,500GissPkwy-WBOff-Rampto8thStreettoPacificAvenueto12thStreet 2.25 $175,000 $393,750
Avenue9E-24thStreetto28thStreet 1.00 $175,000 $175,000Avenue10E-S.FrontageRoadto40thSt 2.00 $175,000 $350,000Avenue10E-40thStreetto48thStreet 2.00 $175,000 $350,000Avenue10E-48thStreetto56thStreet 2.00 $175,000 $350,000
TOTAL 32.92 $175,000 $5,761,000CostAnalysis
AverageCostperMile:BikeLanes $175,000
CostperVMT $3.98
*YumaEngineeringDepartment.
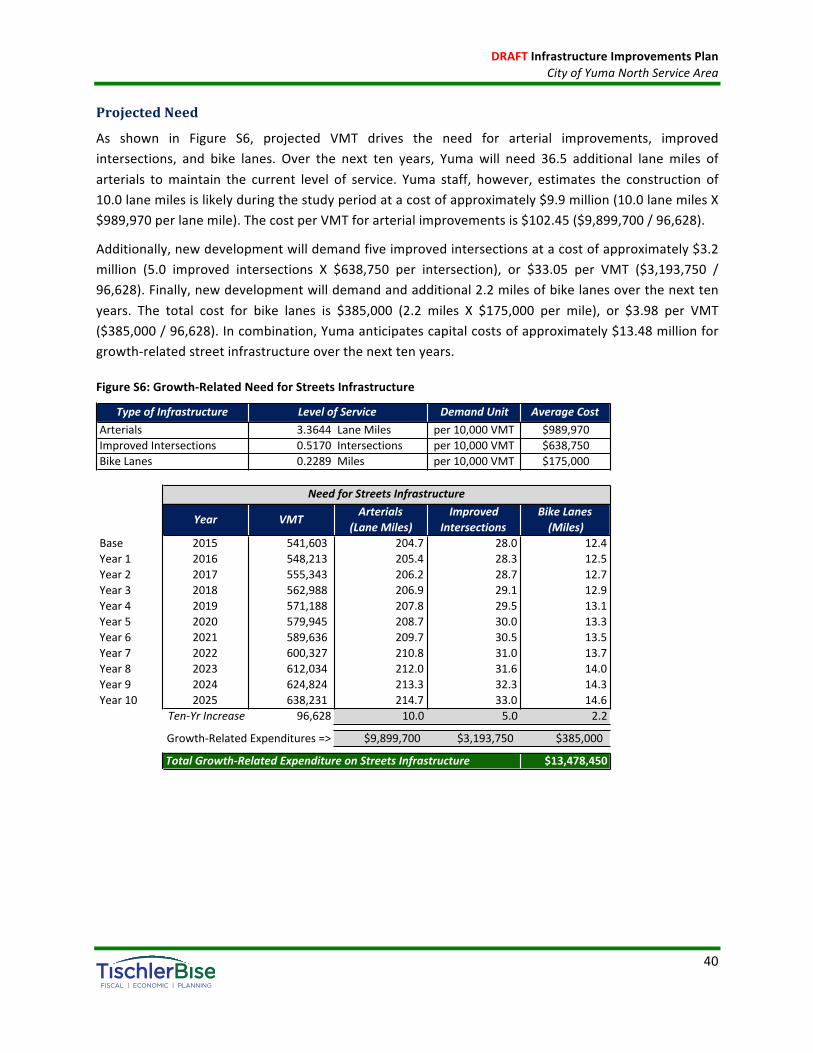
DRAFTInfrastructureImprovementsPlanCityofYumaNorthServiceArea
40
ProjectedNeed
As shown in Figure S6, projected VMT drives the need for arterial improvements, improvedintersections, and bike lanes. Over the next ten years, Yuma will need 36.5 additional lanemiles ofarterials tomaintain the current level of service. Yuma staff, however, estimates the construction of10.0lanemilesislikelyduringthestudyperiodatacostofapproximately$9.9million(10.0lanemilesX$989,970perlanemile).ThecostperVMTforarterialimprovementsis$102.45($9,899,700/96,628).
Additionally,newdevelopmentwilldemandfiveimprovedintersectionsatacostofapproximately$3.2million (5.0 improved intersections X $638,750 per intersection), or $33.05 per VMT ($3,193,750 /96,628).Finally,newdevelopmentwilldemandandadditional2.2milesofbikelanesoverthenexttenyears. The total cost for bike lanes is $385,000 (2.2 miles X $175,000 per mile), or $3.98 per VMT($385,000/96,628).Incombination,Yumaanticipatescapitalcostsofapproximately$13.48millionforgrowth-relatedstreetinfrastructureoverthenexttenyears.
FigureS6:Growth-RelatedNeedforStreetsInfrastructure
DemandUnit AverageCostArterials 3.3644 LaneMiles per10,000VMT $989,970ImprovedIntersections 0.5170 Intersections per10,000VMT $638,750BikeLanes 0.2289 Miles per10,000VMT $175,000
Year VMT Arterials(LaneMiles)
ImprovedIntersections
BikeLanes(Miles)
Base 2015 541,603 204.7 28.0 12.4Year1 2016 548,213 205.4 28.3 12.5Year2 2017 555,343 206.2 28.7 12.7Year3 2018 562,988 206.9 29.1 12.9Year4 2019 571,188 207.8 29.5 13.1Year5 2020 579,945 208.7 30.0 13.3Year6 2021 589,636 209.7 30.5 13.5Year7 2022 600,327 210.8 31.0 13.7Year8 2023 612,034 212.0 31.6 14.0Year9 2024 624,824 213.3 32.3 14.3Year10 2025 638,231 214.7 33.0 14.6
Ten-YrIncrease 96,628 10.0 5.0 2.2
Growth-RelatedExpenditures=> $9,899,700 $3,193,750 $385,000
$13,478,450TotalGrowth-RelatedExpenditureonStreetsInfrastructure
TypeofInfrastructure LevelofService
NeedforStreetsInfrastructure

DRAFTInfrastructureImprovementsPlanCityofYumaNorthServiceArea
41
IIPANDDEVELOPMENTFEEREPORT
The cost to prepare the Streets IIP and development fees totals $35,600. Yuma plans to update itsreport every five years. Based on this cost, proportionate share, and five-year projections of newresidentialandnonresidentialdevelopmentfromtheLandUseAssumptions,thecostperVMTis$0.93.
FigureS7:IIPandDevelopmentFeeReport
NecessaryPublicService Cost Assessed
AgainstProportionate
Share DemandUnit FY2015 FY2020 Change CostperDemandUnit
Parks $17,800 Residential 100% PeakPopulation 106,641 112,719 6,078 $2.93
Residential 61% PeakPopulation 106,641 112,719 6,078 $1.34Nonresidential 39% Nonres.Trips 207,689 224,857 17,168 $0.30Residential 45% PeakPopulation 106,641 112,719 6,078 $0.99Nonresidential 55% Jobs 48,654 52,673 4,019 $1.83Residential 73% PeakPopulation 106,641 112,719 6,078 $1.07Nonresidential 27% Jobs 48,654 52,673 4,019 $0.60ResidentialNonresidential
TOTAL $89,000
$0.93$35,600
Police
Fire
GeneralGovernment
Streets
$13,350
$13,350
$8,900
100% VMT 541,603 579,945 38,341

DRAFTInfrastructureImprovementsPlanCityofYumaNorthServiceArea
42
APPENDIXA:LANDUSEASSUMPTIONSArizona Revised Statutes (ARS) 9-463.05 (T)(7) requires the preparation of a Land Use Assumptionsdocument,whichshows:
“projections of changes in land uses, densities, intensities and population for aspecifiedserviceareaoveraperiodofatleasttenyearsandpursuanttotheGeneralPlanofthemunicipality.”
TischlerBise prepared current demographic estimates and future development projections for bothresidentialandnonresidentialdevelopment thatwillbeused in the Infrastructure ImprovementsPlan(IIP)andcalculationofthedevelopmentfees.Currentdemographicdataestimatesfor2015areusedincalculating levelsof service (LOS)provided toexistingdevelopment in theCityofYumaNorthServiceArea—referred to as “Yuma” or “City of Yuma” throughout this document. Although long-rangeprojectionsarenecessaryforplanninginfrastructuresystems,ashortertimeframeoffivetotenyearsiscriticalforthedevelopmentfeeanalysis.
Arizona’sDevelopmentFeeActrequiresfeestobeupdatedatleasteveryfiveyearsandlimitstheIIPtoa maximum of ten years. Therefore, the use of a very long-range “build-out” analysis is no longeracceptableforderivingdevelopmentfeesinArizonamunicipalities.
SUMMARYOFGROWTHINDICATORS
KeylanduseassumptionsfortheCityofYumadevelopmentfeestudyarepopulation,housingunits,andemployment projections. Housing units are estimated by adding housing permits by type of unitprovidedbytheCityofYumatothe2010Censushousingunitestimate.Thehousingunitgrowthrate,basedonthenumberofpermitsissuedsincethepreviousstudy,isusedtoprojectfuturehousingunits.TischlerBiseusesArizonaDepartmentofAdministrationpopulationestimates toderive the2015baseyearpopulationandconvertedprojectedhousingunitstopopulationusing2014AmericanCommunitySurvey data. For nonresidential development, the Arizona Department of Administration 2014-2016nonfarmaverageannual growth rate (excludingMaricopa,Pinal, andPimaCounties) is applied to thebase year employment estimate from Esri’s 2015 business summary for Yuma. The employmentestimate is converted into floor area based on average square feet per job multipliers. Threenonresidentialdevelopmentprototypesarediscussedfurtherbelow(seeFigureA7andrelatedtext).
DevelopmentprojectionsandgrowthratesaresummarizedinFigureA1.Theseprojectionswillbeusedto estimate development fee revenue and to indicate the anticipated need for growth-relatedinfrastructure. However, development fees methodologies are designed to reduce sensitivity todevelopment projections in the determination of the proportionate-share fee amounts. If actualdevelopmentisslowerthanprojected,feerevenuewilldecline,butsowilltheneedforgrowth-relatedinfrastructure.Incontrast,ifdevelopmentisfasterthananticipated,Yumawillreceiveanincreaseinfeerevenue,butwillalsoneedtoaccelerateinfrastructureimprovementstokeeppacewiththeactualrateofdevelopment.

DRAFTInfrastructureImprovementsPlanCityofYumaNorthServiceArea
43
Duringthenextfiveyears,landuseassumptionsindicateanaverageincreaseof494housingunitsperyear.Also,Yumaexpectstoaddnonresidentialfloorareaaveragingapproximately339,000squarefeetperyear.
FigureA1:SummaryofDevelopmentProjections
2015 2016 2017 2018 2019 2020 2025 IncreaseCompoundGrowthRate
HousingUnits 40,236 40,618 41,054 41,547 42,097 42,707 47,376 494 1.20%NonresidentialSF(x1,000) 20,510 20,838 21,172 21,511 21,855 22,205 24,040 339 1.60%
2015to2020AverageAnnual
0
10,000
20,000
30,000
40,000
50,000
2014 2016 2018 2020 2022 2024 2026
YumaGrowthIndicators
HousingUnits
NonresidenCalSF(x1,000)

DRAFTInfrastructureImprovementsPlanCityofYumaNorthServiceArea
44
RESIDENTIALDEVELOPMENT
Current estimates and future projections of residential development are detailed in this sectionincludingpopulationandhousingunitsbytype.
RecentResidentialConstruction
Developmentfeesrequireananalysisofcurrentlevelsofservice.Forresidentialdevelopment,currentlevelsof servicearedeterminedusingestimatesofpopulationandhousingunits.ToestimatecurrenthousingunitsinYuma,citystaffprovidedbuildingpermitsissuedsincethelastdevelopmentfeestudy.This informationisthenusedtodetermineabaseyearestimateofhousingunits.ShowninFigureA2,the 2011housing unit estimate of 38,902 represents the number of housing units at the timeof theprevious development fee study. To estimate housing units for each fiscal year since the last study,residentialbuildingpermitsissuedeachquarterareallocatedtothecorrespondingfiscalyearandaddedtothe2011housingunitestimate.Forexample,148single-familyunitswereconstructedfromthethirdquarterof2011throughthesecondquarterof2012.Basedonthe2011single-familyunitestimateof20,395,the2012estimateis20,543(20,395+148=20,543).TischlerBiseestimatesYuma’sJuly1,2015housingunittotaltobe40,236.Thisrepresentsanincreaseof1,032single-familyunits,94multi-familyunits,and208mobilehomessincethelaststudy.
FigureA2–ResidentialPermits
HouseholdSize
According to the U.S. Census Bureau, a household is a housing unit that is occupied by year-roundresidents. Development fees often use per capita standards and persons per housing unit (PPHU) orpersonsperhousehold(PPH)toderiveproportionatesharefeeamounts.WhenPPHUisusedinthefeecalculations,infrastructurestandardsarederivedusingyear-roundpopulation.WhenPPHisusedinthefeecalculations, thedevelopment feemethodologyassumesahigherpercentageofhousingunitswillbe occupied, thus requiring seasonal or peak population to be used when deriving infrastructurestandards.TischlerBiserecommendsthatdevelopmentimpactfeesforresidentialdevelopmentinYumabe imposed according to the number of persons per household. This methodology recognizes theimpactsofseasonalpopulationpeaks.
Personsperhousehold (PPH) requiresdataonpopulation inoccupiedunits and the typesofunitsbystructureandbedroomcount.The2010censusdidnotobtaindetailedinformationusinga“long-form”questionnaire. Instead, theU.S. Census Bureau switched to a continuousmonthlymailing of surveys,knownastheAmericanCommunitySurvey(ACS),whichhaslimitationsduetosample-sizeconstraints.Forexample,dataondetachedhousingunitsarenowcombinedwithattachedsingleunits(commonlyknown as townhouses). For development fees in Yuma, detached stick-built units and attached units
July1,2011 July1,2012 July1,2013 July1,2014 July1,2015 4-YrChange %ofPermitsSingleFamilyMulti-family
MobileHomes
20,3957,400
11,10738,902
20,5437,429
11,14439,116
20,8537,493
11,19839,544
21,1347,494
11,25839,886
21,427 1,032 77.4%7,494 94 7.0%
11,315 208 15.6%40,236 1,334
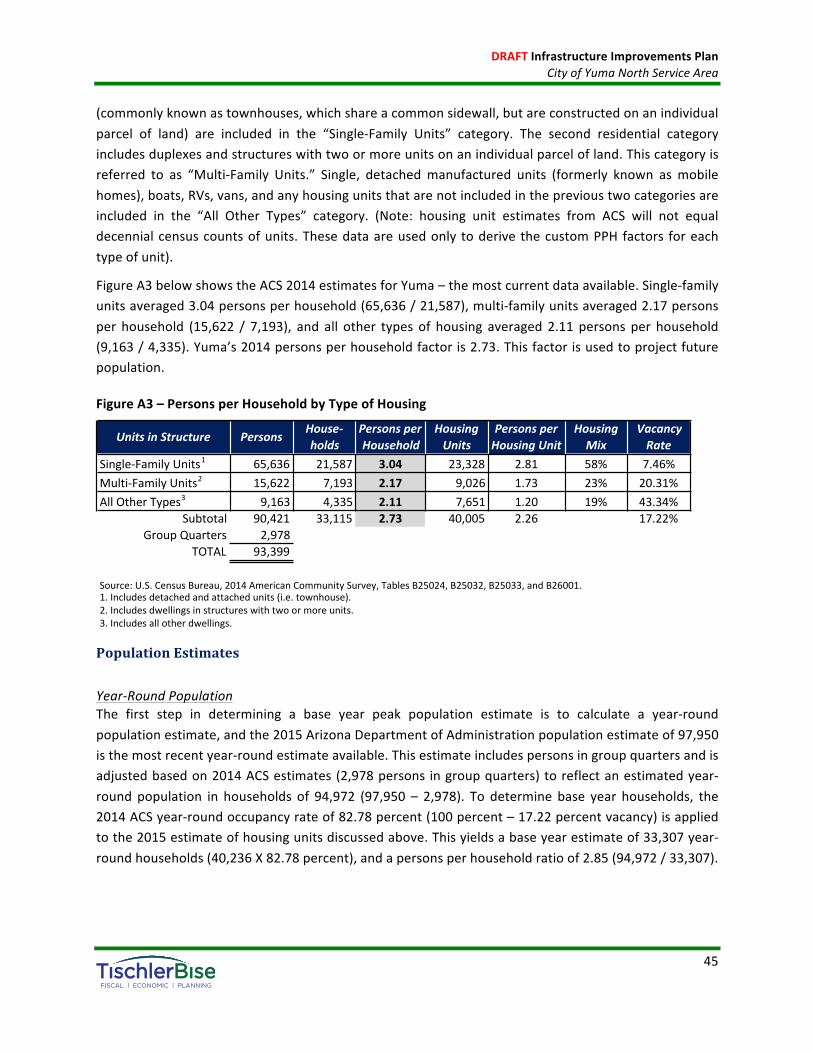
DRAFTInfrastructureImprovementsPlanCityofYumaNorthServiceArea
45
(commonlyknownastownhouses,whichshareacommonsidewall,butareconstructedonanindividualparcel of land) are included in the “Single-Family Units” category. The second residential categoryincludesduplexesandstructureswithtwoormoreunitsonanindividualparcelofland.Thiscategoryisreferred to as “Multi-Family Units.” Single, detachedmanufactured units (formerly known asmobilehomes),boats,RVs,vans,andanyhousingunitsthatarenotincludedintheprevioustwocategoriesareincluded in the “All Other Types” category. (Note: housing unit estimates from ACS will not equaldecennialcensuscountsofunits.Thesedataareusedonly toderive thecustomPPHfactors foreachtypeofunit).
FigureA3belowshowstheACS2014estimatesforYuma–themostcurrentdataavailable.Single-familyunitsaveraged3.04personsperhousehold(65,636/21,587),multi-familyunitsaveraged2.17personsper household (15,622 / 7,193), and all other types of housing averaged 2.11 persons per household(9,163/4,335).Yuma’s2014personsperhouseholdfactoris2.73.Thisfactorisusedtoprojectfuturepopulation.
FigureA3–PersonsperHouseholdbyTypeofHousing
PopulationEstimates
Year-RoundPopulationThe first step in determining a base year peak population estimate is to calculate a year-roundpopulationestimate,andthe2015ArizonaDepartmentofAdministrationpopulationestimateof97,950isthemostrecentyear-roundestimateavailable.Thisestimateincludespersonsingroupquartersandisadjustedbasedon2014ACSestimates(2,978persons ingroupquarters)toreflectanestimatedyear-round population in households of 94,972 (97,950 – 2,978). To determine base year households, the2014ACSyear-roundoccupancyrateof82.78percent(100percent–17.22percentvacancy)isappliedtothe2015estimateofhousingunitsdiscussedabove.Thisyieldsabaseyearestimateof33,307year-roundhouseholds(40,236X82.78percent),andapersonsperhouseholdratioof2.85(94,972/33,307).
House- Personsper Housing Personsper Housing Vacancyholds Household Units HousingUnit Mix Rate
Single-FamilyUnits1 65,636 21,587 3.04 23,328 2.81 58% 7.46%Multi-FamilyUnits2 15,622 7,193 2.17 9,026 1.73 23% 20.31%AllOtherTypes3 9,163 4,335 2.11 7,651 1.20 19% 43.34%
Subtotal 90,421 33,115 2.73 40,005 2.26 17.22%GroupQuarters 2,978
TOTAL 93,399
Source:U.S.CensusBureau,2014AmericanCommunitySurvey,TablesB25024,B25032,B25033,andB26001.1.Includesdetachedandattachedunits(i.e.townhouse).2.Includesdwellingsinstructureswithtwoormoreunits.3.Includesallotherdwellings.
UnitsinStructure Persons

DRAFTInfrastructureImprovementsPlanCityofYumaNorthServiceArea
46
FigureA4–Year-RoundPopulationandHouseholds
PeakPopulation
Tocalculatepeakpopulation,theyear-roundhouseholdsestimateof33,307isusedasthebase.Next,seasonal housing units are added to year-round households to determine peak households. Seasonalhousing units, according to 2014 ACS estimates, account for 7.62 percent (90.40 percent peakoccupancy–82.78percentyear-roundoccupancy)oftotalhousingunits;therefore,3,066housingunitsareoccupied for seasonal use (40,236X 7.62percent).When combined, Yumahas a peakhouseholdestimateof36,373(33,307+3,066).Toestimatepeakpopulation inhouseholds,theestimateofpeakhouseholds is converted to population by applying the PPH ratio of 2.85 (36,373 X 2.85 = 103,663).Whencombinedwithpersonsingroupquarters,the2015peakpopulationis106,641(103,663+2,978).
FigureA5–PeakPopulationandHouseholds
PopulationProjections
Tomoreaccuratelydetermine futurepopulation,TischlerBiseanalyzedrecentpopulationandhousinggrowth trends, reviewed Arizona Department of Administration population projections, and haddiscussions with staff. In 2013, the Arizona Department of Administration released sub-countypopulation projections for 2013-2050 based on itsmedium growth scenario for each county. Yuma’s2012 population was estimated to be 94,824 with a projected population of 114,085 in 2025. Asdiscussedabove,the2015year-roundpopulationestimateisalsoprovidedbytheArizonaDepartment
Year-RoundPopulation1 97,950GroupQuartersPopulation2 2,978Year-RoundPopulationinHouseholds 94,972
Year-RoundOccupancyRate2 82.78%
HousingUnits3 40,236Year-RoundHouseholds4 33,3071.ArizonaDepartmentofAdministration,July1,2015estimate.2.2014AmericanCommunitySurvey.3.CityofYuma,CommunityDevelopmentDepartment.4.TischlerBisecalculation.
PeakOccupancyRate1 90.40%
Year-RoundHouseholds2 33,307HousingUnitsforseasonal,recreation,oroccasionaluse2 3,066PeakHouseholds 36,373
PersonsperHousehold2 2.85
PeakPopulationinHouseholds 103,663GroupQuartersPopulation1 2,978PeakPopulation 106,6411.2014AmericanCommunitySurvey.2.TischlerBisecalculation.
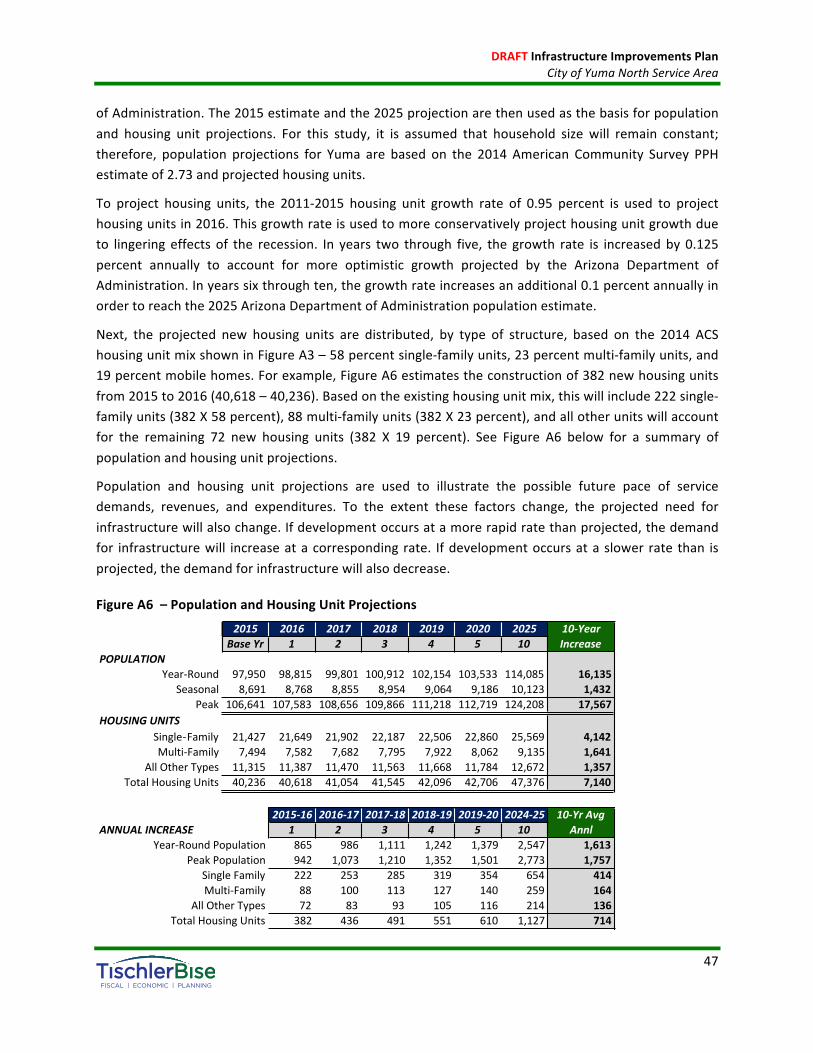
DRAFTInfrastructureImprovementsPlanCityofYumaNorthServiceArea
47
ofAdministration.The2015estimateandthe2025projectionarethenusedasthebasisforpopulationand housing unit projections. For this study, it is assumed that household size will remain constant;therefore, population projections for Yuma are based on the 2014 American Community Survey PPHestimateof2.73andprojectedhousingunits.
To project housing units, the 2011-2015 housing unit growth rate of 0.95 percent is used to projecthousingunitsin2016.Thisgrowthrateisusedtomoreconservativelyprojecthousingunitgrowthdueto lingering effects of the recession. In years two through five, the growth rate is increasedby0.125percent annually to account for more optimistic growth projected by the Arizona Department ofAdministration.Inyearssixthroughten,thegrowthrateincreasesanadditional0.1percentannuallyinordertoreachthe2025ArizonaDepartmentofAdministrationpopulationestimate.
Next, the projected new housing units are distributed, by type of structure, based on the 2014 ACShousingunitmixshowninFigureA3–58percentsingle-familyunits,23percentmulti-familyunits,and19percentmobilehomes.Forexample,FigureA6estimatestheconstructionof382newhousingunitsfrom2015to2016(40,618–40,236).Basedontheexistinghousingunitmix,thiswillinclude222single-familyunits(382X58percent),88multi-familyunits(382X23percent),andallotherunitswillaccountfor the remaining 72 new housing units (382 X 19 percent). See Figure A6 below for a summary ofpopulationandhousingunitprojections.
Population and housing unit projections are used to illustrate the possible future pace of servicedemands, revenues, and expenditures. To the extent these factors change, the projected need forinfrastructurewillalsochange.Ifdevelopmentoccursatamorerapidratethanprojected,thedemandfor infrastructurewill increaseatacorrespondingrate. Ifdevelopmentoccursataslowerrate than isprojected,thedemandforinfrastructurewillalsodecrease.
FigureA6–PopulationandHousingUnitProjections
2015 2016 2017 2018 2019 2020BaseYr 1 2 3 4 5
POPULATIONYear-Round 97,950 98,815 99,801 100,912 102,154 103,533
Seasonal 8,691 8,768 8,855 8,954 9,064 9,186Peak 106,641 107,583 108,656 109,866 111,218 112,719
HOUSINGUNITSSingle-Family 21,427 21,649 21,902 22,187 22,506 22,860Multi-Family 7,494 7,582 7,682 7,795 7,922 8,062
AllOtherTypes 11,315 11,387 11,470 11,563 11,668 11,784TotalHousingUnits 40,236 40,618 41,054 41,545 42,096 42,706
202510
114,085 16,13510,123 1,432
124,208 17,567
25,569 4,1429,135 1,641
12,672 1,35747,376 7,140
10-YearIncrease
2015-16 2016-17 2017-18 2018-19 2019-20ANNUALINCREASE 1 2 3 4 5
Year-RoundPopulation 865 986 1,111 1,242 1,379PeakPopulation 942 1,073 1,210 1,352 1,501
SingleFamily 222 253 285 319 354Multi-Family 88 100 113 127 140
AllOtherTypes 72 83 93 105 116TotalHousingUnits 382 436 491 551 610
2024-25102,547 1,6132,773 1,757654 414259 164214 136
1,127 714
10-YrAvgAnnl

DRAFTInfrastructureImprovementsPlanCityofYumaNorthServiceArea
48
NONRESIDENTIALDEVELOPMENT
Current estimates and future projections of nonresidential development are detailed in this sectionincludingjobsandnonresidentialfloorarea.
EmploymentEstimates
In addition todataon residential development, the calculationofdevelopment fees requiresdataonemployment (number of jobs) and nonresidential square footage in the City of Yuma. TischlerBiseanalyzedrecentemploymenttrends,revieweddataprovidedbycitystaff,andhaddiscussionswithcitystaff.
TischlerBiseusesafour-stepprocesstocalculateabaseyearjobestimateandprojectionsforeachyearpast the base. First, job estimates fromEsri’s1 2015 business summary are used as the base year forYuma (Figure A7). Second, job estimates are grouped by type: commercial/retail, office/institutional,andindustrial/flex.Third,theArizonaDepartmentofAdministration’snonfarmaverageannualgrowthrateof1.6percent(2014-2016,excludesMaricopa,Pinal,andPimaCounties)isappliedtothe2015jobestimates discussed in step one to project the number of citywide jobs. Finally, projected jobs aredistributedbytypeofemploymentbasedonthe2015shareoftotaljobs.
FigureA7–EstimatedEmploymentandDistributionbyIndustryType
NonresidentialSquareFootageEstimates
Job estimates are used to estimate nonresidential square footage based on nationally recognizedaveragesquarefeetperemployeedatapublishedbyTheInstituteofTransportationEngineers(ITE)andshown in Figure A8 below. Rows shaded in gray are used as prototypes for development in Yuma.TischlerBise uses 2012 data from the ITE to calculate the total nonresidential floor area for thedevelopmentcategoriesusedinthecalculationofdevelopmentfees.
Toestimatecurrentnonresidentialfloorarea,ITEsquarefeetperemployeefactorsareappliedto2015jobestimatesshowninFigureA7.Forfuturecommercial/retaildevelopment,anaveragesizeshopping
1Esri’s2015businesssummary isextracted fromDun&Bradstreetdata that includesover24millionUSbusinesses.Data isprovidedby industryclassification–StandardIndustrialClassification(SIC)andNorthAmericanIndustryClassificationSystem(NAICS)–andincludesestimatesofbusinessesandemployment.
Shareof SFper 2015Estimated JobsperTotalJobs Employee2 FloorArea 1,000SF2
Commercial/Retail3 23,807 48.9% 500 11,904,000 2.00Office/Institutional4 16,307 33.5% 301 4,908,000 3.32Industrial/Flex5 8,540 17.6% 433 3,698,000 2.31
TOTAL 48,654 20,510,000
1.YumaBusinessSummary2015,EsriTotalResidentialForecastsfor2015.2.TripGeneration,InstituteofTransportationEngineers,2012.3.MajorsectorsincludeEating&DrinkingPlaces,GeneralMerchandiseStores.4.MajorsectorsincludeHealthServices,EducationInstitutions&Libraries.5.MajorsectorsincludeWholesaleTrade,Manufacturing,andConstruction.
Type 2015Jobs1

DRAFTInfrastructureImprovementsPlanCityofYumaNorthServiceArea
49
center(ITEcode820)isareasonableproxywithanaverage500squarefeetperjob.Theprototypeforfuture office/institutional development is a general office (ITE code 710). This type of developmentaverages approximately 301 square feet per job. For industrial/flex development, light industrial (ITE110)istheprototypeforfuturedevelopment,withanaverageof433squarefeetperjob.TischlerBiseestimatestheCityofYumahasapproximately20.5millionsquarefeetofnonresidentialspaceinactiveuse.
FigureA8–TheInstituteofTransportationEngineers,EmployeeandBuildingAreaRatios
EmploymentandNonresidentialFloorAreaProjections
Future employment growth and nonresidential development in Yuma are projected based oninformation provided by city staff and analysis of past trends in Yuma. To project employment,TischlerBise applies an average annual growth rate estimated by the Arizona Department ofAdministrationtoeachyearbeyondthe2015estimateof48,654jobs.
Theprojectedincreaseinemploymentisthenusedtoprojectgrowthinnonresidentialsquarefootageusingthesquarefeetperemployeefactorspreviouslydiscussed.ResultsareshowninFigureA9.Overthenexttenyears,Yumaisprojectedtogain8,369jobs.Tokeeppacewithemploymentgrowth,Yumashouldexpecttoaddroughly3.53millionsquarefeetofnonresidentialdevelopmentduringthesameperiod. The projected increase in nonresidential floor area is approximately 353,000 square feet peryearand is similar to theaverageannual increaseof363,000 square feetofnonresidential floorareaconstructedbetweenJanuary1,2012andJune30,2015–accordingtobuildingpermitsissuedinYuma.
ITE Demand EmpPer SqFtCode Unit Per1,000SqFt1 PerEmployee1 1,000SqFt PerEmp2
Average 1,000SqFt 42.70 na 2.00 500820 10Kgrossleasablearea 1,000SqFt 152.03 na 3.33 300820 25Kgrossleasablearea 1,000SqFt 110.32 na 3.03 330820 50Kgrossleasablearea 1,000SqFt 86.56 na 2.86 350
LandUse WkdyTripEnds
Commercial
Average 1,000SqFt 11.03 3.32 3.32 301710 10Kgrossfloorarea 1,000SqFt 22.66 5.06 4.48 223710 25Kgrossfloorarea 1,000SqFt 18.35 4.43 4.14 241710 50Kgrossfloorarea 1,000SqFt 15.65 4.00 3.91 256
GeneralOfficeandOtherServices
110 LightIndustrial 1,000SqFt 6.97 3.02 2.31 433140 Manufacturing 1,000SqFt 3.82 2.13 1.79 558
Industrial
150 Warehousing 1,000SqFt 3.56 3.89 0.92 1,093OtherNonresidential
610 Hospital 1,000SqFt 13.22 4.50 2.94 340760 Research&DevCenter 1,000SqFt 8.11 2.77 2.93 342857 DiscountClub 1,000SqFt 41.80 32.21 1.30 771310 Hotel room 8.17 14.34 0.57 na1.TripGeneration,InstituteofTransportationEngineers,2012.
2.SquarefeetperemployeecalculatedfromtripratesexceptforShoppingCenterdata,whicharederivedfromtheUrbanLandInstitute'sDevelopmentHandbookandDollarsandCentsofShoppingCenters.

DRAFTInfrastructureImprovementsPlanCityofYumaNorthServiceArea
50
FigureA9–EmploymentandNonresidentialFloorAreaProjections
2015 2016 2017 2018 2019 2020BaseYr 1 2 3 4 5
202510
10-YearIncrease
EMPLOYMENTBYTYPECommercial/Retail 23,807 24,187 24,574 24,967 25,366 25,772Office/Institutional 16,307 16,568 16,833 17,102 17,375 17,653
Industrial/Flex 8,540 8,677 8,816 8,958 9,102 9,248TotalEmployment 48,654 49,432 50,223 51,027 51,843 52,673
NONRES.FLOORAREA(X1,000SF)Commercial/Retail 11,904 12,094 12,288 12,485 12,685 12,888Office/Institutional 4,908 4,987 5,067 5,148 5,230 5,314
Industrial/Flex 3,698 3,757 3,817 3,878 3,940 4,003TotalNonres.FloorArea 20,510 20,838 21,172 21,511 21,855 22,205
2015-16 2016-17 2017-18 2018-19 2019-20ANNUALINCREASE 1 2 3 4 5
27,899 4,09219,110 2,80310,014 1,47457,023 8,369
13,953 2,0495,753 8454,334 636
24,040 3,530
2024-2510
10-YrAvgAnnl
Employment 778 791 804 816 830Commercial/RetailKSF 190 194 197 200 203Office/InstitutionalKSF 79 80 81 82 84
Industrial/FlexKSF 59 60 61 62 63TotalNonres.FloorAreaKSF 328 334 339 344 350
898 837220 20591 8568 64379 353

DRAFTInfrastructureImprovementsPlanCityofYumaNorthServiceArea
51
AVERAGEDAILYVEHICLETRIPS
AverageDailyVehicleTripsareusedasameasureofdemandby landuse.Vehicletripsareestimatedusingaverageweekdayvehicletripendsfromthereferencebook,TripGeneration,9thEdition,publishedbytheInstituteofTransportationEngineers(ITE)in2012.Avehicletripendrepresentsavehicleeitherenteringorexitingadevelopment(asifatrafficcounterwereplacedacrossadriveway).
TripRateAdjustments
Yuma’sstreetsdevelopment feesuseaverageweekday tripgenerationrates fromthereferencebookTrip Generation published by the Institute of Transportation Engineers (ITE 2012). A vehicle trip endrepresentsavehicleeitherenteringorexitingadevelopment(asifatrafficcounterwereplacedacrossadriveway).Tocalculatestreetsdevelopmentfees,tripgenerationratesrequireanadjustmentfactortoavoid double counting each trip at both the origin and destination points. Therefore, the basic tripadjustmentfactoris50percent.Asdiscussedfurtherbelow,thedevelopmentfeemethodologyincludesadditionaladjustmentstomakethefeesproportionatetotheinfrastructuredemandforparticulartypesofdevelopment.
AdjustmentforJourney-To-WorkCommutingResidentialdevelopmenthasa larger tripadjustment factorof56%toaccount forcommuters leavingYuma for work. According to the 2009 National Household Travel Survey, weekday work trips aretypically31percentofproductiontrips(i.e.,allout-boundtrips,whichare50percentofalltripends).Asshown in FigureA10, theCensusBureau’swebapplicationOnTheMap2 indicates that39.5percentofresidentworkerstraveledoutsideYumaforwork in2013. Incombination, thesefactors (0.31x0.50x0.395=0.06)supporttheadditionalsixpercentallocationoftripstoresidentialdevelopment.
2OnTheMapisaweb-basedmappingandreportingapplicationthatshowswhereworkersareemployedandwheretheyliveanditdescribesgeographicpatternsofjobsbytheiremploymentlocationsandresidentiallocationsaswellastheconnectionsbetweenthetwolocations.OnTheMapwasdevelopedthroughauniquepartnershipbetweentheU.S.CensusBureauanditsLocalEmploymentDynamics(LED)partnerstates.
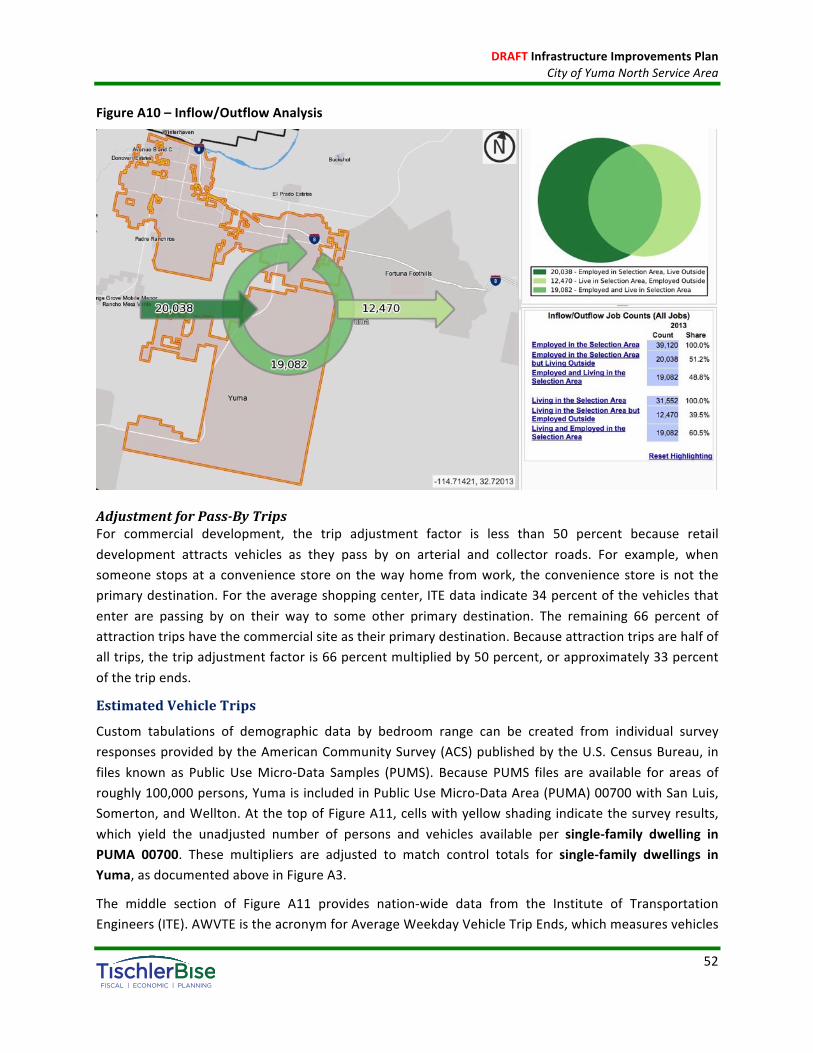
DRAFTInfrastructureImprovementsPlanCityofYumaNorthServiceArea
52
FigureA10–Inflow/OutflowAnalysis
AdjustmentforPass-ByTripsFor commercial development, the trip adjustment factor is less than 50 percent because retaildevelopment attracts vehicles as they pass by on arterial and collector roads. For example, whensomeonestopsataconveniencestoreonthewayhomefromwork, theconveniencestore isnot theprimarydestination.Fortheaverageshoppingcenter,ITEdataindicate34percentofthevehiclesthatenter are passing by on their way to some other primary destination. The remaining 66 percent ofattractiontripshavethecommercialsiteastheirprimarydestination.Becauseattractiontripsarehalfofalltrips,thetripadjustmentfactoris66percentmultipliedby50percent,orapproximately33percentofthetripends.
EstimatedVehicleTrips
Custom tabulations of demographic data by bedroom range can be created from individual surveyresponsesprovidedbytheAmericanCommunitySurvey(ACS)publishedbytheU.S.CensusBureau, infiles known as PublicUseMicro-Data Samples (PUMS). Because PUMS files are available for areas ofroughly100,000persons,YumaisincludedinPublicUseMicro-DataArea(PUMA)00700withSanLuis,Somerton,andWellton.AtthetopofFigureA11,cellswithyellowshadingindicatethesurveyresults,which yield the unadjusted number of persons and vehicles available per single-family dwelling inPUMA 00700. These multipliers are adjusted to match control totals for single-family dwellings inYuma,asdocumentedaboveinFigureA3.
The middle section of Figure A11 provides nation-wide data from the Institute of TransportationEngineers(ITE).AWVTEistheacronymforAverageWeekdayVehicleTripEnds,whichmeasuresvehicles
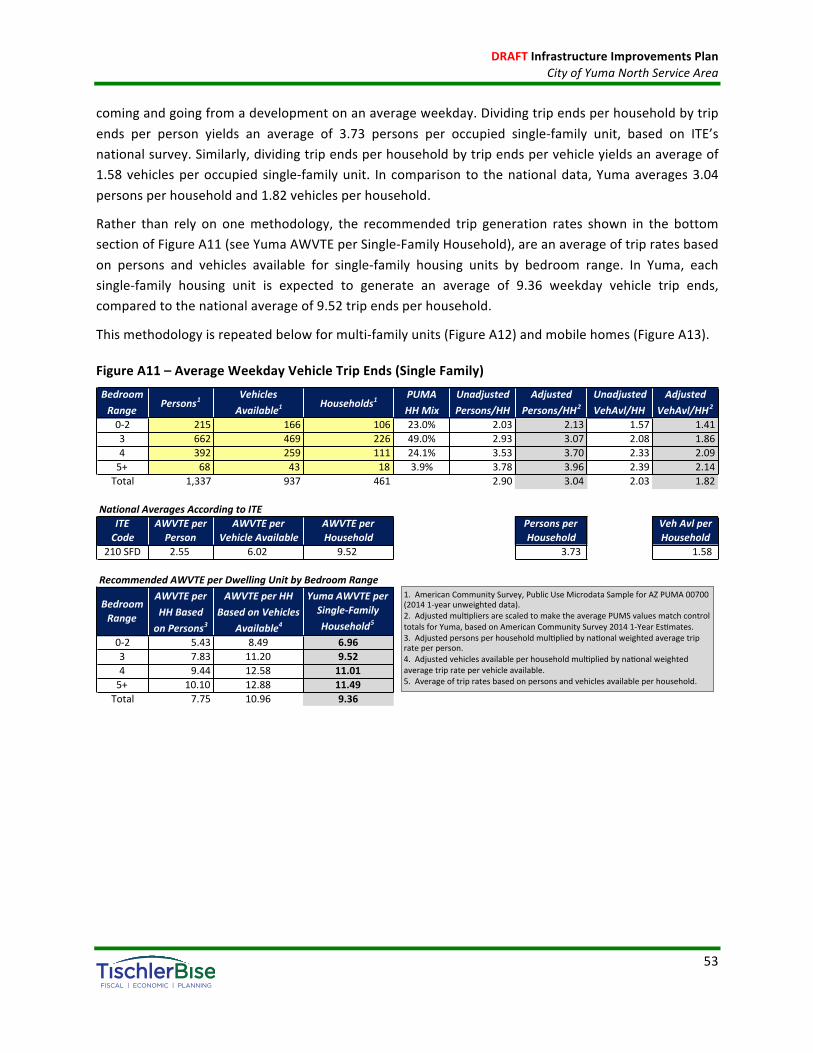
DRAFTInfrastructureImprovementsPlanCityofYumaNorthServiceArea
53
comingandgoingfromadevelopmentonanaverageweekday.Dividingtripendsperhouseholdbytripends per person yields an average of 3.73 persons per occupied single-family unit, based on ITE’snationalsurvey.Similarly,dividingtripendsperhouseholdbytripendspervehicleyieldsanaverageof1.58vehiclesperoccupiedsingle-familyunit. Incomparison to thenationaldata,Yumaaverages3.04personsperhouseholdand1.82vehiclesperhousehold.
Rather than rely on onemethodology, the recommended trip generation rates shown in the bottomsectionofFigureA11(seeYumaAWVTEperSingle-FamilyHousehold),areanaverageoftripratesbasedon persons and vehicles available for single-family housing units by bedroom range. In Yuma, eachsingle-family housing unit is expected to generate an average of 9.36 weekday vehicle trip ends,comparedtothenationalaverageof9.52tripendsperhousehold.
Thismethodologyisrepeatedbelowformulti-familyunits(FigureA12)andmobilehomes(FigureA13).
FigureA11–AverageWeekdayVehicleTripEnds(SingleFamily)
Bedroom Vehicles PUMA Unadjusted Adjusted Unadjusted Adjusted
Range Available1 HHMix Persons/HH Persons/HH2 VehAvl/HH VehAvl/HH2
0-2 215 166 106 23.0% 2.03 2.13 1.57 1.413 662 469 226 49.0% 2.93 3.07 2.08 1.864 392 259 111 24.1% 3.53 3.70 2.33 2.095+ 68 43 18 3.9% 3.78 3.96 2.39 2.14Total 1,337 937 461 2.90 3.04 2.03 1.82
NationalAveragesAccordingtoITEITE AWVTEper AWVTEper AWVTEper Personsper VehAvlperCode Person VehicleAvailable Household Household Household
210SFD 2.55 6.02 9.52 3.73 1.58
RecommendedAWVTEperDwellingUnitbyBedroomRange
AWVTEper AWVTEperHH
HHBased BasedonVehicles
onPersons3 Available4
0-2 5.43 8.49 6.963 7.83 11.20 9.524 9.44 12.58 11.015+ 10.10 12.88 11.49Total 7.75 10.96 9.36
Households1Persons1
BedroomRange
YumaAWVTEperSingle-Family
Household5
1.AmericanCommunitySurvey,PublicUseMicrodataSampleforAZPUMA00700(20141-yearunweighteddata).2.AdjustedmulSpliersarescaledtomaketheaveragePUMSvaluesmatchcontroltotalsforYuma,basedonAmericanCommunitySurvey20141-YearEsSmates.3.AdjustedpersonsperhouseholdmulSpliedbynaSonalweightedaveragetriprateperperson.4.AdjustedvehiclesavailableperhouseholdmulSpliedbynaSonalweightedaveragetripratepervehicleavailable.5.Averageoftripratesbasedonpersonsandvehiclesavailableperhousehold.

DRAFTInfrastructureImprovementsPlanCityofYumaNorthServiceArea
54
FigureA12–AverageWeekdayVehicleTripEnds(Multi-Family)
FigureA13–AverageWeekdayVehicleTripEnds(MobileHome/Other)
FigureA14detailsthecalculationsusedtodeterminethatexistingdevelopmentinYumageneratesanaverageof386,570inboundvehicletripsonatypicalweekday.Residentialdevelopmentisestimatedtogenerate 178,881 inbound trips (46.3 percent) compared to 207,689 inbound trips (53.7 percent)generatedbynonresidentialdevelopment.Anexampleofthecalculationisasfollowsforsingle-familyunits: 21,427 single-family units x 9.36 average weekday vehicle trips ends per unit x 56 percentadjustment factor=112,314 total inboundvehicle tripsperday fromsingle-familyunits inYuma.Thesamecalculationisperformedforeachlandusetype.
Bedroom Vehicles PUMA Unadjusted Adjusted Unadjusted Adjusted
Range Available1 HHMix Persons/HH Persons/HH2 VehAvl/HH VehAvl/HH2
0-1 32 21 23 28.8% 1.39 1.26 0.91 1.122 103 44 41 51.3% 2.51 2.27 1.07 1.323+ 57 24 16 20.0% 3.56 3.22 1.50 1.85Total 192 89 80 2.40 2.17 1.11 1.37
NationalAveragesAccordingtoITEITE AWVTEper AWVTEper AWVTEper Personsper VehAvlperCode Person VehicleAvailable Household Household Household
220Apt 3.31 5.10 6.65 2.01 1.30
RecommendedAWVTEperDwellingUnitbyBedroomRangeAWVTEper AWVTEperHHHHBased BasedonVehicles
onPersons3 Available4
0-1 4.17 5.71 4.942 7.51 6.73 7.123+ 10.66 9.44 10.05Total 7.18 6.99 7.09
Persons1 Households1
BedroomRange
YumaAWVTEperMulti-Family
Household5
1.AmericanCommunitySurvey,PublicUseMicrodataSampleforAZPUMA00700(20141-yearunweighteddata).2.AdjustedmulQpliersarescaledtomaketheaveragePUMSvaluesmatchcontroltotalsforYuma,basedonAmericanCommunitySurvey20141-YearEsQmates.3.AdjustedpersonsperhouseholdmulQpliedbynaQonalweightedaveragetriprateperperson.4.AdjustedvehiclesavailableperhouseholdmulQpliedbynaQonalweightedaveragetripratepervehicleavailable.5.Averageoftripratesbasedonpersonsandvehiclesavailableperhousehold.
Bedroom Vehicles PUMA Unadjusted Adjusted Unadjusted AdjustedRange Available1 HHMix Persons/HH Persons/HH2 VehAvl/HH VehAvl/HH2
0-1 155 96 89 43.0% 1.74 1.77 1.08 1.432 150 120 79 38.2% 1.90 1.93 1.52 2.023+ 125 81 39 18.8% 3.21 3.26 2.08 2.76Total 430 297 207 2.08 2.11 1.43 1.90
NationalAveragesAccordingtoITEITE AWVTEper AWVTEper AWVTEper Personsper VehAvlperCode Person VehicleAvailable Household Household Household
240MH 2.46 3.38 4.99 2.03 1.48
RecommendedAWVTEperDwellingUnitbyBedroomRangeAWVTEper AWVTEperHHHHBased BasedonVehiclesonPersons3 Available4
0-1 4.35 4.83 4.592 4.75 6.83 5.793+ 8.02 9.33 8.68Total 5.19 6.42 5.81
Persons1 Households1
BedroomRange
YumaAWVTEperMobileHomeHousehold5
1.AmericanCommunitySurvey,PublicUseMicrodataSampleforAZPUMA00700(20141-yearunweighteddata).2.AdjustedmulRpliersarescaledtomaketheaveragePUMSvaluesmatchcontroltotalsforYuma,basedonAmericanCommunitySurvey20141-YearEsRmates.3.AdjustedpersonsperhouseholdmulRpliedbynaRonalweightedaveragetriprateperperson.4.AdjustedvehiclesavailableperhouseholdmulRpliedbynaRonalweightedaveragetripratepervehicleavailable.5.Averageoftripratesbasedonpersonsandvehiclesavailableperhousehold.
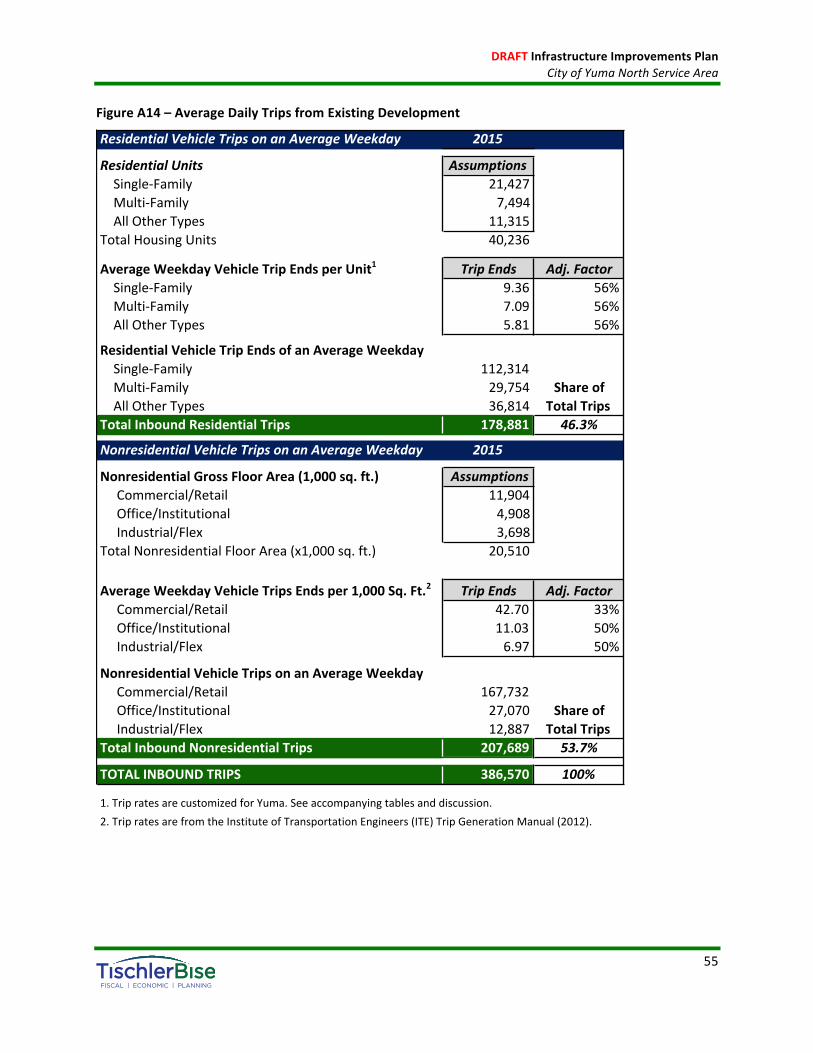
DRAFTInfrastructureImprovementsPlanCityofYumaNorthServiceArea
55
FigureA14–AverageDailyTripsfromExistingDevelopment
ResidentialVehicleTripsonanAverageWeekday 2015
ResidentialUnits AssumptionsSingle-Family 21,427Multi-Family 7,494AllOtherTypes 11,315TotalHousingUnits 40,236
AverageWeekdayVehicleTripEndsperUnit1 TripEnds Adj.Factor
Single-Family 9.36 56%Multi-Family 7.09 56%AllOtherTypes 5.81 56%
ResidentialVehicleTripEndsofanAverageWeekday
Single-Family 112,314Multi-Family 29,754AllOtherTypes 36,814TotalInboundResidentialTrips 178,881 46.3%
NonresidentialVehicleTripsonanAverageWeekday 2015
NonresidentialGrossFloorArea(1,000sq.ft.) AssumptionsCommercial/Retail 11,904Office/Institutional 4,908Industrial/Flex 3,698TotalNonresidentialFloorArea(x1,000sq.ft.) 20,510
AverageWeekdayVehicleTripsEndsper1,000Sq.Ft.2 TripEnds Adj.Factor
Commercial/Retail 42.70 33%Office/Institutional 11.03 50%Industrial/Flex 6.97 50%
NonresidentialVehicleTripsonanAverageWeekday
Commercial/Retail 167,732Office/Institutional 27,070Industrial/Flex 12,887TotalInboundNonresidentialTrips 207,689 53.7%
TOTALINBOUNDTRIPS 386,570 100%
1.TripratesarecustomizedforYuma.Seeaccompanyingtablesanddiscussion.
2.TripratesarefromtheInstituteofTransportationEngineers(ITE)TripGenerationManual(2012).
Shareof
TotalTrips
Shareof
TotalTrips

DRAFTInfrastructureImprovementsPlanCityofYumaNorthServiceArea
56
FunctionalPopulation
For certain infrastructure facilities TischlerBise often uses “functional population” to establish therelativedemandfor infrastructurefrombothresidentialandnonresidentialdevelopment.AsshowninFigureA15,functionalpopulationaccountsforpeoplelivingandworkinginajurisdiction.Residentswhodon't work are assigned 20 hours per day to residential development and four hours per day tononresidentialdevelopment(annualizedaverages).ResidentswhoworkinYumaareassigned14hoursto residentialdevelopmentand10hours tononresidentialdevelopment.ResidentswhoworkoutsideYuma are assigned 14 hours to residential development. Inflow commuters are assigned 10 hours tononresidential development. Based on 2013 functional population data, the resulting proportionateshareis73percentfromresidentialdevelopmentand27percentfromnonresidentialdevelopment.
FigureA15–FunctionalPopulation
Demand Person ProportionateHours/Day Hours Share
ResidentialEstimatedResidents 95,423
ResidentsNotWorking 63,871 20 1,277,417EmployedResidents 31,552
EmployedinServiceArea 19,082 14 267,148EmployedoutsideServiceArea 12,470 14 174,580
ResidentialSubtotal 1,719,145 73%
NonresidentialNon-workingResidents 63,871 4 255,483JobsinServiceArea 39,120
ResidentsEmployedinServiceArea 19,082 10 190,820Non-ResidentWorkers(inflowCommuters) 20,038 10 200,380
NonresidentialSubtotal 646,683 27%
TOTAL 2,365,828 100%
Source:ArizonaDepartmentofAdministration2013PopulationEstimate;U.S.CensusBureau,OnTheMap6.1.1Application,2013.
DemandUnitsin2013
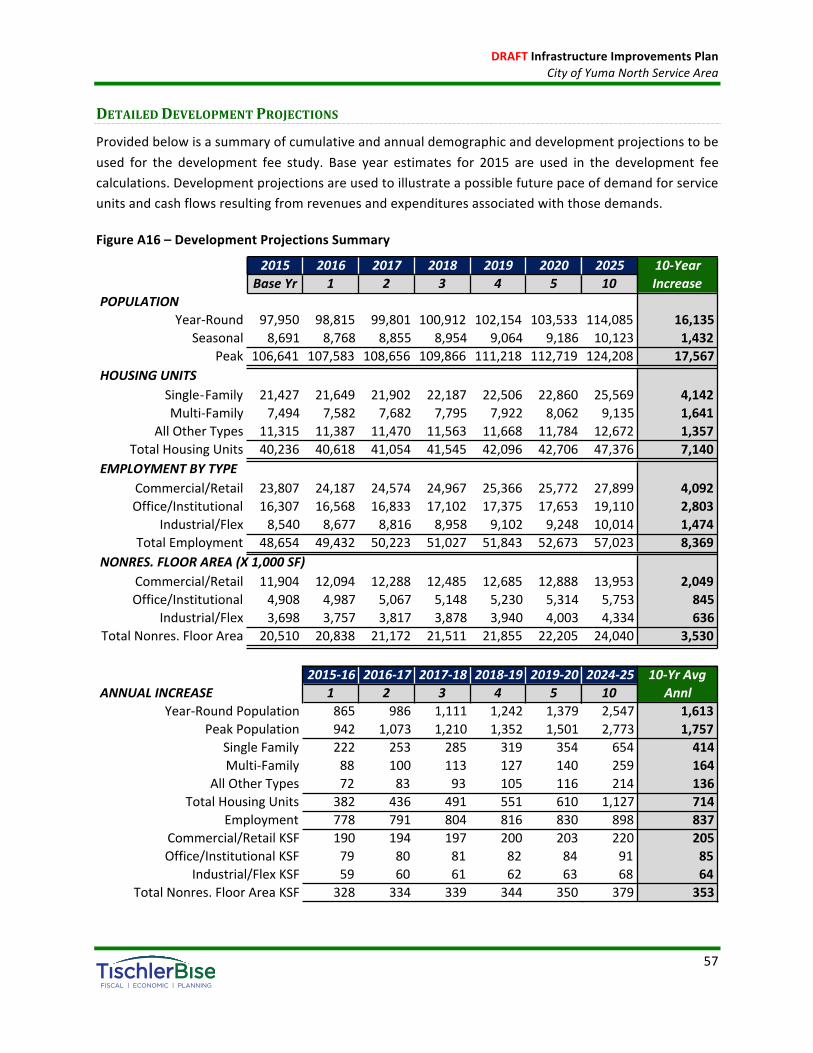
DRAFTInfrastructureImprovementsPlanCityofYumaNorthServiceArea
57
DETAILEDDEVELOPMENTPROJECTIONS
Providedbelowisasummaryofcumulativeandannualdemographicanddevelopmentprojectionstobeused for the development fee study. Base year estimates for 2015 are used in the development feecalculations.Developmentprojectionsareusedtoillustrateapossiblefuturepaceofdemandforserviceunitsandcashflowsresultingfromrevenuesandexpendituresassociatedwiththosedemands.
FigureA16–DevelopmentProjectionsSummary
2015 2016 2017 2018 2019 2020BaseYr 1 2 3 4 5
POPULATIONYear-Round 97,950 98,815 99,801 100,912 102,154 103,533
Seasonal 8,691 8,768 8,855 8,954 9,064 9,186Peak 106,641 107,583 108,656 109,866 111,218 112,719
HOUSINGUNITSSingle-Family 21,427 21,649 21,902 22,187 22,506 22,860Multi-Family 7,494 7,582 7,682 7,795 7,922 8,062
AllOtherTypes 11,315 11,387 11,470 11,563 11,668 11,784TotalHousingUnits 40,236 40,618 41,054 41,545 42,096 42,706
EMPLOYMENTBYTYPECommercial/Retail 23,807 24,187 24,574 24,967 25,366 25,772Office/Institutional 16,307 16,568 16,833 17,102 17,375 17,653
Industrial/Flex 8,540 8,677 8,816 8,958 9,102 9,248TotalEmployment 48,654 49,432 50,223 51,027 51,843 52,673
NONRES.FLOORAREA(X1,000SF)Commercial/Retail 11,904 12,094 12,288 12,485 12,685 12,888Office/Institutional 4,908 4,987 5,067 5,148 5,230 5,314
Industrial/Flex 3,698 3,757 3,817 3,878 3,940 4,003TotalNonres.FloorArea 20,510 20,838 21,172 21,511 21,855 22,205
2015-16 2016-17 2017-18 2018-19 2019-20ANNUALINCREASE 1 2 3 4 5
Year-RoundPopulation 865 986 1,111 1,242 1,379PeakPopulation 942 1,073 1,210 1,352 1,501
SingleFamily 222 253 285 319 354Multi-Family 88 100 113 127 140
AllOtherTypes 72 83 93 105 116TotalHousingUnits 382 436 491 551 610
Employment 778 791 804 816 830Commercial/RetailKSF 190 194 197 200 203Office/InstitutionalKSF 79 80 81 82 84
Industrial/FlexKSF 59 60 61 62 63TotalNonres.FloorAreaKSF 328 334 339 344 350
202510
114,085 16,13510,123 1,432
124,208 17,567
25,569 4,1429,135 1,641
12,672 1,35747,376 7,140
27,899 4,09219,110 2,80310,014 1,47457,023 8,369
13,953 2,0495,753 8454,334 636
24,040 3,530
2024-25102,547 1,6132,773 1,757654 414259 164214 136
1,127 714898 837220 20591 8568 64379 353
10-YearIncrease
10-YrAvgAnnl
DRAFTInfrastructureImprovementsPlanCityofYumaNorthServiceArea
58
APPENDIXB:ARIZONAREVISEDSTATUTESArizona Revised Statutes (ARS) 9-463.05. Development fees; imposition by cities and towns;infrastructureimprovementsplan;annualreport;advisorycommittee;limitationonactions;definitions
(EffectiveJanuary1,2012)
A. A municipality may assess development fees to offset costs to the municipality associated withproviding necessary public services to a development, including the costs of infrastructure,improvements,realproperty,engineeringandarchitecturalservices,financingandprofessionalservicesrequired for the preparation or revision of a development fee pursuant to this section, including therelevantportionoftheinfrastructureimprovementsplan.
B. Development fees assessed by a municipality under this section are subject to the followingrequirements:
1.Developmentfeesshallresultinabeneficialusetothedevelopment.
2. The municipality shall calculate the development fee based on the infrastructureimprovementsplanadoptedpursuanttothissection.
3.Thedevelopmentfeeshallnotexceedaproportionateshareofthecostofnecessarypublicservices, based on service units, needed to provide necessary public services to thedevelopment.
4.Costs fornecessarypublic servicesmadenecessarybynewdevelopment shallbebasedonthesamelevelofserviceprovidedtoexistingdevelopmentintheservicearea.
5.Developmentfeesmaynotbeusedforanyofthefollowing:
(a) Construction, acquisition or expansion of public facilities or assets other thannecessary public services or facility expansions identified in the infrastructureimprovementsplan.
(b) Repair, operation or maintenance of existing or new necessary public services orfacilityexpansions.
(c) Upgrading, updating, expanding, correcting or replacing existing necessary publicservices to serve existing development in order to meet stricter safety, efficiency,environmentalorregulatorystandards.
(d) Upgrading, updating, expanding, correcting or replacing existing necessary publicservicestoprovideahigherlevelofservicetoexistingdevelopment.
(e)Administrative,maintenanceoroperatingcostsofthemunicipality.
6. Any development for which a development fee has been paid is entitled to the use andbenefit of the services for which the fee was imposed and is entitled to receive immediateservice from any existing facility with available capacity to serve the new service units if the
DRAFTInfrastructureImprovementsPlanCityofYumaNorthServiceArea
59
available capacity has not been reserved or pledged in connection with the construction orfinancingofthefacility.
7.Developmentfeesmaybecollectedifanyofthefollowingoccurs:
(a)Thecollectionismadetopayforanecessarypublicserviceorfacilityexpansionthatis identified in the infrastructure improvements plan and the municipality plans tocomplete construction and to have the service available within the time periodestablished in the infrastructure improvement plan, but in no event longer than thetimeperiodprovidedinsubsectionH,paragraph3ofthissection.
(b)Themunicipalityreservesintheinfrastructureimprovementsplanadoptedpursuanttothissectionorotherwiseagreestoreservecapacitytoservefuturedevelopment.
(c) The municipality requires or agrees to allow the owner of a development toconstruct or finance the necessary public service or facility expansion and any of thefollowingapply:
(i) The costs incurred ormoney advanced are credited against or reimbursedfromthedevelopmentfeesotherwiseduefromadevelopment.
(ii) The municipality reimburses the owner for those costs from thedevelopment fees paid from all developments that will use those necessarypublicservicesorfacilityexpansions.
(iii) For those costs incurred the municipality allows the owner to assign thecreditsorreimbursementrightsfromthedevelopmentfeesotherwiseduefroma development to other developments for the same category of necessarypublicservicesinthesameservicearea.
8. Projected interest charges and other finance costs may be included in determining theamount of development fees only if the monies are used for the payment of principal andinterestontheportionofthebonds,notesorotherobligationsissuedtofinanceconstructionofnecessary public services or facility expansions identified in the infrastructure improvementsplan.
9.Moniesreceivedfromdevelopmentfeesassessedpursuanttothissectionshallbeplacedinaseparatefundandaccountedforseparatelyandmayonlybeusedforthepurposesauthorizedby this section. Monies received from a development fee identified in an infrastructureimprovementsplanadoptedorupdatedpursuanttosubsectionDofthissectionshallbeusedtoprovide the same category of necessary public services or facility expansions for which thedevelopment feewasassessedandfor thebenefitof thesameservicearea,asdefined in theinfrastructureimprovementsplan,inwhichthedevelopmentfeewasassessed.Interestearnedonmoniesintheseparatefundshallbecreditedtothefund.
10.Thescheduleforpaymentoffeesshallbeprovidedbythemunicipality.Basedonthecostidentified in the infrastructure improvements plan, the municipality shall provide a credit

DRAFTInfrastructureImprovementsPlanCityofYumaNorthServiceArea
60
toward thepaymentof a development fee for the requiredor agreed todedicationof publicsites, improvements andothernecessarypublic servicesor facility expansions included in theinfrastructure improvementsplanand forwhichadevelopment fee is assessed, to theextentthepublicsites,improvementsandnecessarypublicservicesorfacilityexpansionsareprovidedby the developer. The developer of residential dwelling units shall be required to paydevelopmentfeeswhenconstructionpermitsforthedwellingunitsareissued,oratalatertimeif specified in a development agreement pursuant to section 9-500.05. If a developmentagreementprovidesforfeestobepaidatatimelaterthantheissuanceofconstructionpermits,thedeferred fees shallbepaidno later than fifteendaysafter the issuanceofa certificateofoccupancy.Thedevelopmentagreementshallprovideforthevalueofanydeferredfeestobesupportedbyappropriatesecurity,includingasuretybond,letterofcreditorcashbond.
11. If a municipality requires as a condition of development approval the construction orimprovement of, contributions to or dedication of any facilities that were not included in apreviously adopted infrastructure improvements plan, the municipality shall cause theinfrastructure improvements plan to be amended to include the facilities and shall provide acredit toward the payment of a development fee for the construction, improvement,contributionordedicationofthefacilitiestotheextentthatthefacilitieswillsubstitutefororotherwise reduce theneed forother similar facilities in the infrastructure improvementsplanforwhichdevelopmentfeeswereassessed.
12.Themunicipalityshallforecastthecontributiontobemadeinthefutureincashorbytaxes,fees, assessments or other sources of revenue derived from the property owner towards thecapitalcostsofthenecessarypublicservicecoveredbythedevelopmentfeeandshall includethese contributions in determining the extent of the burden imposed by the development.BeginningAugust1,2014, forpurposesofcalculatingtherequiredoffset todevelopment feespursuanttothissubsection,ifamunicipalityimposesaconstructioncontractingorsimilarexcisetaxrateinexcessofthepercentageamountofthetransactionprivilegetaxrateimposedonthemajority of other transaction privilege tax classifications, the entire excess portion of theconstruction contracting or similar excise tax shall be treated as a contribution to the capitalcosts of necessary public services provided to development for which development fees areassessed,unlesstheexcessportionwasalreadytakenintoaccountforsuchpurposepursuanttothissubsection.
13. If development fees are assessed by a municipality, the fees shall be assessed againstcommercial, residential and industrial development, except that the municipality maydistinguishbetweendifferentcategoriesofresidential,commercialandindustrialdevelopmentin assessing the costs to the municipality of providing necessary public services to newdevelopmentandindeterminingtheamountofthedevelopmentfeeapplicabletothecategoryofdevelopment. If amunicipalityagrees towaiveanyof thedevelopment feesassessedonadevelopment, themunicipality shall reimburse the appropriate development fee accounts for

DRAFTInfrastructureImprovementsPlanCityofYumaNorthServiceArea
61
the amount thatwaswaived. Themunicipality shall providenotice of any suchwaiver to theadvisorycommitteeestablishedpursuanttosubsectionGofthissectionwithinthirtydays.
14. Indeterminingandassessingadevelopment feeapplying to land inacommunity facilitiesdistrictestablishedundertitle48,chapter4,article6,themunicipalityshalltakeintoaccountallpublicinfrastructureprovidedbythedistrictandcapitalcostspaidbythedistrictfornecessarypublicservicesandshallnotassessaportionofthedevelopmentfeebasedontheinfrastructureorcosts.
C.Amunicipalityshallgiveatleastthirtydays'advancenoticeofintentiontoassessadevelopmentfeeand shall release to the public and post on itswebsite or thewebsite of an association of cities andtowns if a municipality does not have a website a written report of the land use assumptions andinfrastructure improvements plan adopted pursuant to subsectionD of this section. Themunicipalityshallconductapublichearingontheproposeddevelopmentfeeatanytimeaftertheexpirationofthethirtydaynoticeofintentiontoassessadevelopmentfeeandatleastthirtydaysbeforethescheduleddateofadoptionofthefeebythegoverningbody.Withinsixtydaysafterthedateofthepublichearingon the proposed development fee, a municipality shall approve or disapprove the imposition of thedevelopment fee. A municipality shall not adopt an ordinance, order or resolution approving adevelopmentfeeasanemergencymeasure.Adevelopmentfeeassessedpursuanttothissectionshallnot be effective until seventy-five days after its formal adoption by the governing body of themunicipality.NothinginthissubsectionshallaffectanydevelopmentfeeadoptedbeforeJuly24,1982.
D. Before the adoptionor amendmentof a development fee, the governingbodyof themunicipalityshall adopt or update the land use assumptions and infrastructure improvements plan for thedesignated service area. Themunicipality shall conduct apublic hearingon the landuse assumptionsandinfrastructureimprovementsplanatleastthirtydaysbeforetheadoptionorupdateoftheplan.Themunicipality shall release the plan to the public, post the plan on its website or the website of anassociationofcitiesandtowns ifthemunicipalitydoesnothaveawebsite, including intheposting itslanduseassumptions,thetimeperiodoftheprojections,adescriptionofthenecessarypublicservicesincludedintheinfrastructureimprovementsplanandamapoftheserviceareatowhichthelanduseassumptionsapply,makeavailable to thepublic thedocumentsusedtoprepare theassumptionsandplanandprovidepublicnoticeatleastsixtydaysbeforethepublichearing,subjecttothefollowing:
1. The land use assumptions and infrastructure improvements plan shall be approved ordisapproved within sixty days after the public hearing on the land use assumptions andinfrastructure improvements plan and at least thirty days before the public hearing on thereport required by subsection C of this section. Amunicipality shall not adopt an ordinance,orderorresolutionapprovingthelanduseassumptionsorinfrastructureimprovementsplanasanemergencymeasure.
2. An infrastructure improvements plan shall be developed by qualified professionals usinggenerallyacceptedengineeringandplanningpracticespursuanttosubsectionEofthissection.

DRAFTInfrastructureImprovementsPlanCityofYumaNorthServiceArea
62
3.Amunicipalityshallupdatethe landuseassumptionsand infrastructure improvementsplanat least every five years. The initial five year period begins on the day the infrastructureimprovementsplan isadopted.Themunicipalityshall reviewandevaluate itscurrent landuseassumptionsandshallcauseanupdateoftheinfrastructureimprovementsplantobepreparedpursuanttothissection.
4.Within sixtydays after completionof theupdated landuse assumptions and infrastructureimprovements plan, themunicipality shall schedule and provide notice of a public hearing todiscuss and review the update and shall determine whether to amend the assumptions andplan.
5.Amunicipality shallholdapublichearing todiscuss theproposedamendments to the landuseassumptions, the infrastructure improvementsplanor thedevelopment fee.The landuseassumptionsandtheinfrastructureimprovementsplan, includingtheamountofanyproposedchanges to thedevelopment feeper service unit, shall bemade available to thepublic onorbeforethedateofthefirstpublicationofthenoticeofthehearingontheamendments.
6. Thenotice andhearing procedures prescribed in paragraph 1 of this subsection apply to ahearingontheamendmentoflanduseassumptions,aninfrastructureimprovementsplanoradevelopmentfee.Withinsixtydaysafterthedateofthepublichearingontheamendments,amunicipality shall approve or disapprove the amendments to the land use assumptions,infrastructure improvements plan or development fee. A municipality shall not adopt anordinance, order or resolution approving the amended land use assumptions, infrastructureimprovementsplanordevelopmentfeeasanemergencymeasure.
7. Theadvisory committeeestablishedunder subsectionGof this section shall file itswrittencomments on any proposed or updated land use assumptions, infrastructure improvementsplananddevelopmentfeesbeforethefifthbusinessdaybeforethedateofthepublichearingontheproposedorupdatedassumptions,planandfees.
8. If, at the time an update as prescribed in paragraph 3 of this subsection is required, themunicipality determines that no changes to the land use assumptions, infrastructureimprovementsplanordevelopmentfeesareneeded,themunicipalitymayasanalternativetotheupdatingrequirementsofthissubsectionpublishnoticeofitsdeterminationonitswebsiteandincludethefollowing:
(a) A statement that themunicipality has determined that no change to the landuseassumptions,infrastructureimprovementsplanordevelopmentfeeisnecessary.
(b)Adescriptionandmapoftheserviceareainwhichanupdatehasbeendeterminedtobeunnecessary.
(c)Astatementthatbyaspecifieddate,whichshallbeatleastsixtydaysafterthedateof publication of the first notice, a person may make a written request to themunicipality requesting that the land use assumptions, infrastructure improvementsplanordevelopmentfeebeupdated.

DRAFTInfrastructureImprovementsPlanCityofYumaNorthServiceArea
63
(d) A statement identifying the person or entity to whom thewritten request for anupdateshouldbesent.
9. If, by the date specified pursuant to paragraph 8 of this subsection, a person requests inwritingthatthelanduseassumptions,infrastructureimprovementsplanordevelopmentfeebeupdated,themunicipalityshallcause,acceptorrejectanupdateoftheassumptionsandplantobepreparedpursuanttothissubsection.
10. Notwithstanding the notice and hearing requirements for adoption of an infrastructureimprovements plan, amunicipalitymay amend an infrastructure improvements plan adoptedpursuanttothissectionwithoutapublichearingiftheamendmentaddressesonlyelementsofnecessarypublic services in theexisting infrastructure improvementsplanand thechanges totheplanwillnot,individuallyorcumulativelywithotheramendmentsadoptedpursuanttothissubsection,increasethelevelofserviceintheserviceareaorcauseadevelopmentfeeincreaseofgreaterthanfivepercentwhenanewormodifieddevelopmentfeeisassessedpursuanttothis section.Themunicipality shallprovidenoticeofany suchamendmentat least thirtydaysbeforeadoption,shallposttheamendmentonitswebsiteoronthewebsiteofanassociationofcities and towns if themunicipality does not have a website and shall provide notice to theadvisory committeeestablishedpursuant to subsectionGof this section that theamendmentcomplieswiththissubsection.
E. For each necessary public service that is the subject of a development fee, the infrastructureimprovementsplanshallinclude:
1. A description of the existing necessary public services in the service area and the costs toupgrade,update, improve,expand,corrector replace thosenecessarypublic services tomeetexistingneedsandusageandstrictersafety,efficiency,environmentalorregulatorystandards,whichshallbepreparedbyqualifiedprofessionalslicensedinthisstate,asapplicable.
2.An analysis of the total capacity, the level of currentusage and commitments for usageofcapacity of the existing necessary public services, which shall be prepared by qualifiedprofessionalslicensedinthisstate,asapplicable.
3.Adescriptionofallorthepartsofthenecessarypublicservicesorfacilityexpansionsandtheircosts necessitated by and attributable to development in the service area based on theapproved land use assumptions, including a forecast of the costs of infrastructure,improvements, real property, financing, engineering and architectural services,which shall bepreparedbyqualifiedprofessionalslicensedinthisstate,asapplicable.
4.Atableestablishingthespecificlevelorquantityofuse,consumption,generationordischargeof a service unit for each category of necessary public services or facility expansions and anequivalencyorconversiontableestablishingtheratioofaserviceunittovarioustypesof landuses,includingresidential,commercialandindustrial.
DRAFTInfrastructureImprovementsPlanCityofYumaNorthServiceArea
64
5. The total number of projected service units necessitated by and attributable to newdevelopment in the serviceareabasedon theapproved landuseassumptionsand calculatedpursuanttogenerallyacceptedengineeringandplanningcriteria.
6. Theprojecteddemand for necessary public services or facility expansions requiredby newserviceunitsforaperiodnottoexceedtenyears.
7.A forecastof revenuesgeneratedbynewserviceunitsother thandevelopment fees,whichshall include estimated state-shared revenue, highway users revenue, federal revenue, advalorempropertytaxes,constructioncontractingorsimilarexcisetaxesandthecapitalrecoveryportionofutilityfeesattributabletodevelopmentbasedontheapprovedlanduseassumptions,andaplanto includethesecontributions indeterminingtheextentoftheburden imposedbythedevelopmentasrequiredinsubsectionB,paragraph12ofthissection.
F.Amunicipality'sdevelopmentfeeordinanceshallprovidethatanewdevelopmentfeeoranincreasedportion of amodified development fee shall not be assessed against a development for twenty-fourmonths after the date that themunicipality issues the final approval for a commercial, industrial ormultifamily development or the date that the first building permit is issued for a residentialdevelopment pursuant to an approved site plan or subdivision plat, provided that no subsequentchanges are made to the approved site plan or subdivision plat that would increase the number ofservice units. If the number of service units increases, the new or increased portion of a modifieddevelopmentfeeshallbelimitedtotheamountattributabletotheadditionalserviceunits.Thetwenty-four month period shall not be extended by a renewal or amendment of the site plan or the finalsubdivisionplat thatwas the subject of the final approval. Themunicipality shall issue, on request, awrittenstatementofthedevelopmentfeescheduleapplicabletothedevelopment.If,afterthedateofthe municipality's final approval of a development, the municipality reduces the development feeassessedondevelopment,thereducedfeeshallapplytothedevelopment.
G.Amunicipalityshalldooneofthefollowing:
1. Before the adoption of proposed or updated land use assumptions, infrastructureimprovements plan and development fees as prescribed in subsection D of this section, themunicipality shall appoint an infrastructure improvements advisory committee, subject to thefollowingrequirements:
(a) The advisory committee shall be composed of at least five members who areappointed by the governing body of the municipality. At least fifty per cent of themembers of the advisory committee must be representatives of the real estate,development or building industries, of which at least onemember of the committeemustbefromthehomebuildingindustry.Membersshallnotbeemployeesorofficialsofthemunicipality.
(b)Theadvisorycommitteeshallserveinanadvisorycapacityandshall:

DRAFTInfrastructureImprovementsPlanCityofYumaNorthServiceArea
65
(i)Advisethemunicipalityinadoptinglanduseassumptionsandindeterminingwhether the assumptions are in conformance with the general plan of themunicipality.
(ii)Reviewtheinfrastructureimprovementsplanandfilewrittencomments.
(iii)Monitor and evaluate implementationof the infrastructure improvementsplan.
(iv) Every year file reports with respect to the progress of the infrastructureimprovements plan and the collection and expenditures of development feesand report to the municipality any perceived inequities in implementing theplanorimposingthedevelopmentfee.
(v) Advise the municipality of the need to update or revise the land useassumptions,infrastructureimprovementsplananddevelopmentfee.
(c) Themunicipality shall make available to the advisory committee any professionalreportswithrespecttodevelopingandimplementingthe infrastructure improvementsplan.
(d)Themunicipalityshalladoptproceduralrulesfortheadvisorycommitteetofollowincarryingoutthecommittee'sduties.
2.Inlieuofcreatinganadvisorycommitteepursuanttoparagraph1ofthissubsection,providefor a biennial certified audit of the municipality's land use assumptions, infrastructureimprovements plan and development fees. An audit pursuant to this paragraph shall beconducted by one or more qualified professionals who are not employees or officials of themunicipality and who did not prepare the infrastructure improvements plan. The audit shallreview the progress of the infrastructure improvements plan, including the collection andexpendituresofdevelopment fees foreachproject in theplan,andevaluateany inequities inimplementing the plan or imposing the development fee. The municipality shall post thefindingsoftheauditonthemunicipality'swebsiteorthewebsiteofanassociationofcitiesandtowns if themunicipality does not have awebsite and shall conduct a public hearing on theauditwithinsixtydaysofthereleaseoftheaudittothepublic.
H.Onwrittenrequest,anownerofrealpropertyforwhichadevelopmentfeehasbeenpaidafterJuly31,2014isentitledtoarefundofadevelopmentfeeoranypartofadevelopmentfeeif:
1. Pursuant to subsection B, paragraph 6 of this section, existing facilities are available andserviceisnotprovided.
2. The municipality has, after collecting the fee to construct a facility when service is notavailable,failedtocompleteconstructionwithinthetimeperiodidentifiedintheinfrastructureimprovementsplan,but innoeventlaterthanthetimeperiodspecifiedinparagraph3ofthissubsection.

DRAFTInfrastructureImprovementsPlanCityofYumaNorthServiceArea
66
3.Foradevelopmentfeeotherthanadevelopmentfeeforwaterorwastewaterfacilities,anypartofthedevelopmentfeeisnotspentasauthorizedbythissectionwithintenyearsafterthefeehasbeenpaidor,foradevelopmentfeeforwaterorwastewaterfacilities,anypartofthedevelopmentfeeisnotspentasauthorizedbythissectionwithinfifteenyearsafterthefeehasbeenpaid.
I. If the development fee was collected for the construction of all or a portion of a specific item ofinfrastructure,andoncompletionoftheinfrastructurethemunicipalitydeterminesthattheactualcostof constructionwas less than the forecasted cost of constructiononwhich thedevelopment feewasbased and the difference between the actual and estimated cost is greater than ten per cent, thecurrent owner may receive a refund of the portion of the development fee equal to the differencebetween the development fee paid and the development fee that would have been due if thedevelopmentfeehadbeencalculatedattheactualconstructioncost.
J.Arefundshallincludeanyinterestearnedbythemunicipalityfromthedateofcollectiontothedateof refund on the amount of the refunded fee. All refunds shall bemade to the record owner of thepropertyat the time the refund ispaid. If thedevelopment fee ispaidbya governmental entity, therefundshallbepaidtothegovernmentalentity.
K.AdevelopmentfeethatwasadoptedbeforeJanuary1,2012maycontinuetobeassessedonlytotheextent that it will be used to provide a necessary public service for which development fees can beassessedpursuanttothissectionandshallbereplacedbyadevelopmentfeeimposedunderthissectiononor beforeAugust 1, 2014.Anymunicipality having a development fee that has not been replacedunderthissectiononorbeforeAugust1,2014shallnotcollectdevelopmentfeesuntilthedevelopmentfeehasbeenreplacedwithafeethatcomplieswiththissection.AnydevelopmentfeemoniescollectedbeforeJanuary1,2012remaininginadevelopmentfeeaccount:
1. Shallbeused towards the samecategoryofnecessarypublic servicesasauthorizedby thissection.
2.Ifdevelopmentfeeswerecollectedforapurposenotauthorizedbythissection,shallbeusedforthepurposeforwhichtheywerecollectedonorbeforeJanuary1,2020,andafterwhich,ifnot spent, shall be distributed equally among the categories of necessary public servicesauthorizedbythissection.
L.Amoratoriumshallnotbeplacedondevelopmentforthesolepurposeofawaitingcompletionofalloranypartoftheprocessnecessarytodevelop,adoptorupdatedevelopmentfees.
M.Inanyjudicialactioninterpretingthissection,allpowersconferredonmunicipalgovernmentsinthissection shallbenarrowlyconstrued toensure thatdevelopment feesarenotused to imposeonnewresidentsaburdenalltaxpayersofamunicipalityshouldbearequally.
N.Eachmunicipality thatassessesdevelopment feesshall submitanannual reportaccounting for thecollectionanduseofthefeesforeachservicearea.Theannualreportshallincludethefollowing:
1.Theamountassessedbythemunicipalityforeachtypeofdevelopmentfee.

DRAFTInfrastructureImprovementsPlanCityofYumaNorthServiceArea
67
2. Thebalanceof each fundmaintained for each typeof development fee assessedasof thebeginningandendofthefiscalyear.
3. Theamountof interestorotherearningson themonies in each fundasof theendof thefiscalyear.
4.Theamountofdevelopmentfeemoniesusedtorepay:
(a)Bonds issuedby themunicipality topay the costof a capital improvementprojectthat is thesubjectofadevelopment feeassessment, including theamountneeded torepay the debt service obligations on each facility for which development fees havebeenidentifiedasthesourceoffundingandthetimeframesinwhichthedebtservicewillberepaid.
(b)Moniesadvancedby themunicipality from fundsother than the fundsestablishedfordevelopmentfees inordertopaythecostofacapital improvementprojectthat isthe subject of a development fee assessment, the total amount advanced by themunicipality foreach facility, thesourceof themoniesadvancedandthetermsunderwhichthemonieswillberepaidtothemunicipality.
5.Theamountofdevelopment feemonies spentoneachcapital improvementproject that isthe subject of a development fee assessment and the physical location of each capitalimprovementproject.
6. The amount of development fee monies spent for each purpose other than a capitalimprovementprojectthatisthesubjectofadevelopmentfeeassessment.
O.Withinninetydaysfollowingtheendofeachfiscalyear,eachmunicipalityshallsubmitacopyoftheannual report to thecityclerkandpost the reporton themunicipality'swebsiteor thewebsiteofanassociation of cities and towns if the municipality does not have a website. Copies shall be madeavailable to the public on request. The annual reportmay contain financial information that has notbeenaudited.
P.Amunicipality that fails to file the report andpost the reporton themunicipality'swebsiteor thewebsiteofanassociationofcitiesandtownsifthemunicipalitydoesnothaveawebsiteasrequiredbythissectionshallnotcollectdevelopmentfeesuntilthereportisfiledandposted.
Q.Anyactiontocollectadevelopmentfeeshallbecommencedwithintwoyearsaftertheobligationtopaythefeeaccrues.
R. Amunicipalitymay continue to assess a development fee adoptedbefore January 1, 2012 for anyfacilitythatwasfinancedbeforeJune1,2011if:
1.Developmentfeeswerepledgedtorepaydebtserviceobligationsrelatedtotheconstructionofthefacility.
DRAFTInfrastructureImprovementsPlanCityofYumaNorthServiceArea
68
2.AfterAugust1,2014,anydevelopment feescollectedunder thissubsectionareusedsolelyfor the payment of principal and interest on the portion of the bonds, notes or other debtserviceobligationsissuedbeforeJune1,2011tofinanceconstructionofthefacility.
S.ThroughAugust1,2014,adevelopmentfeeadoptedbeforeJanuary1,2012maybeusedtofinanceconstructionofafacilityandmaybepledgedtorepaydebtserviceobligationsif:
1.ThefacilitythatisbeingfinancedisafacilitythatisdescribedundersubsectionT,paragraph7,subdivisions(a)through(g)ofthissection.
2.ThefacilitywasincludedinaninfrastructureimprovementsplanadoptedbeforeJune1,2011.
3.Thedevelopment feesareused for thepaymentofprincipaland intereston theportionofthe bonds, notes or other debt service obligations issued to finance construction of thenecessary public services or facility expansions identified in the infrastructure improvementplan.
T.Forthepurposesofthissection:
1."Dedication"meanstheactualconveyancedateorthedateanimprovement,facilityorrealorpersonalpropertyisplacedintoservice,whicheveroccursfirst.
2."Development"means:
(a)Thesubdivisionofland.
(b) The construction, reconstruction, conversion, structural alteration, relocation orenlargementofanystructurethataddsorincreasesthenumberofserviceunits.
(c)Anyuseorextensionoftheuseoflandthatincreasesthenumberofserviceunits.
3."Facilityexpansion"meanstheexpansionofthecapacityofanexistingfacilitythatservesthesame function as anotherwise newnecessary public service in order that the existing facilitymay serve new development. Facility expansion does not include the repair, maintenance,modernizationorexpansionofanexistingfacilitytobetterserveexistingdevelopment.
4."Finalapproval"means:
(a)Foranonresidentialormultifamilydevelopment,theapprovalofasiteplanor,ifnositeplanissubmittedforthedevelopment,theapprovalofafinalsubdivisionplat.
(b)Forasinglefamilyresidentialdevelopment,theapprovalofafinalsubdivisionplat.
5. "Infrastructure improvements plan" means a written plan that identifies each necessarypublicserviceorfacilityexpansionthatisproposedtobethesubjectofadevelopmentfeeandotherwisecomplieswiththerequirementsofthissection,andmaybethemunicipality'scapitalimprovementsplan.

DRAFTInfrastructureImprovementsPlanCityofYumaNorthServiceArea
69
6."Landuseassumptions"meansprojectionsofchangesinlanduses,densities,intensitiesandpopulation foraspecifiedserviceareaoveraperiodofat least tenyearsandpursuant to thegeneralplanofthemunicipality.
7."Necessarypublicservice"meansanyofthefollowingfacilitiesthathavealifeexpectancyofthreeormoreyearsandthatareownedandoperatedbyoronbehalfofthemunicipality:
(a) Water facilities, including the supply, transportation, treatment, purification anddistributionofwater,andanyappurtenancesforthosefacilities.
(b) Wastewater facilities, including collection, interception, transportation, treatmentanddisposalofwastewater,andanyappurtenancesforthosefacilities.
(c) Stormwater, drainageand flood control facilities, includinganyappurtenances forthosefacilities.
(d) Library facilitiesofup to ten thousandsquare feet thatprovideadirectbenefit todevelopment,notincludingequipment,vehiclesorappurtenances.
(e) Street facilities located in the servicearea, includingarterialor collector streetsorroadsthathavebeendesignatedonanofficiallyadoptedplanofthemunicipality,trafficsignalsandrights-of-wayandimprovementsthereon.
(f) Fire and police facilities, including all appurtenances, equipment and vehicles. Fireandpolicefacilitiesdonotincludeafacilityorportionofafacilitythatisusedtoreplaceservicesthatwereonceprovidedelsewhereinthemunicipality,vehiclesandequipmentusedtoprovideadministrativeservices,helicoptersorairplanesorafacilitythatisusedfortrainingfirefightersorofficersfrommorethanonestationorsubstation.
(g)Neighborhoodparksandrecreationalfacilitiesonrealpropertyuptothirtyacresinarea,orparksandrecreationalfacilitieslargerthanthirtyacresifthefacilitiesprovideadirect benefit to the development. Park and recreational facilities do not includevehicles, equipment or that portion of any facility that is used for amusement parks,aquariums,aquatic centers,auditoriums,arenas,artsandcultural facilities,bandstandand orchestra facilities, bathhouses, boathouses, clubhouses, community centersgreaterthanthreethousandsquarefeetinfloorarea,environmentaleducationcenters,equestrian facilities, golf course facilities, greenhouses, lakes,museums, themeparks,water reclamation or riparian areas, wetlands, zoo facilities or similar recreationalfacilities,butmayincludeswimmingpools.
(h)Anyfacility thatwasfinancedandthatmeetsallof therequirementsprescribed insubsectionRofthissection.
8."Qualifiedprofessional"meansaprofessionalengineer,surveyor,financialanalystorplannerprovidingserviceswithinthescopeoftheperson'slicense,educationorexperience.
DRAFTInfrastructureImprovementsPlanCityofYumaNorthServiceArea
70
9. "Service area" means any specified area within the boundaries of a municipality in whichdevelopmentwillbeservedbynecessarypublicservicesorfacilityexpansionsandwithinwhichasubstantialnexusexistsbetweenthenecessarypublicservicesor facilityexpansionsandthedevelopmentbeingservedasprescribedintheinfrastructureimprovementsplan.
10."Serviceunit"meansastandardizedmeasureofconsumption,use,generationordischargeattributabletoanindividualunitofdevelopmentcalculatedpursuanttogenerallyacceptedengineeringorplanningstandardsforaparticularcategoryofnecessarypublicservicesorfacilityexpansions.

DRAFTInfrastructureImprovementsPlanCityofYumaNorthServiceArea
71
APPENDIXC:IMPLEMENTATIONANDADMINISTRATIONAsspecifiedinARS9-463.05,therearecertainaccountingrequirementsthatmustbemetbytheCity:
Monies received fromdevelopment fees assessedpursuant to this section shall be placed in aseparatefundandaccountedforseparatelyandmayonlybeusedforthepurposesauthorizedby this section. Monies received from a development fee identified in an infrastructureimprovementsplanadoptedorupdatedpursuanttosubsectionDofthissectionshallbeusedtoprovide the same category of necessary public services or facility expansions for which thedevelopment feewasassessedand for thebenefit of the same servicearea, asdefined in theinfrastructure improvementsplan, inwhichthedevelopment feewasassessed. Interestearnedonmoniesintheseparatefundshallbecreditedtothefund.
Allcostsinthedevelopmentfeecalculationsaregivenincurrentdollarswithnoassumedinflationrateovertime.IfcostestimateschangesignificantlytheCityshouldupdatethefeecalculations.
RESIDENTIALDEVELOPMENT
Asdiscussedbelow,residentialdevelopmentcategoriesarebasedondatafromtheU.S.CensusBureau,American Community Survey. Yuma will collect development fees from all new residential units,includingmobilehomesandRecreationalVehicles(RV).Foraparcelintendedforoccupancybymultiplemobile homes and/or RVs, the landowner will pay a development fee for each site than canaccommodate a residential unit. One-time development fees are determined by site capacity (i.e.numberofresidentialunits)andwillnotbeimposedonreplacementunits.
Single-Family:
1. Single-familydetached isa1-unitstructuredetachedfromanyotherhouse,that is,withopenspaceonallfoursides.Suchstructuresareconsidereddetachedeveniftheyhaveanadjoiningshedorgarage.Aone-familyhousethatcontainsabusiness isconsidereddetachedas longasthebuildinghasopenspaceonallfoursides.
2. Single-familyattached (townhouse) isa1-unit structure thathasoneormorewallsextendingfromground to roof separating it fromadjoining structures. In rowhouses (sometimes calledtownhouses),doublehouses,orhousesattached tononresidential structures,eachhouse isaseparate,attachedstructureifthedividingorcommonwallgoesfromgroundtoroof.
Multi-Family:
1. 2+units(duplexesandapartments)areunitsinstructurescontainingtwoormorehousingunits,furthercategorizedasunits instructureswith“2,3or4,5to9,10to19,20to49,and50ormoreapartments.”
AllOtherTypes:
1. Mobilehomeincludesbothoccupiedandvacantmobilehomes,towhichnopermanentroomshavebeenadded,arecountedinthiscategory.Mobilehomesusedonlyforbusinesspurposes
DRAFTInfrastructureImprovementsPlanCityofYumaNorthServiceArea
72
or for extra sleeping space andmobile homes for sale on a dealer's lot, at the factory, or instoragearenotcountedinthehousinginventory.
2. Boat,RV,Van,Etc.includesanylivingquartersoccupiedasahousingunitthatdoesnotfittheother categories (e.g., houseboats, railroad cars, campers, and vans). Recreational vehicles,boats,vans,railroadcars,andthelikeareincludedonlyiftheyareoccupiedasacurrentplaceofresidence.
NONRESIDENTIALDEVELOPMENT
Theproposedgeneralnonresidentialdevelopmentcategories (definedbelow)canbeused forallnewconstructionwithinYuma.Nonresidentialdevelopmentcategoriesrepresentgeneralgroupsoflandusesthat share similar averageweekday vehicle trip generation rates andemploymentdensities (i.e., jobsperthousandsquarefeetoffloorarea).
Commercial / Retail: Establishments primarily selling merchandise, eating/drinking places, andentertainmentuses.Bywayofexample,Commercial/Retail includesshoppingcenters,supermarkets,pharmacies,restaurants,bars,nightclubs,automobiledealerships,andmovietheaters.
Office/Institutional: Establishmentsprovidingmanagement,administrative,professional,orbusinessservices; personal and health care services; lodging facilities; and public and quasi-public buildingsprovidingeducational, social assistance,or religious services.Bywayofexample,Office / Institutionalincludes banks, business offices; hotels andmotels; assisted living facilities, nursing homes, hospitalsand medical offices; veterinarian clinics; and institutional facilities such as schools, universities,churches,daycarefacilities,governmentbuildings,andprisons.
Industrial:Establishmentsprimarilyengagedintheproduction,transportation,orstorageofgoods.Bywayofexample,Industrialincludesmanufacturingplants,distributionwarehouses,truckingcompanies,utilitysubstations,powergenerationfacilities,andtelecommunicationsbuildings.