prepared rebuttal testimony california ... - the goodman · prepared rebuttal testimony of ian...
TRANSCRIPT

PREPARED REBUTTAL TESTIMONY
OF IAN GOODMAN
CALIFORNIA PUBLIC UTILITIES COMMISSION
APPLICATION NO. 09-12-020
PACIFIC GAS & ELECTRIC COMPANY
GENERAL RATE CASE 2011
Prepared by
The Goodman Group, Ltd.
On Behalf of
THE GREENLINING INSTITUTE
June 4, 2010

Contents
1. Introduction ............................................................................................................ 1
2. Economic Impacts of Proposed Capital Expenditures ........................................... 3
TABLES & FIGURES ................................................................................................. 20

1
1. Introduction 1
2
My name is Ian Goodman. My business address is 2515 Piedmont Avenue, Suite 11, 3
Berkeley, California 94704-3142. My qualifications were provided in my direct testimony 4
in this proceeding submitted on behalf of The Greenlining Institute (Greenlining). 5
Concurrent with the filing of my direct testimony on May 19, direct testimony was 6
submitted by other intervenors. Testimony was submitted by Aglet Consumer Alliance 7
(Aglet), California City-County Street Light Association (Cal-SLA), Coalition Of California 8
Utility Employees (CCUE), California Farm Bureau Federation (CFBF), the Consumer 9
Federation of California (CFC), Direct Access Customer Coalition (DACC), the Energy 10
Producers And Users Coalition (EPUC), the Engineers And Scientists Of California, 11
Local 20, IFPTE (ESC-Local 20), Merced Irrigation District (Merced ID), Modesto 12
Irrigation District (Modesto ID), South San Joaquin Irrigation District (SSJID), The Utility 13
Reform Network (TURN), and the Western Power Trading Forum (WPTF). 14
On May 26, direct testimony was submitted by Women’s Energy Matters (WEM) and 15
jointly by PG&E and Disability Rights Advocates (PG&E and DisabRA). 16
The main purpose of this rebuttal testimony is to respond to the testimony of several 17
intervenors1 regarding the Economic Impacts of Proposed Capital Expenditures 18
(particularly stimulus and job creation). In my review of the testimony of other parties, I 19
have identified several instances where their analyses (and particularly their quantitative 20
estimates) can be further refined. This rebuttal testimony provides tools for the 21
Commission to better interpret the body of evidence for its evaluation of the Economic 22
Impacts of Proposed Capital Expenditures. 23
I have carefully reviewed all of the new material that has become available subsequent 24
to the preparation of my direct testimony.2 Most of the testimony by other intervenors 25
does not relate to the topics addressed in my direct testimony and does not necessitate 26
any response on my part.3 To the extent that the testimony by other intervenors (and 27
any interrogatory responses that have become available since the filing of my direct 28
1 Notably Aglet, CFBF and SSJID.
2 The new material that I have reviewed includes additional responses to interrogatories that became
available after the preparation of my direct testimony. Most of these recent responses are by PG&E to the interrogatories of various intervenors. However, responses by DRA to the interrogatories of PG&E are also beginning to be submitted. 3 Likewise, the joint testimony submitted on May 26 by PG&E and DisabRA, as well as the testimony filed
by WEM, do not relate to the topics addressed in my direct testimony and thus do not necessitate any response on my part. And most of the interrogatory responses that have become available subsequent to the filing of my direct testimony do not relate to the topics addressed in my direct testimony and thus do not necessitate any response on my part.

2
testimony) do consider topics addressed in my direct testimony, I am pleased to report 1
that this new material does not in any way undercut my direct testimony. If anything, it 2
mainly serves to further reinforce my direct testimony, and the data, analyses, results, 3
and positions therein. 4
Specifically, as will be considered in Section 2 of this rebuttal testimony, the direct 5
testimony on behalf of several other intervenors has substantial overlap and intersection 6
with the issues regarding the Economic Impacts of Proposed Capital Expenditures, 7
which were considered in Section 2 of my direct testimony. Put more simply, the 8
testimony of several other intervenors also critiques PG&E’s claims regarding economic 9
stimulus and jobs creation. 10
As indicated above, to the extent that the testimony of other intervenors considers the 11
topics addressed in my direct testimony, this testimony of other intervenors generally 12
presents data, analyses, results, and positions that are broadly consistent with those in 13
my direct testimony. This broad consistency among the testimony of multiple 14
intervenors is notable and mutually reinforcing. 15
It is useful to be aware of such relationships among the testimony of various 16
intervenors, as well as the relationships between the testimony of intervenors and that 17
of the utility. Put very simply, this is a situation where there is substantial agreement 18
among intervenors, but little agreement between intervenors and the utility. 19
Consequently, rebuttal testimony might not be warranted if it were merely to comment 20
upon the broad consistencies between the testimony of other intervenors and my direct 21
testimony. But in fact, as described below, there are some important points of 22
difference that can be best identified and resolved in the context of rebuttal testimony. 23
First, there are certain instances where the testimony submitted by other intervenors 24
presents data, analyses, results, and positions that differ somewhat from those 25
presented in my direct testimony. Thus, this rebuttal testimony will concisely address 26
these differences. 27
Second, there are other instances where the testimony of other intervenors presents 28
data and analyses, notably to provide specific quantitative results regarding the 29
Economic Impacts of Proposed Capital Expenditures (stimulus and jobs creation). The 30
consideration of these topics in my direct testimony was somewhat more conceptual 31
and qualitative. In general, these quantitative results presented by other intervenors are 32
broadly consistent with the somewhat more conceptual and qualitative analysis and 33
results in my direct testimony. 34
However, there are certain instances where the data, analyses, and results presented 35
by other intervenors should be fine-tuned and refined, so as to provide better 36

3
information for the Commission. Thus, this rebuttal testimony will concisely identify 1
these instances and provide guidance to the Commission regarding analyses and 2
results related to the Economic Impacts of Proposed Capital Expenditures (stimulus and 3
jobs creation). 4
5
2. Economic Impacts of Proposed Capital Expenditures 6
7
As introduced in Section 1, the direct testimony on behalf of several other intervenors 8
(Aglet, CFBF and SSJID)4 has substantial overlap and intersection with the issues 9
regarding the Economic Impacts of Proposed Capital Expenditures, which were 10
considered in Section 2 of my direct testimony. Put more simply, the testimony of these 11
other intervenors also strongly critiques PG&E’s claims regarding economic stimulus 12
and jobs creation. 13
The testimony of these other intervenors generally presents data, analysis, results, and 14
positions that are broadly consistent with those in my direct testimony and with those I 15
would support as appropriate for considering the Economic Impacts of Proposed Capital 16
Expenditures. But there are also some points of difference that will be identified and 17
discussed below. 18
This rebuttal testimony is in response to the direct testimony of these other intervenors 19
regarding the Economic Impacts of Proposed Capital Expenditures. The direct 20
testimony on behalf of several intervenors clearly demonstrates the problems resulting 21
from PG&E’s submission in GRC 2011 regarding economic stimulus and jobs creation. 22
This testimony has concluded that PG&E’s claims about macroeconomic impacts are 23
unsupported and cannot be relied upon.5 These claims are based on the IHS Global 24
Insight study that ignores virtually all of cost recovery and assumes that utility capital 25
spending is a macroeconomic free lunch.6 Moreover, the IHS Global Insight study could 26
be misleading.7 It is poorly documented, and no additional documentation or 27
workpapers from this study have been made available in this proceeding.8 28
29
In an attempt to fill the information gap left by PG&E’s failure to provide a reliable 30
analysis and useful information regarding macroeconomic impacts, intervenor testimony 31
has attempted to clarify the nature and potential scope of these impacts. As might be 32
4 Direct Testimony of Weil (pp. 17-19), Reid (pp. 8-9), Illingworth (pp. 7-8), and McClary (pp. 61-70).
5 Direct Testimony of Weil (p. 19), McClary (pp. 62-65) and Goodman (p. 22).
6 Direct Testimony of Weil (pp. 18-19), Reid (p. 9), Illingworth (p. 7), and McClary (pp. 65-70) and
Goodman (pp. 8-19). 7 Direct Testimony of McClary (pp. 62) and Goodman (pp. 7, 12, 22).
8 Direct Testimony of McClary (pp. 62-64) and Goodman (p. 15).

4
expected in a rate proceeding, intervenors have provided substantial guidance as to the 1
duration and amount of lifetime cost recovery associated with capital expenditures.9 In 2
some cases, intervenors have even provided alternative quantitative estimates for jobs 3
and other macroeconomic impacts associated with PG&E’s capital expenditures.10 4
5
The testimony by intervenors has provided the Commission with substantial guidance 6
as to why PG&E’s analysis of macroeconomic impacts cannot be relied upon. And this 7
testimony has also provided some guidance as to duration and amount of lifetime 8
macroeconomic impacts associated with capital expenditure. But pending rebuttal 9
testimony, the submissions in GRC 2011 have not yet provided usable estimates of the 10
overall job impacts associated with PG&E’s proposed capital expenditures. 11
12
The direct testimony by intervenors demonstrates that PG&E’s estimates cannot be 13
relied upon, and this testimony provides a good starting point for developing more 14
reliable estimates. But pending rebuttal testimony, the Commission is faced with having 15
to review a variety of limited and sometimes conflicting sets of information regarding 16
macroeconomic impacts. PG&E’s analysis has failed to provide a coherent framework 17
for analyzing macroeconomic impacts, and intervenors have succeeded in filling only a 18
portion of the gap left by PG&E. 19
20
This lack of coherent framework is particularly problematic given the nature of 21
macroeconomic impacts. By definition, macroeconomic impacts involve the broad 22
functioning of the economy. And particularly for a utility such as PG&E, the service area 23
economy is very large, complex, diverse, dynamic, and interactive. A coherent 24
framework for macroeconomic analysis must consider these overall broad 25
macroeconomic impacts through the service area, and how they interact.11 26
9 Direct Testimony of Weil (pp. 18-19), Illingworth (p. 7) and Goodman (pp. 18-19), where I state the
following:
The cumulative cost recovery over the first three years will equal about half of the investment spending. After six or seven years, cost recovery will equal the full amount of the investment spending. And there will then be decades more of cost recovery and job losses.
10 The Direct Testimony of Illingworth (p. 7) estimates job losses owing to cost recovery. McClary’s Direct
Testimony (pp. 68-69) compares the job impacts calculated by IHS Global Insight with those based on multipliers from another commonly used input/output model (RIMS II); McClary also cites multiplier estimates from Mark Zandi <www.economy.com>. McClary’s analysis indicates that PG&E capital spending has lower multipliers (and thus job impacts) than does other spending in the economy, notably by PG&E customers. “These data indicate that increasing rates to fund PG&E’s proposed expenditures could have a net negative stimulus effect by reducing demand in other areas of the economy.” (McClary, p. 68) 11
To make an analogy that is more proximate to traditional ratemaking, it would be difficult (if not impossible) to set utility rates absent the requisite coherent framework(s), such as a functional accounting system, or even conventions for the treatment of deferral accounts and changes in depreciation rates. (footnote continued on next page)

5
1
So absent a coherent framework, PG&E’s estimates of macroeconomic impacts provide 2
little information that is useful and meaningful as to overall broad impacts. PG&E’s 3
analysis considered only a non-representative subset of overall impacts. Direct 4
testimony on behalf of several intervenors has thus concluded that PG&E’s analysis is 5
selective, simplistic, and potentially misleading. 6
7
PG&E’s failure to provide a coherent framework for analysis of macroeconomic impacts 8
is a serious impediment to any meaningful consideration of such impacts in this 9
proceeding. Thus, to facilitate consideration of such impacts during the remainder of this 10
proceeding, this rebuttal testimony will provide some additional framework. 11
12
Fortunately, the best practices for job studies do provide a coherent framework for the 13
analysis of macroeconomic impacts.12 Best practices for job studies emphasize the 14
following qualities: 15
consideration of the overall broad macroeconomic impacts throughout a region 16
and how these impacts interact; 17
balanced consideration of the short- and long-term macroeconomic benefits and 18
costs over the life of an investment; 19
the use of suitable multipliers and realistic assumptions based on knowledge of 20
the regional economy, as well as industry-specific knowledge.13 21
22
As noted in the direct testimony by several intervenors, this is a rate proceeding, rather 23
than a broad exercise in macroeconomic policymaking.14 Likewise, this proceeding is 24
not the place for a far-ranging exploration of abstract economics and regulatory policy; 25
the primary focus needs to be on what PG&E is proposing to do, and how that should 26
be evaluated.15 27
28
Thus, the most effective way for me to facilitate appropriate consideration of 29
macroeconomic impacts in this proceeding is by applying the best practices for job 30
Like the broader economy, utilities such as PG&E are very large, complex, diverse, dynamic, and interactive. Notably, in ratemaking, we need to know how changes in a given factor will ripple through the system and interact with other factors. 12
With over 20 years of experience in conducting job studies throughout North America, and in reviewing and critiquing over 100 job studies performed by others, I have become intimately familiar with the best practices for job studies and their application. See also footnote 27 of my direct testimony (Goodman, p. 18), p. 2 of my résumé < http://www.thegoodman.com/pdf/TGG1003IanGoodmanCV.pdf >, and The Goodman Group’s Regional Economics webpage < http://www.thegoodman.com/page.php?id=9>. 13
It goes without saying the IHS Global Insight study fails to apply even basic best practices for job studies. 14
Direct testimony of Reid (pp. 8-9), McClary (pp. 61-62) and Goodman (pp. 3, 7, 11, 12). 15
Direct testimony of Reid (pp. 27-38), McClary (pp. 61-62) and Goodman (pp. 6).

6
studies to provide alternative estimates of the overall job impacts associated with 1
PG&E’s proposed capital expenditures. The development of these estimates as 2
presented in this rebuttal testimony provides a coherent framework to analyze the 3
macroeconomic impacts and offer guidance to the Commission. Moreover, these job 4
estimates and framework provide the most efficient and useful response to certain 5
issues raised in the testimony submitted by other intervenors.16 Rather than provide an 6
abstract response as to how these issues are dealt with in analysis of macroeconomic 7
impacts, I will illustrate how I have taken them into account to develop alternative job 8
estimates. 9
10
More specifically, in the development of the alternative estimates, I use PG&E’s 11
analysis as a starting point, and make adjustments to correct the most serious flaws in 12
response to the direct testimony of other intervenors, and based on my own extensive 13
experience with job studies and the application of best practices. With these 14
adjustments, I derive cost recovery assumptions and job estimates that are useful for 15
this proceeding. While the results are approximate, they are sufficiently accurate to be 16
usable in this proceeding. 17
18
As noted in my direct testimony (p 18), I have not been able to undertake a full 19
independent job study in the context of this proceeding. Nonetheless, this rebuttal 20
testimony presents usable results by correcting the most serious flaws in the IHS Global 21
Insight study, and integrating and fine-tuning the positions of various intervenors. The 22
result is a fuller, more coherent, and more usable set of estimates for job impacts than 23
those provided by PG&E. Moreover, this rebuttal testimony represents a powerful offer 24
of proof of the validity intervenors’ critique of PG&E’s analysis given that the usable job 25
estimates derived herein differ dramatically from those claimed by PG&E. 26
27
As emphasized in the direct testimony of intervenors, the starting point for any realistic 28
estimation of macroeconomic impacts is an appropriate modeling of the cost recovery 29
associated with capital expenditures.17 Weil explains both what was done in the Global 30
Insight study and what should have been done: 31
32
Global Insight reduced PG&E’s proposed capital expenditures by 18% to 33
account for revenue requirements collected through customer rates during 34
the three year study period. The basis for the 18% figure is that each 35
dollar of capital investment will produce revenue requirements of $0.13 for 36
16
Direct Testimony of Reid (pp. 17-19), Illingworth (p. 7-8) and McClary (pp. 62-70) as per estimating revenue requirements and job impacts associated with capital investment and cost recovery. 17
Direct Testimony of Weil (pp. 18-19), Illingworth (p. 7), and McClary (pp. 66), as well as Goodman (pp. 18-19).

7
cost of capital, $0.04 for depreciation, and $0.01 for property taxes. 1
(Supporting Documents, p. 44, PG&E response to Aglet discovery 2
request, Q/A 34.) 3
4
Global Insight’s approach to the economic impacts of customer payments 5
to PG&E is horribly flawed. Global Insight fails to account for ratepayer 6
costs over the entire financial life of PG&E’s capital expenditures. 7
Based on the assumed depreciation cost of $0.04, the deprecation life of 8
the modeled expenditures is 25 years, not the three years in Global 9
Insight’s study period. The IMPLAN model accounts for 18% ratepayer 10
costs for three years, but in the real world ratepayers will pay 18% in the 11
first year and declining amounts for another 26 years, based on PG&E’s 12
assumed costs. Under cost of service ratemaking, ratepayers will 13
eventually pay back PG&E’s capital expenditures entirely, plus net for 14
return, income taxes and property taxes.18 15
16
Illingworth also states that the IHS Global Insight study included an 18% cost recovery 17
over the three year plan period (2011-2013), but assumes that cost recovery (and the 18
associated job and other macroeconomic losses) will actually continue at a constant 19
level over 20 years. 20
21
It is assumed that 18 percent of the capital expenditure by PG&E returns 22
back to the Company in the form of capital related revenue requirements 23
collected from customer through rates over the plan period.19 24
25
This means that at least 22 percent of the jobs and economic activity 26
induced over the three years of the proposed program will be lost over the 27
life of the investments.20 Assuming that this is twenty years, the program 28
will cause Northern California to increase jobs by an estimated 16,000 29
over the three years of the program, lose those jobs in the fourth year, and 30
lose an additional approximately 3,500 jobs every year for the remaining 31
17 years of the required payments. Similar paybacks will be required for 32
the other initially beneficial impacts reported in that study.21 33
34
I have carefully considered the findings provided in the direct testimony on behalf of 35
other intervenors. Based on my review of the IHS Global Insight study, the 18% cost 36
18
Direct Testimony of Weil (pp. 18-19). 19
[Footnote in original: PG&E-01, Appendix 2a, page 6.] 20
[Footnote in original: Calculated by dividing the 18 percent by 1 minus 18 percent.] 21
Direct Testimony of Illingworth (p. 7).

8
recovery assumption was not applied throughout the 2011-2013 study period as stated 1
by Weil and Illingworth. Instead, the IHS Global Insight study captures only the first 2
year of cost recovery, for each of the three years of investments.22 Thus, the amount of 3
cost recovery assumed in PG&E’s analysis is even lower than that indicated by Weil 4
and Illlingworth. 5
6
In terms of modeling the actual cost recovery associated with PG&E’s proposed capital 7
expenditures, Weil’s findings provide a sound basis for estimation of macroeconomic 8
impacts. Given the level of approximation inherent in estimating jobs and related 9
macroeconomic impacts, it is not necessary to estimate revenue requirements at the 10
level of precision and detail required for ratemaking.23 11
12
Still, given the importance of cost recovery in terms of both short- and long-term 13
macroeconomic impacts, the starting point for any realistic estimation of 14
macroeconomic impacts is a reasonable estimation of the cost recovery associated with 15
capital expenditures. So in this context, I have adopted Weil’s findings that PG&E’s 16
proposed capital investments be assumed to have an average depreciation life of 25 17
years, and that annual cost recovery will decline from 18% in the first year (as the 18
amount in rate base is depreciated).24 19
20
Figure 1a25 presents estimates of the annual cost recovery associated with PG&E’s 21
proposed 2011 capital spending. Gross Capital Expenditure is $2517 million,26 the 22
amount assumed in the IHS Global Insight study. Cost recovery in 2011 is $453 million, 23
based on PG&E’s assumption that first year cost recovery will be18% of gross capital 24
22
As discussed in the Direct Testimony of Goodman (p.16), there is cost recovery in 2011 for the 2011 investments, cost recovery in 2012 for the 2012 investments, and cost recovery in 2013 for the 2013 investments. But there is no cost recovery in 2012 for the 2011 investments, and no cost recovery in 2013 for the 2011 and 2012 investments. 23
Substantial effort would be required to undertake a detailed estimation regarding the lifetime rate recovery for the proposed capital expenditures. Notably, these investments include many components, with different useful lives and other aspects affecting rate recovery. Some components (notably in the distribution system) have long lives and net negative salvage value; some others (like furniture and computer hardware and software) have shorter lives and net salvage value that is positive or not substantially negative. PG&E is in the best position to undertake such detailed estimation, since the utility has ready access to the data and tools required to model the revenue requirements associated with its proposed capital expenditures. 24
As discussed in the Direct Testimony of Goodman (p. 19, footnote 29), some PG&E capital investments are assumed to have negative net salvage value, sometimes exceeding 100%. A comprehensive long-term macroeconomic analysis could include the jobs and other impacts associated with removal and end-of-life activities. But given that such activities occur far into the future, and are uncertain as to their actual costs and impacts, they need not be considered in the macroeconomic analysis being undertaken for this rebuttal testimony. 25
All Tables and Figures appear at the end of the document, starting at page 20. 26
Throughout this rebuttal testimony, all monetary data are presented in real 2011 $. The IHS Global Insight study also presented all monetary data in real 2011 $ (Ex. PG&E-1, Appendix A, pp. 4, 5, 7).

9
expenditure. Thus, the Capital Expenditure net of Cost Recovery in 2011 is $2064 1
million.27 2
3
PG&E’s macroeconomic analysis for 2011 capital spending was based solely on the 4
expenditures in 2011. And with only one year of cost recovery, Gross Capital 5
Expenditure net of Cost Recovery is in excess of $2 billion. But in fact, as shown in 6
Figure 1a, the capital spending in 2011 will result in 24 more years of cost recovery 7
(given the assumed depreciation life of 25 years). 8
9
As shown in Figure 1a, the annual cost recovery (in real 2011 $) decreases over time as 10
the amount in rate base is depreciated and due to inflation.28 But annual cost recovery 11
will still be in excess of $400 million throughout the GRC 2011 period (2011-2013). 12
Annual cost recovery will not drop below $200 million until more than halfway through 13
the 25 year depreciation life. 14
15
Figure 1b presents estimates of the Cumulative Expenditures net of Cost Recovery over 16
the depreciation life associated with PG&E’s proposed 2011 capital spending. These 17
Cumulative Expenditures are $2064 million at the end of 2011. This is the same amount 18
shown in Figure1a, calculated as Year 2011 Gross Capital Expenditure net of Year 19
2011 Cost Recovery.29 Once again, PG&E’s macroeconomic analysis for 2011 capital 20
spending was based solely on these net expenditures in 2011. 21
22
In each subsequent year, the Cumulative Net Expenditures decrease as each year of 23
cost recovery is netted out. With over $400 million of annual cost recovery throughout 24
the GRC period (2011-2013), Cumulative Net Expenditures decrease rapidly. By the 25
end of 2013, Cumulative Net Expenditures drop to about $1.2 billion. 26
27
27
Capital Expenditure net of Cost Recovery = Gross Capital Expenditure minus Cost Recovery. So in 2011, Capital Expenditure net of Cost Recovery = $2517 million - $453 million = $2064 million . 28
For simplicity, I have modeled revenue requirements based on 25-year straight-line depreciation and a 2.5% inflation rate throughout the study period. As discussed in the Direct Testimony of Goodman (pp. 18-19, footnote 28), the first year cost recovery estimated by PG&E (18% of Gross Capital Expenditure) is assumed to be a nominal carrying charge rate, so inflation is netted out by deflating the future year cost recoveries. The 18% first year cost recovery assumed by PG&E includes a 13% cost of capital. This cost of capital is assumed to be a nominal after-tax cost, and thus incorporates an inflation premium. This premium (and actual long-term inflation) may be somewhat less than 2.5%. Values in the range of 2% to 2.5% are reasonable, and actual rates could be below 2% (especially in the short-term and given the deflationary factors in US and globally). Thus, to be conservative (i.e., favorable towards PG&E’s analysis), an inflation rate of 2.5% has been assumed. To the extent that a lower inflation rate is assumed, long term real dollar cost recovery will be higher (and thus there will be greater job losses associated with this cost recovery). 29
See footnote 27.
10
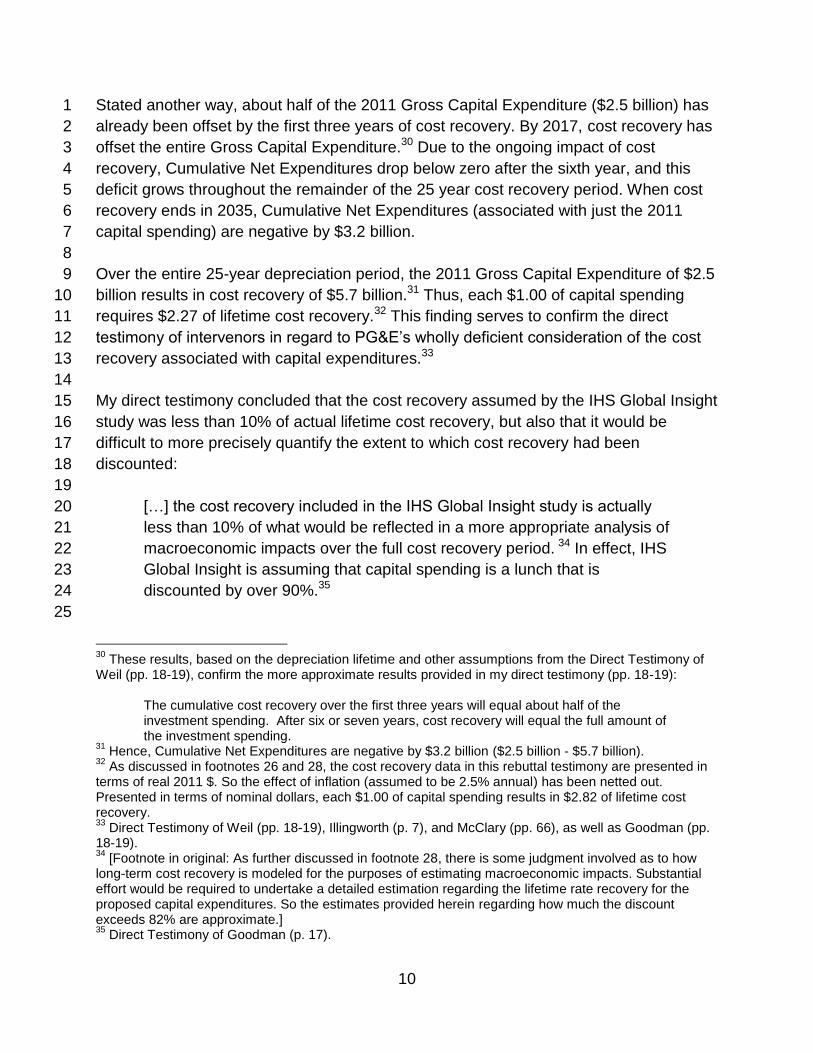
Stated another way, about half of the 2011 Gross Capital Expenditure ($2.5 billion) has 1
already been offset by the first three years of cost recovery. By 2017, cost recovery has 2
offset the entire Gross Capital Expenditure.30 Due to the ongoing impact of cost 3
recovery, Cumulative Net Expenditures drop below zero after the sixth year, and this 4
deficit grows throughout the remainder of the 25 year cost recovery period. When cost 5
recovery ends in 2035, Cumulative Net Expenditures (associated with just the 2011 6
capital spending) are negative by $3.2 billion. 7
8
Over the entire 25-year depreciation period, the 2011 Gross Capital Expenditure of $2.5 9
billion results in cost recovery of $5.7 billion.31 Thus, each $1.00 of capital spending 10
requires $2.27 of lifetime cost recovery.32 This finding serves to confirm the direct 11
testimony of intervenors in regard to PG&E’s wholly deficient consideration of the cost 12
recovery associated with capital expenditures.33 13
14
My direct testimony concluded that the cost recovery assumed by the IHS Global Insight 15
study was less than 10% of actual lifetime cost recovery, but also that it would be 16
difficult to more precisely quantify the extent to which cost recovery had been 17
discounted: 18
19
[…] the cost recovery included in the IHS Global Insight study is actually 20
less than 10% of what would be reflected in a more appropriate analysis of 21
macroeconomic impacts over the full cost recovery period. 34 In effect, IHS 22
Global Insight is assuming that capital spending is a lunch that is 23
discounted by over 90%.35 24
25
30
These results, based on the depreciation lifetime and other assumptions from the Direct Testimony of Weil (pp. 18-19), confirm the more approximate results provided in my direct testimony (pp. 18-19):
The cumulative cost recovery over the first three years will equal about half of the investment spending. After six or seven years, cost recovery will equal the full amount of the investment spending.
31 Hence, Cumulative Net Expenditures are negative by $3.2 billion ($2.5 billion - $5.7 billion).
32 As discussed in footnotes 26 and 28, the cost recovery data in this rebuttal testimony are presented in
terms of real 2011 $. So the effect of inflation (assumed to be 2.5% annual) has been netted out. Presented in terms of nominal dollars, each $1.00 of capital spending results in $2.82 of lifetime cost recovery. 33
Direct Testimony of Weil (pp. 18-19), Illingworth (p. 7), and McClary (pp. 66), as well as Goodman (pp. 18-19). 34
[Footnote in original: As further discussed in footnote 28, there is some judgment involved as to how long-term cost recovery is modeled for the purposes of estimating macroeconomic impacts. Substantial effort would be required to undertake a detailed estimation regarding the lifetime rate recovery for the proposed capital expenditures. So the estimates provided herein regarding how much the discount exceeds 82% are approximate.] 35
Direct Testimony of Goodman (p. 17).

11
Based on the depreciation lifetime and other assumptions identified by Weil,36 I can now 1
quantify that that cost recovery has been discounted by approximately 92%.37 And this 2
serves to confirm the finding in my direct testimony: 3
4
Given the level of approximation inherent in estimating jobs and related 5
macroeconomic impacts, a discount of over 90% is basically a free 6
lunch.38 7
8
Especially in a rate proceeding, it should come as no surprise that there is such sizable 9
long-term cost recovery associated with capital spending. But as noted in the direct 10
testimony of intervenors, it is surprising that PG&E submitted a macroeconomic analysis 11
that ignores the realities of utility ratemaking.39 12
13
The analysis of long-term cost recovery presented in Figures 1 and 2 provide a useful 14
framework for estimating the macroeconomic impacts associated with PG&E’s 15
proposed capital spending. But before any consideration of how expenditures translate 16
into job impacts, it is useful to first consider that PG&E’s proposed capital spending is 17
spread over the three years of the rate cycle period (2011-2013). 18
19
The pattern of annual expenditures shown in Figure 1a for the 2011 capital spending 20
will be repeated for the 2012 and 2013 capital spending. The main difference is that the 21
pattern will displaced later in time. The capital spending will occur a year (or two) later, 22
and the cost recovery will begin and end a year (or two) later than for the 2011 capital 23
spending. 24
25
Figure 2a presents estimates of the annual Gross Capital Expenditure and cost 26
recovery associated with PG&E’s proposed total 2011-2013 capital spending. Gross 27
Capital Expenditure is $2517 million in 2011, $2822 million in 2012, and $2651 million in 28
2013, the amounts assumed in the IHS Global Insight study. So over the three-year 29
period, total capital spending is approximately $8 billion. 30
31
The cost recovery shown in Figure 2a begins at $453 million in 2011, based on PG&E’s 32
assumption that first year cost recovery will be 18% of Gross Capital Expenditure. Thus, 33
36
Direct Testimony of Weil (pp. 18-19). 37
(First year cost recovery per $1 of Capital Expenditure assumed by IHS Global Insight) / (Lifetime revenue requirements per $1 of Capital Expenditure) = ($0.18 / $2.27) = 8%. 100%- 8% = 92% discount. 38
Direct Testimony of Goodman (p. 17). 39
Direct Testimony of Weil (pp. 18-19), Illingworth (p. 7), and McClary (pp. 66), as well as Goodman (pp. 15-17).

12
the Capital Expenditure net of Cost Recovery in 2011 is $2064 million, 82% of the 1
Gross Capital Expenditure in that year.40 2
3
In 2012, cost recovery rises to $936 million. This reflects the combined effect of the first 4
year of cost recovery for the 2012 capital spending, and the second year of cost 5
recovery for the 2011 capital spending.41 So while PG&E is proposing capital spending 6
of $2822 million in 2012, the Capital Expenditure net of Cost Recovery is only $1886 7
million, about 67% of the gross spending. 8
9
Cost recovery again rises in 2013, reaching $1362 million. This reflects the combined 10
effect of the first year of cost recovery for the 2013 capital spending, the second year of 11
cost recovery for the 2012 capital spending, and the third year of cost recovery for the 12
2011 capital spending. So even with PG&E’s proposed capital spending of $2651 13
million in 2013, the Capital Expenditure net of Cost Recovery is only $1289 million, less 14
than half of the gross spending. 15
16
As shown in Figure 2a, the annual cost recovery (in real 2011 $) decreases over time as 17
the amount in rate base is depreciated and due to inflation. But annual cost recovery will 18
still be in excess of $1 billion through 2018. Annual cost recovery will not drop below 19
$500 million until 2028, two thirds of the way through the 27 year period when the 2011-20
2013 capital spending is being depreciated.42 21
22
Figure 2b presents estimates of the Cumulative Expenditures net of Cost Recovery over 23
the 27 year cost recovery period life associated with PG&E’s proposed total 2011-2013 24
capital spending. These Cumulative Expenditures are $2064 million at the end of 2011. 25
This is the same amount shown in Figure 1a, calculated as Year 2011 Gross Capital 26
Expenditures net of Year 2011 Cost Recovery.43 27
28
40
The data for 2011 in Figure 2a are the same as in Figure 1a. See footnote 27. 41
First year cost recovery for the 2012 capital spending is $508 million, 18% of the $2822 million capital spending. Second year cost recovery for the 2011 capital spending is $428 million, about 17% of the 2011 capital spending. As noted earlier for a single year of capital spending, cost recovery declines over time due to depreciation and inflation. But with capital spending continuing over multiple years, cost recovery can rise over time as it reflects multiple years of capital spending. 42
As per the Direct Testimony of Weil (pp. 18-19), the depreciation period is 25 years for the capital spending in each year of the rate cycle period (2011-2013), but there will be 27 years of cost recovery for the combined three years of capital spending. According to Weil (pp. 18-19):
in the real world ratepayers will pay 18% in the first year and declining amounts for another 26 years, based on PG&E’s assumed costs.
43See footnote 27.

13
PG&E’s macroeconomic analysis for 2011-2013 capital spending included the entire $8 1
billion of spending proposed for that three-year period. But this analysis included only 2
the first year of cost recovery for each year of capital spending. So PG&E’s analysis 3
assumed only $1.4 billion in total cost recovery, 18% of the capital spending. Stated 4
another way, PG&E’s analysis assumed Cumulative Expenditures net of Cost Recovery 5
of $6.5 billion, i.e., 82% of the Gross Capital Expenditures. 6
7
But as made clear by the more realistic and coherent results described above, cost 8
recovery over the 2011-2013 period will be almost twice as high as assumed in PG&E’s 9
analysis. A cost recovery of almost $2.8 billion in the rate cycle period will offset more 10
than 34% of the proposed total Gross Capital Spending, as opposed to the simplistic 11
18% cost recovery assumed in PG&E’s analysis. So Cumulative Net Expenditures for 12
the 2011-2013 rate cycle period will be $5.2 billion, i.e., less than 66% of the Gross 13
Capital Expenditures. Even within the three year period considered in PG&E’s 14
macroeconomic analysis, cost recovery has been understated by over $1.3 billion. 15
16
In each subsequent year, the Cumulative Net Expenditures decrease as each year of 17
cost recovery is netted out. With over $1 billion of annual cost recovery through 2018, 18
Cumulative Net Expenditures decrease rapidly 19
20
Stated another way, about half of the 2011-2013 Gross Capital Expenditures ($8.0 21
billion) have already been offset by the end of 2014. By 2018, cost recovery has offset 22
the entire Gross Capital Expenditure. Due to the ongoing impact of cost recovery, 23
Cumulative Net Expenditures drop below zero only four years after the end of the rate 24
cycle period, and this deficit grows throughout the remainder of the 27-year cost 25
recovery period. When cost recovery ends in 2037, Cumulative Net Expenditures are 26
negative by $10.1 billion. 27
28
Over the entire 27-year cost recovery period, the 2011-2013 Gross Capital 29
Expenditures of $8.0 billion result in cost recovery of $18.1 billion. Thus, each $1.00 of 30
capital spending requires $2.27 of lifetime cost recovery.44 31
32
Rather than being the macroeconomic free lunch clamed in PG&E analysis, capital 33
spending is a lunch completely paid for by ratepayers, with a markup for financing costs 34
and taxes exceeding 100%. For the $8 billion in capital spending proposed by PG&E for 35
the 2011-2013 period, this markup will cost ratepayers $10 billion. So by 2018, PG&E 36
customers will have paid $8 billion in rates; they will then have to pay another $10 billon 37
44
As noted above, the same ratio between capital spending and lifetime cost recovery was found for the 2011 capital spending. As noted in footnote 32, each $1.00 of capital spending results in $2.82 of lifetime nominal dollar cost recovery.

14
over the next two decades. Even prior to any consideration of how expenditures 1
translate into job impacts, Figure 2b clearly shows that any economic stimulus provided 2
by PG&E’s proposed capital spending is small and fades very rapidly. Moreover, any 3
short-term stimulus comes at the cost of a much larger long-term drag on the service 4
area economy. 5
6
As discussed in the direct testimony of intervenors, the IHS Global Insight study uses 7
the IMPLAN input/output model to translate expenditures into impacts upon jobs and 8
other macroeconomic indicators.45 Table 1 summarizes the inputs and results that are 9
the core of the IHS Global Insight study. In particular, based on results from the 10
IMPLAN input-output model, the IHS Global Insight study assumed that $1 million in 11
PG&E capital spending would (on average) result in 7.6 person-years of employment 12
within the PG&E service area.46 Likewise, this study assumed that $1 million of cost 13
recovery would (on average) reduce employment by 7.6 person-years, i.e., would have 14
the equal and opposite effect of $1 million of capital spending. 15
16
So based on the assumptions in the IHS Global Insight study, capital spending that was 17
offset by an equal amount of cost recovery would have a net impact of exactly zero. 18
19
As demonstrated above, the IHS Global Insight study ignores virtually of the lifetime 20
cost recovery associated with the proposed capital spending. Thus the entire net 21
employment impact claimed by PG&E is based on these erroneous study assumptions. 22
As discussed above in relation to Figure 2b, even within the rate cycle period (2011-23
2013), the cost recovery in the IHS Global Insight has been understated by $1.3 billion. 24
Stated another way, PG&E’s analysis assumes away almost half of the cost recovery 25
within the rate cycle period, all of the cost recovery after 2013, and over 90% over the 26
entire cost recovery period. 27
28
In this context, the problems regarding cost recovery are clearly the biggest and most 29
important issue in terms of evaluating the IHS Global Insight study. With expenditure 30
data (specifically for cost recovery) that are so inaccurate, the overall results in terms of 31
employment impacts will be wholly unreliable, regardless of whether the other 32
45
Direct Testimony of Weil (pp. 18-19) and McClary (pp. 62-66), as well as Goodman (pp. 18-19). In effect, the IMPLAN model is used to provide coefficients (typically called multipliers) that measure the economic relationships between expenditures and employment (and other economic activity). 46
As shown in Table 1, the multipliers vary by a small amount from year to year, averaging 7.6 person-years of employment per $1 million over the 2011-2013 period. As noted in the IHS Global Insight study (Ex. PG&E-1, Appendix A, pp, 5-6), this variation in multipliers from year to year is due to variations in the mix of the proposed capital spending. Some activities are more labor-intensive (i.e., have higher multipliers) than other activities. 2012 has a greater share of activities with high multipliers, while 2013 has somewhat more low multiplier activities.

15
components of the analysis are highly accurate. Even if the multipliers (i.e., the 1
translation between expenditures and employment) provide a good measure of the real-2
world economic relationships, the resulting employment estimates will still depend upon 3
the quality of the expenditure data. 4
5
On the other hand, if both the expenditure data and the multipliers are substantially 6
flawed, then the employment estimates will be of even lower quality. So in preparing my 7
direct testimony, I did undertake a limited review of the input-output modeling in the IHS 8
Global Insight study. This review gave rise to various concerns as to the quality of the 9
data, assumptions, and methodology utilized by IHS Global Insight.47 Moreover, as also 10
noted by McClary, review of the Global Insight study is highly constrained owing to the 11
very limited documentation that has been made available.48 12
13
Nonetheless, I did not in my direct testimony provide an extensive discussion of the IHS 14
Global Insight study’s input-output modeling or multiplier data. Put simply, based on a 15
limited review, the problems in these other aspects of the study are relatively less 16
substantial in comparison with the severe problems relating to the expenditure data for 17
cost recovery. Pending more reliable expenditure data, it was less relevant to fine tune 18
the multiplier data. 19
20
But with the data developed and presented in Figures 1 and 2, it is now feasible to 21
present meaningful employment estimates based on reliable expenditure data. As a 22
starting point, and to benchmark the results of the IHS Global Insight study, I have 23
applied the multipliers from that study (as presented in Table 1) to translate the 24
expenditure data into employment estimates. 25
26
The results are presented in Figures 3a, 3b, 4a, and 4b. The pattern of these results is 27
just what would be expected based on the expenditure data in Figures 1 and 2. 28
Basically, the expenditure data in Figures 1 and 2 are being translated into employment, 29
at the conversion rate determined by the multipliers (e.g., 7.7 person-years of 30
employment per $1 million for 2011 capital expenditures). So the $2517 million of Gross 31
Capital Expenditures in 2011 (Figure 1a) becomes the 19,377 job-years in Figure 3a. 32
33
Thus, the patterns and trends discussed in relation to the expenditure data in Figures 1 34
and 2 are now patterns and trends visible in the employment data in Figures 3 and 4. 35 47
I did not find it problematic that IHS Global Insight selected the IMPLAN model for this study, since I have made extensive use of this model in my own energy sector studies. Rather it appeared that IHS Global Insight may have been unduly approximate in allocating expenditures to the appropriate IMPLAN model sectors. As noted in the IHS Global Insight study (Ex. PG&E-1, Appendix A, pp, 5-6), this allocation can significantly affect the results in terms of employment and other impacts. 48
Direct Testimony of McClary (pp. 62-64) and Goodman (p. 15).

16
For brevity, I will not repeat what has already been detailed above. Suffice it to say that 1
Figures 3 and 4 clearly demonstrate that any economic stimulus (job creation) provided 2
by PG&E’s proposed capital spending is small and fades very rapidly due to the 3
employment losses due to cost recovery. Moreover, any short-term stimulus comes at 4
the cost of a much larger long-term drag on the service area economy. 5
6
As noted above, there are concerns as to the accuracy of the IHS Global Insight study 7
multipliers. In the direct testimony of McClary and other intervenors, there was particular 8
concern as to how the IHS Global Insight study translated cost recovery into 9
employment.49 Basically, this study just assumed that cost recovery (and thus spending 10
by PG&E customers) has the same multiplier as would spending on PG&E capital 11
investments. 12
13
Based on my review and expertise in this type of analysis, my preliminary conclusion for 14
purposes of this rebuttal testimony is that the multiplier assumed by IHS Global Insight 15
for Gross Capital Expenditures (7.32 to 7.70 person-years of employment per $1 million, 16
as shown in Table 1) is reasonable, although possibly on the high side. 17
18
But I agree with the concerns (notably those expressed by McClary) about the multiplier 19
assumed by IHS Global Insight for cost recovery.50 Based on expertise in this type of 20
analysis, changes in utility customer energy costs (higher or lower bills) are typically 21
modeled as a mix of spending by residential and commercial/industrial customers. 22
Spending by residential customers typically has higher multipliers than utility capital 23
investment; household expenditures generally have a sizable component of localized 24
spending and labor-intensive services such as restaurants. 25
26
There is a wider range of assumptions and methodologies used to model the impacts of 27
spending by commercial and industrial customers. Suffice it say here that changes in 28
utility bills for commercial and industrial customers are likely to have multipliers at least 29
as high as those for utility capital spending. 30
31
So to summarize, the cost recovery multiplier assumed by IHS Global Insight is 32
significantly below that typically assumed for residential customers, and it may also be 33
on the low side for other (commercial/industrial) customers. 34
35
Thus, to really get a handle on this issue, it would be necessary to consider how the 36
cost recovery associated with the proposed capital spending will be allocated by 37
49
Direct Testimony of Illingworth (pp. 7-8), and McClary (pp. 65-70). 50
Direct Testimony of McClary (pp. 65-70).

17
customer class. Perhaps needless to say, the very simplistic modeling of cost recovery 1
in the IHS Global Insight does not provide any information on this important issue. 2
3
As discussed in my direct testimony, PG&E’s proposed capital expenditures include a 4
large component of distribution system activities. Compared to commercial and 5
industrial customers, residential and small commercial customers are smaller, more 6
dispersed, and may be allocated a sizable portion of distribution system costs. So if 7
anything, compared with overall revenue requirements, the capital spending proposed 8
by PG&E for the GRC 2011 rate cycle (2011-2013) may result in a cost recovery more 9
weighted towards residential and small commercial. 10
11
For the proposed capital spending, a sizable portion of the overall cost recovery 12
(perhaps on the order of half) may be borne by residential (and small commercial) 13
customers. Such cost recovery is likely to have a multiplier substantially greater than 14
that assumed for utility capital spending. Therefore, it is definitely warranted to apply a 15
higher multiplier for cost recovery than for utility capital spending. 16
17
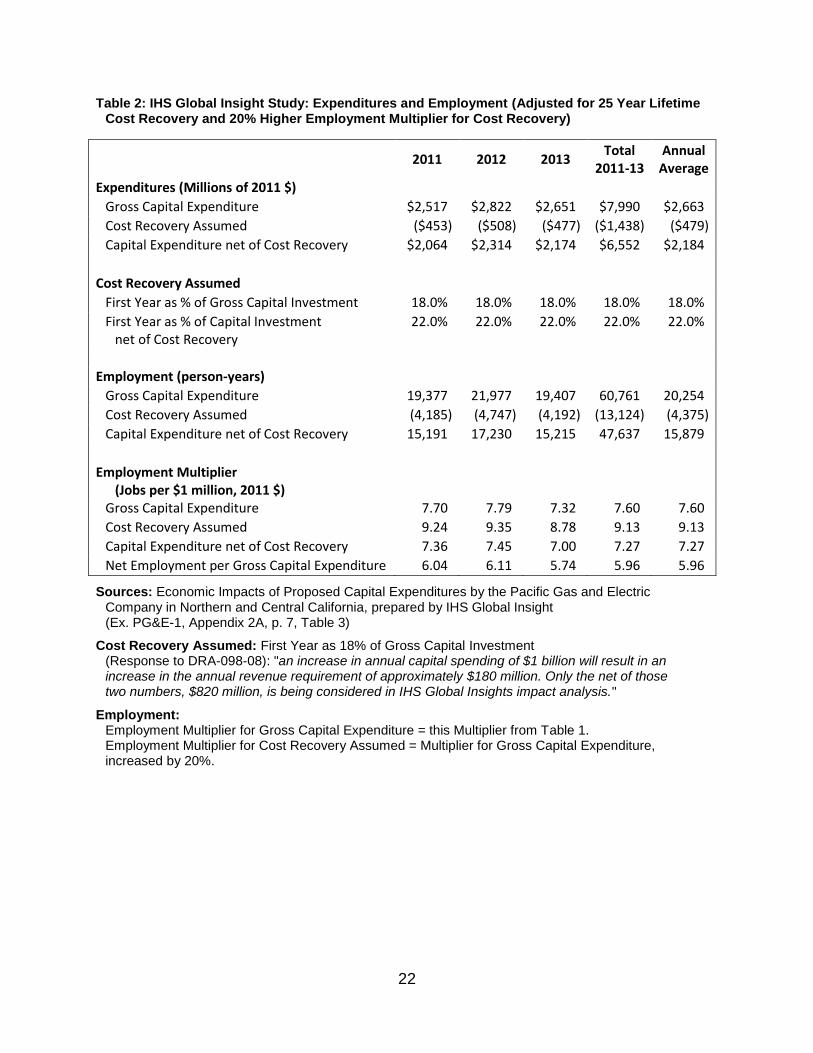
In order to explore this important issue, I have undertaken an alternative employment 18
analysis incorporating a higher multiplier for cost recovery. Table 2 presents my 19
adjusted assumptions. For the purposes of this rebuttal testimony, I have assumed that 20
the cost recovery multiplier is 20% higher than that estimated by IHS Global Insight for 21
utility capital spending. Thus, the cost recovery multiplier in Table 2 averages 9.13 22
person-years of employment per $ 1 million (with a range from 8.78 to 9.24). 23
24
Figures 5 and 6 present employment estimates based on the multipliers in Table 2 and 25
the expenditure data in Figures 1 and 2. By comparison, the employment estimates in 26
Figures 3 and 4 were based on the multipliers in Table 1 and the expenditure data in 27
Figure 1 and 2. 28
29
The results presented in Figure 5a are broadly similar to those in Figure 3a. But there 30
are some noticeable differences. Basically, the employment losses associated with cost 31
recovery are now 20% greater than in Figure 3a, while the employment from the Gross 32
Capital Expenditures is unchanged. 33
34
The impact of these differences is more apparent in Figure 5b. 35
36
Compared with Figure 3b, Cumulative Employment in Figure 5b falls more sharply. It 37
drops by about half in the first two years, and is barely above zero after four years. It 38
then falls below zero and the long-term losses dwarf the several years of modest job 39
gains during the GRC rate cycle period (2011-2013). 40

18
1
Figure 6 considers the full three years of proposed capital spending, as well as a more 2
realistic multiplier for cost recovery. As such, it is my recommended base case for 3
estimating the employment impacts associated with PG&E’s proposed capital spending. 4
And this figure makes it very clear that there is no effective economic stimulus provided 5
by this proposed capital spending. 6
7
The proposed $8 billion in capital expenditures results in a Cumulative Net Employment 8
of about 35,000 person-years at the end of the rate cycle period (vs. PG&E’s claim of 9
about 50,000 person-years). But with over $1 Billion of annual cost recovery, there are 10
annual job losses of over 10,000 person-years. Thus, Cumulative Net Employment has 11
dropped to near zero by the end of 2016. After that, annual job losses exceed 5,000 12
person-years until 2027. By the end of the cost recovery period, the Cumulative Net 13
Employment shows a loss of over 100,000 person-years. 14
15
Put simply, the proposed capital spending yields only a very small and very short-term 16
boost. And this small benefit comes at a huge long-term cost and job loss. This is not an 17
effective strategy to promote service area economic development. Rather, it is a 18
strategy that actually results in a substantial long-term drag on the service area 19
economy. 20
Figure 7 summarizes the results of my analysis of the employment impacts associated 21
with PG&E’s proposed capital spending. In particular, it compares three estimates of 22
Cumulative Net Employment: 23
1) The IHS Global Insight study, with cost recovery in the first year only for each 24
year of capital investment, as summarized in Table 1; 25
2) The results with the IHS study assumptions adjusted to incorporate a realistic 26
lifetime cost recovery based on a 25 year depreciation period, as summarized in 27
Figure 4b; 28
3) The results with the IHS study assumptions adjusted to incorporate both a 29
realistic lifetime cost recovery based on a 25 year depreciation period, and a 30
20% higher Employment Multiplier for Cost Recovery, as presented in Figure 6b. 31
Figure 7 emphasizes the extent to which the IHS Global Insight study is selective, 32
simplistic, and potentially misleading. This study asserts that employment will grow 33
steadily throughout during the three year rate cycle period, reaching a peak of almost 34
50,000 job-years in 2013. Its results end in 2013, so it provides absolutely no 35
information about long-term impacts. 36
With the study adjusted for a realistic lifetime cost recovery, a very different picture 37
emerges. Employment grows more slowly during the rate cycle period and peaks at only 38

19
40,000 job-years, not the 50,000 claimed by the IHS Global Insight study. This 1
difference of 10,000 job-years reflects that the IHS Global Insight study failed to 2
consider half of the cost recovery that would actually occur during the rate cycle period. 3
The long-term impacts of this cost recovery were completely ignored in the IHS Global 4
Insight study, but they will result in huge long-term jobs losses. As shown in Figure 7, 5
with a realistic modeling of lifetime cost recovery, all of the short-term job gains have 6
been offset by 2018, and the Cumulative job losses grow to over 75,000 person-years 7
by the end of the cost recovery period in 2037. 8
And an even less favorable picture emerges when the study results are adjusted to 9
incorporate both a realistic lifetime cost recovery, and a 20% higher Employment 10
Multiplier for Cost Recovery. Employment grows even more slowly during the rate 11
cycle period and peaks at only 35,000 job-years, not the 50,000 claimed by the IHS 12
Global Insight study. This difference of 15,000 job-years both full cost recovery over the 13
rate cycle period and a more realistic estimate of the job losses associated with each 14
dollar of cost recovery. 15
After 2013, even these modest short term gains prove to be very transitory. With a 16
realistic estimate of the jobs losses from cost recovery (reflecting better assumptions 17
about both the dollars and jobs per dollar), Cumulative Employment is barely positive in 18
2016. And after that, the job losses grow steadily and rapidly, reaching over 100,000 by 19
the end of 2037. 20
21

20
TABLES & FIGURES
Table 1: IHS Global Insight Study: Expenditures and Employment (Cost Recovery
First Year Only as 18% of Gross Capital Investment) ........................................ 21
Table 2: IHS Global Insight Study: Expenditures and Employment (Adjusted for 25
Year Lifetime Cost Recovery and 20% Higher Employment Multiplier for Cost
Recovery) ........................................................................................................... 22
Figure 1: 2011 Capital Expenditures (Annual and Cumulative Expenditures) Study
Adjusted (25 Year Lifetime Cost Recovery) ........................................................ 23
Figure 2: Total 2011-2013 Capital Expenditures (Annual and Cumulative
Expenditures) Study Adjusted (25 Year Lifetime Cost Recovery)....................... 24
Figure 3: 2011 Capital Expenditures (Annual and Cumulative Employment) Study
Adjusted (25 Year Lifetime Cost Recovery) ........................................................ 25
Figure 4: Total 2011-2013 Capital Expenditures (Annual and Cumulative
Employment) Study Adjusted (25 Year Lifetime Cost Recovery) ....................... 26
Figure 5: 2011 Capital Expenditures (Annual and Cumulative Employment) Study
Adjusted (25 Year Lifetime Cost Recovery and 20% Higher Employment
Multiplier for Cost Recovery) .............................................................................. 27
Figure 6: Total 2011-2013 Capital Expenditures (Annual and Cumulative
Employment) Study Adjusted (25 Year Lifetime Cost Recovery and 20%
Higher Employment Multiplier for Cost Recovery) .............................................. 28
Figure 7: Comparison of Estimates (Cumulative Employment) ..................................... 29

21
Table 1: IHS Global Insight Study: Expenditures and Employment (Cost Recovery First Year Only as 18% of Gross Capital Investment)
2011 2012 2013
Total 2011-13
Annual Average
Expenditures (Millions of 2011 $)
Gross Capital Expenditure $2,517) $2,822) $2,651) $7,990) $2,663)
Cost Recovery Assumed ($453) ($508) ($477) ($1,438) ($479)
Capital Expenditure net of Cost Recovery $2,064) $2,314) $2,174) $6,552) $2,184)
Cost Recovery Assumed
First Year as % of Gross Capital Investment 18.0%) 18.0%) 18.0%) 18.0%) 18.0%)
First Year as % of Capital Investment net of Cost Recovery
22.0%) 22.0%) 22.0%) 22.0%) 22.0%)
Employment (person-years)
Gross Capital Expenditure 19,377) 21,977) 19,407) 60,761) 20,254)
Cost Recovery Assumed (3,488) (3,956) (3,493) (10,937) (3,646)
Capital Expenditure net of Cost Recovery 15,889) 18,021) 15,914) 49,824) 16,608)
Employment Multiplier (Jobs per $1 million, 2011 $)
Gross Capital Expenditure 7.70) 7.79) 7.32) 7.60) 7.60)
Cost Recovery Assumed 7.70) 7.79) 7.32) 7.60) 7.60)
Capital Expenditure net of Cost Recovery 7.70) 7.79) 7.32) 7.60) 7.60)
Net Employment per Gross Capital Expenditure 6.31) 6.39) 6.00) 6.24) 6.24)
Sources: Economic Impacts of Proposed Capital Expenditures by the Pacific Gas and Electric Company in Northern and Central California, prepared by IHS Global Insight (Ex. PG&E-1, Appendix 2A, p. 7, Table 3)
Cost Recovery Assumed: First Year as 18% of Gross Capital Investment (Response to DRA-098-08): "an increase in annual capital spending of $1 billion will result in an increase in the annual revenue requirement of approximately $180 million. Only the net of those two numbers, $820 million, is being considered in IHS Global Insights impact analysis."
22
Table 2: IHS Global Insight Study: Expenditures and Employment (Adjusted for 25 Year Lifetime Cost Recovery and 20% Higher Employment Multiplier for Cost Recovery)
2011 2012 2013
Total 2011-13
Annual Average
Expenditures (Millions of 2011 $)
Gross Capital Expenditure $2,517) $2,822) $2,651) $7,990) $2,663)
Cost Recovery Assumed ($453) ($508) ($477) ($1,438) ($479)
Capital Expenditure net of Cost Recovery $2,064) $2,314) $2,174) $6,552) $2,184)
Cost Recovery Assumed
First Year as % of Gross Capital Investment 18.0%) 18.0%) 18.0%) 18.0%) 18.0%)
First Year as % of Capital Investment net of Cost Recovery
22.0%) 22.0%) 22.0%) 22.0%) 22.0%)
Employment (person-years)
Gross Capital Expenditure 19,377) 21,977) 19,407) 60,761) 20,254)
Cost Recovery Assumed (4,185) (4,747) (4,192) (13,124) (4,375)
Capital Expenditure net of Cost Recovery 15,191) 17,230) 15,215) 47,637) 15,879)
Employment Multiplier (Jobs per $1 million, 2011 $)
Gross Capital Expenditure 7.70) 7.79) 7.32) 7.60) 7.60)
Cost Recovery Assumed 9.24) 9.35) 8.78) 9.13) 9.13)
Capital Expenditure net of Cost Recovery 7.36) 7.45) 7.00) 7.27) 7.27)
Net Employment per Gross Capital Expenditure 6.04) 6.11) 5.74) 5.96) 5.96)
Sources: Economic Impacts of Proposed Capital Expenditures by the Pacific Gas and Electric Company in Northern and Central California, prepared by IHS Global Insight (Ex. PG&E-1, Appendix 2A, p. 7, Table 3)
Cost Recovery Assumed: First Year as 18% of Gross Capital Investment (Response to DRA-098-08): "an increase in annual capital spending of $1 billion will result in an increase in the annual revenue requirement of approximately $180 million. Only the net of those two numbers, $820 million, is being considered in IHS Global Insights impact analysis."
Employment: Employment Multiplier for Gross Capital Expenditure = this Multiplier from Table 1. Employment Multiplier for Cost Recovery Assumed = Multiplier for Gross Capital Expenditure, increased by 20%.

23
Figure 1: 2011 Capital Expenditures (Annual and Cumulative Expenditures) Study Adjusted (25 Year Lifetime Cost Recovery)
($1,000)
($500)
$0
$500
$1,000
$1,500
$2,000
$2,500
$3,000
20
11
20
12
20
13
20
14
20
15
20
16
20
17
20
18
20
19
20
20
20
21
20
22
20
23
20
24
20
25
20
26
20
27
20
28
20
29
20
30
20
31
20
32
20
33
20
34
20
35
Exp
en
dit
ure
s (M
illio
ns
of 2
01
1 $
)
Year
Figure 1a: Annual Expenditures
Gross Capital Expenditure ($2517 Million)
Capital Expenditure net of Cost Recovery
Cost Recovery
($4,000)
($3,000)
($2,000)
($1,000)
$0
$1,000
$2,000
$3,000
20
11
20
12
20
13
20
14
20
15
20
16
20
17
20
18
20
19
20
20
20
21
20
22
20
23
20
24
20
25
20
26
20
27
20
28
20
29
20
30
20
31
20
32
20
33
20
34
20
35
Exp
en
dit
ure
s (M
illio
ns
of 2
01
1 $
)
Year
Figure 1b: Cumulative Expenditures net of Cost Recovery

24
Figure 2: Total 2011-2013 Capital Expenditures (Annual and Cumulative Expenditures) Study Adjusted (25 Year Lifetime Cost Recovery)
($2,000)
($1,500)
($1,000)
($500)
$0
$500
$1,000
$1,500
$2,000
$2,500
$3,000
$3,500
20
11
20
12
20
13
20
14
20
15
20
16
20
17
20
18
20
19
20
20
20
21
20
22
20
23
20
24
20
25
20
26
20
27
20
28
20
29
20
30
20
31
20
32
20
33
20
34
20
35
20
36
20
37
Exp
en
dit
ure
s (M
illio
ns
of 2
01
1 $
)
Year
Figure 2a: Annual Expenditures
Gross Capital Expenditure (2011: $2517 M; 2012: $2822 M; 2013: $2651 M)
Capital Expenditure net of Cost Recovery
Cost Recovery
($12,000)
($10,000)
($8,000)
($6,000)
($4,000)
($2,000)
$0
$2,000
$4,000
$6,000
$8,000
20
11
20
12
20
13
20
14
20
15
20
16
20
17
20
18
20
19
20
20
20
21
20
22
20
23
20
24
20
25
20
26
20
27
20
28
20
29
20
30
20
31
20
32
20
33
20
34
20
35
20
36
20
37
Exp
en
dit
ure
s (M
illio
ns
of 2
01
1 $
)
Year
Figure 2b: Cumulative Expenditures net of Cost Recovery

25
Figure 3: 2011 Capital Expenditures (Annual and Cumulative Employment) Study Adjusted (25 Year Lifetime Cost Recovery)
(5,000)
0
5,000
10,000
15,000
20,000
25,000
20
11
20
12
20
13
20
14
20
15
20
16
20
17
20
18
20
19
20
20
20
21
20
22
20
23
20
24
20
25
20
26
20
27
20
28
20
29
20
30
20
31
20
32
20
33
20
34
20
35
Tota
l Em
plo
yme
nt
(pe
rso
n-y
ear
s)
Year
Figure 3a: Annual Employment
Gross Capital Expenditure (19,377 Job-Years)
Capital Expenditure net of Cost Recovery
Cost Recovery
(30,000)
(25,000)
(20,000)
(15,000)
(10,000)
(5,000)
0
5,000
10,000
15,000
20,000
20
11
20
12
20
13
20
14
20
15
20
16
20
17
20
18
20
19
20
20
20
21
20
22
20
23
20
24
20
25
20
26
20
27
20
28
20
29
20
30
20
31
20
32
20
33
20
34
20
35
Tota
l Em
plo
yme
nt
(pe
rso
n-y
ear
s)
Year
Figure 3b: Cumulative Employment

26
Figure 4: Total 2011-2013 Capital Expenditures (Annual and Cumulative Employment) Study Adjusted (25 Year Lifetime Cost Recovery)
(15,000)
(10,000)
(5,000)
0
5,000
10,000
15,000
20,000
25,000
20
11
20
12
20
13
20
14
20
15
20
16
20
17
20
18
20
19
20
20
20
21
20
22
20
23
20
24
20
25
20
26
20
27
20
28
20
29
20
30
20
31
20
32
20
33
20
34
20
35
20
36
20
37
Tota
l Em
plo
yme
nt
(pe
rso
n-y
ear
s)
Year
Figure 4a: Annual Employment
Gross Capital Expenditure (job-years for 2011: 19,377; for 2012: 21,977; for 2013: 19,407)
Capital Expenditure net of Cost Recovery
Cost Recovery
(100,000)
(80,000)
(60,000)
(40,000)
(20,000)
0
20,000
40,000
60,000
20
11
20
12
20
13
20
14
20
15
20
16
20
17
20
18
20
19
20
20
20
21
20
22
20
23
20
24
20
25
20
26
20
27
20
28
20
29
20
30
20
31
20
32
20
33
20
34
20
35
20
36
20
37
Tota
l Em
plo
yme
nt
(pe
rso
n-y
ear
s)
Year
Figure 4b: Cumulative Employment

27
Figure 5: 2011 Capital Expenditures (Annual and Cumulative Employment) Study Adjusted (25 Year Lifetime Cost Recovery and 20% Higher Employment Multiplier for Cost Recovery)
(10,000)
(5,000)
0
5,000
10,000
15,000
20,000
25,000 2
01
1
20
12
20
13
20
14
20
15
20
16
20
17
20
18
20
19
20
20
20
21
20
22
20
23
20
24
20
25
20
26
20
27
20
28
20
29
20
30
20
31
20
32
20
33
20
34
20
35
Tota
l Em
plo
yme
nt
(pe
rso
n-y
ear
s)
Year
Figure 5a: Annual Employment
Gross Capital Expenditure (19,377 Job-Years)
Capital Expenditure net of Cost Recovery
Cost Recovery
(40,000)
(30,000)
(20,000)
(10,000)
0
10,000
20,000
20
11
20
12
20
13
20
14
20
15
20
16
20
17
20
18
20
19
20
20
20
21
20
22
20
23
20
24
20
25
20
26
20
27
20
28
20
29
20
30
20
31
20
32
20
33
20
34
20
35
Tota
l Em
plo
yme
nt
(pe
rso
n-y
ear
s)
Year
Figure 5b: Cumulative Employment

28
Figure 6: Total 2011-2013 Capital Expenditures (Annual and Cumulative Employment) Study Adjusted (25 Year Lifetime Cost Recovery and 20% Higher Employment Multiplier for Cost Recovery)
(15,000)
(10,000)
(5,000)
0
5,000
10,000
15,000
20,000
25,000 2
01
1
20
12
20
13
20
14
20
15
20
16
20
17
20
18
20
19
20
20
20
21
20
22
20
23
20
24
20
25
20
26
20
27
20
28
20
29
20
30
20
31
20
32
20
33
20
34
20
35
20
36
20
37
Tota
l Em
plo
yme
nt
(pe
rso
n-y
ear
s)
Year
Figure 6a: Annual Employment
Gross Capital Expenditure (job-years for 2011: 19,377; for 2012: 21,977; for 2013: 19,407)
Capital Expenditure net of Cost Recovery
Cost Recovery
(120,000)
(100,000)
(80,000)
(60,000)
(40,000)
(20,000)
0
20,000
40,000
60,000
20
11
20
12
20
13
20
14
20
15
20
16
20
17
20
18
20
19
20
20
20
21
20
22
20
23
20
24
20
25
20
26
20
27
20
28
20
29
20
30
20
31
20
32
20
33
20
34
20
35
20
36
20
37
Tota
l Em
plo
yme
nt
(pe
rso
n-y
ear
s)
Year
Figure 6b: Cumulative Employment

29
Figure 7: Comparison of Estimates (Cumulative Employment)
(120,000)
(100,000)
(80,000)
(60,000)
(40,000)
(20,000)
0
20,000
40,000
60,000
20
11
20
12
20
13
20
14
20
15
20
16
20
17
20
18
20
19
20
20
20
21
20
22
20
23
20
24
20
25
20
26
20
27
20
28
20
29
20
30
20
31
20
32
20
33
20
34
20
35
20
36
20
37
Tota
l Em
plo
yme
nt
(pe
rso
n-y
ear
s)
Year
Comparison of Estimates (Cumulative Employment)
IHS Global Insight Study (Cost Recovery First Year Only as 18% of Gross Capital Investment)
Study Adjusted (Lifetime Cost Recovery: 18% in First Year, 25 Year Depreciation, net of 2.5% Annual Inflation)
Study Adjusted (Lifetime Cost Recovery and 20% Higher Employment Multiplier for Cost Recovery)