preparing for high-impact, low-probability events: lessons from eyjafjallajökull
DESCRIPTION
Bernice Lee and Felix Preston, with Gemma Green A Chatham House Report January 2012TRANSCRIPT
Chatham House, 10 St James’s Square, London SW1Y 4LET: +44 (0)20 7957 5700 E: [email protected]: +44 (0)20 7957 5710 www.chathamhouse.org
Charity Registration Number: 208223
www.chathamhouse.org
Preparing for H
igh-impact, Low
-probability Events: Lessons from
Eyjafjallajökull
Bernice Lee and Felix P
reston, with G
emm
a Green
Preparing for High-impact, Low-probability Events
Lessons from Eyjafjallajökull A Chatham House Report
Bernice Lee and Felix Preston, with Gemma Green
0325387818629
ISBN 9781862032538
www.chathamhouse.org
Preparing for High-impact, Low-probability Events
Lessons from Eyjafjallajökull
Bernice Lee and Felix Preston, with Gemma Green
A Chatham House Report
January 2012

www.chathamhouse.org
ii
© The Royal Institute of International Affairs, 2012
Chatham House (The Royal Institute of International Affairs) in London promotes the rigorous study of international questions and is independent of government and other vested interests. It is precluded by its Charter from having an institutional view. The opinions expressed in this publication are the responsibility of the authors.
All rights reserved. No part of this publication may be reproduced or transmitted in any form or by any means, electronic or mechanical including photocopying, recording or any information storage or retrieval system, without the prior written permission of the copyright holder. Please direct all enquiries to the publishers.
The Royal Institute of International AffairsChatham House10 St James’s SquareLondon SW1Y 4LET: +44 (0) 20 7957 5700F: + 44 (0) 20 7957 5710www.chathamhouse.org
Charity Registration No. 208223
ISBN 978 1 86203 253 8
A catalogue record for this title is available from the British Library.
Designed and typeset by Soapbox, www.soapbox.co.uk
Printed and bound in Great Britain by Latimer Trend and Co Ltd The material selected for the printing of this report is Elemental Chlorine Free and has been sourced from sustainable forests. It has been manufactured by an ISO 14001 certified mill under EMAS.
Chatham House has been the home of the Royal Institute of International Affairs for ninety years. Our mission is to be a world-leading source of independent analysis, informed debate and influential ideas on how to build a prosperous and secure world for all.

www.chathamhouse.org
iii
Contents
About the Authors v Acknowledgments vi Executive Summary and Recommendations vii
1 Introduction 1 1.1 Spotlight on systemic resilience 1 1.2 Questions and dilemmas 3 1.3 Preparing for high-impact, low-probability events 4 1.4 Outline of the report 5
2 Mapping Economic Impacts and the Role of Business Resilience 7 2.1 How shocks cascade through the global ecomony 7 2.2 The vulnerability of manufacturing industries 9 2.3 The consequences of a prolonged disruption 11 2.4 Uneven impacts across regions and society 13 2.5 The importance of business resilience 15
3 The Contest over Science, Certainty and Legitimacy 17 3.1 Scientific uncertainty in high-impact, low-probability events 17 3.2 Understanding risk and decision-making during crises 18 3.3 Competing stakeholder interests 21
4 The Battle for the Airwaves 23 4.1 Crisis management in the age of social media 24 4.2 Lessons for stakeholders 25 5 Conclusions and Policy Implications 29 Strengthening processes and transparency 29 Stepping up communications in a crisis 29 Enhancing business resilience and responses to shocks 30
www.chathamhouse.org
iv
Appendices Appendix 1: Acronyms 32 Appendix 2: Methodology 33 Appendix 3: Chatham House Survey – Questions and Responses 35 Appendix 4: Measuring the Economic Costs of a High-impact Event: the Stylized GDP Model 37 Appendix 5: Agencies and Institutions Involved in an Ash-cloud Crisis (Selected Countries) and Decision-making Linkages during the Ash-cloud Event 39 Appendix 6: National Approaches to Decision-making during the Ash-cloud Event 44

www.chathamhouse.org
v
About the Authors
Bernice Lee OBE is Research Director, Energy, Environment and Resource Governance at Chatham House
Felix Preston is Research Fellow, Energy, Environment and Resource Governance at Chatham House.
Gemma Green is Programme Manager, Energy, Environment and Resource Governance at Chatham House.
Contributing Authors
Rob Bailey (Chatham House)Suw Charman-Anderson (Independent consultant)Charles Emmerson (Chatham House)Antony Froggatt (Chatham House)Sarah Helm (Cambridge IP)Ilian Iliev (Cambridge IP)William Jackson (Chatham House)Cleo Paskal (Chatham House)Vanessa Rossi (Chatham House)

www.chathamhouse.org
vi
Acknowledgments
The authors would like to thank the contributing authors for their substantial input into the report, particularly Vanessa Rossi and William Jackson for their work on the economic consequences of high-impact events, and Suw Charman-Anderson and Ilian Iliev and the team at Cambridge IP for their extensive analysis of media and communication during a crisis. James Norman supported the team with data analysis and designed many of the diagrams and tables in the report. Cleo Paskal, Rob Bailey, Charles Emmerson, Antony Froggatt, Jens Hein, John Mitchell, Estelle Rouhaud, Elizabeth Stevens, Grant Rudgley, David Heymann and Sudeep Chand at Chatham House all provided valuable input to the drafts, and we are also grateful to Nick Mabey, Shane Tomlinson, Jonathan Haslam and Sam Hardy for their comments. Specials thanks to the team at Skoll for providing guidance and critical feedback. The authors would also like to thank the companies and organizations that participated in inter-views and completed the survey. Thanks also to Margaret May and Nicolas Bouchet for copy-editing the report and overseeing the production process at Chatham House.This study was conducted with funding received from the Skoll Global Threats Fund.
BL, FP, GG

www.chathamhouse.org
vii
ExecutiveSummary and Recommendations
The frequency of ‘high-impact, low-probability’ (HILP) events in the last decade signals the emergence of a new ‘normal’. Apparent one-off high-profile crises such as 9/11, Hurricane Katrina, the Macondo oil spill and the Japanese earthquake and tsunami were all mega-disasters requiring rapid responses at a global level, marking the beginning of a crisis trend. But lower-profile, persistent events such as flooding, droughts and cyclones have been shown to have equally serious impacts, raising new questions about the way in which we perceive risk and prepare for disruptive events.
These events can manifest themselves not only as ‘black swans’ – which by nature are impossible to predict – but also as known hazards such as floods, hurricanes or earthquakes, which, owing to the low likelihood of occurrence or the high cost of mitigating action, remain un- or under-prepared for. There are also crises such as pandemics which typically unfold over weeks, months or a few years, for which the scope or timing remains unknown even with preparations. Events such as the 2011 drought and subsequent food crisis in East Africa have also raised troubling questions about the way in which the interna-tional community responds to ‘slow-motion’ disasters which build up over several or many years.
The globalization of production and optimization of supply chains have increased systemic efficiencies in the global economy but have exacerbated the speed and scope of contagion in the event of shocks. They pose particular threats to key industries – especially high-value manufacturing –
and to the just-in-time business model. The consequences of HILP events spread rapidly across sectors and borders, often with second- or third-order impacts that are hard or impos-sible to predict. The 2003 SARS outbreak, for example, cost businesses $60 billion, about 2 per cent of East Asian GDP. The devastating earthquake in March 2011 may have lost Japan 10 per cent of its capital stock – equivalent to around 20 per cent of the country's GDP – with wider knock-on impacts for global companies such as Toyota and Sony, which were forced to halt production.
In an increasingly connected global economy and society more people are (and will continue to be) affected by shocks, irrespective of whether ‘high-impact events’ are actually becoming more frequent or not. To explore our preparedness for HILP events in this context, Chatham House has examined the ash cloud that spread across Europe in April 2010 to draw lessons for other HILP events. In particular the analysis considered the nature of decision-making and coordination before, during and after the ash cloud; the impact of scientific uncertainty; the economic consequences and the role of communications.
A complex risk environment
Despite considerable efforts to improve scientific under-standing and reform risk management approaches, governments and businesses remain insufficiently prepared to confront HILP crises and effectively manage their economic, social, political and humanitarian consequences.
Current contingency planning often assumes the return of the status quo ante after a crisis. But this approach may be inadequate in a world of complex economic and social risks, especially when combined with slow-motion crises like climate change and water scarcity. Slow-motion crises such as these build over many years, but are likely to result in a higher frequency and greater severity of shocks. Often there are several steps between an event ‘trigger’ and the social consequences that result.
National risk management structures – based on classifying events by tiered levels of threat and imple-menting specific contingency measures – may therefore need to be reconsidered. Instead, senior leaders and
www.chathamhouse.org
Preparing for High-impact, Low-probability Events: Lessons from Eyjafjallajökull
viii
decision-makers will need to develop and roll out overarching strategies which consider the full range of preparedness and response capacities, and establish clear frameworks for crisis decision-making.
Risk matrixes which categorize risks by common conse-quences that require a generic response (such as earth-quakes or floods) and those that require a more specific response (such as pandemics) can provide a more useful framework for decision-making. This approach has its own limitations; it may not always capture interrelated risks (that flooding could lead to foot and mouth disease for example). But building generic institutional capacity to plan and respond to any type of event will create a broader platform to ensure greater preparedness overall.
Beyond certain thresholds governments are the responders of last resort – they are often expected to step in and take charge of emergency responses during major crises. However, sectoral responses are also critical, especially where crises involve major engineering challenges or have highly technical dimensions. This is the case, for example, in the rapid production of vaccines or in technology failures like the Macondo oil spill and Fukushima meltdowns.
Speed and scope of economic contagion
Instruments of risk management have traditionally concen-trated on ‘normal’ procedures which regard extremes as unlikely. Recent shocks highlight the need to plan also for worst-case scenarios given the nature of our increasingly globalized and interconnected world.
The impacts of future crises are unlikely to remain local – regardless of their origins – and will likely affect more than one country or region. The vulnerabilities of globalized supply chains and particularly the just-in-time business model are likely to be exposed by any disruption lasting more than a few days.
Evidence from a range of recent events, notably the 2010 ash cloud, the March 2011 earthquake and tsunami in Japan and the floods in Thailand in 2011, indicates that key sectors and businesses can be severely affected if a disruption to production centres or transport hubs persists for more than
a week. This was confirmed by a survey of businesses about the 2010 ash cloud – many said that had the disruptions continued for a few days longer, it would have taken at least a month for their companies to recover. It is also the case that planning by government and industry organizations for an ash-cloud event had failed to consider a timeframe of more than about three days. One week seems to be the maximum tolerance of the ‘just-in-time’ global economy.
Yet for business, deviating from the just-in-time model means potentially offsetting short-term profitability. The challenge therefore for both business and governments is establishing how to balance the cost of resilience and the impact of worst-case scenarios – and who should pay.
Navigating conflicting interests amid uncertainty
The existence of competing and mutually exclusive claims to certainty is often unavoidable during any crisis situation. As the 2010 ash cloud over Europe demonstrated, pre-existing rules and guidelines will come under severe pressure during a crisis particularly if worst-case scenarios have not been explored and in the absence of flexible but credible deci-sion-making structures. Policy-makers have some freedom to take emergency measures in response to a short-term crisis, but uncertainties and conflicts of interests will inevi-tably surface during a longer-term event, complicating the response process as political and economic pressures grow.
Transparency, especially during and after a crisis, can help ensure the decisions are made on the basis of the best available evidence (recognizing uncertainties), build public confidence and manage vested interests. Policy-makers need to give close attention to mapping the complex political, institutional and industrial interests that surround the key stakeholders in critical areas of the economy, during and after an event.
Battling for the airwaves
Scientific and technology uncertainty is notoriously difficult to communicate, especially when it comes to

www.chathamhouse.org
Executive Summary and Recommendations
ix
articulating risks to the public – whether over climate change, bird flu or terrorism threat levels.
The public would benefit from increased and quality coverage of scientific opinion by the media. Governments could help give voice to independent scientific opinion by involving scientists in public briefings and other information dissemination activities. There is also a critical window of opportunity for authorities to engage effectively during a crisis situation. Reacting slowly can cede control of the message to other stakeholders who have quite different interests. On the other hand, acting rapidly but without a clear strategy will affect credibility.
Communications strategies across all forms of tradi-tional and social media should also be built into scenario-planning and exercises. Organizations that engage with the public and key stakeholders in normal times, building their presence, reputation and network, enjoy a significant advantage when disaster strikes. This is especially true of social networks. But it is clear that traditional media continue to be hugely influential, including in the social sphere. Stakeholders also need a contingency plan in case systems are compromised; recent crises have shown that modern communications networks can be fragile and lack redundancy.
Improving information and coordination mechanisms
Governments must also ensure that science and uncer-tainties are translated into a set of recommended actions. Identifying ‘no-regret’ options in such strategies makes sense whether or not a specific threat actually material-izes in the future. For example, existing social safety net programmes can build contingency arrangements so that the delivery of cash transfers or execution of public works after natural disasters can be rapidly scaled up. This same capacity can be used to cope with ‘man-made’ crises such as food, fuel and financial shocks.
Early warnings, which are by their nature uncertain, must be quickly followed by recommended steps, making it easier for decision-makers to take timely action and
be held to account. Innovative mechanisms to mobilize resources automatically once warning systems are triggered should be explored.
Scientists need to work collaboratively with civil servants, the private sector and civil society to agree on the most appropriate set of recommended actions and present these to decision-makers in a transparent fashion. In the case of a continuously evolving crisis this needs to be a fluid and iterative process; the recommended actions should be presented together with analysis to help decision-makers identify which courses of action are most amenable to their specific risk preferences.
Creating a robust process for resilience
To get the right balance between planning for specific ‘known’ events and creating generic responses for events that are rare or unexpected, governments must strengthen planning processes to anticipate and manage shock events: from clarity in the chains of command (espe-cially where multi-jurisdictions are involved) to activating and connecting independent knowledge networks with policy-makers, to building common approaches in the management of complex risks.
There are common activities and actions that are relevant in the majority of disruptions. For example, evacuation processes will remain largely the same whether for hurri-canes, earthquakes or a terrorist attack such as 9/11. Planning for specific threats will bear fruit only if the reality matches the scenario-planning. However, governments and stakeholders can identify robust – but not necessarily ‘threat-specific’ – processes to mitigate disruption.
Recommendations
Stress-testing risk mechanisms
1. Industry bodies and safety regulators should work in coordination with governments and businesses to stress-test risk-related practices in critical infrastructure sectors and to examine whether policies reflect the real costs and risks associated with future infrastructure decisions

www.chathamhouse.org
Preparing for High-impact, Low-probability Events: Lessons from Eyjafjallajökull
x
in worst-case scenarios. This should be supported by interactions – before, during and after an event – between scientific advisers and national civil contin-gency agencies to ensure that decision-making during a crisis is based as far as possible on scientific and technical evidence.
2. Red-teaming HILP scenarios with key decision-makers (politicians as well as agencies) is essential to enhance preparedness in coping with the unexpected. A multi-sector voluntary agreement on participation in planning, exercises and crisis response should be established, led by governments and industry. Transport and communications are two priority sectors, as they are critical in any crisis response. These scenario-building exercises can also help identify particularly affected social groups and countries to enable rapid financial and practical support where national organizations are unable to cope or where the consequences are cross-border in nature.
3. Sharing best practice and, where relevant, capacity, especially among industrial sectors and governments. There are a limited number of cross-cutting responses to the consequences of a crisis (rapid technological ‘fixes’, evacuation, treating sick people, communi-cations systems etc.), compared with hundreds of potential risks. Company-led and sectoral responses are especially critical when it comes to highly technical issues or engineering failures.
4. Emergency preparation and response mechanisms should be transparent and subject to public account-ability. Governments should introduce a requirement for competent authorities to conduct post-crisis impact assessments. These would consider how crisis decisions were taken, the basis of risk decision-making processes and the consequences (positive and negative) for the environment, society and economy. This would both help ensure continuous improvement in future crises, and enhance the transparency of risk-based decisions to the public.
Stepping up communications in crises
5. All actors, especially regulators and government bodies, should step up planning for communications in a crisis
including a robust website (for example, a ‘dark site’ prepared in advance but only made available to the public when a crisis hits). National science institu-tions should work together to develop, strengthen and promote effective guidelines for the communication of scientific and risk-related information for media and science institutions during a crisis, reflecting the new opportunities and challenges presented by social media.
6. There should be independent, high-quality hubs (national or regional) for up-to-date risk notification and provision of scientific information in a crisis – supported by governments, businesses and industry associations – that are critical scientific institutions that can be expected to play a role in future crises. For example, a one-stop centre should be created to aggregate information and advice from official sources with information provided by individuals via social media networks. This would become known in advance as the go-to place in a crisis for stakeholders, with enhanced capacity to meet huge increases in traffic during a crisis.
Enhancing business resilience and responses to
shocks
7. Governments should work with the insurance industry to set up a global pooling system for reinsurance to address future disruptive events and review existing arrangements regarding the provision of state support to businesses during HILP events. Although state aid can fulfil a vital role in alleviating paralysis during and immediately following an event, concerns remain around issues of anti-competitiveness legislation and market distortion.
8. A multi-disciplinary reference library for quantifying the impact of shocks should be established in relevant international institutions such as the World Bank or the International Monetary Funds. Analysts can system-atically build up a library of observations that can be drawn on when preparing for similar shocks in the future. Mistakes made in impact studies can also be used to improve predictions, creating a more reliable reference system to provide faster and more accurate

www.chathamhouse.org
xi
analysis when faced with recurring events, and to improve policy planning.
9. The private sector needs to invest additional resources in training and investment in ‘business resilience’, supported by governments, especially for small businesses. A new international standard for preparedness and continuity management systems (ISO 22301) for organizations is due to be published in spring 2012. In parallel, govern-ments could also promote the ISO mark across industry and the public. This would help ensure a competitive advantage for those demonstrating a commitment to robust business continuity management.
10. Businesses should undertake cost-benefit analysis of options such as shifting to regional hubs and storage centres for non-perishable goods to avoid urgent inter-continental transportation. While transport risks will be more difficult to overcome for perishable goods trade, in some instances different packaging and storage methods may permit delivery by land and sea instead of air. Indicators of business resilience should be developed that can actually be audited or reported on and passed on to stakeholders or the stock market, to bolster incentives for investing in resilience.


www.chathamhouse.org
1
1. Introduction
The beginning of this century has been marked by extreme events – from floods, famines, droughts and earthquakes to commodity price spikes and the global financial crisis. In 2010 in Europe alone, three separate natural events – a cold spell at each end of the year and the eruption of the Eyjafjallajökull volcano and subsequent ash cloud in April – wreaked havoc as the continent struggled to regain economic momentum following the global downturn. Early 2011 saw a drought in Australia and an earthquake in New Zealand, the most severe earthquake in Japan for the last hundred years – followed by a tsunami and meltdowns at three nuclear reactors – and the worst flooding that Pakistan and Thailand have experienced for decades. All of these crisis events have caused disruption in different countries, regions and sectors, but typically it is the poorest communities among those affected that are the worst hit.
We have always had risks to face. Two things seem to have changed today: the frequency of catastrophes seems to be increasing; and our population remains relatively unaccustomed to the magnitude and proba-bility of the risks we are currently facing. In the past, events such as floods and earthquakes had significant but largely localized impacts. Today, these events act as harsh reminders of the vulnerability of our interdependent social and economic production systems and the fragility of just-in-time business models. The impacts of such occurrences tend to escalate and spread, surging and stabilizing as new sectors or countries are caught in the chain reaction.
Unforeseen shocks, such as the 9/11 terrorist attacks raise questions of how we build capacity to respond to an
event that has not been conceived in advance as a realistic threat or whose frequency is unknown. It remains unclear in many cases how to balance the costs of preparing against the costs of responding to a crisis, and where the economic burden should fall.
1.1 Spotlight on systemic resilience
This confluence of incidents in recent years has brought renewed concerns over our systemic resilience to external shocks. Governments and businesses remain insufficiently prepared to manage high-impact, low-probability (HILP) crises and shoulder their economic, social and humani-tarian consequences.
A number of underlying factors have heightened awareness of the risks of such events. Decades of indus-trialization and urbanization – a phenomenon no longer limited to a few countries – have resulted in a concen-tration of both population and wealth in relatively compact geographical areas, especially cities and mega-cities.
Additionally, such events can disrupt the intercon-nectedness upon which modern society depends. The globalization of production processes and optimization of supply chains have stimulated greater efficiencies in the global economy. At the same time, they have increased the level of exposure to risk should a disruption to the system occur, particularly in the transport and power sectors, and they have raised the likelihood of second- or third-order impacts that are hard or impossible to predict.
With growing interdependence, the impacts from any national or local crisis – whether from an earthquake, a hurricane, a pandemic or a terrorist attack – can spread beyond national borders. For businesses, this makes it hard to establish effective resilience measures: the security of having more than one supplier for a part may be under-mined by disruption to a single major transport hub, while the manufacture of a complex product that requires thousands of parts can be halted by the absence of a single component. High-impact, low-probability events can be broadly divided into three types according to the general level of preparedness:
www.chathamhouse.org
Preparing for High-impact, Low-probability Events: Lessons from Eyjafjallajökull
2
1. ‘Black Swans’ – events which are beyond the realm of normal expectations in history, science, finance and technology and therefore impossible or extremely difficult to predict.1 Preparedness for black swans may be enhanced by strengthening generic processes, systems and institutions to enable a more effective response to the consequences, but specific planning for such an event is close to impossible.
2. ‘Known and prepared for’ – rare events which pose a significant threat (real or perceived), often as a result of historical experience or technological advance; this category includes flu pandemics, extreme weather conditions, flooding, nuclear accidents and terrorist attacks. To a greater or lesser extent, governments and businesses invest in a wide range of preventative actions, warning systems and security measures to limit the impacts. These reflect important choices about the magnitude, scale and duration of an event that preparations are designed to cope with. Evaluating the costs and benefits of different levels of preparedness is difficult, however, given that an event may not occur for years or decades.
3. ‘Known but unprepared for’ – rare events which governments and businesses may have identified as a potential threat, but where little or no action is taken to prevent or mitigate the impacts. An event may fall under this category if preparations have only been made for a less severe occurrence – in other words, if worst-case scenarios have been discounted. The tsunami and consequent flooding of the Fukushima nuclear plant, and the 2010 Icelandic ash cloud are examples. Lack of preparedness may be a result of, for example, extremely low perceived likelihood; low political sensitivity; a disconnect between scien-tific communities and decision-makers; socially ‘acceptable’ consequences (at least relative to the cost of preparedness); or a belief that, because the expected impacts are so extreme, preparedness measures are futile.
Traditional instruments of risk management concen-trate on normal procedures and tend to disregard extremes, yet consideration of these extremes is essential given the nature of our interconnected world. Scenario- and horizon-planning therefore run the risk of preserving the prevailing assumptions and mindsets in terms of risk management. Yet, as the German sociologist Ulrich Beck has pointed out, ‘the exceptions that only apparently confirm the rule must be the primary focus of attention’.2 What is required is a method for rational analysis of the worst-case scenario, and then the ability to manage the situation with the resources that will be available, rather than those that the scenario dictates should be available.
Some crises, such as floods, hurricanes, earthquakes and terrorist attacks, unfold over minutes or hours. Others, including food crises and pandemics, are ‘slow-burn’ events which typically play out over weeks, months or a few years. Slow-motion events emerge even more slowly, with the impacts building up over several or many years – these include climate change, water scarcity, biodiversity loss, non-communicable diseases and AIDS.
The sheer number of potential types of crises and their impacts present a challenge in itself. However, in most cases a limited number of cross-cutting or ‘shared’ responses to different crises can be identified – for example, evacuation processes, treating sick and injured people, providing information, maintaining public order and effective coordination across agencies. Focusing on these (including cross-border sharing of capacity) could be the key to effective practical responses.
1.2 Questions and dilemmas
HILP events raise many challenges for governments, busi-nesses and decision-makers. To improve preparedness they will need to address many new questions on disaster and crisis management. These include:
1 Nassim N. Taleb, The Black Swan (London: Allen Lane, 2007).
2 Ulrich Beck, World Risk (Cambridge: Polity Press, 1999).

www.chathamhouse.org
Introduction
3
• What and who defines a crisis? Where do responsi-bilities lie in preparing for and responding to HILP events – considering both individual shocks and the slow-motion trends that tend to increase their magnitude and frequency – and how should they be shared among key actors such as governments, regional and international organizations, the private sector, scientists and civil society? The response to Hurricane Katrina highlighted, for example, fundamental tensions between federal and local government. Climate change is the classic example of a slow-motion crisis with multiple timescales and stakeholders with divergent interests.
• How should competing needs be prioritized – minimizing the loss of human life, minimizing economic losses, maintaining public confidence in regulatory institutions, or a combination of these? The 2010 Icelandic ash cloud over Europe showed how a precautionary approach can lead to severe economic and political pressure to change the whole basis of risk-management procedures in real time.
• How can short-termism be avoided? Early and sustained action is required to avoid a problem escalating, but the most serious impacts occur years or decades into the future (climate change, ageing population etc.). There is a temptation to delay action rather than investing the required political capital. Similarly, most businesses focus on performance over much shorter timescales. How do we create incentives for long-term thinking and for more rapid responses to early warnings?
• How can sensible decision-making be achieved when juggling stakeholders with different interests, different assessments of the hazard, fundamentally different tolerances to risk, and hence different approaches to risk management? The response to the 2009 H1N1 pandemic is a good example: different perspectives on the risk led some to praise the rapid response and others to argue that commercial lobbying had driven decision-making.3
• How can we deal with persistent uncertainties despite important advances in scientific understanding? For example, although climate change is widely expected to bring serious negative impacts, the specific nature, frequency and location of climate-related extreme climate events (such as flooding, high temperatures and rainfall volatility) cannot be predicted accurately. In addition, the estimated probabilities are often misinterpreted, sometimes deliberately. This is a challenge for detailed preparedness-planning and also makes it harder to dispel scepticism.
• In a media-saturated world, how should communi-cation activities be managed during a crisis when consistency of information is absolutely paramount? The public can be swayed by the most vocal, the most active or the most politically powerful participant rather than the best informed or the most legitimate. Ash-cloud events in 2010 and 2011 resulted in a public debate to a great extent dominated by airlines. A Congressional investigation into Hurricane Katrina concluded that the US had ‘an analog government in a digital age’.4
An evidence-based approach or practice in crisis or risk management may not be possible, especially during an emergency when decision-making is considerably more time-sensitive. The application of the precautionary principle is also far from straightforward where both action and inaction can incur astronomical associated costs (see Chapter 3). The existence of multiple layers of uncertainty – or competing and mutually exclusive claims to certainty – accentuates the dilemmas. For example, during the 2010 ash cloud there was uncertainty over the location of the ash, greater uncertainty over ash concentration at different locations, and further questions about the impact of ash on aeroplane engines. Each of these led to arguments between stakeholders and confusion for the public.
One of the cardinal principles of risk management is that risk is borne most effectively at the level at which
3 Martin Enserink on the Science magazine website: ‘Facing Inquiry, WHO Strikes Back at "Fake Pandemic" Swine Flu Criticism’, 14 January 2010,
http://news.sciencemag.org/scienceinsider/2010/01/facing-inquiry.html.
4 Tom Davis et al., ‘A Failure of Initiative: Final Report of the Select Bipartisan Committee to Investigate the Preparation for and Response to Hurricane
Katrina’, Congressional Reports: H. Rpt. 109-377, US Government Printing Office, 2006.

www.chathamhouse.org
Preparing for High-impact, Low-probability Events: Lessons from Eyjafjallajökull
4
it arises. Otherwise individual actors are absolved of responsibility, increasing moral hazard and socializing the downsides of some risks.
However, this approach may be difficult or impossible to apply during a complex crisis where there is an ongoing process of defining risk parameters and serious infor-mation asymmetry. This rule also poses a challenge for the most vulnerable countries and communities, which may often be closest to the level at which a risk arises, but may lack the capacity and resources needed to manage it effec-tively. Additionally, where the challenge is quintessentially systemic it cannot be owned by any constituent part of the system, rendering the traditional ‘hands-off ’ approach to risk management insufficient.
The international or transnational aspect of such a crisis – involving decision-making, coordination and implementation by different jurisdictions – also compounds the operational challenges. Agencies from multiple jurisdictions had to come to agreement on adjusting the rules on air travel in an ash-cloud situation and manage large-scale interruption to international air traffic. Aligning incentives between stakeholders will be more complicated across different cultures of risk management. The question of responsibilities may become harder to pin down, particularly in a fluid or unantici-pated situation, or one in which the geography of the crisis changes markedly over its duration. Stakeholders have also expressed concern that leadership at the European level was weak, leading to poor coordination and a loss of confidence in decision-making.
During a crisis, which sector takes the lead during each phase can vary by country, and the interactions among governments, the private sector and civil society are often affected, for better or worse, by the media (see Chapter 4). However, ultimately all stakeholders look to the state to provide effective guidance and to impose order, even though governments may be beset by competing government agencies, different interest groups and incomplete or inadequate information.
Many of the adverse effects can be mitigated by actions taken before, during and after the event. However, this assumes that the risk has already been identified and prior-itized by key stakeholders.
1.3 Preparing for high-impact, low-probability events
How countries prepare for HILP events is shaped by their historical experience of natural disasters, threats to public health and national security concerns – and how recently these have materialized. Because the systems and processes tend to evolve in response to specific events they may not be well suited to an unexpected scenario. Moreover, they reflect national institutional arrangements, posing challenges for coordination across borders. Planning for a disruption to aviation in the United States is security-focused – driven by critical infrastructure protection, heavily strengthened in response to 9/11 – while crisis arrangements for inter-modal transport were introduced in the wake of Hurricane Katrina. UK government planning for a major transport disruption is shaped by concerns related to counter-terrorism, severe winter weather and the fuel price protests of 2000. Other developed countries (including Japan, Australia and New Zealand) focus on coping with major natural disasters.
Most countries have a structure for coping with civil emergencies. The designated agencies – often known as civil contingencies departments – frequently sit within government bodies and are responsible for preparedness and for coordination during a crisis. For example, the UK Civil Contingencies Secretariat sits within the Cabinet Office. In France the relevant authority is the Direction de la Sécurité Civile, while Germany has its Federal Office for Civil Protection and Disaster Assistance (Bundesamt für Bevölkerungsschutz und Katastrophenhilfe). In the EU, most responsibilities for civil contingencies lie with the individual member states; however, the Community Mechanism for Civil Protection can provide some financial support and coordination activities during a crisis.
Such agencies typically plan for a crisis by identifying potential threats; taking action (together with a range of stakeholders) to reduce the likelihood or magnitude of an event; clarifying roles and responsibilities, including running scenario exercises in advance to test these out; and, during an event, coordinating the response

www.chathamhouse.org
Introduction
5
of multiple agencies and ensuring consistent and clear communications. Despite having broadly similar aims, these agencies naturally differ in their priorities (the types of threats they have identified for their country and citizens) and institutional norms, which may include:
• Direct intervention by governments versus a more hands-off approach where the focus is more on enabling the private sector or individuals to respond by providing information and advice;
• The balance of responsibility between state agencies, the private sector and voluntary organizations;
• The level of citizen participation; • Emphasis on a centralized national response versus
decentralized regional action;• Emphasis on civil organizations versus a more
security- and military-focused approach.
While civil protection agencies have a cross-cutting approach, preparations for specific risks are also made by more targeted agencies, responsible for arenas such as counter-terrorism, nuclear safety, the environment, public health and aviation safety. Each issue is normally the responsibility of one or more government departments, but the day-to-day activities may be devolved to an arm’s-length organization (such as an environment or safety agency, health service or civil aviation authority).
The linkages between central coordination and more specific agencies are part of the architecture for crisis response. This brings significant operational challenges in practice. For example, the different organizations have their own decision-making dynamics. Some agencies have international dimensions that are not mirrored in the structure of national civil contingencies, which often have limited links with their foreign counterparts. Further tensions can emerge between detailed planning and generic preparation; deep technical understanding and more flexible tools; and the role of the state versus that of the private sector.
Getting the balance right between planning for specific events and generic responses is at the heart of preparing for HILP events. Preparing for specific events through
scenario-planning is important, but there is no guarantee that the reality will match estimations. Building generic processes to respond to any type of event with shared consequences creates greater institutional capacity, but will provide less institutional capacity on the specific nature and implications of a given event.
Politicians and government officials, under pressure to take action from the media and the public, may change course during a crisis, potentially undermining plans made by bureaucrats. Resources may be directed to a politically sensitive issue that would not be a priority from a more dispassionate stance. To take one example, during the 2010 ash-cloud event the UK’s decision to send three large naval vessels to rescue stranded citizens appeared to have been made in ministerial circles. A major challenge for civil contingencies is how to balance the practical implementation of a response to a crisis, which is institutionally driven, against the impact of political decision-making.
1.4 Outline of the report
Chapter 2 sets out the economic costs of HILP events and how the impacts of a shock spread across sectors and countries in today’s globalized world. The chapter high-lights the importance of the duration of an event. ‘Just-in-time’ business models and the complexity of product supply chains mean that costs can escalate rapidly once transport networks (or major production centres) are disrupted for more than a few days.
Chapter 3 explores two critical dimensions of the decision-making environment during a crisis – omnipresent questions of scientific and technological uncertainty, and the competing economic and political interests of key stakeholders. Successful management of HILP events means skilfully navigating these two inter-related challenges.
Chapter 4 argues that effective messaging and communications have never been more important in the management of high-impact events. The chapter draws on systemic analysis of social media to understand works how the public discourse is shaped; highlights the

www.chathamhouse.org
Preparing for High-impact, Low-probability Events: Lessons from Eyjafjallajökull
6
window of opportunity to influence media messaging; and draws lessons for how the media should handle scientific uncertainties.
Chapter 5 summarizes the conclusions and recommen-dations for governments and other stakeholders.
The Appendices include a reference list of acronyms, an outline of the research methodology and supporting empirical research relating predominantly to the unfolding of the ash-cloud event that was used as the central case study in the report.

www.chathamhouse.org
7
2. Mapping Economic Impacts and the Role of Business Resilience
Unpredictable and uncontrollable events can pose risks that stretch beyond the normal range of economic variables. In an increasingly globalized world, a disruption in one sector can swiftly cascade to other parts of the economy and society. Even relatively ‘small’ events can generate significant overall effects across regions and around the world. These may be low- or high-probability events of short or long duration – and all of these characteristics can alter the nature of the results. Notably, even when initial effects are low, if change is persistent rather than short-lived, the impact is likely to build up. The effects tend to be uneven, rising and falling as new sectors, or countries, are caught up in the chain reaction.
2.1 How shocks cascade through the global economy
Economic activity is driven by different kinds of expendi-ture and activity, reflecting both domestic and external demand and production, and exhibiting varying degrees of sensitivity to cycles and shocks. Depending on the origin of any particular shock, some parts of the economy will be directly affected and others indirectly.
Discretionary consumer spending and business expend-iture tend to be the initial drivers and key swing factors in determining the economic impact of shocks. Spending on essential goods and services by households and businesses, long-term infrastructure and public-sector goods and services – and the exports and imports associated with these demands – tend to be relatively inert and display only low volatility in reaction to many shocks. In contrast, consumer spending on leisure, travel and tourism is quickly and strongly affected by any such shift in behaviour. This is because, as non-essential expenditure, it can be rapidly adjusted in the event of any change in circum-stances. Advanced economies with a large proportion of discretionary spending will be susceptible to short-term volatility linked to ‘news’, whereas the repercussions of shocks may appear much later in the poorer developing countries, especially those less open to trade.5
5 This was the reason why North Korea was seen as the country least affected by the 2009 global recession.
Key messages in this chapter
z Even though globalization has created greater
efficiencies through integrated supply chains and
concentrated assets in major production hubs,
it has also increased the scope and speed of
contagion should a disruption to the system occur.
z The consequences of high-impact, low-probability
events often spread rapidly and unevenly across
sectors and borders. They pose particular threats to
key industries – especially high-value manufacturing
– and to the just-in-time business model.
z Businesses and organizations can improve their
resilience by adapting their business models and
improving emergency decision-making capacities.
z Governments are not well equipped to manage the
effects of a prolonged disruption to critical trade and
transport networks. The vulnerabilities of the just-in-
time business model are likely to be exposed by any
disruption lasting more than a few days.
z Impacts from HILP events are felt unevenly across
the world, with poorer communities most at risk to
shocks. Crisis-led policy- and decision-making and
intervention processes can also have unintended
consequences for those most vulnerable.

www.chathamhouse.org
Preparing for High-impact, Low-probability Events: Lessons from Eyjafjallajökull
8
In response to a negative shock, high-volatility expenditure tends to fall rapidly as news breaks, with discretionary consumer spending and services exports being cut. These first-round losses then create secondary effects in the local economy, curbing imports and hitting employment (especially if the sectors affected
in the first round are largely composed of job-intensive industries). Through trade, effects spread to other countries even if they have no direct connection to the initial shock. But international contagion also spreads immediately via the impact on consumer and business confidence (see Appendix 5).
Box 1: The impact of SARS on Asian economies
Severe Acute Respiratory Syndrome (SARS) generally spreads by close person-to-person contact. During the 2003
outbreak, international aviation served as the key mechanism for wider dispersion, yet the economic contagion
transcended physical distance. It is notable that the travel and tourism sector, a major part of so-called discretionary
consumer spending, now plays a major role in creating almost instantaneous global economic contagion. This rapid
shock-transmission channel can cause economic damage long before any significant direct effects (e.g. flight cancel-
lations or cases in epidemics) are seen – in this case, the sizeable impact on Asian economies from SARS even in
countries with no actual cases.
Disruption to aviation in the region lasted about two months compared with less than two weeks for Europe’s
ash-cloud event, with losses in travel and tourism about double those of the 2010 event – overall, therefore, SARS
probably cost around eight times as much in economic terms. Estimates after the event suggested that SARS caused
an average loss in regional GDP for East Asia of about 0.6–0.7% for 2003 (about double the loss in foreign tourist
revenues). Taking one-eighth of this loss as a proxy for the ash-cloud impact on Europe would therefore imply an
equivalent GDP loss for the EU of around 0.05% for the year, or 0.2% for the second quarter.
In Figure 1, historical data for growth in revenue passenger-kilometres show past losses in 2001 and 2003 versus
2009 and 2010, with the 2010 ash-cloud incident standing out.
Figure 1: Passenger-kilometre growth, by destination (%)
Intra-Europe Total
25
20
15
10
5
0
-5
-10
-15
-20
-25
Gro
wth
(%, y
-on-
y)
Jan 0
0
Jul 0
0
Jan 0
1
Jul 0
1
Jan 0
2
Jul 0
2
Jan 0
3
Jul 0
3
Jan 0
4
Jul 0
4
Jan 0
5
Jul 0
5
Jan 0
6
Jul 0
6
Jan 0
7
Jul 0
7
Jan 0
8
Jul 0
8
Jan 0
9
Jul 0
9
Jan 1
0
Jul 1
0
Source: Association of European Airlines

www.chathamhouse.org
Mapping Economic Impacts and the Role of Business Resilience
9
In this sense it was not the 2008/09 global recession that was surprising but the fact that the world economy had not seen large, synchronized disturbances of this kind more often over the previous decade – the so-called great moderation was the unusual feature. For example, just a slightly longer outbreak of SARS in 2003 (see Box 1), with a few more cases in Europe and the United States, might have turned this event into a global recession on a similar scale to that of 2009. And a few months of the ash-cloud problem over the summer of 2010 could have provoked a slump back into recession for Europe.
2.2 The vulnerability of manufacturing industries
As governments across the world navigate their economic recovery after the financial crisis, manufacturing has returned to centre stage. The sector is perceived as key to addressing long-term economic prosperity, growth and competitiveness questions. Even among indus-trialized nations, manufacturing has been offering a glimmer of hope amid the recession and many developed regions, including the United States, Japan and the EU, have bolstered their industrial policies in response. Disruptions to high-value manufacturing are therefore a significant threat to the economic health of some countries.
Any disruption to the international trading system – and particularly to air transport – has the potential for a wide-ranging impact. Moreover, given the concentration of economic production and value in a limited number of geographic locations (south of Tokyo in Japan, the Ruhr Valley in Germany, the Pearl River Delta in China and so on) the impact of a local shock can quickly spread throughout the global manufacturing sector.
Today’s manufacturing sector is highly dependent on air-freighted intermediate products. One consequence of a
just-in-time business model – lean systems with minimal inventories and tight schedules – is that the production of final goods such as cars or mobile phones can be delayed if essential components are not available almost immedi-ately via the global transportation system. Manufacturers of these intermediate products aim for a rapid turnaround on delivery to meet customer needs. A disruption can therefore result in rapidly escalating costs if production is forced to slow or pause.
Up to a third of the total value of international trade is transported by air, and the share is growing.6 For any economy that is highly interconnected with the rest of the world, aviation provides vital trade links in today’s globalized economy. For example, in its trade with non-EU countries, the UK exports 55% of manufactured goods by air. A similar share of critical intermediate components for manufacturing – such as machinery, mechanical appliances and electric and electronic equipment – is air-freighted from non-EU countries.7
Air transport is used predominantly for high value-to-weight products, perishable goods, emergency deliveries for unanticipated shortages, and products requiring the security of increased attention. But high value-to-weight ratios mean that there is a relatively light transpor-tation cost burden and if critical components (such as micro¬chips) which form part of a complex supply or distribution chain are not delivered in a timely manner, significant assets may lie idle.8
Trade in perishable goods such as flowers, fish and fresh fruit depends on air transport, with many of these products being distributed across Europe from key hubs in the Netherlands and Luxembourg. Clearly, any delay to highly perishable goods leads to a significant decrease in product value.
A systematic analysis of goods imported and exported by air can shed light on the dependence of specific high-value supply chains on aviation. Figure 2 displays the range of goods exported from the EU in 2009 by total
6 John D. Kasarda, Stephen J. Appold and Makoto Mori, ‘The Impact of the Air Cargo Industry on the Global Economy', presented at the International Air
Cargo Association Air Cargo Forum, Calgary, Canada, 13 September 2006. Available at www.tiaca.org/images/TIACA/PDF/The%20Impact%20of%20
the%20Air%20Cargo%20Industry%20on%20the%20Global%20Economy.pdf.
7 Oxford Economic Forecasting, ‘The Economic Contribution of the Aviation Industry in the UK’, 2006, available: www.oef.co.uk/Free/pdfs/
Aviation2006Final.pdf.
8 Kasarda et al., ‘The Impact of the Air Cargo Industry on the Global Economy’.

www.chathamhouse.org
Preparing for High-impact, Low-probability Events: Lessons from Eyjafjallajökull
10
value and the percentage that departed by air.9 Goods to the top right of the chart have a high value and high share of air freight. Key intermediate goods such as integrated circuits, sensors, data storage and fine chemicals can be identified – these are components in a wide range of manufactured goods. Other notable categories include industrial diamonds, aerospace components and medical products, including vaccines. Analysis of imports to the EU highlights a similar range of products.
In 2009 about 90% of the semiconductors, microprocessors and digital signal processors exported from Europe were
air-freighted to their destinations. The total value of imports of these categories to the EU was €7 billion, and about 80% of them were air-freighted. Data-processing machines and data-storage devices also rank within the top 20 imports by value, with over half of these goods being air-freighted. Each of these electronic components is critical for an ever-increasing range of applications, such as personal computers, mobile phones, automobile electronics and other telecommunications equipment. The total value of the final products for which intermediate products are required far exceeds their direct value.
9 For clarity, only goods with a total import value of €2bn are shown.
Box 2: The Tōhoku earthquake and the supply-chain knock-on effect
Beyond the initial threat posed by the earthquake and consequent tsunami, emergent secondary and tertiary impacts
have cascaded unpredictably, testing emergency response and support infrastructure to or beyond their capacity, with
slow-burn disruption threatening recovery in the longer term.
For example, the early rolling blackouts which beset waste treatment plants, supermarket refrigerators and reactor core
cooling pumps persisted into the subsequent months. With reactors remaining offline and utilities unable to meet summer
demand, the Japanese government imposed restrictions across users in order to bridge the residual electricity supply gap.
The 15% reduction from the peak demand mainly affected the western Kansai region and northeast mainland area, further
blighting manufacturing in the hard-hit Tōhoku region, which accounts for around 8% of the country's GDP.
A stable electricity supply is essential for the high-precision manufacturing techniques employed in the electronics
industry – the premier industrial sector in Japan, accounting for around a quarter of exports by value. Despite the lifting
of the 15% restriction in September 2011, uncertainty surrounding the longer-term availability of Japan's nuclear plants
remains, particularly following pressure from local government to close plants if they fail stringent safety assessments.
In the event of such a failure across the fleet, it is conceivable that all 54 nuclear reactors in Japan could be shut by
March 2012. The Japan Centre for Economic Research estimates that, without nuclear power, GDP in 2012 would be
1.6% lower than it would otherwise be.a
There is clear evidence of disruption to global supply chains, according to an analysis by HSBC. The bank notes that
‘Japan is not as crucial to the global economy as it was 20 years ago, but it remains a big producer of cars and electronic
components, especially D-Ram and flash memory.’b Moreover, the thirst for outsourcing has made many supply chains
geographically diverse and complex. As firms rationalized their businesses and contained costs, their production processes
became more vulnerable to problems at individual suppliers or ports. According to the World Bank, global industrial produc-
tion declined 1.1% in April 2011 in the wake of the tsunami and earthquake, probably reflecting supply-chain disruptions.c
a Japan Centre for Economic Research, ‘Impact to last decade or more if existing nuclear plants shut down – GDP could drop 2% on power shortages’,
25 April 2011: www.jcer.or.jp/eng/research/pdf/pe(iwata20110425)e.pdf.
b HSBC, ‘Double Trouble’, 2011, www.businessthinking.hsbc.co.uk/double-trouble.
c World Bank, ‘Japan tsunami and earthquake – Prospects Weekly: Global industrial production declined 1.1% in April in the wake of the tsunami and
earthquake in Japan’, 26 June 2011, available at: http://blogs.worldbank.org/prospects/category/tags/japan-tsunami-and-earthquake.

www.chathamhouse.org
11
Mapping Economic Impacts and the Role of Business Resilience
2.3 The consequences of a prolonged disruption
The exposure and vulnerability of our global economy, environment and society are sometimes not fully recog-nized until a disruption becomes persistent. Recovery becomes more complex as networks and systems stall or fail.
Overall business confidence and investment prospects tend to deteriorate in the face of a shock where production and distribution grind to a halt. But the scale of any change in plans depends very much on the expected duration of a problem: a short-lived, one-off shock (such as an unusual snowfall) might be passed off with little reaction, whereas events that could persist or recur (such as repeatedly harsher winters encourage more radical change.
In the face of persistent disruption, some businesses would start to impose big cuts in investment and jobs or to consider closing down. This would be a dangerous outcome because, over a prolonged period, lower
investment and employment levels permanently reduce the growth potential of economies.
However, in response to a continuous, critical disruption of transport networks, a coalition of governments and enterprises might emerge to lead investment efforts aimed at providing alternative systems to circumvent the risks posed by weather, ash clouds or similar problems. Such efforts are essential for loss mitigation in the face of threats but investment would nevertheless be costly, especially for countries already facing economic losses. Only those economies with the resources to pay for new transport infrastructure could hope to avoid the threat of deterio-rating long-run growth prospects.
Through all these channels, and depending on the duration of risk factors, there would be further reper-cussions on financial variables: a deteriorating long-run economic outlook tends to weaken financial markets and capital inflows, for example, while new investment projects that could offer solutions to transport problems and restore growth may reignite hopes for recovery and encourage new inward investment.
Figure 2: Exports of selected products to the EU
100
90
80
70
60
50
400 1,000 2,000 3,000 4,000 5,000 6,000 7,000 8,000 9,000 10,000
Total imports into the EU in 2009 (€ millions)
% o
f goo
ds a
ir fr
eigh
ted
by v
alue
%
MedicalElectrical componentsElectronic equipmentAerospacePrecious metals/diamondsChemical
Diamonds, worked, but not mounted or set (excl. Industrial diamonds)
Non-industrial diamonds unworked (excl. Industrial diamonds)
Parts of turbo-jets or turbo-propellers
Vaccines for human medicinesElectronic integrated circuits as
processors and controllers
Heterocyclic compounds with nitrogen hetero-atom(s) only
Turbojets of a thrust > 25 KN
Antisera and other blood fractions and modified
immunological products
Articles of jewellery and parts thereof
Electronic integrated circuits (excl. such as processors, controllers,
memories and amplifiers)
Diagnostic or laboratory reagents on a backing
Nuclear acids and their salts
Mobile telephonesParts of aeroplanes
or helicopters
Parts of telephone setsMachines for the reception,
conversion and transmission of voice, images or other data
Instruments and appliances used in medical, surgical or veterinary sciencesParts and accessories of automatic
data-processing machines
Parts of gas turbines
Medicaments containing hormones or steroids used as hormones
Source: Authors' analysis of Eurostat (external trade database), 2010
www.chathamhouse.org
Preparing for High-impact, Low-probability Events: Lessons from Eyjafjallajökull
12
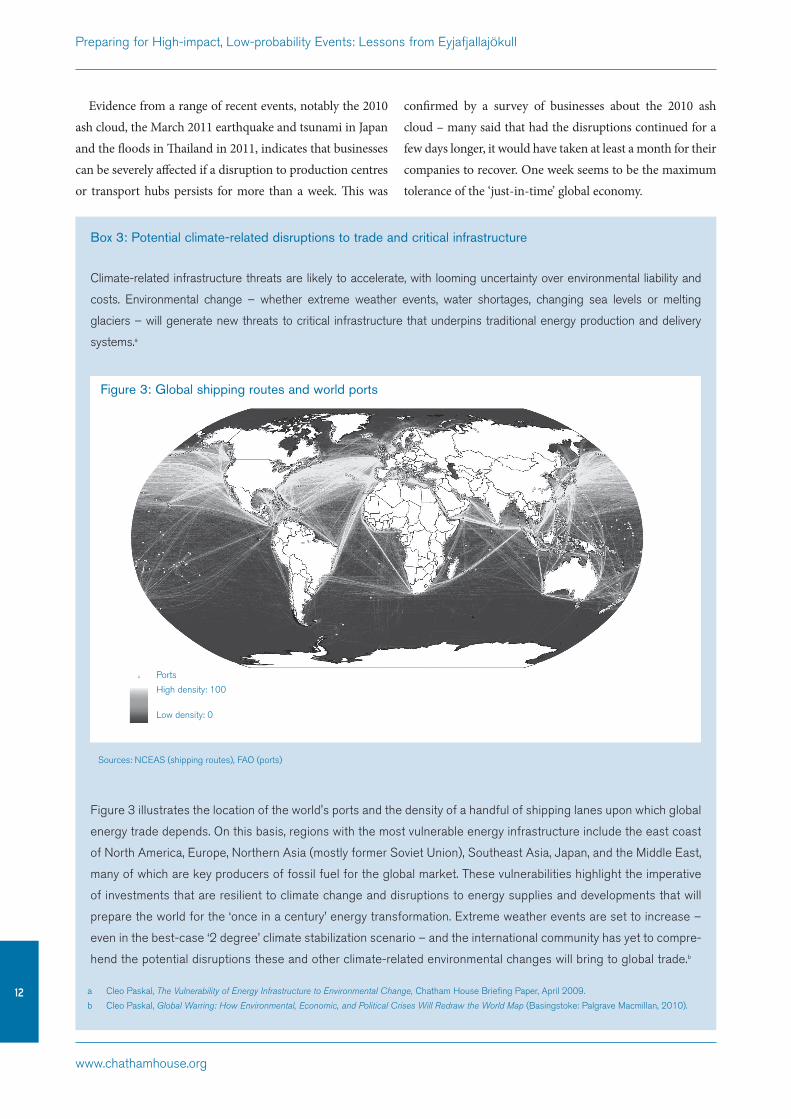
Box 3: Potential climate-related disruptions to trade and critical infrastructure
Climate-related infrastructure threats are likely to accelerate, with looming uncertainty over environmental liability and
costs. Environmental change – whether extreme weather events, water shortages, changing sea levels or melting
glaciers – will generate new threats to critical infrastructure that underpins traditional energy production and delivery
systems.a
Figure 3 illustrates the location of the world's ports and the density of a handful of shipping lanes upon which global
energy trade depends. On this basis, regions with the most vulnerable energy infrastructure include the east coast
of North America, Europe, Northern Asia (mostly former Soviet Union), Southeast Asia, Japan, and the Middle East,
many of which are key producers of fossil fuel for the global market. These vulnerabilities highlight the imperative
of investments that are resilient to climate change and disruptions to energy supplies and developments that will
prepare the world for the ‘once in a century’ energy transformation. Extreme weather events are set to increase –
even in the best-case ‘2 degree’ climate stabilization scenario – and the international community has yet to compre-
hend the potential disruptions these and other climate-related environmental changes will bring to global trade.b
Figure 3: Global shipping routes and world ports
Sources: NCEAS (shipping routes), FAO (ports)
Ports
High density: 100
Low density: 0
a Cleo Paskal, The Vulnerability of Energy Infrastructure to Environmental Change, Chatham House Briefing Paper, April 2009.
b Cleo Paskal, Global Warring: How Environmental, Economic, and Political Crises Will Redraw the World Map (Basingstoke: Palgrave Macmillan, 2010).
Evidence from a range of recent events, notably the 2010 ash cloud, the March 2011 earthquake and tsunami in Japan and the floods in Thailand in 2011, indicates that businesses can be severely affected if a disruption to production centres or transport hubs persists for more than a week. This was
confirmed by a survey of businesses about the 2010 ash cloud – many said that had the disruptions continued for a few days longer, it would have taken at least a month for their companies to recover. One week seems to be the maximum tolerance of the ‘just-in-time’ global economy.
www.chathamhouse.org
13
2.4 Uneven impacts across regions and society
Recent disruptions have demonstrated that any shock to global trade routes is likely to create distinctive impacts for different countries and, in turn, different social groups. In part this is because impacts are unevenly spread, but structures, development and openness also vary substantially across different areas. For instance, Africa is not the most disaster-prone continent but it is the only continent whose share of reported disasters in the world total has increased over the last decade.10 This is particularly troubling owing to Africa’s comparatively
low levels of economic development, rendering it more vulnerable to shocks as the number of natural hazards increases.
Poorer communities have low incomes and few assets, making it harder for them to smooth consumption patterns during an economic shock. They are more likely to live in hazard-prone areas with weaker infrastructure and yet are unlikely to have access to a wide variety of resources and provisions such as financial services, health care and social protection. They also spend a greater proportion of their income on food – up to 80% in the poorest countries – so food price spikes hit them hardest. Overall, disaster mortality rates in the poorest countries
Mapping Economic Impacts and the Role of Business Resilience
10 ‘Disaster Risk Reduction for Sustainable Development in Africa: Guidelines for Mainstreaming Disaster Risk Assessment in Development’, 2004:
http://www.unisdr.org/africa/af-hfa/docs/africa-guidelines-mainstreaming-dr-assessment-development.pdf.
Box 4: The Kenyan flower industry during the 2010 Eyjafjallajökull ash-cloud event
As the United Nations Development Programme (UNDP) has noted, it is the poor who often suffer the greatest cost
of an event in terms of lives and livelihoods, and rebuilding their shattered communities and infrastructure.a During
the ash-cloud event in May 2010, Kenya was one of the worst-affected countries globally in terms of disruption to
exports to the EU. Roses constitute the single largest air-freighted commodity, with approximately one-third of the
cut flowers sold in the European Union grown in Kenya. As a result of an ash cloud thousands of kilometres away,
Kenyan horticulture, the top foreign exchange earner and therefore a critical component of the national economy,
lost $3 million a day and shed 5,000 jobs.b
Overall impacts tend to obscure the variation of impacts on different social groups. Within Kenya’s cut-flower industry,
75% of employees are female, and over 65% of the total workforce are employed on a temporary, seasonal, or casual
basis.c Legally, Kenyan employers are required to promote casual or temporary workers to permanent status after
eight months, but they are often found returning year after year on a renewed temporary contract. Across a number of
African horticulture exporters, this categorical gender discrimination is embedded in social norms that consider women
more compliant and better suited to certain types of horticultural work (such as picking and packing), coupled with
perceptions that women’s income is supplementary, rather than central, to household livelihoods.d
Under normal circumstances, produce is harvested, packed and chilled on the same day, trucked to Nairobi’s
international airport and loaded onto passenger flights to Europe. Kenyan produce is typically in shops in Paris or
London within 72 hours of being pulled from the fields. During the six days of airport closures, over 3,000 tons of fresh
flowers were left rotting in storage units and warehouses around the growing areas of the country.e
a Mark Malloch Brown, Foreword to UNEP, Reducing Disaster Risk: A Challenge for Development, 2004, http://www.undp.org/cpr/whats_new/rdr_english.pdf.
b ‘With Flights Grounded, Kenya’s Produce Wilts’, New York Times, 19 April 2010, http://www.nytimes.com/2010/04/20/world/africa/20kenya.html?hp.
c C. Dolan, M. Opondo and S. Smith, Gender Rights and Participation in the Kenya Cut Flower Industry, Natural Resources Institute Report No. 2768
SSR, Project No R8077 2002–4, Chatham Maritime, 2003.
d S. Smith et al., ‘Ethical Trade in African Horticulture: Gender Rights and Participation’, IDS Working Paper 223 (Brighton: Institute of Development Studies, 2004).
e Oxford Economics, ‘The Economic Impacts of Air Travel Restrictions Due to Volcanic Ash’, 2010, http://www.airbus.com/fileadmin/media_gallery/
files/brochures_publications/Volcanic-Update.pdf.
www.chathamhouse.org
Preparing for High-impact, Low-probability Events: Lessons from Eyjafjallajökull
1411 Analysis by the International Red Cross and Red Crescent Federation found that between 1991 and 2000, there were 23 deaths per disaster in
countries with high human development indices, compared with 1,052 in countries with low human development indices. See International Federation of
Red Cross and Red Crescent Societies, World Disaster Report 2001 (Geneva: IFRC, 2001), pp. 161–4.
are almost fifty times higher than in the richest ones.11 The earthquake and resulting tsunami that hit Japan in 2011 were catastrophic, killing nearly 16,000 people. However, the earthquake that hit Haiti the year before is estimated to have cost over 300,000 lives, despite being several orders of magnitude smaller.
Relative impacts are usually driven by the following factors:
• The geography of the shock and how this may affect key global hubs;
• The composition of GDP and consumer spending, including the proportion of discretionary spending in the economy and (where there is a disruption to passenger transport) the importance of tourism and travel within the local economy;
• The ownership and structure of key industries, such as the companies most affected by the disruption and their employment patterns;
• Scope for government policy responses: in the wake of the 2009 recession, the scope for government assistance
was low, especially in the most indebted economies such as Ireland, Greece, Portugal, Spain and Romania;
• Economic and socio-economic factors which determine levels of vulnerability to shocks such as per capita income and other human development indicators, or access to social protection schemes and safety nets;
• The examples in Boxes 4 and 5 demonstrate how crises can have disproportionate impacts upon poor people – either as a result of their greater vulnerability (the labourers in the Kenyan cut-flower industry had the most precarious jobs in the value chain) – or as a result of inappropriate policies (policy-makers in the Katrina response failed to take proper account of the needs of low-income groups).
Poor communities are more vulnerable to shocks – but they are also more likely to be marginalized economi-cally, politically or socially. As a result, their needs may be inadequately considered in planning for, responding to or recovering from a crisis. This can leave them trapped in a
Box 5: Hurricane Katrina
According to Dr Susan Cutter, Director of the Hazards Research Lab, ‘the revelations of inadequate response to
Hurricane Katrina’s aftermath are not just about failures in emergency response at the local, state, and federal levels
or failures in the overall emergency management system. They are also about failures of the social support systems
for America’s impoverished – the largely invisible inner city poor.’a
Socially created vulnerabilities are easily overlooked in disaster management plans and national risk registers because
they are so hard to measure and quantify.b Social vulnerability is partially a product of social inequalities – those social factors
and forces that create the susceptibility of various groups to harm, and in turn affect their ability to respond, and their resil-
ience after the disaster. Aside from the direct physical impact of a disaster process, a combination of pre-impact conditions
and prejudices in emergency management interventions can increase the burden on specific segments of each community.
In the wake of Hurricane Katrina, an evacuation call assumed erroneously that all victims had access to private
transport, when in reality many people without vehicles were unable to escape and were left stranded on rooftops –
or worse – during the ensuing floods.c
a Susan Cutter, ‘The Geography of Social Vulnerability: Race, Class, and Catastrophe’, 2006, http://understandingkatrina.ssrc.org/Cutter/.
b Ibid.
c Maureen Fordham, ‘Social Vulnerability and Capacity’, Natural Hazards Observer, 2007, www.colorado.edu/hazards/o/archives/2007/nov07/NovObserver07.pdf.
www.chathamhouse.org
15
downward spiral of increasing poverty and vulnerability, as each crisis leaves them more susceptible to the next.
As key stakeholders in crisis management and response, civil society organizations play an important role in limiting disproportionate impacts upon poor people, for example by campaigning for civil, political and economic rights, or delivering emergency responses to affected communities. Ultimately, however, responsibility for ensuring that the needs of vulnerable communities are properly considered – and that the associated vicious cycle of increasing vulner-ability is broken – lies with government agencies.
The humanitarian community has made progress on agency-specific preparedness missions, but recent crises highlight the importance of investing more resources in devel-oping national and global capacities. Coherence and coordi-nation across development and disaster agencies need to be addressed and there is a need to shift away from contingency planning to multi-year preparedness strategies. Much progress has been made in improving early warning systems, but this does not always translate into early action on the ground.
2.5 The importance of business resilience
HILP events pose significant risks to businesses. Nearly 18,000 were dislocated, disrupted or destroyed, for example, by the events of 9/11.12 Over a ten-year period, Deloitte found that half of the 1,000 largest global companies suffered declines in share prices of more than 20% in a one-month period. They identified ‘high-impact, low-probability’ risks as a major cause of these losses. A quarter of the companies affected had to wait a year before their share price recovered – and another quarter had failed to recover by the end of the study’s timeframe.13 Airlines and the travel industry suffered huge costs during the 2010 ash cloud and, given wider economic conditions, many were pushed close to bankruptcy.14
During any major disruption to transport systems, management structures can be dislocated and employees left stranded in different locations. Restrictions on flights following 9/11 led some – but by no means all – companies to change their business practices so that they would not be paralysed by a future shock.15 Information and communication systems can be held at multiple locations and accessed remotely, enabling activity to continue if a local disruption occurs. Energy systems can also be backed up. All these responses may require significant changes to business culture and investment in resilient systems.
As is the case for governments, stress tests and scenario analyses can be used by firms to understand the potential negative impacts from rare events that are typically omitted in risk models.16
Enhancing resilience at the strategic level may mean a more fundamental challenge to business models. Firms might choose to hold larger inventories, use multiple suppliers for key manufacturing inputs, regionalize opera-tions to spread risk across different locations, and invest in more resilient infrastructure along supply chains. Yet many of these measures mean deviating from the just-in-time model that businesses strive for in order to maximize short-term profitability. Businesses are likely to weigh the impacts of such measures, which potentially reduce the efficiency and profitability of their operations to some extent, against reduced vulnerability to future shocks. In an extreme case these shocks could result in overwhelming losses. However, they may not materialize for many years.
In a survey carried out by the Business Continuity Institute, 50% of business respondents working in twelve different countries and across twelve different sectors had tried to optimize productivity and profit margins by outsourcing, consolidating suppliers and adopting just-in-time or lean manufacturing
12 Gail Makinen, ‘The Economic Effects of 9/11: A Retrospective Assessment’, Congressional Research Service, 2002, www.fas.org/irp/crs/RL31617.pdf.
13 Deloitte, Disarming the Value Killers: A Risk Management Study, 2007, available at: www.corpgov.deloitte.com/binary/com.epicentric.contentmanagement.
servlet.ContentDeliveryServlet/CanEng/Documents/Risk%20Oversight/DisarmingTheValueKillers.pdf.
14 IATA, ‘Volcano Crisis Cost Airlines $1.7 Billion in Revenue – IATA Urges Measures to Mitigate Impact’, 2010, www.iata.org/pressroom/pr/Pages/2010-04-21-01.aspx.
15 Amy E. Hurley-Hanson, ‘Organizational responses and adaptations after 9-11’, Management Research News, 2006, Vol. 29, Issue 8, 2006, pp. 480–94,
www.emeraldinsight.com/journals.htm?articleid=1571697&show=html.
16 Deloitte, Disarming the Value Killers.
Mapping Economic Impacts and the Role of Business Resilience

www.chathamhouse.org
Preparing for High-impact, Low-probability Events: Lessons from Eyjafjallajökull
16
techniques.17 Businesses choosing such options were shown to be more likely to experience supply chain disruption, with 83% of those using low-cost-country solutions experi-encing disruption owing to failures in the transport network and among suppliers in 2010.18 When asked specifically
about the volcanic ash event, 50% of companies for which the closure of European airspace was identified as a significant problem did not have this risk on their register; and for those that did, one week was generally the longest period that had been considered during planning.19
Box 6: Business responses to the 2010 ash cloud
In total there were 36 responses from businesses to the Chatham House survey on the impact of the ash-cloud event
in April 2010 (See Appendix 3). A large proportion came from the ‘air travel/transport’, ‘government/regulation’ and
‘food’ sectors. For the majority, the event appears to have had a negative effect on profit/revenue. However, a small
percentage responded positively in this area. Respondents (47%) also reported that it took less than a week for
organizations to return to normal after the event. However, a large proportion also estimated that had the disruptions
continued for a few more days it would have taken over a month to return to normal. In the main, organizations
appeared to have coped positively with the disruption. Areas of exception were insurance cover and profits/revenue.
It appears that, where possible, organizations utilized other forms of transport or transferred business locally in
order to function. Regular communication was used to aid public image, supplier and customer relations. With regard
to information or advice about the event, it appears that in the majority of cases respondents received this either
immediately or within 24 hours. However, 40% claimed that information from regulators, government and international
bodies was not received until at least two to three days later and in some cases over a week. The majority claimed
not to have received targeted information from the government or regulators at all. Those that did, through websites,
described it as inconsistent or too late to have a beneficial impact.
Company websites were the main tool used by organizations to relay key messages to consumers and the general
public. Other methods (not specified) were mainly used to relay messages to the government, but social networking sites
and advertising were barely used. With regard to stakeholder performance, decision-making by regulators, governments
(home and other national) and the European Commission, as well as scientific bodies, was rated poorly (by over 60% of
respondents). In contrast, NGOs, trade unions and private enterprise were generally rated positively on decision-making
and communication (around 80% of respondents deemed decision-making ‘Good’ or ‘Very Good’ in relation to these
actors). Generally, communication was rated lower than decision-making across all stakeholders surveyed.
The majority of respondents claimed that organizations had not made changes to existing strategies. However, a
small number in ‘air travel/transport’, ‘food’, ‘government/regulation’, ‘tourism’ and ‘other’ sectors claimed changes had
occurred or were being considered.
In the main, respondents commented that a unified decision-making process across Europe and further afield
should be adopted. Many said that inconsistencies in the stated risk of flying increased disruption, with some airports
opening where others remained closed. Better preparation, scientific research and communication strategies in future
were also called for.
17 Business Continuity Institute, ‘Supply Chain Resilience 2010: BCI Survey of Resilience Professionals’, October 2010.
18 Ibid.
19 Business Continuity Institute, ‘A Report on the Disruption Caused by the Closure of European Airspace Due to Volcanic Ash in April 2010 as Reported by
BCI Members’, June 2010.
www.chathamhouse.org
17
3. The Contest over Science, Certainty and Legitimacy
In any crisis, stakeholders bring a range of economic, political and public interests to the table. Scientific and technical information is often negotiated and contested, reflecting the core interests of key players. The complica-tions introduced by scientific uncertainty can become more pronounced where events are completely unforeseen, which further highlights the need for effective procedures.
Applying evidence-based practice to crisis or risk management is not always possible as a time-sensitive crisis unfolds. Application of the precautionary principle may mean shifting the burden of proof so that those taking action have an obligation to demonstrate that it is not harmful. It also implies an approach – in the presence of scientific uncertainty – that focuses on weighing up the costs and benefits of different actions, including the option of doing nothing. But in some risk environments, the price both of taking action and of inaction is potentially high, making it difficult to form decisions on the basis of either a precautionary approach or traditional cost-benefit analysis. In such circumstances, identification of least- (or where possible no-) regret options is likely to be critical.
Navigating the interrelated challenges of uncertainty and the competing interests of stakeholders is crucial in preparing for and managing the consequences of a high-impact, low-probability event. Scientific uncertainties are a common feature of both emergencies and slow-motion crises and may be very difficult to model. Such events may even challenge the very basis of current understanding, undermining the relevance of predominant assessment techniques. The financial crisis is a case in point – however advanced the financial tools were at the time, they could not explain a world in which the whole system broke down. At the same time, the treatment of uncertainty can play a central role in the decision-making process.
3.1 Scientific uncertainty in high-impact, low-probability events
A recent UK House of Commons report stressed the importance of integrating science in planning processes, especially for known events, before an emergency occurs:
Key messages in this chapter
z There cannot be adequate planning for all even-
tualities, especially when it comes to ‘black swan’
events. Governments and stakeholders must identify
robust but not necessarily ‘threat-specific’ processes
to mitigate a disruption.
z The competing interests of key stakeholders are often
played out in a public manner – through, for example,
the very different ways in which scientific uncertainty is
interpreted and communicated to the public. Mapping
and managing these conflicting interests is a critical
component when preparing for and managing the
consequences of an HILP event.
z Addressing investment gaps in scientific capacity and
institutions following an HILP event is an important
part of the evolutionary response for key agencies. This
should be combined with strong and coordinated action
by governments to introduce and enforce transparency
and effective risk-management frameworks.
z Scientific uncertainty remains a key part of the
decision-making landscape. While sound in principle,
an evidence-based approach may not be possible
during a crisis. This makes the transparency of
risk-based decision-making vital to maintain public
confidence in crisis management. The application of
the precautionary principle is also not straightforward
where the price of action and inaction are both
potentially vast.

www.chathamhouse.org
Preparing for High-impact, Low-probability Events: Lessons from Eyjafjallajökull
18
we have been left with the impression that while science
is used effectively to aid the response to emergencies,
the Government’s attitude to scientific advice is that it is
something to reach for once an emergency happens, not a
key factor for consideration from the start of the planning
process.20
While scientific and technical input is certainly important for evidence-based decision-making in preparing for and responding to a crisis, focusing on improved science as a solution can also be misleading. Scientists can inform us about the most probable worst-case scenario for each event, but not always that one disruptive event can lead to another. Later in this chapter, an analysis of the key areas of disagreement between the major stakeholders in the ash-cloud crisis shows that competing interests and information asymmetry were as important as scientific uncertainties. These issues were confirmed by a number of other HILP events.
One such event was the 2002–03 outbreak of Severe Acute Respiratory Syndrome (SARS). The outbreak was not brought to the attention of the World Health Organization until late November 2002, nearly a month after the first reported cases, when Canada’s Global Public Health Intelligence Network informed it of unconfirmed reports of ‘flu outbreaks’ in China which it had picked up on the internet. Even then, institutional limitations meant that the reports were only presented in English and French, limiting the spread of information on what had the potential to be a truly global catastrophe. It was only much later that the disease received significant public attention. The lack of information contributed to widespread uncer-tainty about the nature and properties of the disease, leading to unnecessary, indirect impacts on economies and societies far from the centre of the outbreak. For example, despite not having a single case of SARS, business in New York’s Chinatown went into rapid decline and had still not recovered a year after SARS had been contained.21
The catastrophe in Japan in March 2011, caused by a massive earthquake leading to a tsunami and meltdowns at the Fukushima nuclear plant, also revealed the influence of conflicting interests during an emergency. According to a former executive of the power company Tepco who is also a member of the Japan Atomic Energy Commission, Tepco delayed the use of seawater in an attempt to protect its assets, acting only when eventually ordered to by the prime minister.22 This illustrates how the choice of emergency measures taken to deal with an HILP event cannot be reduced to a question of scientific evidence. A conflict between competing stakeholder interests and scientific uncertainty can emerge as alternative interpretations of evidence and approaches to communication converge.
3.2 Understanding risk and decision-making during crises
Government, the private sector and civil society are constantly making decisions based on cost-benefit risk assessments. A government may choose to deregulate a sector after weighing up the political gain and loss for the main governing party. A business may choose to locate a facility in a hurricane zone if it can secure insurance to defray potential costs if damage occurs. A civil-society group may advocate building more low-cost housing if the policy appeals to more of its members and funders than it alienates.
Each decision may be rational within its own narrow cost-benefit parameters. However, given the intercon-nected nature of our globalized systems, these decisions do not exist in isolation and can leak vulnerabilities into other sectors. Government deregulation in one sector can weaken the global financial system. A hurricane off the US Gulf coast can (as Katrina did) destroy over 100 oil and gas platforms, creating a spike in global oil prices and affecting business worldwide. Low-cost housing can end up being
20 House of Commons, Science and Technology Committee, ‘Scientific Advice and Evidence in Emergencies’, Third Report of Session 2010–11, Volume I:
Report, together with formal minutes, oral and written evidence, 2011.
21 Laura Eichelberger, ‘SARS and New York's Chinatown: The Politics of Risk and Blame During an Epidemic of Fear’, Social Science & Medicine, Vol. 65,
Issue 6, 2007, pp. 1284–95.
22 Norihiko Shirouzu, Phred Dvorak, Yuka Hayashi and Andrew Morse, ‘Bid to “protect assets” slowed reactor fight’, Wall Street Journal, 21 March 2011.
www.chathamhouse.org
The Contest over Science, Certainty and Legitimacy
19
built on flood plains, requiring military intervention to evacuate residents and secure critical installations.
One reason for this discounting of risk is the common practice of ignoring ‘externalities’ when calculating cost. Externalities can be costs expected to be borne by others (for example insurers, or the government), or costs that will come due past the timeframe under consideration (for example, during another administration or in a future corporate bonus period).
Some forms of insurance can also distort the evalu-ation of risk. For instance, government will for political reasons back or directly insure activities in some sectors that private-sector insurers have deemed too risky to take on. The result is an undervaluation of the real risk involved. One clear example of this is the US National Flood Insurance Program, which allows for government-backed insurance on properties in areas that private insurers consider unprofitable. It can essentially act like
Box 7: Translating early warning of drought risk into timely action
All crises are different – playing out over different periods of time, in different political, cultural and economic contexts
and with different stakeholders and competing interest groups. Yet a common theme remains the problem of
translating scientific analysis into timely action.
Drought, and the food crises that may result, are a classic example of slow-motion crises in which failed rains lead
to a failed harvest, after which food reserves and asset bases are eroded as people struggle to feed themselves. Food
availability declines and prices rise, leaving the vulnerable populations facing months of severe food insecurity until
another harvest is possible.
A crucial difference, however, is that in certain regions of the world, most notably West Africa and East Africa, drought
is not a high-impact, low-probability event; it is a high-probability, high-impact event. Droughts happen every few years.
Governments and international agencies often have a very good idea about how a food crisis is likely to evolve and are
able to see it coming a long way in advance. Yet time and again, the international response is inadequate.
The 2011 East African food crisis was correctly forecast in August 2010 by the Famine Early Warning Systems
Network (FEWS NET), an entire year before the critical ‘hunger gap’ period in which the crisis peaked. Once it became
clear that the drought was a certainty – when the 2010 October rains failed – FEWS NET began issuing regular
warnings about the deteriorating situation in the region. However, the response of the international community was
inadequate. With the hunger gap upon it in July, and regions of Somalia being declared famine zones, the UN’s appeals
were less than half-funded. What is more, the failure to mobilize resources early meant that agencies were unable to
build adequate logistical capacity in anticipation of the crisis peak.
This problem is not confined to the 2011 food crisis – it is a familiar pattern, noted most recently in the 2005 and
2010 Sahel food crises. The early provision of scientific warnings of drought and crisis, inevitably including uncertain-
ties, is failing to precipitate adequate early action, despite the relative lack of conflicting interests between stakeholders,
and their familiarity with these kinds of event. A simplistic explanation that donors are reluctant to mobilize resources
until uncomfortable images of starving people are broadcast around the world offers at best only a partial explanation
and little in the way of solutions.
Attention must also be turned to how information is provided to decision-makers so that it is easier for them to take
early action and be held to account. This means translating early warnings into recommended steps, with the clear
identification of least- (and no-) regret options able to deliver a minimum level of early action that can be built upon
as information improves. Other innovative mechanisms to automate certain elements of the response could also be
explored – for example a catastrophe bond or insurance mechanism that pays out when drought happens – to reduce
the burden on decision-makers.
www.chathamhouse.org
Preparing for High-impact, Low-probability Events: Lessons from Eyjafjallajökull
20
Box 8: Risk assessment within the nuclear industry
‘If constructing in a seismic zone that hasn't seen an earthquake above a magnitude of 6.5 in 100 years, do you build to withstand 7?
Or put in extra millions upfront to protect against a magnitude of 8? Or do you simply choose not to build a nuclear power station in an
earthquake zone at all?’
Cleo Paskal, 2011a
Since nuclear power plants use hazardous material that needs to be contained in all circumstances, the industry has
developed a risk assessment tool called a Probabilistic Safety Assessment (PSA) to enable regulatory bodies and
operators to gain an insight into the risks that the plant faces, in particular as they relate to the key safety systems
such as reactor shutdown, reactor containment, emergency core cooling and emergency power supply. The information
obtained by the PSA is used to improve the components, systems, structures and management for ensuring safety,
and indicate numerically the risks of serious accidents, particularly those relating to damage to the core and/or the
significant release of radioactivity.
PSAs are also used to communicate the risk of significant or serious accidents to the public and are expressed as the
chance of an accident in a given number of years of operation of a particular reactor or fleet of reactors. For example, the
probability of an accident that results in damage to the core of the European pressurized water reactor, the most modern
design being constructed worldwide, is described as 5.2 x10-07 – which means that there is a chance of such an accident
just over five times in every ten million years of operation of this particular design of reactor – while the anticipated risk of
core damage with the failure of containment (and therefore release of radiation) is less at 3.9 x 10-08 or almost four times
in a hundred million years of operation.b For older reactors, which have operated for longer – and hence are subject to
material ageing – and which have fewer safety systems, the risks are perceived as greater, often by an order of magnitude.
In the case of the Japanese nuclear fleet as a whole, an assessment in 2004 undertaken by the Nuclear and Industrial
Safety Agency reviewed the PSA reports performed by the electric utilities for the 52 existing nuclear power plants. It
concluded that the risk of a core-damage accident, presumably in the oldest reactors such as those at Fukushima, was
less than 10-6/reactor year, and the containment failure frequency was less than 10-7/reactor year.c To put these risk esti-
mations in context, the Japanese nuclear industry said that ‘The individual risk, 10-6 per year, is equivalent to several occur-
rences in a long history of human beings (about 4 or 5 million years after the first human appeared on the earth).’d
However, there is a significant difference between these theoretical assessments and what has been observed. To
date there have been three major civil nuclear accidents that have resulted in damage to the core, at a minimum: Three
Mile Island in the US in 1979, Chernobyl in Ukraine in 1986 and now Fukushima. Since the start of the civil nuclear
industry the cumulative operating years of the world’s reactors is less than 15,000 reactor operating years. Therefore on
average there has been accident every 5,000 reactor years, which is twenty times greater than the probability calculated.
The significant difference between the expected and observed risk raises two sets of concerns. First, is the method-
ology of PSA correct and is it considering all the relevant factors sufficiently – in the case of Fukushima the seismic and
tsunami risk? Secondly, are the inherent risks of nuclear power, in particular human engagement, adequately considered
and how might this change over time, i.e. taking account of changing maintenance, regulation and operating regimes?
a Chatham House Expert Comment, http://www.chathamhouse.org/media/comment/view/163419.
b UK-EPR. ‘Fundamental Safety Overview, sub-chapter R.2 Probabilistic Safety Assessment’, www.epr-reactor.co.uk/ssmod/liblocal/docs/V3/
Volume%202%20-%20Design%20and%20Safety/2.R%20-%20Probabilistic%20Safety%20Assessment/2.R.2%20-%20Level%202%20
Probabilistic%20Safety%20Assessment%20(PSA)%20-%20v2.pdf.
c JNESO, ‘Probabilistic Safety Assessment (PSA), Incorporated Administration Agency’, Japanese Nuclear Energy Safety Organization, December 2007.
d JNESO, ‘Severe Accident and Accident Management, Incorporated Administration Agency’, Japanese Nuclear Energy Safety Organization, 1 July 2009.

www.chathamhouse.org
21
a government subsidy to put people in harm’s way and result in properties being rebuilt in the same location after having been repeatedly destroyed by flooding.
Even the most comprehensive risk assessments, however, face another complex issue, the increasing variability of the three ‘geos’ (geopolitics, geoeconomics and geophysics).
Predicting the behaviour of the physical world in particular is a growing challenge. With environmental change, past indices are no longer reliable guideposts for future events. The science is good, and getting better, but already it is often marginalized in calculations. Ensuring that government, the private sector and civil society include the new range of science-based variables
is extremely difficult, especially as the timeline seems so extended. Does one plan coastal infrastructure for a 15cm or 50m sea-level rise by 2050? That date may seem far in the future, but it is well within the lifetime of new infrastructure builds. And what happens after 2050? Often these new variables are simply ignored, thereby increasing the likelihood of future low-probability (according to past geophysics), high-impact events.
Additionally, risk assessments themselves are primarily designed to predict the likelihood of a specific event, whereas what is of primary concern is the impact of that event. It is not the hurricane in itself that is the problem; it is the impact of that hurricane on infrastructure, governance, etc.
The Contest over Science, Certainty and Legitimacy
Box 9: Conflicting stakeholder interests during the 2010 ash-cloud event
At the beginning of the event regulators across Europe took a safety-first approach, following the advice of aviation
safety regulators. Many airlines were unhappy that the risk decision-making was taken out of their hands – the regulators
essentially closed airspace instead of allowing them to evaluate safety on a case-by-case basis. As the economic costs
grew, pressure mounted on regulators to implement a more nuanced set of measures for dealing with the ash cloud.
This brought up another vital issue on which adequate information was necessary in the process of decision-making: the
level of ash in which aircraft could operate with a reasonable level of safety.
The importance of defining a safe threshold had been raised in industry discussions for many years but little progress
had been made.a Stakeholders have put forward a variety of potential reasons for the slow progress, including the diffi-
culties of setting standards given modelling and engineering uncertainties; limited participation by the private sector in
planning and response mechanisms; and poor communication between industry and other stakeholders. Some stake-
holders also suggested that it may not have been in the economic interest of the engine and aircraft manufacturers to set
safe ash thresholds, given the higher costs of flying in ash. However, the balance of economic incentives is far from clear.
Information asymmetry between the private sector and the regulators became a serious obstacle to resolving the crisis.
To the extent that analysis of safe levels was available, it was held by the manufacturers of aircraft engines and the airlines.
During the event data on ash concentration thresholds were shared between the leading engine and aircraft manufacturers
for the first time, but details of the arrangement or the results were not made public, or released to regulators.b
As economic pressures mounted, engine and aircraft manufacturers came under intense pressure to provide
further information that could lead to 'safe' ash thresholds, which would provide a clear basis for regulators to relax the
rules. Yet although the European Council of Ministers emphasized the necessity of evidence-based decision-making,
the decision to moderate the flight ban was eventually made regardless of the absence of a clear statement from the
engine and aircraft manufacturers.
a Z. J. Przedpelski and T. J. Casadevall, ‘Impact of Volcanic Ash from 15 December 1989 Redoubt Volcano Eruption on GE CF6-80C2 Turbofan
Engines’, in T.J. Casadevall (ed.), Volcanic Ash and Aviation Safety: Proceedings of the First International Symposium on Volcanic Ash and Aviation
Safety: U.S. Geological Survey Bulletin 2047, 1994, pp. 129–35; First Symposium on Volcanic Ash and Aviation Safety, held in Seattle, Washington,
United States, 1991; International Volcanic Ash Task Force (IVATF), First Meeting. Montréal, 27–30 July 2010, www2.icao.int/en/anb/met-aim/met/
ivatf/Documents/DP%205.pdf.
b Interview with engine manufacturer.
www.chathamhouse.org
Preparing for High-impact, Low-probability Events: Lessons from Eyjafjallajökull
22
The ultimate impact of an event depends both on pre-existing levels of vulnerability and on the response. Effects can be mitigated at three stages of a crisis: before (by reducing vulnerability), during (crisis response) and after (post-crisis response). Large events, such as ash clouds, hurricanes and earthquakes, involve all three key sectors – government, the private sector and civil society – with the interaction between them often affected, for better or worse, by the media. Each sector has a role to play in managing impacts, but which one takes the lead during each phase can vary by country. For example, during Japan’s Fukushima nuclear crisis, the private sector took the lead. During earthquakes in China, the government takes the lead. In the Mumbai floods of 2005, it was civil society that led the way.
When trying to reduce the impact of a disruptive event, vulnerabilities can be identified, and resilience improved, by examining how the three main sectors are projected to engage with risk before, during and after the crisis, and then working to address deficiencies. In places where the private sector is weak, governments can give support for business continuity planning. In areas where the private
sector is dominant, it can engage with civil society over potential regional risks, allowing them to become involved in contingency planning. In areas with strong commu-nities, civil society can organize grassroots paragovern-mental emergency units.
Transparency and clarity over why and how decisions are taken in a time of crisis are a critical issue for governments and the private sector alike. During a crisis, flexible and transparent processes are required to avoid the emergence of ad hoc structures with limited legitimacy, and to ensure that regulatory structures engage all key stakeholders while maintaining resistance to lobbying pressures. Post-crisis impact assessments could later help to establish – in particular for crises with cross-border implications – how risk uncertainty was handled; the basis of risk decision-making processes; and the conse-quences (positive and negative) for the environment, society and economy. This would help ensure continuous improvement in responses to future crises and, impor-tantly for public confidence, would also enhance the accountability of risk-based decisions.

www.chathamhouse.org
2323 House of Commons, Science and Technology Committee, ‘Scientific Advice and Evidence in Emergencies’.
24 See Columbia Journalism Review website: http://www.cjr.org/the_observatory/risk_reporting_101.php?page=all.
4. The Battle for the Airwaves
‘The Government must communicate risk effectively to the public
in an emergency; this is vital to prevent mistrust and anxiety.’
UK Parliamentary Science and Technology Committee23
Effective messaging and communication are highly important in the management of any national and global emergency or crisis. This is not a matter of public relations,
but one of maintaining credibility and legitimacy, which may in turn determine the effectiveness of actions taken to manage any current crisis and prepare for future ones. Political pressure can be used to hinder necessary public measures if authorities do not manage the communications battle. As discussed earlier, one consequence of globaliza-tion and interdependence is that crises, risk and uncertainty are far more likely to have international and transnational dimensions than would have been the case in the past.
Uncertainties of some kind are very likely to feature in any high-impact event, presenting communication activities throughout a crisis situation with both opportunities and serious challenges. The media attention brought about by any crisis provides an opportunity to inform the public on key scientific issues. However, risks and probability are notoriously difficult to communicate, whether on climate change, bird flu or terrorism threat levels. This will be particularly pronounced for genuine black swan events – but even well-known threats can pose major challenges for communication strategies.
Scientists deal with uncertainty every day, but for journalists and the general public it can be difficult to understand. Reporters do not often provide all the infor-mation required for the reader to assess a risk. Writing on the Columbia Journalism Review website, risk commu-nication consultant David Ropeik says of his time as a journalist, ‘Our reporting was inherently deficient because we just didn’t know that there are important details without which a story about a risk is simply incomplete.’24
In-depth explanations of the science and technology relevant to an event can help people assess the levels of uncertainty and risk involved in a situation, and what it means for them. But as the 2010 ash-cloud event revealed, scientists, weather forecasters, engineers and other experts need to be given a greater voice in the tradi-tional media. There is a strong case for the establishment of independent national or regional web-based services for up-to-date risk and science information in a crisis. These could be established by government and connected to critical scientific institutions that can be expected to play a role in future crises.
Key messages in this chapter
z Communicating risk and uncertainty during
emergency situations remains a critical challenge.
z Traditional media remain crucial in shaping public
perceptions during a crisis.
z More scientists and technical experts need to be
given a voice during a crisis to provide in-depth
assessments and analysis that can help decision-
making and risk management.
z In terms of the media, there is a limited window in
which the authorities can engage critical audiences.
Effective communication is paramount in the
hours and days immediately after a crisis breaks.
Communication style can also affect level of influence.
z Social media can provide an effective vehicle for
real-time communication to a broad audience
during a crisis, particularly if stakeholders are
engaged in the relevant social networks in advance
of an emergency.

www.chathamhouse.org
Preparing for High-impact, Low-probability Events: Lessons from Eyjafjallajökull
2425 The term ‘social media’ refers to the suite of tools and services that provide users with the ability to interact socially around a topic, activity or object.
Synonyms for ‘social media’ include ‘social tools’, ‘social software’ and ‘Web 2.0’.
26 Article available at http://gigaom.com/collaboration/crisis-communications-for-the-social-media-age/.
Communication serves multiple roles in a crisis situation and different stakeholders will have different priorities, including:
• coordinating responses among key stakeholders;• informing the general public and those directly
affected about the latest situation;• explaining and building confidence in decisions;• avoiding unnecessary public concern;• protecting brand image and customer or investor
confidence;• generating interest in a related policy issue (and in
some cases, promoting a product).
4.1 Crisis management in the age of social media25
In Crisis Communications for the Social Media Age, written for the technological website GigaOm, Aliza Sherman commented:
People want to see a human response to a crisis, not an overpro-
duced, formulaic or canned reply. When there is a crisis, there
are people involved. Pretending there are no emotions mixed
in the mess is a sure-fire way to lose credibility with others.26
This goes to the heart of a social media response to crises. This requires a different style of communication, which is often at odds with traditional communications or public relations techniques. For example, social media users expect an immediate acknowledgment of a problem, even if no solution is imminent.
The rise of the internet has changed not just the way in which the general public seeks and receives information but also its expectations of how official bodies should communicate. When big stories break, the traditional media are no longer the only source of information; the public can now easily supplement their reports with information directly from primary sources, as well as
analysis and opinion from a myriad of non-mainstream sources.
The internet cuts both ways, however, providing an opportunity for organizations and experts to commu-nicate directly with the public, in full and without mediation by journalists. This new media landscape changes the way public perception is shaped, allowing people to fact-check news sources against primary data or opposing opinions found online and use traditional media stories as jumping-off points for the discussion of an event or phenomenon.
Media narratives are often based on conflict – including false conflict. In theory, social media can provide a means to explore the issues in more detail and with greater clarity. If all the stakeholders involved in a situation are using social media, not only will they all be able to give their own point of view to the public, they will also have an opportunity to understand one another’s organizations more clearly, building their presence, reputation and network. Especially during crisis situations, social media offer a means to gauge the public reaction for all the stakeholders, from the government to the private sector. Such intelligence could help organizations to understand, in near-real time, what type of communication is effective, what additional infor-mation could be provided and which policy responses are likely to be effective.
The shift to a more open communication style can be challenging for many organizations, bringing both potential benefits of talking directly to their constituents but also new risks. Traditional methods of communication can be too slow to counter rumour and misinformation effectively.
Many of the organizations playing a key role in providing public information were not active participants in social media before the 2010 ash-cloud event. Stakeholders cannot expect to be granted trust purely through the strength of their existing brand. The use of social media space is more effective when the organization has a pre-established position within it, including linking with other organiza-tions that will be important during a crisis. An International SOS analysis found that during the 2010 crisis, pre-estab-

www.chathamhouse.org
The Battle for the Airwaves
25
27 International SOS, ‘Every Ash Cloud Has a Silver Lining’, 2010, http://internationalsos.fr/en/files/AshCloudBriefing.pdf.
28 Chris Heath, ‘Twitter vs Icelandic ash cloud: How one airline transformed its use of social media’, 2011, www.silicon.com/management/sales-and-
marketing/2011/06/23/twitter-vs-icelandic-ash-cloud-how-one-airline-transformed-its-use-of-social-media-39747616/#comments.
29 PR firm Edelman produces an annual survey which gauges attitudes about the state of trust in business, government, NGOs and media across 23
countries. The trust barometer is accessible from the company website: http://www.edelman.com/trust/2011/.
lished internal and external communication plans and channels were essential; and that in future they should be implemented as part of an organization’s overall travel policy and crisis management plans.27 It is possible to benefit from using social media in a crisis even with a new account but greater benefit is derived from established networks. Time is needed to build a network and to earn the trust of the community, but the level of activity is also important, as illustrated by Table 3.
One of the reasons why social media can be so powerful is that a service such as Twitter is not a single network, but a network of networks. This means that important infor-mation can ripple through the system, even if the origi-nator has a relatively limited network. Larger networks are, of course, more effective, but the critical mass required to get information out is lower in a group of interconnected networks than in a hub-and-spoke network such as a mailing list. KLM have estimated that customer-service agents working in the social media department are 75% more productive than those in call centres.28
Bloggers are likely to rely on information they find via the media or recommended to them by their social networks.
This is not because they do not trust official sources – if anything, the 2011 Edelman Trust Barometer29 shows that trust in academics and experts has risen to 70%, up from 62% in 2009, and trust in NGOs stands at 47%, up from 41% – but because they tend not to seek out official sources such as press releases. The medium of social media is, for many people, opportunistic and serendipitous. Instead of actively searching for information, its users wait to receive notifications and messages direct from those people in their networks.
4.2 Lessons for stakeholders
There is a window of opportunity to engage effectively during a crisis situation. Reacting slowly can cede control of the message to other stakeholders who have quite different interests. However, acting hastily without a clear strategy can affect credibility.
In many crises, not every type of organization is given equal space. When a crisis occurs, stakeholders have a number of potential audiences with whom they need to communicate:
Table 3: Organizations on Twitter and their network size/activity
Twitter account Date joined Followers Tweets
Britishairways 19 Oct 2007 99,533 2,223
Schipholairport 17 Jan 2009 2,321 17
Metoffice 21 Jan 2009 25,362 3,623
Heathrowairport 14 Feb 2009 45,464 7,491
Easyjet 8 May 2009 13,025 4,477
Ryanairnews 27 July 2009 3,248 245
Eurocontrol 11 Aug 2009 16,848 5,124
NATS_UK 18 April 2010 92 47
UK_CAA 21 April 2010 319 46
Dublinairport 17 Aug 2010 11,099 308
Source: Cambridge IP

www.chathamhouse.org
Preparing for High-impact, Low-probability Events: Lessons from Eyjafjallajökull
26
30 This was the experience of EUROCONTROL during the ash-cloud crisis which led it to reinforce its capabilities by the time the 2011 ash cloud
occurred. See, for example, Marc Wright, ‘How Twitter helped EUROCONTROL dispel the ash cloud travel crisis’, http://www.simply-communicate.com/
case-studies/company-profile/how-twitter-helped-eurocontrol-dispel-ash-cloud-travel-crisis.
31 The Knight Foundation, ‘Media, Information Systems and Communities: Lesson from Haiti’, 2010, http://reliefweb.int/sites/reliefweb.int/files/resources/
F156DD1E2F9D2D0085257815005DD82F-Full_Report.pdf.
32 Tom Davis et al., ‘A Failure of Initiative: Final Report of the Select Bipartisan Committee to Investigate the Preparation for and Response to Hurricane
Katrina’, Congressional Reports: H. Rpt. 109-377, US Government Printing Office, 2006, p. 163.
• the general public;• other stakeholders;• the media;• volunteers and workers on the ground;• volunteers and workers in remote locations.
The traditional media remain critical in shaping the public perception in any major crisis. In the case of the 2010 ash cloud, the Chatham House analysis showed that the travel industry as a whole dominated the traditional media conversation, swamping the voice of scientists and air traffic control. The preference for quotes from the travel industry was evident across all publication types, but was especially apparent in the tabloids, in which nearly half of all quotes came from travel industry sources. The tabloids quoted regulators such as the CAA only 5% of the time, but were more likely to quote science sources (12%). Broadsheets and UK national news outlets put less emphasis on weather sources (9% for both), and broad-sheet and regional outlets quoted fewer air traffic control sources (6% and 8% respectively).
Despite the dominance of the travel industry in tradi-tional media coverage, bloggers chose not to repeat those quotes, but to focus on primary data from weather sources, FlightRadar24.com, or to quote scientists and regulators. Although the sample used in our analysis is small, this indicates an opportunity for the producers of primary data to engage directly with the public, and shows that such data will find a receptive audience.
Stakeholders who engage with social media have the opportunity to forge relationships not just with their own communities but also with each other. These relationships, which begin online, can prove invaluable in times of crisis. While challenges are presented by the culture of top-down, closed communication that is common to many organiza-tions such as government or the military, openness and the liberal sharing of information are required for collaboration
to be effective during a crisis. A shared vocabulary is needed for communications to be effective, and all parties need to understand fully the new tools and techniques, and how to implement them. These conversations not only give the public a chance to find out what is happening, but also provide them with an opportunity to weigh what they are reading in the media against what they have learnt from their own interactions with an organization. This can be very useful when a stakeholder organization comes under attack in the media from other agencies.30
In the case of the earthquake in Haiti in 2010, it was found that it was individuals within larger organizations who were knowledgeable about and implemented the use of cutting-edge disaster communications.
For example, Craig Clarke, a civilian analyst for the US Marines, used social media to support marines on the ground. According to the Lessons from Haiti report:
There were no systematic technology-based connections
between the media activists and the military or the large
humanitarian organizations. Contacts between media
activists and the Coast Guard and the Marines, took place
on an isolated, ad hoc basis, through personal connections.31
While stakeholders need a plan for communications that includes the full spectrum of media options, they also need a plan for times when communications systems are compromised.
Recent crises have shown that modern communications networks can be fragile and lack redundancy. For example, massive inoperability – failed, destroyed, or incompatible communications systems – was identified by the US Congress inquiry as the biggest communications problem in the response to Hurricane Katrina.32 In serious disasters, older communications systems may be needed as backup.
In the early stages of a crisis, social media may be a strong tool for disseminating information. Social media are not,

www.chathamhouse.org
The Battle for the Airwaves
27
however, a guaranteed recipe for communications success. Information quality and consistency can vary substantially, particularly when the number of experts, government agencies, businesses and other key stakeholders engaged and active remains unbalanced.
As with other forms of communication, organizations can learn a lot from measurements taken regularly before
(in a non-crisis environment) as well as during and after a crisis. For example, it is important to know which social media tools proved effective, whether information assets were reused, and if so where. Most critically, it is important to know how the communications were relayed by others. This knowledge can be used to further refine the crisis communication strategy.
Box 10: Shaping the debate during the 2010 ash-cloud eventa
In the case of Eyjafjallajökull, the travel industry as a whole dominated the traditional media conversation – or the
public narratives – with 37.5% of the quotes, swamping the voice of scientists (6.9%) and air traffic control (9.2%).
This was due to a wider range of travel industry organizations being quoted – 62 in total, as opposed to 13 science
organizations and five air traffic control organizations. Even though many of the travel industry representatives were
quoted only once, collectively they overwhelmed other voices.
The traditional media’s bias towards covering the story primarily from a travel industry perspective diminished the
opportunity for the public to form a well-rounded understanding of events. Not only were scientists’ voices marginalized,
but the focus on consumer travel obscured other disruption such as the ability to deliver organs for transplants and
supply-chain issues for companies reliant on air freight. This made it harder for businesses and members of the public
to assess levels of risk and plan accordingly.
Throughout the eruption, the Icelandic Met Office (IMO) provided copious data in English, including earthquake
maps,b tremor datac and regular updates on the eruption, but these went largely unused by traditional media.d This
stands in contrast to the blogging communities. For example, Erik Klemetti, assistant professor of geosciences at
Denison University, Ohio, and writer of the blog Eruptions, used such data along with information from many other
sources to help explain the event to his readership.e Klemetti’s community was itself very active in his blog’s comments,
locating primary sources and answering one another’s questions.
Other volcanologists and geologists took part in the online discussion on the eruptions, alongside enthusiastic
amateurs and people with no background knowledge at all. The result was a very well-informed community capable
of understanding some of the more obscure information produced by the primary sources. Many community members
learnt a great deal of science by engaging with the event via blogs and communities of this type. Indeed, Klemetti’s
blog is an exemplary model of science communication.
Despite the opportunities afforded by easy access to both data and expertise, the traditional media did not often
examine in depth the more complex issues that the eruption brought to light. The traditional media also did not use
visual aids such as graphics, diagrams or visualizations to help explain what was happening and why. Part of this may
be a simple lack of scientific understanding in the major news outlets, or it could be the assumption that the public
has no interest in looking ‘under the hood’ of scientific events. The popularity of quality science blogs indicates,
however, that there is an appetite for such analysis.
a Analysis and data in this box supplied by Suw Charman-Anderson, 2010.
b Live data available at the IMO website: http://en.vedur.is/earthquakes-and-volcanism/earthquakes/myrdalsjokull/.
c Live data available at the IMO website: http://hraun.vedur.is/ja/englishweb/tremor.html.
d Rolling updates available at the IMO website: http://en.vedur.is/earthquakes-and-volcanism/articles/nr/1884.
e Klemetti’s biography available at: http://personal.denison.edu/~klemettie/Welcome.html. His blog is now at http://bigthink.com/blogs/eruptions, but
during the eruption was hosted at http://scienceblogs.com/eruptions/.
www.chathamhouse.org
Preparing for High-impact, Low-probability Events: Lessons from Eyjafjallajökull
28
33 In this report, the terms ‘mainstream media’ and ‘traditional media’ refer collectively to newspapers, TV broadcasters, radio stations, their respective
websites, and the websites of newer news organizations that follow a traditional model.
34 Suw Charman-Anderson, ‘Making the Connection: Civil Society and Social Media’, Commission of Inquiry into the Future of Civil Society, Carnegie UK
Trust, 2010, available at: http://suw.charman-anderson.com/files/Published-Makingtheconnection.pdf.
Mainstream media (MSM) also help to shape messages in the social media sphere.33 However, although the Chatham House analysis shows that MSM were a significant player in the ash-cloud case, others were more dominant online. The influence of MSM is likely to be more subtle: they may influence their audience’s ideas, which are then inter-preted and translated into social media. At the same time, news from the ground (e.g. by tweets from friends) can challenge the MSM picture. It would also be beneficial for stakeholders, as a group, to benchmark their metrics, agreeing a suite of tools for web and social media analysis and sharing data, so that each organization understands more clearly the online landscape in which it is working and the nature of the community within which it is partici-pating under normal conditions.
It should be noted that there is very little information available about how the public uses the internet, social media and email. In the UK, for example, both Ofcom and the Office for National Statistics produce general infor-mation, but the more focused research needed to inform the kinds of online communications strategies that are required is simply not being carried out. The creation of a global Internet Institute to carry out original quantitative and qualitative research has been recommended previously, in Carnegie UK Trust’s report Making the Connection: Civil Society and Social Media.34 This would make even more sense at EU level: an independent body, focusing not just on issues of the moment but also on longitudinal studies providing data on trends and variations, would be inval-uable to government, business and NGOs alike.

www.chathamhouse.org
29
5. Conclusions and Policy Implications
Strengthening processes and transparency
Recent events, such as Hurricane Katrina, Deepwater Horizon and the nuclear reactor meltdowns at Fukushima, have called into question whether policies and regulations currently reflect the real risks (and the real cost) associated with high-impact, low-probability events. With growing environmental and resource pressures, incorporating costs of externalities should be a priority in preparing and responding to crises, factoring in potential costs related to accidents and disasters. Moving forward, industry bodies and safety regulators need to work in coordination with governments, business and the science community to review risk-assessment practices in critical infrastructure sectors in the light of worst-case scenarios. Although the precise nature of HILP events cannot always be known in advance, there are a limited number of cross-cutting responses to the consequences of a crisis (mass evacuation and treating sick people, for example) compared with hundreds of potential risks. It can therefore be counter-productive to focus only on event or sector specifics – although for some types of risk, highly specific technical and engineering capabilities remain essential. Robust but adaptable structures for coordinated decision-making are crucial because when stakeholders make different judgments about risk during a crisis public confidence can be rapidly eroded. Sharing best practice and, where relevant, capacity, especially across sectors, and red-teaming HILP scenarios with key decision-makers – focusing in particular on critical sectors such as transport and communications –
will be essential to enhance preparedness in coping with the unexpected.
Although uncertainties will remain a common feature of HILP events, decision-making should as far as possible be based on scientific and technical evidence. Links between national scientific advisers and national civil contingency agencies – before, during and after an event – should be strengthened, and the transparency of risk-based decisions should be enhanced. Mandatory post-crisis impact assess-ments would be a step in the right direction – to consider how crisis decisions were taken; the basis of risk decision-making processes; and the consequences (positive and negative) for society, the economy and the environment, with a particular focus on vulnerable communities.
Evidence from many HILP events of the last decade indicates that impacts are felt unevenly across the world, with the most vulnerable and poorest communities dispro-portionately at risk. Governments need to work with and alongside civil society organizations to ensure that the needs of vulnerable communities are identified and are properly considered across the full crisis planning and response cycle (before, during and after). Pre-emptive strategies to reduce vulnerability to shocks before they occur are likely to include social protection, disaster risk reduction and climate adaptation. During crises, arrange-ments should be made for the real-time identification of particularly affected social groups or countries, and for the rapid disbursement of financial and practical support where national organizations are unable to cope or where the consequences are cross-border in nature. After crises, policies to help the worst-affected groups recover and build back assets should be prioritized.
Stepping up communications in a crisis
Communicating during a crisis poses a dilemma for many stakeholders, particularly when uncertainty abounds, and especially for scientific agencies and government departments. There is a limited window in which stake-holders can engage effectively during a crisis – delay risks ceding the public discussion to noisier voices – but inaccurate or poorly handled communications can

www.chathamhouse.org
Preparing for High-impact, Low-probability Events: Lessons from Eyjafjallajökull
30
undermine legitimacy during the event and long into the future. For example, the Japanese government came under intense criticism for a perceived slow and non-transparent response to the nuclear disaster, particularly in terms of communicating with the public.
The availability of consistent, accurate and reliable information is one of the cornerstones of effective crisis management. During crises, information changes quickly and different types of information are needed at different stages as events unfold. To facilitate effective information flows, there should be independent, high-quality hubs (national or regional) for up-to-date risk notification and provision of scientific information in a crisis, supported by governments, businesses and industry. These one-stop centres should be created to aggregate information and advice from official sources with information provided by individuals via social media networks. This would become known in advance as the go-to place in a crisis for stake-holders, with enhanced capacity to meet huge increases in traffic during a crisis.
Social media and other information and communi-cation tools will continue to play even larger roles in crisis management and preparedness. Microblogging sites like Twitter, blogs and social networking sites allow the transmission of critical information to a broad audience in real time, speeding up communication (as well as misinformation) and increasing awareness across the board. Tools are needed to enhance and streamline the use of social media in ways that are tailored to major events – for example, to aggregate social network messages in a manner relevant to different stakeholders or to solve analytical challenges rapidly with crowdsourcing.
Individual organizations, such as regulators and government bodies, should also step up planning for communications in a crisis, including establishing a robust website (for example, a ‘dark site’ prepared in advance but only made available to the public when a crisis hits). Research for this report shows that cultivating networks on social media long in advance of a crisis can be decisive in ensuring the successful communication of key messages.
National science institutions should work together to develop, strengthen and promote effective guidelines for
the communication of scientific and risk-related infor-mation for media and science institutions during a crisis, reflecting the new opportunities and challenges presented by social media.
Enhancing business resilience and responses to shocks
Greater globalization and a lack of sufficient preparation for HILP events create vulnerabilities for both the global economy and individual businesses. An important first step for businesses is to review the vulnerability of their business models to high-impact, low-probability events. This includes cost-benefit analysis of options such as shifting to regional hubs and storage centres for non-perishable goods to avoid urgent intercontinental trans-portation. As the ash-cloud incident indicated, transport risks are often more difficult to overcome for perishable goods trade. But in some instances, different packaging and storage methods may permit delivery by land and sea instead of air. Regional airfreight hubs might reduce some risks but would raise distribution costs. Indicators of business resilience should be developed that can actually be audited or reported on and passed on to stakeholders or the stock market, to bolster incentives for investing in resilience.
However, increasing business resilience goes beyond ensuring continuity despite significant disruption, or quick recovery from a crisis. It is also about protecting profit margins and being better placed than competitors to capitalize on game-changers, such as disruption to transport networks. The private sector, supported by governments, needs to invest additional resources in training and investment in holistic ‘business resilience’ planning, especially for small businesses. Rapid and broad take-up of a new international standard for preparedness and continuity management systems for organizations (ISO 22301), due to be published in spring 2012, is also essential, particularly among small and medium-sized enterprises (SMEs). Governments should support the creation of networks of SMEs to share best practice. In parallel, governments could also promote the ISO mark

www.chathamhouse.org
Conclusions and Policy Recommendations
31
across industry and the public. This would help ensure that adopters achieve a competitive advantage by demon-strating a commitment to robust business continuity management.
Although state aid can fulfil a vital role in alleviating paralysis during and immediately following an event, concerns remain around issues of anti-competitiveness legislation and market distortion. Governments should work with the insurance industry to set up a global pooling system for reinsurance to address future disruptive events and review existing arrangements regarding the provision of state support to businesses during HILP events.
Creating a multi-disciplinary reference library around HILP events and their impacts would allow analysts to systematically build up a record of observations that can help quantify the impacts and, by analogy, similar risks that might arise in the future. Mistakes made in impact studies can be used to improve future assess-ments, creating a more reliable reference system to provide faster and more accurate analysis when faced with recurring events, and to improve policy planning. Arrangements for government support (state aid) to businesses during high-impact, low-probability events should also be reviewed.

www.chathamhouse.org
32
Appendix 1: Acronyms
ANSP Air Navigation Service ProviderCAA Civil Aviation AuthorityCANSO Civil Air Navigation Services OrganisationCCS Civil Contingencies SecretariatCOBRA Cabinet Office Briefing Room (Alpha)DFS Deutsche Flugsicherung (German Air Navigation Service Provider)DGAC La Direction Générale de l’Aviation Civile (French Directorate General for Civil Aviation)DLR Deutsches Zentrum für Luft- und Raumfahrt (German Aerospace Centre)DSNA La Direction des Services de la Navigation Aérienne (French Air Navigation Services Branch)DWD Deutscher Wetterdienst (German Met Service)EASA European Aviation Safety AgencyFAA Federal Aviation AdministrationFCO Foreign & Commonwealth OfficeFEWS NET Famine Early Warning Systems Network GDACS Global Disaster Alert and Coordination SystemHILP High-Impact, Low-Probability IATA International Air Transport AssociationIAVW International Airways Volcano WatchICAO International Civil Aviation OrganizationIFALPA International Federation of Airline Pilots' AssociationsIMO Icelandic Met OfficeISAVIA Icelandic CAA and Airport OperatorISO International Organization for StandardizationIVATF International Volcanic Ash Task ForceLBA Luftfahrt-Bundesamt (German Civil Aviation Authority)MSM Mainstream MediaNACME National Airspace Crisis Management ExecutiveNAT North Atlantic (referring to region of North Atlantic airspace)NATS National Air Traffic ServicesNFZ No-Fly Zone OCHA Office for the Coordination of Humanitarian Affairs (UN)OEM Original Equipment ManufacturerOSOCC On-Site Operations Coordination CentrePSA Probabilistic Safety AssessmentSAGE Scientific Advisory Group in EmergenciesSARS Severe Acute Respiratory SyndromeUNISDR UN International Strategy for Disaster ReductionUSGS US Geological SurveyUSHHS US Department of Health and Human ServicesVAAC Volcano Ash Advisory CentreVATF Volcanic Ash Task ForceWHO World Health OrganizationWMO World Meteorological Organization

www.chathamhouse.org
3333
Appendix 2: Methodology
This report examines the impacts of the ash cloud and the response of stakeholders. It seeks to draw out the lessons from the Eyjafjallajökull eruption – a relatively ‘benign’ high-impact event – for other global threats such as pandemics, terrorist attacks, a radiological event or fuel crises. While different types of events do of course have unique characteristics, they share three fundamental aspects. First, they have the potential to disrupt the international economy and the ability of national governments to respond. Second, in preparing for and responding to these threats, governments, businesses and other stakeholders face significant scientific and other uncertainties. Third, the potential impacts are greatly amplified by the nature of our interde-pendent world. Additionally, in most instances worst-case scenarios can only be addressed through action at the transnational level, be it via govern-ments or along critical supply chains.
Table A1: Methodological components
Research component
Summary of research activity Risk governance and preparedness
Contest over science, uncertainty and legitimacy
Mapping the impacts
Battle for the airwaves
Formal interviews
Interviews with high-level decision-makers in key stakeholder organizations and other informal discussions. This included regulators, civil servants, scientific bodies and businesses.
Survey of businesses
Over 40 organizations responded to our survey of the impacts, responses and lessons from the ash cloud. The survey was circulated to over 300 firms (see Appendix 2 for respondents).
Economic and social analysis
An assessment of the economic consequences of high-impact events – and specific economic analysis of the cost of the ash cloud to key sectors (see Appendix 4). A related piece of research considered the social impacts of the ash-cloud event.
Trade and supply chain analysis
Systematic review of EU trade data to identify goods that are largely air-freighted (and therefore vulnerable to a disruption to aviation) and goods that were severely affected in the ash-cloud event.
Institutions and decision-making mapping
Desk-based mapping of institutions, their linkages and decision-making processes (see Appendix 5). This was tested and refined following the interviews. This component also explored approaches to civil contingencies planning and risk management by governments and businesses.
Communications and public perception
Comprehensive mapping exercise to analyse the media and public response to the ash-cloud event, based on an assessment of public communications and the role of (social and traditional) media in shaping public perception and responses.
Research was conducted between June 2010 and April 2011. The research methodology is reflected in the four analytical chapters of the report: risk governance and preparedness; mapping the impacts of the event; the contest over science, certainty and legitimacy; and the battle for the airwaves. Each of these analytical dimensions was explored using four or five separate but overlapping research components, ensuring that information could be triangulated, cross-referenced and reinforced and discrepancies identified. Table A1 shows the links between the key research components and the analytical chapters.
The methodology for the project combined desk-based research with interviews, a survey and systematic data analysis. The mapping of the key insti-tutions at European and national level and their decision-making processes continued throughout the project, drawing on the interviews and the survey.
High-level decision-makers from key organizations and institutions involved in the ash-cloud event were interviewed between August 2010 and January 2011. Questions covered scenario and contingency planning before the event; how the event unfolded; key institutional linkages; communica-tions strategies; and priorities for the future. Semi-structured interviews were held with representatives of the UK Met Office, the UK Cabinet Office (Civil Contingencies Secretariat), the European Commission, the UK Civil Aviation Authority, Eurocontrol, the Confederation of British Industry and a prominent global engine manufacturing company. Informal discussions were also held with a range of companies and other stakeholders throughout the project. Two major airlines and two national air traffic control agencies including UK NATS fed information to the project via our survey.
www.chathamhouse.org
Preparing for High-impact, Low-probability Events: Lessons from Eyjafjallajökull
In October 2010 a confidential survey was sent to over 300 small and medium-sized enterprises (SMEs), global corporations and trade associa-tions (see Appendix 3). The recipients were asked to outline the impact of the volcanic disruption on their operations – both negative and positive – and their respective responses. Out of the 40 responses a large proportion came from aviation, transport and food sectors as well as government and regulatory bodies. Critical questions included what could be learned from the ash-cloud episode in terms of vulnerability and resilience; how critical supply chains were affected; what would have been the consequences if the ash cloud had persisted; and how information was communicated.
A detailed review of previous economic studies of high-impact events (such as avian flu, SARS, Hurricane Katrina) was conducted to explore how the economic impacts of a high-impact, low-probability event can be measured (and what cannot be measured) and how impacts tend to flow across the economy via critical sectors. The research team also assessed the specific economic impacts of the ash-cloud event and what would have happened if it had persisted. This focused on the key industries (aviation, other transport, perishables, pharmaceuticals, high-value electronics, service industries etc.). This analysis was reinforced with a separate exercise drilling down into EU import and export data to identify which products were affected by the ash cloud and the extent to which high-value intermediate goods are air-freighted.
In order to understand how information was communicated by key stakeholders during the crisis – and the response of the public – a comprehensive analysis of public responses and communications during the event was undertaken by Cambridge IP. This was based on an assessment of public commu-nications and the role of (social and traditional) media in shaping public perception and responses. A bespoke web search and indexer was constructed to intelligently mine information from blogs, news sources, twitter and other sources. This resulted in a database of 87,202 records from which additional analysis was undertaken. In parallel, a separate piece of analysis was supplied by social media expert Suw Charman-Anderson. This examines the role of the media and lessons for communications strategy related to the ash cloud and other events, and systematically considers the flow of information between key media outlets and key stakeholders.
34

www.chathamhouse.org
35
Appendix 3: Chatham House Survey – Questions and Responses
A short confidential survey aimed at businesses - from SMEs to global corporations - trade associations and unions was circulated to over 300 contacts.This provided an opportunity for companies to explain both negative and positive impacts of the volcanic disruption on their operations, and how they responded. In total there were 40 responses to the survey, with a large proportion coming from aviation, transport, and food sectors as well as government and regulatory bodies.
Chatham House Survey
The eruption of Icelandic volcano Eyjafjallajökull in April 2010 resulted in an unprecedented disruption to air transport, especially in Europe. A major new Chatham House project is analysing the impact of the event and asking what we can learn about managing future shocks to international supply chains.
This short (around 5 minutes) confidential survey is an opportunity for companies to explain the impact on their operations – both negative and positive – and how they responded. The survey results will be fed into high-level discussion with policy-makers and business leaders during early 2011.
The survey is aimed at senior representatives from businesses – from SMEs to global corporations. We also welcome the participation of other organisations (for example, trade associations, trade unions and NGOs).
Critical questions include: what can we learn from this episode in terms of business flexibility and resilience? How robust are critical supply chains? How well did decision-makers perform as events unfolded? How effective were the lines of communication between businesses, policy-makers and others? How were key decisions taken and were they correct?
All submissions will be handled sensitively and securely – and you can choose to exclude all details specific to your company from any published analysis (see next page).
For further information on the project please see www.chathamhouse.org/ashcloud.
Q1: Please complete the following details to allow us to validate your response. An email address is required so that we can confirm the submission is authentic.Your personal details will be held confidentially and will never be supplied to third parties.
Your name: _______________________________ Company: _______________________________Job Title: _______________________________City/Town: _______________________________ Email Address: _______________________________
Q2: A concise summary of the survey results will be prepared for partic-ipants. Would you like to receive this?
� Yes � No
Q3: Please tell us how to handle your submission (answer required):
Full anonymity – no specific reference to my company/organisa-tion will be made in any publications/project output Please check with me before making any specific references about my organisation (no reference will be made without prior permission) Feel free to refer to my company/organisation and job role in publications and project outputs based on my survey responses
Q4: Which sector(s) does your company/organisation operate in?
� Air travel/transport � Finance � Food � Government/Regulation � Health
� Heavy industry � Information &
Communications Technology
� Insurance
� Manufacturing � Retail � Tourism
� Transport/logistics � Other (please specify)
Q5: How would you describe the organisation you represent?
� Private company � Public limited company � Trade association � Public sector/state-owned
enterprise
� Not-for-profit � Other (please specify)
Q6: What is your primary focus within the organisation?________________________________________________________________________________________________________________
Q7: Please specify how the event affected your organisation, positively or negatively, in the following areas.++++ indicates an extremely positive impact, – – – – indicates an extremely negative impact.
� Profits/revenue � Public image/reputation � Supplier relations � Customer relations � Demand for goods and
services
� Health and safety � Human Resources � Insurance cover
Q8: How long did it take for you to return to business-as-usual?
� Less than one week � Less than two weeks � Less than one month
� More than one month � Other (please specify)

www.chathamhouse.org
Preparing for High-impact, Low-probability Events: Lessons from Eyjafjallajökull
Q9: If the disruption to air travel had persisted, how much longer would your operations have been able to continue without serious disruption?
� 1–2 days � 3–7 days � 1–2 weeks
� 2–4 weeks � more than one month � N/A
Q10: What actions did your organisation take during the event in the following areas? (please describe)
� Profits/revenue � Public image/reputation � Supplier relations � Customer relations � Demand for goods and
services
� Health and safety � Human Resources � Insurance cover
Q11: How effective were your organisation’s systems in managing the impact on the following areas? 1 = not effective, 4 = highly effective
� Profits/revenue � Public image/reputation � Supplier relations � Customer relations � Demand for goods and
services
� Health and safety � Human Resources � Insurance cover
Q12: Has the event caused you to make changes to your business strategy? (Please describe)
Q13: After the initial eruption, roughly how long was it before your organisation received targeted information/advice from the following:
� Regulators � Government � Industry organisations
� International bodies � Other (please specify)
Q14: During the event, how did your organisation communicate key messages to the following? (you can select more than one)
Company website | Bulk email | Advertising | Social networks | Comment pieces/articles | Other
� Consumers � Government/regulators � General public
� Industry � Other (please specify)
Q15: Did you receive targeted information for your industry from regu-lators or government? Please describe:________________________________________________________________________________________________________________
Q16: How well did these different types of stakeholders perform during the event from the perspective of your industry – in terms of a) deci-sion-making and b) communications
Decision-making performance:1 2 3 4 N/A(1 = very poor performance, 4 = very good performance)
� Scientific bodies � Regulators � Government – home � Government – other
national
� European Commission � Media � NGOs � Trade unions � Private enterprise
Communications performance:1 2 3 4 N/A(1 = very poor performance, 4 = very good performance)
� Scientific bodies � Regulators � Government – home � Government – other
national
� European Commission � Media � NGOs � Trade unions � Private enterprise
Q17: What improvements, if any, could be made to the approach of regulators/policy-makers for a high-impact event such as the volcano?________________________________________________________________________________________________________________________________________________________________________________________________________________________________
Q18: Anything else you want to tell us?________________________________________________________________________________________________________________________________________________________________________________________________________________________________
Q19: Would you like us to contact you again/invite you to a workshop about this?________________________________________________________________________________________________________________________________________________________________________
36
(1) GDP loss = a (XS) + b(CDIS) + c (XG) + d(I) + e (C-CDIS) + f(GC) – g(MS) – h(MG)

www.chathamhouse.org
37
Appendix 4: Measuring the Economic Costs of a High-impact Event: the Stylized GDP Model
This appendix sets out a methodology for estimating the economic impact of extreme events, as developed and applied by Vanessa Rossi in Chapter 2 of the report.
We can derive an estimate of the overall economic impact of an event risk by summing up the varying losses across the various expenditure compo-nents of GDP. Adopting a simplified form of ready reckoner and grouping terms by their typical responsiveness to general shocks, the overall effect on GDP for each period can be summarized as:
where CDIS is the discretionary part of consumption (and may be further disaggregated according to the shock being examined, say into travel and tourism versus other) while C is total consumption. XS and XG are exports of services and goods, MS and MG are imports of services and goods. I is total economy investment, which could be further subdivided into business (IB), housing (IH) and infrastructure (II) investment depending on the nature of the shock. GC is government consumption spending (which tends to be relatively static except in cases where political changes are part of the shock). All these variables are the ex-ante values of the expenditure components (i.e. either the current data or, preferably, the forecast values prior to the shock for the period of the shock).
The coefficients (a, b, c etc.) are all functions of a suitable scalar (S) for the specific shock, which may be the percentage of the population, companies or transport routes affected by the shock (scale factors therefore pick up the intensity and spread of the risk) and other factors such as sentiment, which may be high in the case of the international disruption of transport services or infectious diseases but low if the threat is highly localized or very slow developing, such as erosion of coastline or skin cancers).
For example a = function (S, sentiment, other factors)The coefficients increase as S rises. This form of simplified loss function separates the ‘fast response’ (typically volatile) sectors from the slow to change – we would generally expect to
see rapid large losses in XS and CDIS, for example, but very little response from non-discretionary consumption (C-CDIS) unless the shock were to be specific to the non-discretionary sector (e.g. in the case of food shortages). We might expect coefficient f to be close to zero except for policy responses – in some cases, government spending GC could increase as an offset to a negative shock (f would be negative). Some coefficients may be similar (e.g. coefficients a and b) but we expect coefficients a and b to be most often larger than c and d and considerably larger than e.
The most rapid and large impacts come from CDIS, the most critical factor along with the estimate of b, which is a scale factor between zero (no losses) and one (all existing CDIS is lost as consumers cut back spending). The other terms will typically be relatively small over one year but losses would mount in following years under a prolonged shock.
We may reasonably assume that total CDIS is at least 10% of world GDP (if only based on the scale of luxury goods sales and the travel and tourism sector), possibly as much as 30% of GDP for the wealthiest countries. A serious threat from an event such as a pandemic could rapidly decay this component of GDP – at the limit all of the international component of such spending could disappear during a prolonged incident such as a dangerous infectious disease outbreak or severe security threat. The statistics highlight just how substantial is the risk to the global economy from shocks impacting on CDIS.
The equation also highlights the offsetting influence of imports on GDP. In theory, if imports change faster than exports, GDP might rise in response to a negative shock – this would not really happen, however, as job losses and consumer reactions would still create cuts in CDIS and other GDP compo-nents. Nevertheless this point does highlight the fact that the equations above are only valid for country analysis (and reveal the relative importance of net trade and the proportions of each component in each country’s GDP). They are not valid at the level of global GDP (as export and import losses have to be equal by definition, cancelling each other out).
At the global level with trade netted out, and assuming GC is broadly unchanged, then we can simplify (1) as the sum of the fast-response, slower and very slow-moving expenditure functions:
The schematic equation outlined above crudely illustrates the way in which GDP losses are built up and the importance of the structure of GDP in any analysis – the scale of the incident (S, influencing b, d and e) is crucial but so is the proportion of CDIS in GDP (as well as XS for individual country estimates of GDP losses). Using the existing proportions of each expenditure component prior to the shock, then (2) can be rewritten as (3) below:
Thus the impact on GDP becomes a weighted average (weighted by GDP shares) of the reaction speeds of each of the three types of expenditure b, d and e (all between zero and 1): b is high, possibly above 0.5, d is low and e is virtually zero in the first year. These parameters vary over time and are all functions of the type and scale of shock.
(1) GDP loss = a (XS) + b(CDIS) + c (XG) + d(I) + e (C-CDIS) + f(GC) – g(MS) – h(MG)
(Fast response variables)
(Slower response variables)
(Very slow response variable)
(Policy reaction – may be 0)
(Correlated withother variables)
(2) Global GDP loss = { b(CDIS) + d(I) + e(C-CDIS) }
(3) Global GDP loss = { b(s1 GDP) + d(s2 GDP) +e(s3 GDP) } = (b*s1 + d*s2 + e*s3) GDP
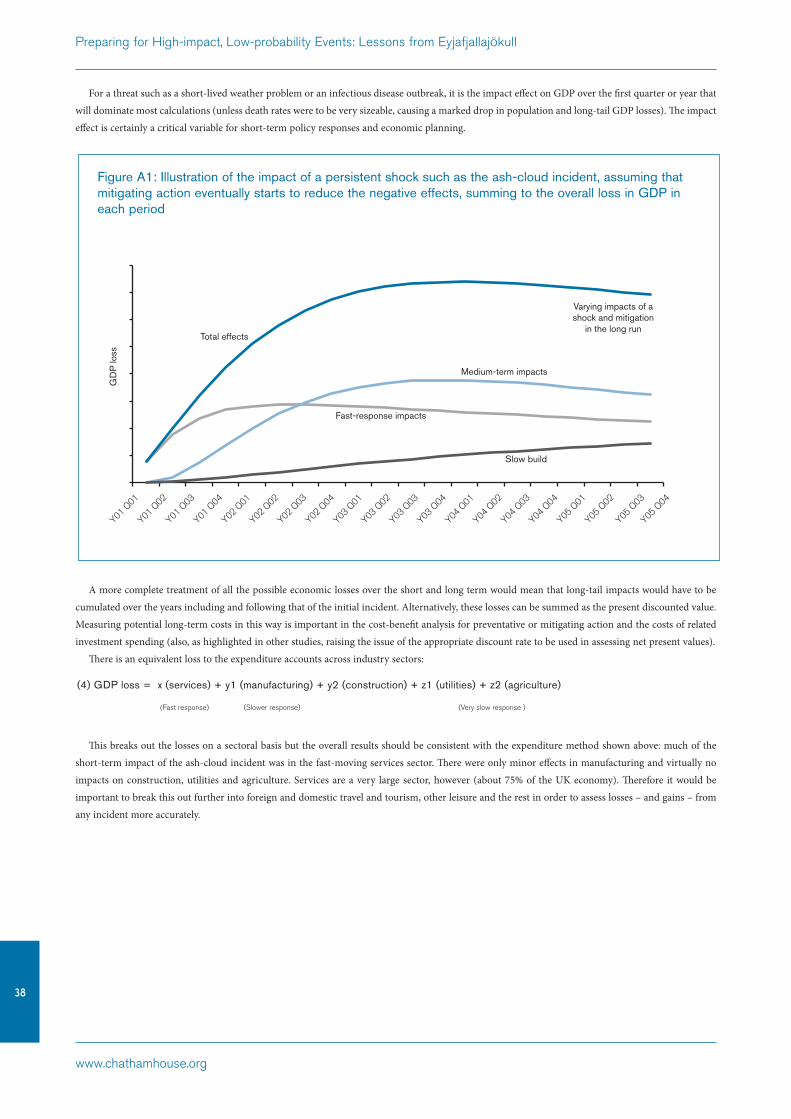
www.chathamhouse.org
Preparing for High-impact, Low-probability Events: Lessons from Eyjafjallajökull
For a threat such as a short-lived weather problem or an infectious disease outbreak, it is the impact effect on GDP over the first quarter or year that will dominate most calculations (unless death rates were to be very sizeable, causing a marked drop in population and long-tail GDP losses). The impact effect is certainly a critical variable for short-term policy responses and economic planning.
A more complete treatment of all the possible economic losses over the short and long term would mean that long-tail impacts would have to be cumulated over the years including and following that of the initial incident. Alternatively, these losses can be summed as the present discounted value. Measuring potential long-term costs in this way is important in the cost-benefit analysis for preventative or mitigating action and the costs of related investment spending (also, as highlighted in other studies, raising the issue of the appropriate discount rate to be used in assessing net present values).
There is an equivalent loss to the expenditure accounts across industry sectors:
This breaks out the losses on a sectoral basis but the overall results should be consistent with the expenditure method shown above: much of the short-term impact of the ash-cloud incident was in the fast-moving services sector. There were only minor effects in manufacturing and virtually no impacts on construction, utilities and agriculture. Services are a very large sector, however (about 75% of the UK economy). Therefore it would be important to break this out further into foreign and domestic travel and tourism, other leisure and the rest in order to assess losses – and gains – from any incident more accurately.
(4) GDP loss = x (services) + y1 (manufacturing) + y2 (construction) + z1 (utilities) + z2 (agriculture)
(Fast response) (Slower response) (Very slow response )
Figure A1: Illustration of the impact of a persistent shock such as the ash-cloud incident, assuming that mitigating action eventually starts to reduce the negative effects, summing to the overall loss in GDP in each period
Total effects
Fast-response impacts
Slow build
Medium-term impacts
Varying impacts of a shock and mitigation
in the long run
Y01 Q02
Y01 Q03
Y01 Q04
Y02 Q01
Y02 Q02
Y02 Q03
Y02 Q04
Y03 Q01
Y03 Q02
Y03 Q03
Y03 Q04
Y04 Q01
Y04 Q02
Y04 Q03
Y01 Q01
Y04 Q04
Y05 Q01
Y05 Q02
Y05 Q03
Y05 Q04
GD
P lo
ss
38

www.chathamhouse.org
39
Appendix 5: Agencies and Institutions Involved in an Ash-cloud Crisis (Selected Countries) and Decision-making Linkages during the Ash-cloud Event
Phase I: Sticking to the international protocols (the IAVW)In Phase I the focus was on the application of internationally agreed procedures for monitoring and reporting ash. Rather than allowing airlines to make the call on safety, aviation regulators chose to close air space where scientific modelling indicated ash was present at any concentration. Airspace was closed rapidly across northern Europe following the major ejection of ash into the atmosphere on 14 April 2010. Countries and agencies would have been justified in claiming they were ‘aware and prepared’ for an ash cloud at this point – only as the event dragged on were the limits of the preparedness revealed.
The global system for monitoring and advising on the presence of atmospheric ash, the International Airways Volcano Watch (IAVW), is symbolized within the first sphere of Figure A3. This critical infrastructure aided the exchange of intelligence between a number of stakeholders throughout the event. The IAVW was established in 2002 by the International Civil Aviation Organization (ICAO – a United Nations Technical organization), in conjunction with the World Meteorological Organization (WMO).
The London Volcanic Ash Advisory Centre (housed within the UK Met Office) took a lead role, issuing advice on the location of ash every six hours. National civil aviation authorities (responsible for aviation safety) and air traffic control services (which have the operational responsibility for controlling air space) used advice from the London VAAC to inform decisions on whether airspace should be restricted. Initially, the approach taken by regulators was to restrict airspace wherever analysis from the London VAAC predicted the presence of ash in a given location (at any altitude).
The airlines were informed of air space restrictions by air traffic control. An alternative approach, preferred by some airlines, would have been to allow airlines to take the decision on when it was safe to fly, avoiding ash when it was visible. The regulators chose not to take this approach on the basis of the crowded nature of European air space as well as – in their view – the potential risks to passenger safety.
Phase II: Searching for a solution
The second phase began after the widespread closure of air space on 15 April and lasted until 19 April. During this time, governments came under increasing pressure from businesses and stranded passengers to open up the skies. The appropriate locus of decision-making was not always clear, and the lack of a harmonized EU approach raised further questions about the legitimacy of rule-making procedures.
The second phase comprised the actions of the parties during the peak of the crisis. Airlines, engine and aircraft manufacturers, governments and regulators held a series of international teleconferences to discuss their approach and possible rule changes that could help get planes flying again. The London VAAC and other European Met authorities drew on the input from a range of other scientific agencies to continually improve and verify their volcanic ash advisories, and reported this information back to the teleconferences.
International teleconferences were initially hosted by the UK CAA, with the European Commission initiating its own teleconference dialogue as the disruption worsened. Although responsibility for aviation safety within the EU ultimately lies with its member states, pressure grew during the event to agree and coordinate an alternative approach at EU level. Specifically, the questions centred on whether to allow flights in areas of low ash concentration – issues addressed in Chapter 3.
Phase III: The European Commission intervention
The impact of the restrictions reached its peak on Sunday 18 April, with commercial air traffic having ceased in 23 member states. Under the growing political pressure and with continuing uncertainties, changes to the rules were rapidly drawn up and agreed upon. Decision-making was apparently influ-enced by economic and political interests as well as the scientific evidence. In addition, the speed and ad hoc nature of the new rule-making process led to widespread confusion among key operational and regulatory stakeholders.
The search for an alternative risk management system – on the rules on flying in ash – created a parallel process with the existing international proce-dures. This was an ad hoc approach to finding a solution, rather than a pre-arranged protocol. It became clear that a prolonged event had not been foreseen by governments; countries were therefore unaware and unprepared.
On the morning of Monday 19 April, an Extraordinary Meeting was co-chaired by Eurocontrol and the European Commission in Brussels with the National CAAs, ANSPs, airlines and the Spanish EU Presidency to discuss three options moving forward: maintain the status quo – avoiding flying wherever ash is present; follow the ‘US approach’ – closing the area immediately around the volcano but allowing airlines to make the decision on where was safe to fly; or a hybrid approach – this would allow flights in area of lower ash concentration, subject to the airlines having undertaken a risk assessment, but no-fly zones could still be established by individual EU member states. The participants agreed upon the third option (described as the three-band model), which received approval from EU Transport Ministers at 16.00 that afternoon, in an additional Extraordinary Meeting.
The option included: z A no-fly zone (NFZ), consisting of a high ash density area (Black Zone) and additional 60 nautical mile buffer zone surrounding this; z A second zone where flights would in principle not be impeded (subject to agreed risk assessments and measures) even though some ash was
present, and where the decisions about operations would be taken by national authorities; z A third zone which was not affected.
www.chathamhouse.org
Preparing for High-impact, Low-probability Events: Lessons from Eyjafjallajökull
Six days after air space had initially closed, regulation moved from an ‘ash/no ash’ distinction (as indicated by ICAO guidance) to a more differen-tiated system, marking contaminated airspace according to ‘how much ash’ was present. However, at this point there was no clear public statement from engine and aircraft manufacturers about where it was safe for aircraft engines to operate in this partially contaminated zone. A meeting on the morning of Tuesday 20 April between the UK Secretary of State and airline industry representatives concluded that ‘while it had previously been hoped that engine manufacturers would support such a revision, consensus had not yet been achieved’. It was therefore necessary to consider whether the industry could temporarily adopt the proposed revised no-fly zone prior to approval from manufacturers; it is important to note that this was after many EU countries had opened their airspace and introduced the new concentration limits.
Moreover, it was at the discretion of national regulators whether to permit flights on the basis of the revised approach. Therefore, while the European Commission Vice-President Siim Kallas was keen to stress that ‘all decisions must be based on scientific evidence and expert analysis’, it was not necessarily clear whether this was undertaken consistently among states. In Germany there was subsequent criticism of the decision to allow flights.
On the afternoon of 20 April, the Fourth International Teleconference took place. During this consultation confirmation came from key engine manufacturers that operating in ash concentrations of less than 2x10⁻³ was possible within reasonable parameters of safety. Following this decision, European Aviation Authorities reopened airspace more rapidly, reaching near to 80% normal capacity by 21 April and a return to normal operation across Europe (apart from airspace in southern Finland and minor restrictions in the UK) by 22 April.
It also proved challenging to translate the change in rules into practices that key stakeholders, especially airlines, could easily adopt. Initially Eurocontrol took responsibility for drawing up revised Volcanic Ash Advisory charts, detailing the no-fly zones and associated buffer region. However, owing to the time constraints imposed upon Eurocontrol cartographers, an ad hoc method for plotting data had to be adopted. So rapid was the change in approach that just six hours before it came into force British Airways expressed its confusion. In an email to CAA and UK Department for Transport executives, the company stated that CEO Willie Walsh ‘remains concerned that there is still a significant level of uncer-tainty about tomorrow’s operation’, also highlighting that ‘we are now well past the go/no go stage’.
Further eruptions the following month threatened to close airspace once again. On 11 May, following a series of test flights into the contaminated zones and a revised safety assessment, the UK CAA concluded that the retention of the 60 nautical mile buffer zone was no longer necessary. This decision further eased restrictions and was progressively adopted across other EU states. Additional dialogue between some aircraft OEMs, the CAA and the UK Met Office led to a further revision of the Volcanic Ash Advisory Charts on 17 May. These charts essentially increased by a factor of two the acceptable ash concentration that defined the boundary of the current no-fly zone.
Phase IV: Preparing for a future event
Governments and agencies are currently focused on testing and implementing the new rules, but preparations for a prolonged disruption to aviation have so far been limited. Following the crisis the search for a more comprehensive agreement on rules and procedures for flying in volcanic ash has continued, using the three-band model as a foundation. Many stakeholders have expressed scepticism that new rules will be agreed internationally, in part because in the absence of crisis conditions the pressure to complete the process is reduced.
Under the new European rules the responsibility for risk assessment and management, and for the safe operation of the aircraft, rests firmly with the operator of the aircraft. This clarification is in line with the requests of airlines during the crisis. However, operation through or within any area where volcanic ash is forecast continues to be subject to the decisions of national regulators and governments.
ICAO has established a European/North Atlantic Volcanic Ash Task Force (EUR/NAT VATF) to move forward on the development of a harmo-nized safety risk management framework. This aims to make it possible to determine routinely the safe levels of operation in airspace contaminated by volcanic ash. The multidisciplinary team of experts from member states and the aviation industry prepared revised Volcanic Ash Contingency Plans for both regions on 10 June 2010; these gained endorsement from the North Atlantic Systems Planning Group (NAT SPG) and the European Air Navigation Planning Group (EANPG) in July.
In parallel with its European efforts, ICAO established an International Volcanic Ash Task Force (IVATF) in May 2010 to develop a global safety risk management framework which would make it possible to determine safe levels of volcanic ash concentrations for operations in airspace contaminated by volcanic ash.
Yet despite these efforts, there remain questions around whether this approach will be adopted at international level. Current guidance based on the use of ash concentration thresholds has been adopted as guidance material in the EUR/NAT region but this ‘living document’ is still under validation and assessment by the IVATF and it is not clear that such an approach could be agreed and applied globally within the International Airways Volcano Watch (IAVW) system of ICAO. One issue raised by stakeholders is that a new European approach to risk management cannot easily be enforced on non-European countries. Although they could be required to adopt the risk-management approach proposed for Europe, it would not be straightforward to verify their compliance.
One year on from the ash cloud, Volcex held a major scenario exercise on 13 and 14 April 2011 with broad stakeholder participation, including 77 airlines. This exercise tested the implementation of the revised approach to flying in ash at European level. However, it did not consider the implications of a prolonged event. One major stakeholder told us that if an event were to last longer than a week, there is still ‘no plan – A or B’.40

www.chathamhouse.org
41
Appendix 5: Agencies and Institutions Involved in an Ash-cloud Crisis (Selected Countries)
Table A1: Methodological components
UK France Germany Iceland EC/EU US/other Global
Civil contingencies/
emergency
preparednessa
Cabinet Office Direction de la
Sécurité Civile
(DSC)
Bundesamt für
Bevölkerungs-
schutz und
Katastrophenhilfe
(BBK)
Department of
Civil Protection
and Emergency
Management
(DCPEM)b
Monitoring and
Information Centre
(MIC)
Federal Emergency
Management
Agency (FEMA)
UN OCHA,
GDACS, OSOCC,
ReliefWeb, UNISDR
Aviation
(Air Navigation
Service Provider and
National Aviation
Authority, Airport
Coordinator)
NATS (National Air
Traffic Services)
Civil Aviation
Authority (CAA)
La Direction
générale de
l’Aviation civile
(DGAC)
Direction des
Services de la
Navigation Aérienne
(DSNA)
Luftfahrt-Bundesamt
(LBA)
Deutsche
Flugsicherung (DFS)
Flughafen-
koordination
Deutschland
(FHKD)
ISAVIA
Icelandic
Civil Aviation
Administration
Eurocontrol
European Aviation
Safety Agency
(EASA)
Federal Aviation
Administration (FAA)
ICAO, IAVW, IVATF,
IATA, CANSO
IFALPA
Other transport
Finding alternative
transport options
for passengers and
goods
DfT, Highways
Agency, UK Port
Authority
Ministère de
l’Equipement des
Transports et du
Logement
Federal Ministry
of Transport,
Building and Urban
Development
(BMVBS),
Eisenbahn-
Bundesamt (EBA)
Ministry of Transport,
Communications and
Local Gov.
DG MOVE US Department of
Transportation
Meteorological
information
Providing advice
to other decision-
makers on ash
dispersion and
deposition
UK Met Office,
London VAAC
Météo-France,
Toulouse VAAC
Deutscher
Wetterdienst
Icelandic Met Office EUMETSAT
EUMETNET
NOAA WMO
Food and farming
Potential for
contamination of
food supply chain
Defra,c FSA Ministère de
l’Agriculture et la
Pêche
BMELV Ministry of Fisheries
and Agriculture
EFSA,d DG Envt,
DG Agri
USDA, FDA FAO
Environment
Potential
contamination of soil
and water with e.g.
fluorine
Defra, EA/SEPA,e
Centre for Ecology
and Hydrology
(CEH) f
Ministère de
l’Écologie, de
l’Énergie, du
Développement
durable et de la Mer
BMU,
Umweltbundesamt
(UBA)
Ministry for the
Environment
EEA EPA, DOE UNEP, UNISDR
Health
Impact on
respiratory health,
food and water
contamination,
disruption to
healthcare provision
including blood and
transplant services
MoH, NHS, HSA
HPA
Ministère de la
Santé et des Sports
Bundesministerium
für Gesundheits-
wesen
Ministry of Health European
Emergency Data-
based Syndromic
Surveillance System
(SIDARTHa)g
USHHS WHO
a http://www.euromedcp.eu/index.php?option=com_weblinks&view=category&id=954%3Aeu-countries-civil-protection-authorities&Itemid=967&lang=en.
b Almannavarnir, Online New Article, 23.4.2010; President of Iceland meets with senior officials from the CPEM. Available at: http://www.almanna-
varnir.is/displayer.asp?cat_id=413&module_id=220&element_id=2323.
c UK Parliament, 14 July 2010. Evidence heard by Lords EU Sub-Committee B on the volcanic ash crisis. Available at: http://www.parliament.uk/
business/committees/committees-a-z/lords-select/eu---internal-market-sub-committee-b/news/evidence-session/.
d EFSA Journal 2010; 8(1):1593 [16 pp.] Available at: http://www.efsa.europa.eu/en/scdocs/scdoc/1593.htm.
e Scottish Environment Protection Agency (SEPA); Volcanic ash cloud – the latest news from SEPA. Available at: http://www.sepa.org.uk/about_us/
news/2010/volcanic_ash_cloud_%E2%80%93_the_lat-3.aspx.
f Centre for Ecology and Hydrology, Online News Achive. Available at: http://www.ceh.ac.uk/news/news_archive/2010_news_item_12.html.
g European Emergency Data-based Syndromic Surveillance System (SIDARTHa), 15 May 2010; SIDARTHa Volcanic Ash Cloud Rapid Public Health
Impact Assessment. Available at: http://ec.europa.eu/eahc/documents/health/SIDARTHa_rapid_assessment_volcanic_ash_cloud_15MAY2010.pdf.

www.chathamhouse.org
Preparing for High-impact, Low-probability Events: Lessons from Eyjafjallajökull
UK France Germany Iceland EC/EU US/other Global
Defence/security
Impact on air force
capability during
the event, potential
role in repatriation
and support to civil
contingencies
MOD, UKHO, UK
Borders
Ministère de la
Défense
Bundesministerium
der Verteidigung
No standing army EDA US DOD NATO
Foreign relations
Repatriation of
stranded passengers
and wider diplomatic
services
Foreign and
Commonwealth
Office
Ministre des Affaires
étrangères (MAEE)
Auswärtiges Amt
(AA)
Ministry of Foreign
Affairs
RELEX US Department of
State
Health and safety Health Protection
Agency, Health and
Safety Executive
Les Agences
françaises de
sécurité sanitaire
(AFSSAPS)
Bundesanstalt für
Arbeitsschutz und
Arbeitsmedizin
(BauA)
Ministry of Health DG for Health and
Consumers, European
Centre for Disease
Prevention and
Control
Occupational
Safety and Health
Administration
(OSHA)
University
departments/
networks
International
Volcanic Health
Hazard Networkh
VMSG
CEV Deutsches Zentrum
für Luft- und
Raumfahrt;
Institute of Earth
Sciences
International
Association of
Volcanology and
Chemistry of the
Earth’s Interior
(IAVCEI)
Scientific bodies British Geophysical
Association
Royal Society
NERC – British
Geological Survey
– NCAS
Scientific
Advisory Group
for Emergencies
(SAGE)
French Aerospace
Lab (ONERA)
German Aerospace
Center (DLR)
Joint Research
Council
US Geological
Survey, US National
Research Council
Business
organizations
Confederation of
British Industry,
Federation of Small
Businesses
Bundesverband der
Deutschen Industrie,
Bundesministerium
für Wirtschaft und
Technologie
National Federation
of Independent
Business, United
States Federation of
Small Businesses
Government
enquiries
House of Commons
Science and Tech
Committee
L’ Office
Parlementaire
d’Evaluation des
choix Scientifiques
et Technologique
(OPECST)
US House of
Representatives
Committee on
Science and
Technology
Subcommittee
on Space and
Aeronautics
Airlines BA, Virgin Air France-KLM Lufthansa, German
Wings
Icelandair United Airlines,
Delta, South-West,
American Airlines
RyanAir, EasyJet
Engine
manufacturers
Rolls-Royce Plc CFM International GE Aviation, Pratt &
Whitney
h C.J. Horwell et al., 2010, Respiratory health hazard assessment of ash from the 2010 eruption of Eyjafjallajökull volcano, Iceland. A summary of
initial findings from a multi-centre laboratory study. International Volcanic Health Hazard Network. Available at: http://www.ivhhn.org/images/pdf/
iceland_ash_health_report.pdf.
42
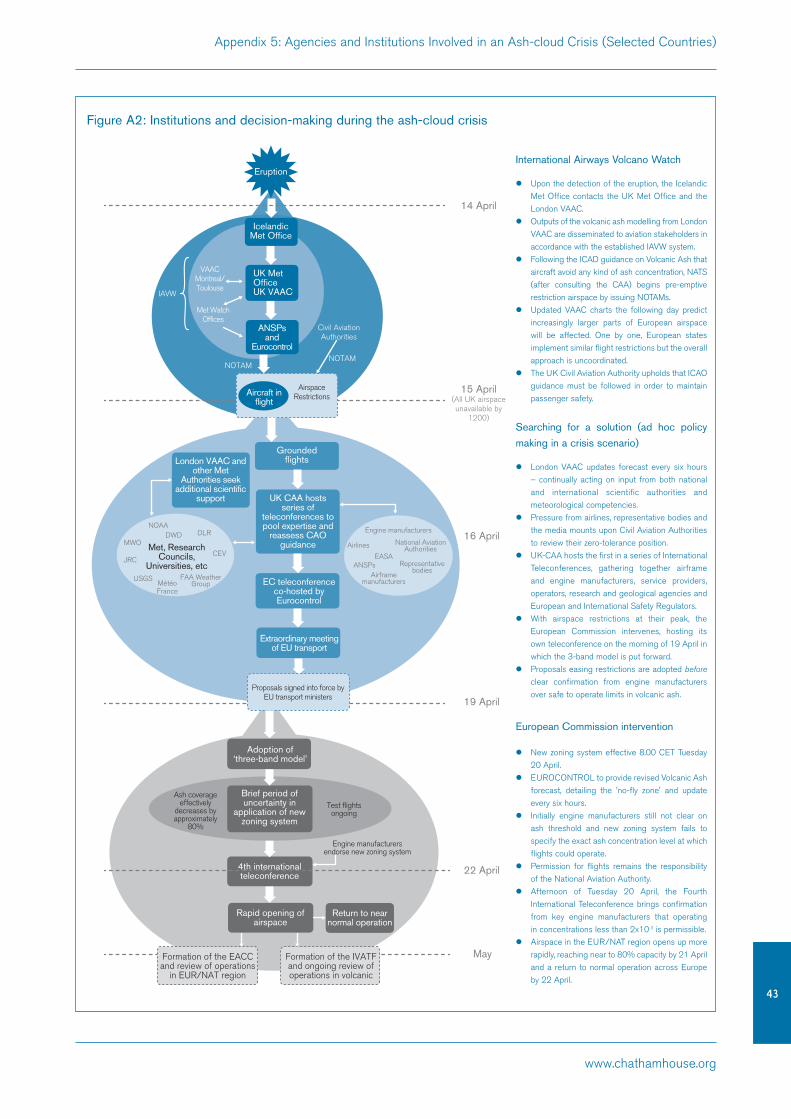
www.chathamhouse.org
43
Appendix 5: Agencies and Institutions Involved in an Ash-cloud Crisis (Selected Countries)
May
VAAC Montreal/Toulouse
Met Watch Offices
Icelandic Met Office
Civil Aviation Authorities
NOTAM
UK Met OfficeUK VAAC
ANSPs and
Eurocontrol
Eruption
15 April (All UK airspace unavailable by
1200)
14 April
Grounded flights
UK CAA hosts series of
teleconferences to pool expertise and
reassess CAO guidance
EC teleconference co-hosted by Eurocontrol
Extraordinary meeting of EU transport
London VAAC and other Met
Authorities seek additional scientific
support
Met, Research Councils,
Universities, etc
NOAADWD DLR
CEV
FAA Weather Group
USGSMétéo France
JRC
MWO
Engine manufacturers
Airlines National Aviation Authorities
ANSPsEASA
Airframe manufacturers
Representative bodies
16 April
19 April Proposals signed into force by
EU transport ministers
Aircraft in flight
Airspace Restrictions
4th international teleconference
Rapid opening of airspace
Brief period of uncertainty in
application of new zoning system
Ash coverage effectively
decreases by approximately
80%
Test flights ongoing
Adoption of ‘three-band model’
Return to near normal operation
Formation of the IVATF and ongoing review of operations in volcanic
Formation of the EACC and review of operations
in EUR/NAT region
22 April
Engine manufacturers endorse new zoning system
NOTAM
IAVW
Figure A2: Institutions and decision-making during the ash-cloud crisis
International Airways Volcano Watch
z Upon the detection of the eruption, the Icelandic
Met Office contacts the UK Met Office and the
London VAAC.
z Outputs of the volcanic ash modelling from London
VAAC are disseminated to aviation stakeholders in
accordance with the established IAVW system.
z Following the ICAD guidance on Volcanic Ash that
aircraft avoid any kind of ash concentration, NATS
(after consulting the CAA) begins pre-emptive
restriction airspace by issuing NOTAMs.
z Updated VAAC charts the following day predict
increasingly larger parts of European airspace
will be affected. One by one, European states
implement similar flight restrictions but the overall
approach is uncoordinated.
z The UK Civil Aviation Authority upholds that ICAO
guidance must be followed in order to maintain
passenger safety.
Searching for a solution (ad hoc policy
making in a crisis scenario)
z London VAAC updates forecast every six hours
– continually acting on input from both national
and international scientific authorities and
meteorological competencies.
z Pressure from airlines, representative bodies and
the media mounts upon Civil Aviation Authorities
to review their zero-tolerance position.
z UK-CAA hosts the first in a series of International
Teleconferences, gathering together airframe
and engine manufacturers, service providers,
operators, research and geological agencies and
European and International Safety Regulators.
z With airspace restrictions at their peak, the
European Commission intervenes, hosting its
own teleconference on the morning of 19 April in
which the 3-band model is put forward.
z Proposals easing restrictions are adopted before
clear confirmation from engine manufacturers
over safe to operate limits in volcanic ash.
European Commission intervention z New zoning system effective 8.00 CET Tuesday
20 April.
z EUROCONTROL to provide revised Volcanic Ash
forecast, detailing the 'no-fly zone' and update
every six hours.
z Initially engine manufacturers still not clear on
ash threshold and new zoning system fails to
specify the exact ash concentration level at which
flights could operate.
z Permission for flights remains the responsibility
of the National Aviation Authority.
z Afternoon of Tuesday 20 April, the Fourth
International Teleconference brings confirmation
from key engine manufacturers that operating
in concentrations less than 2x10⁻³ is permissible.
z Airspace in the EUR/NAT region opens up more
rapidly, reaching near to 80% capacity by 21 April
and a return to normal operation across Europe
by 22 April.

www.chathamhouse.org
Appendix 6: National Approaches to Decision-making during the Ash-cloud Event
This appendix sets out in detail the institutional responses by three European member states: the UK, Germany and France.The ash cloud raised a series of public policy issues including those related to health (the respiratory impact of ash and medical supply chains), environmental
risks (food and water quality and related health implications), and the repatriation of stranded passengers. Such challenges are, of course, not specific to an ash-cloud crisis – they might arise from a range of high-impact, low-probability events. Furthermore previous events have helped shape the institutional structures that handle civil contingencies. For example, avian and swine flu, SARS and other global threats have informed the national and international structures for responding to a health crisis. The process and response of UK health agencies during the ash-cloud event closely reflected the structure put in place for pandemic flu.35
The UK
The UK was one of the most affected countries in terms of ash dispersion and deposition, and many UK citizens were stranded overseas during the event. The UK Met Office also had a central role in forecasting the distribution of ash across Europe.
Less than 24 hours after Eyjafjallajökull went into its explosive phase, the UK’s National Airspace Crisis Management Executive (NACME) convened. This was attended by officials from the CAA, Ministry of Defence, NATS and the Department for Transport (DfT). NACME met three times daily there-after, and served as the principal forum for executive decision-makers in UK aviation regulation. Taking its cue from these meetings, the Department
Geology and Volcanology
Group
Aviation Engineering subgroup
Methodology subgroup
BADC
NERC
ARSF
CEH
NCAS
FAAM
BGS
Chair: GCSA
Cabinet Office
Civil Cont. Committee/
COBR
FCO
Department of HealthDfT
Civil Cont. Secretariat
SAGE
MOD
CAA
NATS
NACME
UK Met Office
UK VACC
Flights in UK Airspace
Met Office Iceland
ERUPTION
DEFRA
Scottish Gov.
SEPA
DARD
Welsh Associate
AFBI
Devolved Administrations
Collaborating with WHOHPA
Input into EUFAR
database
Working in collaboration with Icelandic
Met
AFBI: Agri-food and Bioscience InstituteARSF: Airborne Research and Survey FacilityBGS: British Geological SurveyCEH: Centre for Ecology and HydrologyCOBR: Cabinet Office Briefing RoomDARD: Department of Agriculture and Rural DevelopmentDefra: Department of Food and Rural AffairsDfT: Department for TransportEMARC: Emergency Monitoring and Response CentreFAAM: Facility for Airborne Atmospheric MeasurementFCO: Foreign and Commonwealth OfficeGCSA: Government Chief Science AdvisorHPA: Health Protection AgencyMOD: Ministry of DefenceNACME: National Airspace Crisis Management ExecutiveNCAS: National Clinical Assessment ServiceNERC: National Environmental Research CouncilSAGE: Scientific Advisory Group in EmergenciesSEPA: Scottish Environmental Protection Agency
Central Government and Departments
Health Agencies
IAVW, Operators and Regulators
Scientific Agencies
Figure A3: UK decision-making structure during the ash-cloud crisis
35 See Health Protection Agency, ‘Pandemic Influenza Contingency Plan: The HPA’s strategic roles and actions for preparation and response to an influenza
pandemic’, 2009.
44

www.chathamhouse.org
45
for Transport coordinated loosely with the Cabinet Office to disseminate information to other government departments, also briefing ministers and the public as and when new information became available.
However, it was not until 19 April, around the time when changes in the rules for aviation were being finalized, that the UK government assembled its crisis response committee (known as COBRA after its normal meeting place in the Cabinet Office Briefing Room) and formalized the roles of two lead government departments: the Department for Transport, for managing transport contingency measures, and the Foreign and Commonwealth Office (FCO) for managing the repatriation of UK nationals. The importance of pre-identification of lead government departments is one of the key findings from the post-crisis UK Parliamentary Inquiry.
The UK Parliamentary Inquiry also concluded more generally that the government’s attitude to scientific advice is that it is something to reach for once an emergency happens, not a key factor for consideration from the start of the planning process. Despite early meetings between the Chief Scientific Adviser and the Cabinet Office Civil Contingencies Secretariat (CCS) on 15 April, the full competency of the Scientific Advisory Group for Emergencies (SAGE) was not activated until after the revised European approach to volcanic ash had been implemented. Additionally, the lack of transparency and openness in the work of SAGE has attracted criticism from those who see this as restricting the efficacy of its actions.
A number of separate scientific institutions in the UK contributed to scientific assessments and advice during the event. Initially responding to the calls from the UK Met Office, the National Environmental Research Council (NERC) assisted in pooling data from a limited number of ground-based stations and provided its own research aircraft to seek atmospheric measurements. NERC also drew upon European research ties, feeding into the ash-forecast database EUFAR. This has subsequently been developed to provide scientists with a comprehensive research infrastructure that can be called upon in other atmospheric pollution incidents.
The UK Department for Health and the Health Protection Agency (HPA) took the lead on evaluating potential health risks. HPA press releases were issued from 15 April onwards and consistently stated that the concentration of particles was likely to be low and unlikely to cause serious harm.36 Some confusion was caused on 16 April when the World Health Organization (WHO) suggested that families stay indoors as a precaution, but the WHO shifted towards the HPA line in the following days.37
A separate area of work on environmental hazards was led by the UK Department of Environment, Food and Rural Affairs (Defra). Its analysis also indicated that the impact on water, food and air quality would be limited, but a review after the event has highlighted weaknesses in communications between different agencies on the assessment and reporting of environmental hazards during the ash cloud.38 It stressed that the boundaries of respon-sibility between Defra and the relevant health agencies (including the HPA and the Food Standards Agency) needed to be identified and clear to both parties. Defra already had a Volcanic Ash Network and was able to draw on a range of scientific agencies such as the British Geological Survey and the efforts of the UK’s devolved administrations.
Strategic
Operational
Federal Ministry of Transport, Building and Urban
Development (BMVBS)
Luftfahrt-Bundesamt (LBA)
Deutsche Flugsicherung (DFS)
DWD
DLR
DFD
UK VACCUK Met Office
EMARC
Met Office Iceland
MWO (Iceland)
ERUPTIONLaMP
Scientific Community
DFD: German Remote Sensing Data CentreDFS: German Air Navigation Service ProviderDLR: German Aerospace CentreDWD: Deutscher Wetterdienst (German Met Service)EMARC: Emergency Monitoring and Response CentreLaMP: Laboratoire de Météorologie PhysiqueLBA: German Civil Aviation AuthorityMWO: Met Watch Office
Figure A4: German decision-making structure during the ash-cloud crisis
36 HPA press releases www.hpa.org.uk/NewsCentre/NationalPressReleases/2010PressReleases/.
37 'Volcanic ash health warning issued as travel chaos continues’, The Times, http://www.timesonline.co.uk/tol/news/uk/article7099692.ece.
38 Science Advisory Council to Defra: 17 February 2011. Lessons learned from the volcanic ash incident. SAC (11) 09. http://sac.defra.gov.uk/wp-content/
uploads/2011/04/SAC-11-09-Lessons-learned-volcanic-ash.pdf.
Appendix 6: National Approaches to Decision-making during the Ash-cloud Event

www.chathamhouse.org
Preparing for High-impact, Low-probability Events: Lessons from Eyjafjallajökull
Germany
After receiving conformation of the eruption, the London VAAC further disseminated the message to European air navigation service providers (ANSPs), other European meteorological services and Eurocontrol.
The German ANSP, Deutsche Flugsicherung (DFS), bases its air traffic management decisions on publications by the German meteorological service Deutscher Wetterdienst (DWD), which in turn uses the information of the Volcanic Ash Advisory Centre (VAAC) in London. According to the ICAO regulations, the VAAC must send an updated forecast to the national meteorological services every six hours.39
DWD issues its own warnings of significant meteorological activity, termed SIGMETs. Based on these warnings, DFS decides on the appropriate air traffic management measures in the affected airspace. The decisions of DFS are formed by the national aviation authority Luftfahrt-Bundesamt (LBA), which serves as an independent regulator for aviation safety.
France
On 14 April 2010, the London VAAC informed the French national meteorological service Météo-France and its national aviation authority, la Direction Générale de l’Aviation Civile (DGAC), of the approaching volcanic ash-cloud. Météo-France used the Volcanic Ash Advisory issued by the London VAAC in combination with its own analysis as the basis of its meteorological warning to the French ANSP, la Direction des Services de la Navigation Aérienne (DSNA). In the interest of maintaining maximum safety for aircraft passengers the DGAC, operating through the DSNA, implemented the progressive closure of French airspace from north to south, from Thursday 15 April.
Council of Defence and National Security (CDSN)
Secretariat-General for National Defence and
Security (SGDSN)Premier Ministère
Président de la République
MEEDDM Ministry of Environment, Energy,
Sustainable Development and Sea
All other government departments (Health,
Defence etc.)
Inter-Ministerial Crisis Cell
Centre for Crisis
Management
Departmental Centre for Operational Intelligence and Warning (CMVOA)
Strategic
Operational
Directorate General of Civil Aviation (DGAC)
Direction générale de la prévention des risques
(DGPR)
Directorate General for Infrastructure, Transport and the Sea (DGITM)
Direction des Services de la Navigation
Aérienne (DSNA)
Fédération Nationale des Transports de
Voyageurs
Aéroports de Paris
Airline Operators
Metro-France
IPGP, LSCE, LMD, SAFIRE
Scientific Community
UK Met Office
UK VACC
EMARC
Met Office Iceland
MWO(Iceland)
ERUPTION
IPGP: Institute of Geophysics of ParisLMD: Laboratoire de la Météorologie DynamiqueLSCE: Science Laboratory of Climate and the EnvironmentSAFIRE: French Office of Aircraft Instrumented for Environmental Research
Figure A5: French decision-making structure during the ash-cloud crisis
39 ICAO (2007); Annex 3 – Meteorological Service for International Air Navigation, Chapters 3, 4, 7 and 9 and Appendices.46

www.chathamhouse.org
47
Appendix 6: National Approaches to Decision-making during the Ash-cloud Event
The Ministry of Ecology (Ministère de l’Écologie, de l’Énergie, du Développement durable et de la Mer, MEEDDM) took lead agency status during the crisis, overseeing operation of transport as well as coordination between other government departments. A crisis unit was officially established within the MEEDDM on Saturday 17 April, chiefly to centralize coordination of key stakeholders. With the assistance of transport operators such as the National Federation of Passenger Transport (NFTV), Aeroports de Paris (ADP) and the crisis-cell SNCF were able to coordinate the return of passengers stranded abroad via those airports that remained operational, and also to coordinate management of inland transport of passengers by exceptional means via the SNCF and bus carriers.
A number of institutions assisted the MEEDDM in the timely provision of scientific advice and input: the Institut de Physique du Globe de Paris (IPGP), Météo-France, Laboratoire des Sciences du Climat et de l’Environnement (LSCE), the Laboratory of Dynamic Meteorology (LMD) and the engine manufacturers of Air France. The IPGP was almost immediately called upon to coordinate a crisis-cell, drawing together the relevant scientific expertise.40 The IPGP also set up a teleconferencing system which was utilized twice daily to exchange information between scientists and the MEEDDM and which also disseminated daily reports, updating departments on the latest volcanic activity. Additionally, Météo-France worked on simulating the path of the ash cloud, and organized several test flights – but was limited by the preparedness of research aircraft and their inability to gain permission to fly.
40 Report No. 28 (2010–2011), Jean-Claude Etienne, Senator and Christian Kert, MP, on behalf of the Parliamentary Office for Scientific and Technological
Advice, filed 12 October 2010.


Chatham House, 10 St James’s Square, London SW1Y 4LET: +44 (0)20 7957 5700 E: [email protected]: +44 (0)20 7957 5710 www.chathamhouse.org
Charity Registration Number: 208223
www.chathamhouse.org
Preparing for H
igh-impact, Low
-probability Events: Lessons from
Eyjafjallajökull
Bernice Lee and Felix P
reston, with G
emm
a Green
Preparing for High-impact, Low-probability Events
Lessons from Eyjafjallajökull A Chatham House Report
Bernice Lee and Felix Preston, with Gemma Green
0325387818629
ISBN 9781862032538