preparing for the new impairment senior director – risk...
TRANSCRIPT

1
Preparing for The New Impairment Requirements: Practitioner’s View BY CHRISTIAN HENKEL AND EMIL LOPEZ
Overview
An appropriate allowance for loan and lease losses (“ALLL”) covers estimated credit losses
inherent in an institution’s loan and lease portfolio. The ALLL represents management’s best
estimate of likely net charge-offs that are to be realized for a loan or group of loans, given facts
and circumstances as of the evaluation date.1
On April 27, 2016, the Financial Accounting Standards Board (FASB) voted to move forward with a
new credit impairment model, known as the Current Expected Credit Loss model (CECL), for the
recognition and measurement of credit losses for loans and debt securities. The final standard is
to expected be released in June 2016 with implementation beginning in 2018. This new standard
is far more than an exercise in financial accounting and bank regulation. It will replace the current
incurred loss model with an expected loss model, one of the most significant changes in the
history of bank accounting.
Understanding the Existing Guidance
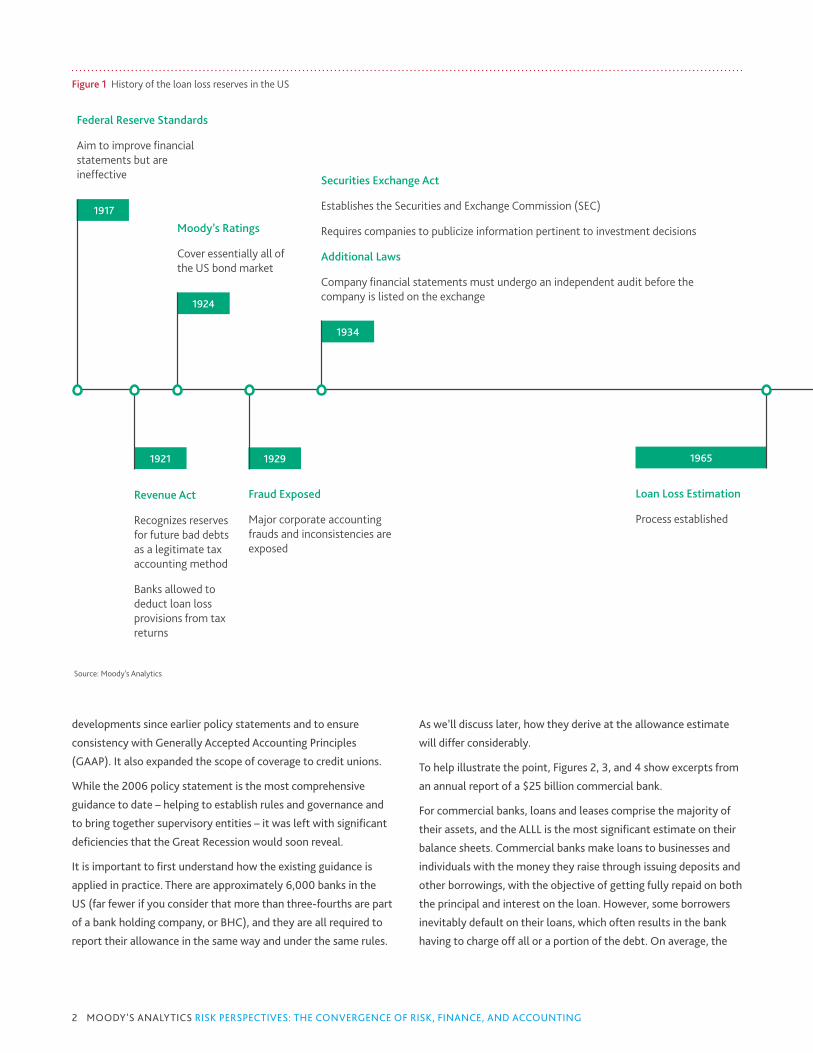
Setting aside reserves for future bad debts is a concept with a long history, as shown in Figure 1.
The reserve for bad debts became a legitimate tax accounting method with the Revenue Act of
1921. Nearly a century later, regulators continue to fine-tune processes for estimating losses and
adequate provisions.
Most recently, in 2006, the banking supervisory agencies issued a policy statement on the ALLL
which remains in place today. Its primary objectives were to incorporate allowance-related
Christian Henkel is a Senior Director in the Moody’s Analytics Risk Measurement Services group. He leads a national team of risk consultants who work closely with banks, insurers, and other financial institutions. Having spent most of his career in commercial banking, Christian has a unique blend of business and academic experience across the financial services industry – including expertise in areas such as commercial credit and financial analysis, portfolio management, and asset quality. He has a BA and an MBA from the University of Texas at Dallas in Finance and Accounting, and he graduated valedictorian from the Southwestern Graduate School of Banking at SMU.
Christian Henkel Senior Director – Risk Management
Emil Lopez is a Director in the Moody’s Analytics Risk Measurement Group, where he leads risk modeling advisory engagements and manages the team's data quality, risk reporting, and IFRS 9 research. Prior to joining the group, he oversaw operations for Moody's Analytics Credit Research Database, one of the world's largest private firm credit risk data repositories. Emil has extensive experience in credit risk modeling and reporting, data sourcing, and quality control. Emil has an MBA from New York University and a BS in Finance and Business Administration from the University of Vermont.
Emil Lopez Director – Risk Measurement
This article describes the new standards set forth by the FASB. It covers the history of the ALLL and explains how the recent financial crisis highlighted the need for new standards. It also suggests how banks should align with the new CECL impairment standards, including early preparation and core capabilities.
1 Interagency Policy Statement on the Allowance for Loan and Lease Losses, Federal Reserve, December 2006.
In many cases, the ALLL does little to show the true extent of the credit risk inherent in a bank’s loan portfolio. That is among the most commonly cited criticisms of the existing rules.
THE CONVERGENCE OF RISK, FINANCE, AND ACCOUNTING
View all articles of this edition at MoodysAnalytics.com/RiskPerspectives
2 MOODY'S ANALYTICS RISK PERSPECTIVES: THE CONVERGENCE OF RISK, FINANCE, AND ACCOUNTING
developments since earlier policy statements and to ensure
consistency with Generally Accepted Accounting Principles
(GAAP). It also expanded the scope of coverage to credit unions.
While the 2006 policy statement is the most comprehensive
guidance to date – helping to establish rules and governance and
to bring together supervisory entities – it was left with significant
deficiencies that the Great Recession would soon reveal.
It is important to first understand how the existing guidance is
applied in practice. There are approximately 6,000 banks in the
US (far fewer if you consider that more than three-fourths are part
of a bank holding company, or BHC), and they are all required to
report their allowance in the same way and under the same rules.
As we’ll discuss later, how they derive at the allowance estimate
will differ considerably.
To help illustrate the point, Figures 2, 3, and 4 show excerpts from
an annual report of a $25 billion commercial bank.
For commercial banks, loans and leases comprise the majority of
their assets, and the ALLL is the most significant estimate on their
balance sheets. Commercial banks make loans to businesses and
individuals with the money they raise through issuing deposits and
other borrowings, with the objective of getting fully repaid on both
the principal and interest on the loan. However, some borrowers
inevitably default on their loans, which often results in the bank
having to charge off all or a portion of the debt. On average, the
Figure 1 History of the loan loss reserves in the US
Source: Moody's Analytics
Federal Reserve Standards
Aim to improve financial statements but are ineffective
Revenue Act
Recognizes reserves for future bad debts as a legitimate tax accounting method
Banks allowed to deduct loan loss provisions from tax returns
Moody’s Ratings
Cover essentially all of the US bond market
Fraud Exposed
Major corporate accounting frauds and inconsistencies are exposed
Securities Exchange Act
Establishes the Securities and Exchange Commission (SEC)
Requires companies to publicize information pertinent to investment decisions
Additional Laws
Company financial statements must undergo an independent audit before the company is listed on the exchange
Loan Loss Estimation
Process established
1917
1924
1921 1929
1934
1965

3PREPARING FOR THE NEW IMPAIRMENT REQUIREMENTS: PRACTITIONER’S VIEW
net charge-off (NCO, which is gross charge-offs less recoveries)
rate is about 1%.2
In this example, the bank set aside $175 million in reserves to
account for management’s best estimate of the NCOs that are
likely to be realized from its $15 billion in loans outstanding, given
the facts and circumstances as of the evaluation date (December
31, 2015). At the end of the prior reporting period, the bank held
$159 million in reserves in anticipation of future charge-offs. The
amount of the allowance is increased or decreased through the
combination of NCOs and the provision expense through the
operating income.
In this case, the bank reported NCOs during fiscal year 2015 of
$33.6 million ($43.6 million gross charge-offs and $10.0 million in
recoveries) and a provision expense of $49.3 million to arrive at
the $175 million allowance. Said another way, the NCOs during
2015 reduced the bank’s ALLL by $33.6 million, but the bank
had to expense through the income statement another $49.3
million in order to ensure the amount of the allowance remained
adequate (i.e., $175 million) for future charge-offs based upon the
facts and circumstances at the end of 2015 (Figure 3).
As depicted in the income statement in Figure 4, the bank
reported net interest income during 2015 of $665 million but
1973
1976
1986
FASB
Establishes standards for financial report preparation
ALLL Reporting
All banks with total assets exceeding $25 million are required to report ALLL
Public Statement
SEC cites inadequate documentation of procedures for loan portfolio reviews and allowance and provision determination
Generally Accepted Accounting Principles
(GAAP)
Interagency policy statement provides
guidance on ALLL, in accordance with GAAP
1993
1994
1999
2001
2006
General Accounting Office (GAO) Study
Existing practices are shown to obscure changes in credit quality
Highlights a disconnect in the approaches of regulators and auditors
Joint Working Group
Banking supervisory agencies establish a joint working group to study ALLL concerns
New Policy Statement
Banking agencies provide joint guidance on ALLL
Policy Update
Banking agencies issue the current policy statement, which incorporates new allowance-related developments and ensures consistency with GAAP
CECL
Expected release of final
standard
2016
See Figure 6 for 2008-2016 details.
Figure 1 History of the loan loss reserves in the US
Source: Moody's Analytics
2 Average annualized quarterly NCO rate for all loans and leases 1984–2015 is 0.91%; FDIC.

4 MOODY'S ANALYTICS RISK PERSPECTIVES: THE CONVERGENCE OF RISK, FINANCE, AND ACCOUNTING
Figure 2 Balance sheet (assets only)
Figure 3 Changes in the ALLL during fiscal year 2015
Source: Webster Financial Corporation
Allowance for loan and lease losses: Total
Balance at January 1, 2015 $ 159,264
Provision (benefit) charged to expense 49, 300
Losses charged off 43,560
Recoveries 9,986
Balance at December 31, 2015 $ 174,990
(In thousands)
Source: Webster Financial Corporation
December 31,
Assets 2015 2014
Cash and due from banks $ 251,258 $ 261,544
Interest-bearing deposits 155,907 132,695
Securities available-for-sale, at fair value 2,984,631 2,793,873
Securities held-to-maturity
(fair value of $3,961,534 and $3,948,706)
3,923,052 3,872,955
Federal Home Loan Bank and Federal Reserve Bank stock 188,347 193,290
Loans held for sale 37,091 67,952
Loans and leases 15,671,735 13,900,025
Allowance for loan and lease losses (174,990) (159,264)
Loans and leases, net 15,496,745 13,740,761
Deferred tax asset, net 101,578 73,873
Premises and equipment, net 129,426 121,933
Goodwill 538,373 529,887
Other intangible assets, net 39,326 2,666
Cash surrender value of life insurance policies 503,093 440,073
Accrued interest receivable and other assets 328,993 301,670
Total assets $ 24,677,820 $ 22,533,172
The ALLL is a contra-asset that reduces the carrying value of total loans
the $49 million provision to increase the ALLL reduced operating
income and, in turn, capital.
The concept of the ALLL and its presentation on an institution’s
balance sheet is straightforward, but in many cases it does little to
inform investors and other interested parties about the true extent
of the credit risk inherent in a bank’s loan portfolio. This is among
the most commonly cited criticisms of the existing rules.
Let’s take a closer look.
The principal sources of guidance on accounting for impairment in
a loan portfolio under US GAAP are as follows:
» ASC 450-20, Loss Contingencies (formerly known as FAS 5)
» ASC 310-10, Receivables (formerly known as FAS 114)
In simple terms, ASC 450-20 (FAS 5) is the reserve that
institutions calculate for performing loans. Since these borrowers
have not defaulted, the amount of potential loss is unknown, so

5PREPARING FOR THE NEW IMPAIRMENT REQUIREMENTS: PRACTITIONER’S VIEW
Figure 4 Income statement
Source: Webster Financial Corporation
(In thousands, except per share data) Years ended December 31,
Interest Income: 2015 2014
Interest and fees on loans and leases $ 552,441 $ 511,612
Taxable interest and dividends on securities 190,061 189,408
Non-taxable interest on securities 15,948 17,064
Loans held for sale 1,590 857
Total interest income 760,040 718,941
Interest Expense:
Deposits 46,031 44,162
Securities sold under agreements to repurchase and other borrowings 16,861 19,388
Federal Home Loan Bank advances 22,858 16,909
Long-term debt 9,665 10,041
Total interest expense 95,415 90,500
Net interest income 664,625 628,441
Provision for loan and lease losses 49,300 37,250
Net interest income after provision for loan and lease losses 615,325 591,191
Non-interest Income:
Deposit service fees 136,578 103,431
Loan and lease related fees 25,594 23,212
Wealth and investment services 32,486 34 946 34,771
Mortgage banking activities 7,795 4,070
Increase in cash surrender value of life insurance policies 13,020 13,178
Gain on sale of investment securities, net, 609 5499
Impairment loss on securities recognized in earnings (110) (1,145)
Other income 23,573 18,917
Total non-interest income 239,545 202,108
Non-interest Expense:
Compensation and benefits 297,517 270,151
Occupancy 48,836 47,325
Technology and equipment 80,026 61,993
Intangible assets amortization 6,340 2,685
Marketing 16,053 15,379
Professional and outside services 11,156 8,296
Deposit insurance 24,042 22,670
Other expense 70,584 73,101
Total non-interest expense 554,554 501,600
Income before income tax expense 300,316 291,699
Income tax expense 93,976 91,973
Net income 206,340 199,726

6 MOODY'S ANALYTICS RISK PERSPECTIVES: THE CONVERGENCE OF RISK, FINANCE, AND ACCOUNTING
it is usually estimated on a “pool” basis rather than an individual
basis. That is, the assets are grouped into relatively homogenous
groups of risk characteristics. This segmentation approach is
similar to the approach bank management might take when
determining the appropriate risk rating methodology or model
for a specific portfolio. To perform this grouping, the portfolio
of borrowers is stratified by characteristics such as sector, size,
geography, and loan type before determining the best metrics for
estimating future credit risk. Under the existing guidance, a widely
used method is applying a historical NCO rate to each group,
adjusted for the effects of qualitative or environmental factors.
ASC 310-10 (FAS 114) is the reserve that institutions calculate for
non-performing or “impaired” loans. Although the impairment
designation is institution-specific, a general rule is that a loan is
impaired when the institution believes repayment of the loan will
not be realized. According to the current guidance, the allowance
is estimated using one of the following three impairment
measurement methods:
1. The present value of expected future cash flows
2. The loan’s observable market price
3. The fair value of the collateral if the loan is collateral-
dependent (repayment solely based on collateral)
An institution may choose the appropriate impairment
measurement method on a pool or loan-by-loan basis for an
individually impaired loan, except for a collateral-dependent loan.3
Aside from the fact that these rules are inherently complex,
with several impairment models, another critical component of
the existing guidance is the distinction between accrual versus
disclosure. As subtle as it may seem, this is perhaps the most
significant justification for a new impairment model. According
to the rule, an allowance should be recorded in the financial
statements if it is “probable” that a loss will incur and the amount
can be reasonably estimated. Otherwise it should be disclosed
in the notes, or omitted altogether. In practice, this incurred loss
model delays recognition of loss by only considering past events
and current conditions.
In the words of Comptroller of the Currency John Dugan in 2009:
“When the [down]turn finally did come, and the tidal wave of losses
began hitting shore, banks have had to recognize losses through
a sudden series of increased provisions to the loan loss reserve,
which in turn has more than offset earnings and eaten into precious
capital. Stated differently, rather than being counter-cyclical, loan
loss provisioning has become decidedly pro-cyclical, magnifying
the impact of the downturn.”4
Post-Crisis Era and Why the Requirements Are Changing
While many institutions had been interpreting the existing
guidance more broadly and increasing reserves proactively as
problems arose, it is hard to argue that the incurred loss model
was working as intended.
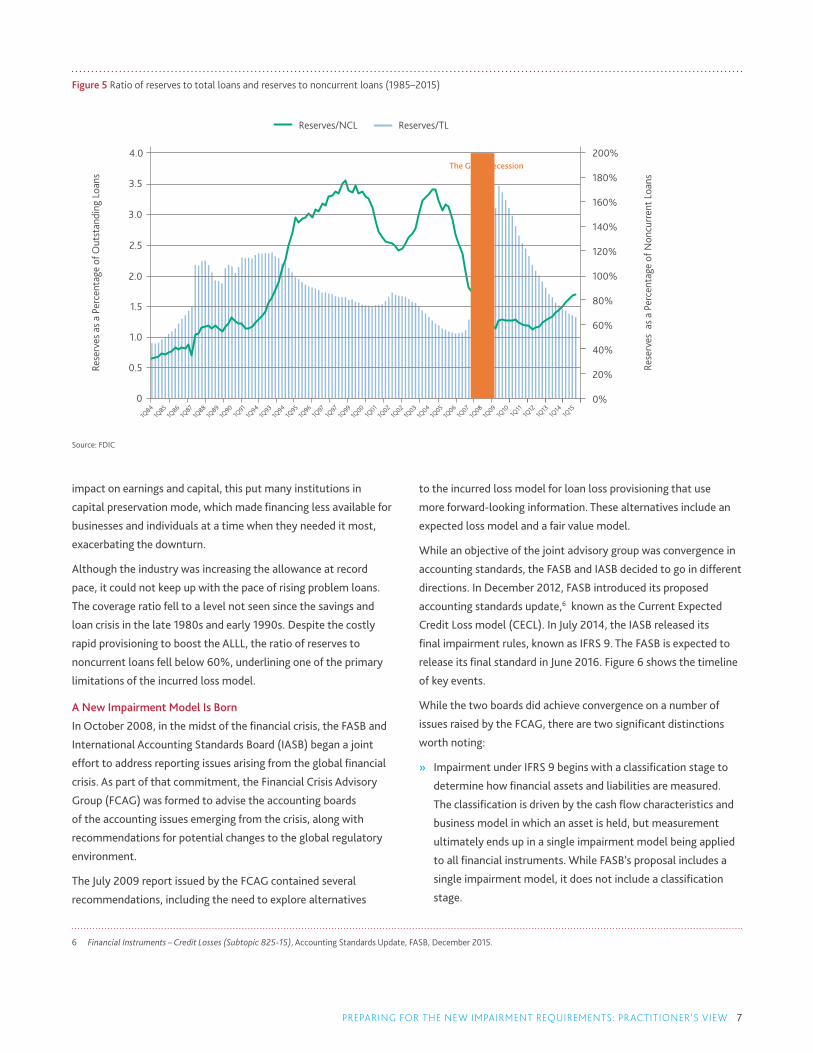
Figure 5 shows a 30-year time series of two important financial
ratios used when analyzing asset quality. The bars in the chart,
whose values are associated with the left vertical axis, show the
trend in the amount of reserves held by the industry relative to
the amount of outstanding loans. The quarterly average is 1.84%,
which means that for every $100 in loans, the industry was setting
aside just under $2 in reserves. During the financial crisis and
in its wake, the industry began rapidly setting aside reserves in
anticipation of greater future loan losses.
Now look at the line in the chart, whose values are associated
with the right vertical axis. On average, the average ratio of
reserves to noncurrent loans (defined as loans that are 90 days
or more past due or placed on nonaccrual status by the bank) has
been 100.16%, indicating that for every $100 of problem loans
the industry has set aside $100 in reserves. While it is debatable
whether banks should be reserving for the full amount of defaulted
loans (loss given default is generally less than 100%), the trend
in the two ratios leading into and through the Great Recession
highlights a major problem.
In the fourth quarter of 2009, the ratio of reserves to total loans
rose to more than 3%, nearly tripling in just two years. In order
for the industry to maintain an allowance that was believed to
be adequate for future loan losses, banks had to record $583
billion in provision expenses from 2008 to 2010.5 As a direct
A critical component of the existing guidance is the distinction between accrual versus disclosure. As subtle as it may seem, this is perhaps the most significant justification for a new impairment model.
3 Interagency Policy Statement on the Allowance for Loan and Lease Losses, Federal Reserve, December 2006..
4 Comptroller Dugan Urges Less Pro-Cyclical Approach to Reserves, Office of the Comptroller of the Currency, March 2009.
5 FDIC Quarterly Banking Profile (all insured institutions).
7PREPARING FOR THE NEW IMPAIRMENT REQUIREMENTS: PRACTITIONER’S VIEW
impact on earnings and capital, this put many institutions in
capital preservation mode, which made financing less available for
businesses and individuals at a time when they needed it most,
exacerbating the downturn.
Although the industry was increasing the allowance at record
pace, it could not keep up with the pace of rising problem loans.
The coverage ratio fell to a level not seen since the savings and
loan crisis in the late 1980s and early 1990s. Despite the costly
rapid provisioning to boost the ALLL, the ratio of reserves to
noncurrent loans fell below 60%, underlining one of the primary
limitations of the incurred loss model.
A New Impairment Model Is Born
In October 2008, in the midst of the financial crisis, the FASB and
International Accounting Standards Board (IASB) began a joint
effort to address reporting issues arising from the global financial
crisis. As part of that commitment, the Financial Crisis Advisory
Group (FCAG) was formed to advise the accounting boards
of the accounting issues emerging from the crisis, along with
recommendations for potential changes to the global regulatory
environment.
The July 2009 report issued by the FCAG contained several
recommendations, including the need to explore alternatives
to the incurred loss model for loan loss provisioning that use
more forward-looking information. These alternatives include an
expected loss model and a fair value model.
While an objective of the joint advisory group was convergence in
accounting standards, the FASB and IASB decided to go in different
directions. In December 2012, FASB introduced its proposed
accounting standards update,6 known as the Current Expected
Credit Loss model (CECL). In July 2014, the IASB released its
final impairment rules, known as IFRS 9. The FASB is expected to
release its final standard in June 2016. Figure 6 shows the timeline
of key events.
While the two boards did achieve convergence on a number of
issues raised by the FCAG, there are two significant distinctions
worth noting:
» Impairment under IFRS 9 begins with a classification stage to
determine how financial assets and liabilities are measured.
The classification is driven by the cash flow characteristics and
business model in which an asset is held, but measurement
ultimately ends up in a single impairment model being applied
to all financial instruments. While FASB’s proposal includes a
single impairment model, it does not include a classification
stage.
Figure 5 Ratio of reserves to total loans and reserves to noncurrent loans (1985–2015)
Source: FDIC
Reserves/NCL Reserves/TL
0.5
1Q90
1Q84
1Q85
1Q86
1Q87
1Q88
1Q89
1Q91
1Q94
1Q93
1Q94
1Q95
1Q96
1Q97
1Q97
1Q99
1Q00
1Q01
1Q02
1Q02
1Q03
1Q04
1Q05
1Q06
1Q07
1Q08
1Q09
1Q10
1Q11
1Q12
1Q13
1Q14
1Q15
0
1.0
1.5
2.0
2.5
3.0
3.5
4.0The Great Recession
200%
180%
160%
140%
120%
100%
80%
60%
40%
20%
0%
Rese
rves
as
a Pe
rcen
tage
of O
utst
andi
ng L
oans
Rese
rves
as
a Pe
rcen
tage
of N
oncu
rren
t Loa
ns
6 Financial Instruments – Credit Losses (Subtopic 825-15), Accounting Standards Update, FASB, December 2015.

8 MOODY'S ANALYTICS RISK PERSPECTIVES: THE CONVERGENCE OF RISK, FINANCE, AND ACCOUNTING
IASB issued IFRS 9
Figure 6 Timeline of key events leading to a new impairment model
Source: FASB
FASB published a proposed ASU to ECL » Remaining life » Cashflow-
based » Economic
conditions remain unchanged
Financial Crisis Advisory Group (FCAG)
published report on delayed recognition of losses and complexity
with different impairment approaches
that included forward-looking information.
Joint effort between FASB
and IASB to address
reporting issues arising
from the global financial crisis
IASB published Exposure Draft, adding further
support for a forward-looking measure of ECL
FASB and IASB published a
supplementary document
introducing “Good Book”
and “Bad Book” distinction
FASB published the Exposure Draft
“Proposed Accounting Standards Update,
Financial Instruments – Credit Losses.”
Introduced CECL.
FASB and IASB jointly released the “three-bucket” impairment model whereby credit instruments would have had different measurement approaches and migration criteria across buckets
October2008
July 2009
May2010
January 2011
July 2012
December 2012
2Q16FASB expected to release final standards for
CECL
July 2014
November2009
Comment periods, deliberations, refinements(2013 – Present)
9PREPARING FOR THE NEW IMPAIRMENT REQUIREMENTS: PRACTITIONER’S VIEW
» Under IFRS 9, full lifetime expected losses are to be measured
only if credit risk has increased significantly since initial
recognition. Otherwise, the impairment measurement period
is limited to twelve months from initial recognition. FASB’s
proposed model requires a life-of-loan forecast of credit losses
to be recorded at origination, regardless of credit quality.
Since the release of the FASB’s accounting standards update
more than three years ago, there have been comment periods,
deliberations and re-deliberations, and strong industry feedback.
The FASB has met with countless stakeholders – bankers,
regulators, auditors, solution providers, the SEC, the Public
Company Accounting Oversight Board (PCAOB), and members of
the investing community. As we draw closer to the soon-to-be-
final standard, the FASB has released several key decisions to date,
including the following:7
» An entity should apply the CECL model for financial assets
measured at amortized cost, such as loans, debt securities,
trade receivables, lease receivables, and any other receivables
that represent the contractual right to receive cash.
» An entity should consider available information relevant to
assessing the collectability of contractual cash flows, including
information about past events, current conditions, and
reasonable and supportable forecasts.
» An entity should consider all contractual cash flows over the
life of the related financial assets (life of loan).
» An entity’s estimate of expected credit losses should always
reflect the risk of loss, even when that risk is remote.
» Methods to estimate expected credit losses may include the
following: discounted cash flow, loss rates, probability of
default (PD), or a provision matrix using loss factors.
» FASB is expected to issue CECL in June 2016, which will be
effective for SEC registrants’ 2020 financial statements and
in 2021 for banks that are not SEC registrants. Early adoption
will be permitted for all organizations for fiscal years beginning
after December 15, 2018.
Under CECL, an institution will be required to impair (reflected as
an allowance for expected credit losses) its existing financial assets
based on an estimate of the present value of the contractual cash
flows not expected to be collected at the reporting date. Not only
will this remove the “probable” threshold in the current approach,
but it will also broaden the range of information to be considered
when estimating the allowance.
The following paragraphs illustrate some of the key changes CECL
may bring. There will not be a “one size fits all” approach when it
comes to implementation, a common misconception. The rules to
comply and the presentation of an entity’s financial statements
will largely be the same from one institution to the next, but how
they arrive at an estimate of expected credit losses will depend
on factors unique to the size and complexity of the institution’s
portfolio.
Measuring Expected Credit Loss
It is clear that the goal of CECL is to improve the process by which
institutions measure credit risk, to the benefit of third parties and
the institutions themselves.
The measurement of expected credit loss often starts with a look
to the past as a predictor of future performance. By grouping
financial assets into pools of similar risk characteristics, an
institution can look to its historical experience or the experience
of a suitable benchmark for those assets. Although no two credit
cycles are the same, reasonable inferences about the future
can be made from information from the past. In fact, that’s the
fundamental assumption in the current allowance process and in
most credit risk rating models.
CECL will not prescribe a specific methodology to be used for
measuring expected credit losses, but a logical approach toward
compliance would be one that starts with an institution’s current
risk rating practices, to the extent they are effective at both
differentiating the credit risk of borrowers within a portfolio and
producing a reliable financial measure of credit risk. That is a
limitation with which many institutions struggle. For example, if
80% of the loans in a relatively diverse commercial loan portfolio
share a similar rating, then it may be necessary for management
to revisit the effectiveness of its risk measurement process and
capabilities. The same recommendation would apply if the output
of the ratings is not calibrated to a specific risk measure such as a
PD or expected loss (EL).
The goal of CECL is to improve the process by which institutions measure credit risk, to the benefit of third parties and the institutions themselves.
7 FASB (as of March 23, 2016).
10 MOODY'S ANALYTICS RISK PERSPECTIVES: THE CONVERGENCE OF RISK, FINANCE, AND ACCOUNTING
Over the last decade, many regional banks and larger community
banks have sought to improve their risk rating practices by making
their internal ratings much less subjective. A common approach
has been a bifurcation of credit risk whereby borrowers are rated
on their likelihood of default (i.e., PD), and credit facilities are
rated on the severity of loss should default occur (i.e., LGD).
Through accurate risk measures, an institution can derive an
estimate of EL that could be used not only for managing risk, but
also as a foundation for CECL compliance.
Incorporating Current Conditions
Using historical averages as a basis for deriving forecasts of credit
quality is an approach widely accepted in the banking industry.
While such a through-the-cycle view has its merits, it loses
effectiveness when historical experience differs from prevailing
and near-term conditions.
Take the energy sector as a very recent and relevant example. With
oil prices continuing to hover around $40 per barrel as of March
2016 (compared to roughly $100 per barrel only two years ago),8
many energy companies are defaulting or nearing default on their
loans. At the same time, to hedge future credit losses, lenders are
curtailing lending and seeking to reduce exposure as they ramp up
reserves. If oil prices continue to remain at a level not seen since
the height of the financial crisis, the $3 trillion sector could soon
face a funding crisis with rippling effects cascading throughout the
broader economy.
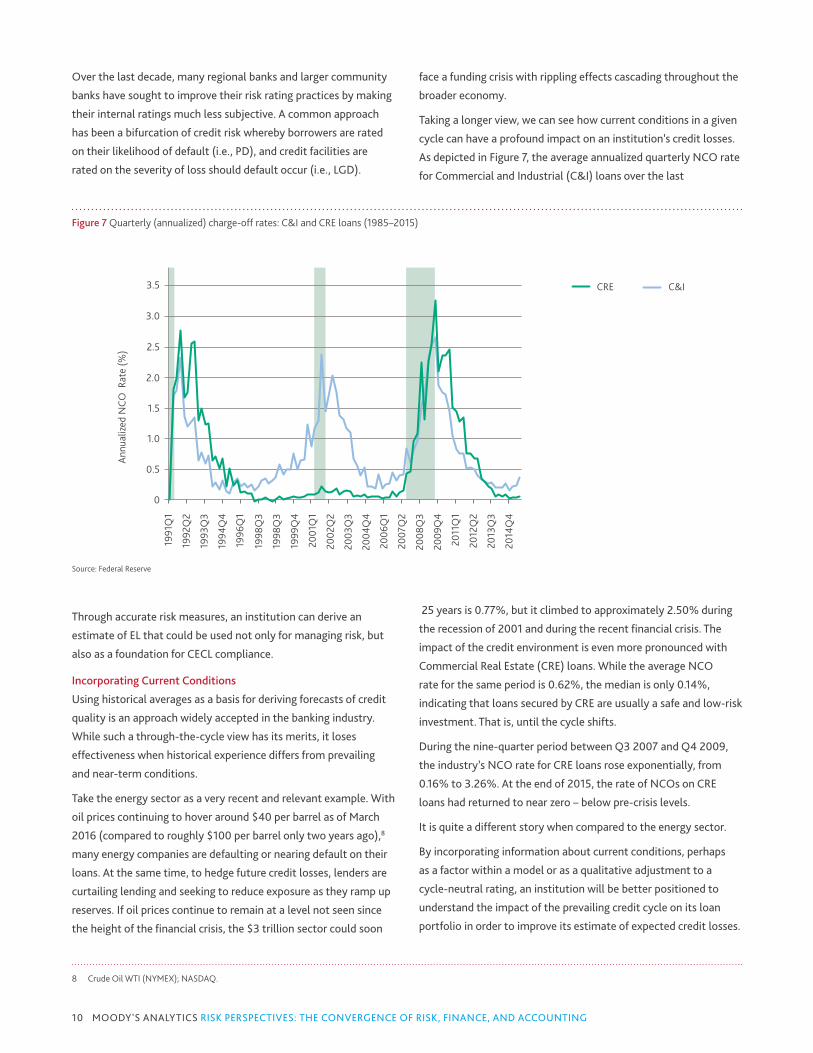
Taking a longer view, we can see how current conditions in a given
cycle can have a profound impact on an institution’s credit losses.
As depicted in Figure 7, the average annualized quarterly NCO rate
for Commercial and Industrial (C&I) loans over the last
25 years is 0.77%, but it climbed to approximately 2.50% during
the recession of 2001 and during the recent financial crisis. The
impact of the credit environment is even more pronounced with
Commercial Real Estate (CRE) loans. While the average NCO
rate for the same period is 0.62%, the median is only 0.14%,
indicating that loans secured by CRE are usually a safe and low-risk
investment. That is, until the cycle shifts.
During the nine-quarter period between Q3 2007 and Q4 2009,
the industry’s NCO rate for CRE loans rose exponentially, from
0.16% to 3.26%. At the end of 2015, the rate of NCOs on CRE
loans had returned to near zero – below pre-crisis levels.
It is quite a different story when compared to the energy sector.
By incorporating information about current conditions, perhaps
as a factor within a model or as a qualitative adjustment to a
cycle-neutral rating, an institution will be better positioned to
understand the impact of the prevailing credit cycle on its loan
portfolio in order to improve its estimate of expected credit losses.
Figure 7 Quarterly (annualized) charge-off rates: C&I and CRE loans (1985–2015)
Source: Federal Reserve
0.5
1991
Q1
1992
Q2
1993
Q3
1994
Q4
1996
Q1
1998
Q3
1998
Q3
2014
Q4
2013
Q3
2012
Q2
2011
Q1
2009
Q4
2008
Q3
2007
Q2
2006
Q1
2004
Q4
2003
Q3
2002
Q2
2001
Q1
1999
Q4
0
1.0
1.5
2.0
2.5
3.0
3.5 CRE C&I
Annu
aliz
ed N
CO R
ate
(%)
8 Crude Oil WTI (NYMEX); NASDAQ.

11PREPARING FOR THE NEW IMPAIRMENT REQUIREMENTS: PRACTITIONER’S VIEW
Predicting the Future
In parallel with the actions of the accounting boards to rectify
problems that arose during the financial crisis, the Federal Reserve
and other banking agencies were making waves of their own. The
accounting boards and banking agencies sought to incorporate
a more forward-looking view of credit risk, but they focused on
different measures. Whereas bank supervisors focused on low-
probability, high-impact events that could strain a firm's capital
adequacy, the FASB and IASB dedicated their efforts on accounting
for “reasonable and supportable” forecasts under more probable
scenarios. One way to look at it would be that the allowance
serves as a cushion for “expected” credit losses, and capital serves
to absorb tail events, or “unexpected” credit losses.
Without a forward-looking component in the estimation of loss
forecasting, reserves are inherently pro-cyclical. Banks add to
the allowance during periods of stress, usually when access to
financing is needed most, and they release reserves during periods
of expansion, when many businesses and individuals can meet
their financing needs with operating cash flow or discretionary
income. If implemented properly, CECL should enable institutions
to add to reserves when times are good, in anticipation of a shift
in the cycle, and to begin to release reserves when it appears the
worst is behind them, to help facilitate growth.
A forward-looking view requires an ability to predict the future.
The proposed update will require an entity to consider available
information relevant to assessing the collectability of contractual
cash flows, including information about past events, current
conditions, and reasonable and supportable forecasts. Once the
forecast and its impact on the portfolio can no longer be reliably
estimated, CECL will allow an entity to revert to historical credit
loss experience for future periods.
It is worth reiterating that the practical interpretation will
be different across institutions. What will be expected of a
community bank is not the same as what will be expected of
an institution that is subject to the Dodd-Frank Act Stress Tests
(DFAST). Institutions that are already translating macroeconomic
scenarios into a granular forecast of credit losses are well-
positioned to incorporate reasonable and supportable forecasts
into the allowance. Community banks will likely apply a broader
and more judgmental approach to deriving forecasts.
Extending Measurement Across the Life of the Loan
Most loans issued by banks do not mature within a year of
origination. However, many institutions set aside an allowance
for a year’s worth of charge-offs. Under CECL, a life-of-the-loan
forecast of credit losses will be recorded at origination, thereby
mandating reserves be set aside when a loan is made and
maintained throughout its contractual life. What’s more, the new
standard suggests that it is inappropriate to simply “gross-up”
annual measures. Figure 8 illustrates the difference between a
Figure 8 Term structure of default risk for a low-risk firm and a high-risk firm
Source: Moody's Analytics
Low-Risk Firm
0.50%
0
1.00%
1.50%
2.00%
2.50%
3.00%
3.50%
4.00%
0.52%
1.04%
1.56%
2.08%
2.60%
3.93%
2.97%
2.07%
1.24%
0.52%
1 2 3 4 5
Linear Prediction Non-Linear Prediction
Cum
ulat
ive
PD
Year
15.21%
10.14%
0
5.00%
10.00%
15.00%
20.00%
25.00%
30.00%
5.07%
8.92%
12.32%
15.43%
25.35%
20.28%
5.07%
1 2 3 4 5
Linear Prediction Non-Linear Prediction
Cum
ulat
ive
PD
Year
High-Risk Firm
18.31%

12 MOODY'S ANALYTICS RISK PERSPECTIVES: THE CONVERGENCE OF RISK, FINANCE, AND ACCOUNTING
term structure of default risk calculated on a purely linear basis
and one calculated on an empirically-derived non-linear basis.
The low-risk firm has a one-year PD of 0.52%. Assuming a five-
year maturity, the cumulative default risk is nearly 4% when
modeled empirically.9 That equates to nearly an eightfold increase
over a five-year period. When the term structure of default risk
is calculated by simply multiplying the one-year measure by the
number of years (i.e., linear rather than exponential (0.52% x
5)), the cumulative default risk is 2.60%, which is considerably
less than 3.93%. The opposite is the case with the high-risk firm,
which has a 5.07% one-year PD. On a linear basis, the five-
year cumulative default risk is more than 25%; however, on an
empirical basis, the probability of default over five years is only
about 18%. These two examples highlight the reality that the
term structure for low-risk firms is increasing (mathematically,
the intercept coefficient is positive), whereas for high-risk firms,
the term structure of PD is decreasing. This behavior follows a
somewhat mean-reverting pattern.
To summarize, with many institutions establishing an allowance
equal to an estimate of NCOs over a one-year horizon, the life-of-
loan requirement introduces complexity beyond the capabilities
most institutions currently possess. In our meetings with FASB
officials, we were able to confirm that CECL has no mandate for
modeling and leaves questions of methodology to individual
banks. Nonetheless, many of the objections to date are focused
on implementation. Bankers fear that regulators and auditors will
expect them to use the same tools and methodologies used by
larger banks, which is something they cannot afford to do.
Early Preparation
For jurisdictions under IFRS 9, the implementation deadline is set
firmly for January 2018. FASB’s CECL standard is slated for release
by June 2016, with implementation required by January 2020 for
SEC filers and January 2021 for all others. Given the significance of
the changes, financial institutions would benefit from a proactive
approach to develop the organizational capabilities necessary to
satisfy the new impairment requirements. Figure 9 highlights the
key actions management should consider to get started.
» Manage Expectations: Organizations will face questions
from a variety of stakeholders, including employees, auditors,
regulators, and investors. It is critical for management
to understand the new guidance and be able to clearly
communicate to stakeholders how the organization may
be affected financially and non-financially. Communicating
early and often regarding the potential impact, the firm’s
implementation plan, and progress in the firm’s preparations
will be essential to managing expectations.
» Establish Program Governance: Implementation of the
new impairment accounting rules will require resources and
coordination from across the organization, including lending,
risk, finance, and IT. A steering committee should be developed
with ultimate responsibility for implementation of the new
framework. The committee can form task groups to focus on
specific workstreams such as modeling, data infrastructure, and
reporting.
» Perform Financial Impact Analysis: Management will not know
the exact impact of the new standards on the organization’s
financial statements until the new framework has been
implemented at an enterprise level. However, pilot tests on
segments of the portfolio using simplifying assumptions (i.e.,
flat LGD term structure) can help management identify a range
of possible outcomes. These results can be socialized with peer
institutions and compared to public impact studies.
» Perform Gap Analysis: Management must identify what in its
“toolbox” will help the organization meet the requirements.
What approaches meet basic requirements? What data,
models, and technology can the bank repurpose, and who owns
these within the organization?
» Develop an Initial Roadmap: The gap analysis will identify
relevant existing tools, as well as areas where the organization
must develop new capabilities. These findings will inform the
organization’s roadmap for implementation. The roadmap
should identify the key objectives, major milestones, and broad
timelines spanning preparation through implementation. The
roadmap sets the development priorities for the program and
Figure 9 Suggested action items for bank management
Source: Moody's Analytics
Manage Expectations
Establish Program Governance
Perform Financial Impact Analysis
Perform Gap Analysis
Develop an Initial Roadmap
9 Moody’s Analytics RiskCalc v4.0 Corporate Model.

13PREPARING FOR THE NEW IMPAIRMENT REQUIREMENTS: PRACTITIONER’S VIEW
serves as the foundation for a more detailed project plan. Major
milestones typically include methodology design, software
implementation, and impact analysis (i.e., parallel run). As part
of the roadmap, the organization should determine whether to
seek an accelerated path to achieve early adoption. Even the
most advanced institutions may need at least 18 months to go
live with a new impairment framework.
Core Capabilities Required
Figure 10 summarizes the core set of capabilities institutions will
need to estimate credit impairment under the new standard. The
analytical rigor demanded in each category may vary widely across
institutions and portfolio segments.
Expected credit losses must represent an unbiased estimate
using reasonable and supportable information about past events
and current conditions, as well as forecasts of future economic
conditions. To account for forecasts of future economic conditions,
institutions will need to source economic scenarios internally or
by third parties. They must determine which variables to forecast,
the number of possible outcomes to consider, the likelihood of the
possible outcomes, and the source(s) of the economic forecast.
Large financial institutions have developed economic forecasting
capabilities for stress testing purposes,10 but economic forecasting
is likely to represent a capability gap for most financial institutions.
Credit data encompasses the current information required to
estimate credit losses for each of the exposures in the portfolio
(balances, commitment, PD/LGD profile, cash flow profile, etc.).
In addition, it includes the credit research data required to develop
loss estimation models that are trained using historical data. Some
institutions will need to develop the capability to integrate all
the loan accounting and risk profile data into a single system for
impairment calculations. In addition, firms will need to aggregate
historical credit risk data from internal and external sources to
facilitate credit risk model development.
Credit modeling represents the analytical tools required to
estimate probability of default, loss severity, exposure at
default, and/or expected losses for the various segments of the
portfolio. Some institutions have developed sophisticated model
development and validation functions to support internal model
development. Others have outsourced some of these capabilities,
leveraging the data or expertise of third parties for specific asset
Figure 10 Core capabilities required for new impairment calculations
EconomicScenarios
CreditData
Analysis & Reporting
Workflow & Overlay
Management
SensitivityAnalysis
Credit Modeling &
EL Calculation
Credit Impairment
Analysis
Source: Moody's Analytics
10 For example, CCAR banks in the US are required to generate firm-specific stressed loss forecasts in addition to the regulatory scenarios.

14 MOODY'S ANALYTICS RISK PERSPECTIVES: THE CONVERGENCE OF RISK, FINANCE, AND ACCOUNTING
classes. Regardless of the source of these tools, the models must
be powerful, forward-looking estimates of credit risk throughout
the life of the exposure. Some institutions have developed credit
risk models for Basel and internal risk management purposes.
In most cases these will need to be modified to extend the
forecasting horizon (most current models estimate credit risk over
a one-year horizon) and to reflect current and forward-looking
information.
Institutions must also develop the capability to perform sensitivity
analysis. In the context of impairment calculation, this refers to
the ability to test the sensitivity of the impairment estimates
to model assumptions. Sensitivity analysis could take place in
various forms, including changing the scenarios or the probability
assigned to each scenario, or using alternative credit risk models
to estimate credit losses. This could be a very manual process, or it
could be carried out in a controlled environment with auditability,
reporting, and archiving features. Ultimately, the idea is to better
inform management of the uncertainty around the impairment
estimates.
Workflow and overlay management and analysis and reporting
focus on the operating environment used for impairment
calculations. Because impairment values are used directly in
an organization’s financial statements, they require strong
governance and controls. Unlike risk parameter estimates used
for regulatory reporting, risk estimates used for impairment
calculation will fall directly under the purview of auditors. The
calculation environment will ideally support workflow and overlay
management to define user roles and track overrides to model
estimates. The system will need to integrate the scenarios, data,
models, and provision calculations in a way that facilitates user
interactivity and auditability.
In many jurisdictions, reporting requirements for regulated
financial institutions are being adapted to reflect changes in the
impairment framework. Institutions would be required to explain
the drivers of the changes in provisions between reporting periods.
For example, banks may need to separate changes due to new
originations, asset disposal, change in the risk of existing loans,
and changes due to updates in the estimation methodology.
Furthermore, management may have its own preferences
regarding the analysis and reports that will be disseminated
throughout the organization. Accordingly, institutions may need
to enhance reporting capabilities to address new and evolving
reporting requirements.
Large institutions have developed robust data repositories and
reporting infrastructures to address Basel and stress testing
requirements, but enhanced reporting will pose a particular
challenge to small and mid-size institutions. Technical footprint,
performance, flexibility, and compatibility with existing
systems should be carefully considered when investing in a new
infrastructure solution.
Conclusion
While we await the release of the final standard, we interpret CECL
to be consistent across institutions. However, implementation of
the rules will be unique to the size, complexity, and geographical
footprint of the institution. One size certainly will not fit all. The
capabilities required to be compliant will differ throughout the
industry, but the mandate to provide stakeholders with actionable
information about an institution’s credit risk will not.
For all its shortcomings, CECL should bring about a more
comprehensive view and a disciplined approach for quantifying
the expected credit losses inherent in an institution’s financial
instruments.

15 MOODY'S ANALYTICS RISK PERSPECTIVES: THE CONVERGENCE OF RISK, FINANCE, AND ACCOUNTING
© 2016 Moody’s Corporation, Moody’s Investors Service, Inc., Moody’s Analytics, Inc. and/or their licensors and affiliates (collectively, “MOODY’S”). All rights reserved.
CREDIT RATINGS ISSUED BY MOODY’S INVESTORS SERVICE, INC. AND ITS RATINGS AFFILIATES (“MIS”) ARE MOODY’S CURRENT OPINIONS OF THE RELATIVE FUTURE CREDIT RISK OF ENTITIES, CREDIT COMMITMENTS, OR DEBT OR DEBT-LIKE SECURITIES, AND CREDIT RATINGS AND RESEARCH PUBLICATIONS PUB-LISHED BY MOODY’S (“MOODY’S PUBLICATIONS”) MAY INCLUDE MOODY’S CURRENT OPINIONS OF THE RELATIVE FUTURE CREDIT RISK OF ENTITIES, CREDIT COMMITMENTS, OR DEBT OR DEBT-LIKE SECURITIES. MOODY’S DEFINES CREDIT RISK AS THE RISK THAT AN ENTITY MAY NOT MEET ITS CONTRACTUAL, FINANCIAL OBLIGATIONS AS THEY COME DUE AND ANY ESTIMATED FINANCIAL LOSS IN THE EVENT OF DEFAULT. CREDIT RATINGS DO NOT ADDRESS ANY OTHER RISK, INCLUDING BUT NOT LIMITED TO: LIQUIDITY RISK, MARKET VALUE RISK, OR PRICE VOLATILITY. CREDIT RATINGS AND MOODY’S OPINIONS IN-CLUDED IN MOODY’S PUBLICATIONS ARE NOT STATEMENTS OF CURRENT OR HISTORICAL FACT. MOODY’S PUBLICATIONS MAY ALSO INCLUDE QUANTITA-TIVE MODEL-BASED ESTIMATES OF CREDIT RISK AND RELATED OPINIONS OR COMMENTARY PUBLISHED BY MOODY’S ANALYTICS, INC. CREDIT RATINGS AND MOODY’S PUBLICATIONS DO NOT CONSTITUTE OR PROVIDE INVESTMENT OR FINANCIAL ADVICE, AND CREDIT RATINGS AND MOODY’S PUBLICATIONS ARE NOT AND DO NOT PROVIDE RECOMMENDATIONS TO PURCHASE, SELL, OR HOLD PARTICULAR SECURITIES. NEITHER CREDIT RATINGS NOR MOODY’S PUBLICATIONS COMMENT ON THE SUITABILITY OF AN INVESTMENT FOR ANY PARTICULAR INVESTOR. MOODY’S ISSUES ITS CREDIT RATINGS AND PUB-LISHES MOODY’S PUBLICATIONS WITH THE EXPECTATION AND UNDERSTANDING THAT EACH INVESTOR WILL, WITH DUE CARE, MAKE ITS OWN STUDY AND EVALUATION OF EACH SECURITY THAT IS UNDER CONSIDERATION FOR PURCHASE, HOLDING, OR SALE.
MOODY’S CREDIT RATINGS AND MOODY’S PUBLICATIONS ARE NOT INTENDED FOR USE BY RETAIL INVESTORS AND IT WOULD BE RECKLESS AND INAPPRO-PRIATE FOR RETAIL INVESTORS TO USE MOODY’S CREDIT RATINGS OR MOODY’S PUBLICATIONS WHEN MAKING AN INVESTMENT DECISION. IF IN DOUBT YOU SHOULD CONTACT YOUR FINANCIAL OR OTHER PROFESSIONAL ADVISER.
ALL INFORMATION CONTAINED HEREIN IS PROTECTED BY LAW, INCLUDING BUT NOT LIMITED TO, COPYRIGHT LAW, AND NONE OF SUCH INFORMATION MAY BE COPIED OR OTHERWISE REPRODUCED, REPACKAGED, FURTHER TRANSMITTED, TRANSFERRED, DISSEMINATED, REDISTRIBUTED OR RESOLD, OR STORED FOR SUBSEQUENT USE FOR ANY SUCH PURPOSE, IN WHOLE OR IN PART, IN ANY FORM OR MANNER OR BY ANY MEANS WHATSOEVER, BY ANY PERSON WITHOUT MOODY’S PRIOR WRITTEN CONSENT.
All information contained herein is obtained by MOODY’S from sources believed by it to be accurate and reliable. Because of the possibility of human or me-chanical error as well as other factors, however, all information contained herein is provided “AS IS” without warranty of any kind. MOODY’S adopts all necessary measures so that the information it uses in assigning a credit rating is of sufficient quality and from sources MOODY’S considers to be reliable including, when appropriate, independent third-party sources. However, MOODY’S is not an auditor and cannot in every instance independently verify or validate information received in the rating process or in preparing the Moody’s Publications.
To the extent permitted by law, MOODY’S and its directors, officers, employees, agents, representatives, licensors and suppliers disclaim liability to any person or entity for any indirect, special, consequential, or incidental losses or damages whatsoever arising from or in connection with the information contained herein or the use of or inability to use any such information, even if MOODY’S or any of its directors, officers, employees, agents, representatives, licensors or suppliers is advised in advance of the possibility of such losses or damages, including but not limited to: (a) any loss of present or prospective profits or (b) any loss or damage arising where the relevant financial instrument is not the subject of a particular credit rating assigned by MOODY’S.
To the extent permitted by law, MOODY’S and its directors, officers, employees, agents, representatives, licensors and suppliers disclaim liability for any direct or compensatory losses or damages caused to any person or entity, including but not limited to by any negligence (but excluding fraud, willful misconduct or any other type of liability that, for the avoidance of doubt, by law cannot be excluded) on the part of, or any contingency within or beyond the control of, MOODY’S or any of its directors, officers, employees, agents, representatives, licensors or suppliers, arising from or in connection with the information contained herein or the use of or inability to use any such information.
NO WARRANTY, EXPRESS OR IMPLIED, AS TO THE ACCURACY, TIMELINESS, COMPLETENESS, MERCHANTABILITY OR FITNESS FOR ANY PARTICULAR PURPOSE OF ANY SUCH RATING OR OTHER OPINION OR INFORMATION IS GIVEN OR MADE BY MOODY’S IN ANY FORM OR MANNER WHATSOEVER.
Moody’s Investors Service, Inc., a wholly-owned credit rating agency subsidiary of Moody’s Corporation (“MCO”), hereby discloses that most issuers of debt securi-ties (including corporate and municipal bonds, debentures, notes and commercial paper) and preferred stock rated by Moody’s Investors Service, Inc. have, prior to assignment of any rating, agreed to pay to Moody’s Investors Service, Inc. for appraisal and rating services rendered by it fees ranging from $1,500 to approximately $2,500,000. MCO and MIS also maintain policies and procedures to address the independence of MIS’s ratings and rating processes. Information regarding certain affiliations that may exist between directors of MCO and rated entities, and between entities who hold ratings from MIS and have also publicly reported to the SEC an ownership interest in MCO of more than 5%, is posted annually at www.moodys.com under the heading “Investor Relations — Corporate Governance — Direc-tor and Shareholder Affiliation Policy.”

Find additional integrated risk management articles, interviews, and multimedia content at MoodysAnalytics.com/RiskPerspectives
Asia (excluding Japan)[email protected]
© 2016 Moody’s Corporation, Moody’s Investors Service, Inc., Moody’s Analytics, Inc. and/or their licensors and affiliates (collectively, “MOODY’S”). All rights reserved.
CONTACT US Visit us at moodysanalytics.com or contact us at a location below: