prepublication version of accepted paper. please … · prepublication version of accepted paper....
TRANSCRIPT

1
Prepublication version of accepted paper. Please cite as: Clott, Christopher B., Bruce Hartman, Elizabeth Ogard, and Althea Gatto. (2014) “Container
Repositioning and Agricultural Commodities: Shipping Soybeans by Container from US Hinterland to
Overseas Markets”. Research in Transportation and Business Management. DOI:
10.1016/j.rtbm.2014.10.006.
Container Repositioning and Agricultural Commodities: Shipping Soybeans by Container from US Hinterland to Overseas Markets
Christopher Clott Ph.D. Dean, College of Business and Health Administration,
University of St. Francis, Joliet, IL 60435 Email: [email protected]
Bruce C. Hartman Ph.D. Professor of Logistics, Intermodal Transportation Institute,
University of St. Francis, Joliet, IL 60435 Email: [email protected]
Elizabeth Ogard, President, Prime Focus LLC, De Pere WI 54115.
Althea Gatto, Research Assistant, College of Business and Health Administration,
University of St. Francis, Joliet, IL 60435 Email: [email protected]
Abstract
Export by container offers advantages for moving agribusiness products due to the availability of empty
import containers that can be repositioned, making accessible inland “dry ports” more important in
supply chains. This paper assesses the impact and challenges of increasing containerized movements of
agricultural commodities from hinterland points to overseas markets, regarding both operations and
governance. Products like soybeans have complex supply chains affected by weather, seasonality, price,
equipment availability, congestion, modal delay, cargo ownership, and sustainability or product quality
requirements. About 5-7% of the total US soybean export crop moves in ocean containers today; with
business and governmental support, 12-15% could be attained, benefitting soybean producers, ports,
ocean carriers, and shippers. Our case study of soybeans exported from the US state of Illinois examines
a number of major operational issues, actions, rules and policies affecting this containerized flow and its
total landed cost. One factor, delays in barge links, is studied with a commodity flow model combining
product movement with container repositioning. Study of this case can shape operations practice and
decisions for governance of intermodal agricultural product export movements.
1. Introduction
Issues of equipment balance and repositioning of equipment are of growing concern to the maritime
industry (Hartman and Clott, 2014; Monios and Wang, 2014). Marine carriers optimize their inland
intermodal network based on market demand and the ability to reload empty containers if possible for
export destinations. Global trade economics suggests a trade-off between scale economies and
transport costs; where a facility is located will have much to do with its supply cost and ability to serve

2
its potential customers. In the US, several inland dryport destinations have sufficient inbound density of
intermodal container shipments and the ability to load export containers to meet demand.
Exporting bulk agricultural commodities from hinterland points in the Midwest to overseas markets has
primarily used the lowest cost mode of transportation. Barges on the inland river system are cheapest
for bulk transportation, yet are dependent upon public investment to maintain the inland waterway.
Rail shuttle trains compete with barges and move goods on a privately funded rail network, faster but
more expensively. Both methods rely on economies of scale. Lack of public investment in the US inland
waterway system led to deterioration of locks and dams for barge moves (Kruse, 2011). Spot shortages
of privately owned rail hopper cars and lack of bulk storage facilities in overseas markets have led
agribusiness exporters to identify alternative modes of transportation. The use of ocean containers is a
potential solution to moving soybeans for export if a balanced flow of international containers can be
identified (Monios and Wang, 2014). To capture the flow of inbound loaded containers and match them
to outbound transport lanes, many governance and operational issues must be addressed. These
include local truck weight restrictions, investment in adequate storage/transload operations, and
equipment availability (Ogard, 2012), as well as infrastructure maintenance and adequate traffic
capacity for these products.
In this paper we analyze business decisions related to shipping more agricultural product in containers.
We will use the export of soybeans in containers from the hinterland state of Illinois to address the
question whether a potentially cost effective export supply chain can aid in the relocation of containers
to points of origin, control landed cost, and meet enhanced soybean quality requirements. Can soybean
container shipments be increased from the current small percentage of total exports (5-7%) to a larger
level (12-15%)? What are the preconditions necessary for this increase, and what steps can ports and
policy makers institute to develop additional export potential?
This paper is structured as follows: Section 2 briefly reviews literature on dryport development and its
relation to agricultural exports; Section 3 describes the case scenario economics; Section 4 discusses
characteristics of transport modes for soybeans; Section 5 analyzes directional flows, strengths and
weaknesses; Section 6 models one factor, barge delays, affecting soybean flow and container
positioning in this region; and Section 7 concludes with discussion, implications for management and
scholarly contribution.
2. Dryport Development
Dryport development has spurred the clustering of logistical activities in locations actively integrated
with supply chain management strategies (Rodrigue and Notteboom, 2012). Monios and Wilmsmeier
(2012) argued that the space and scale of competitive strategies can be understood by the drivers (e.g.
port authority, port terminal, rail operator, public organization) and direction of development. The
growth of intermodal in the United States has changed the function and layout of dryport terminals.
Larger stacking areas, storage areas and higher turnover levels have created the need for large amounts
of open space and ready accessibility to maritime and land transport (Wilmsmeier et al., 2011; Rodrigue
and Notteboom, 2011). Supply chain integration for container shipping has further changed shipper

3
behavior, with a premium on the ability to respond rapidly to volatile market changes and accessibility
to key consumer markets (Lam and Van de Voorde, 2011).
A few intermediary or transshipment ports have developed with specific features, enabling a modal shift
from road transport to rail or barge with overlapping service areas of individual inland terminals (Roso
and Lumsden, 2010). These large load centers function as cargo bundling points to seaport destinations,
or other points in the hinterland. The function of the inland terminal as a point for loading of empty
containers is a byproduct of large distribution centers near the central location with intermodal gateway
functions. Logistics pools develop by combining strong intermodal orientation with cluster advantages
(Notteboom & Rodrigue, 2005). Synergies and economies of scale make certain hinterland locations
attractive and encourage further concentration within the area (Van Klink, 1998; Rodrigue et.al., 2010).
The concept of a dry port as a logistics node for container moves of bulk agricultural commodities for
export is relatively new in North America (Prentice, 2012). Ocean carriers, as asset owners, control
pricing of the transportation they provide or purchase from suppliers such as railroads and trucking
companies. The asset owner is ultimately responsible for repositioning empty equipment from surplus
points to points of market demand. Shippers who can reposition equipment to desirable markets are
often provided favorable pricing (Ogard, 2012). Agricultural commodities with proximity to
transportation hubs can utilize a dryport as a connecting station for asset owners to enhance their
competitiveness (Bichou and Grey, 2005).
Few inland US markets have inbound density of intermodal container shipments, the ability to
load export containers to virtually every corner of the world, and a surplus of agricultural products for
export. Large dryport hubs are located in the inland US State of Illinois. They are unique due to the
amount of inbound and outbound cargo that transits, assuring an abundant supply of empty
international equipment for export. Illinois and the Midwestern United States is also a fertile region
with a gentle topography, a favorable climate and ample water. It has become the “breadbasket” for
the world, due to highly efficient farms and its access to multiple forms of transportation. Soybeans are
one of the state’s most prominent crops.
3. Study Area Economic Overview
US soybean products compete with product grown in Brazil, Argentina, Russia and Ukraine, among
others to supply Asian, Middle Eastern and European markets. Agricultural products are extremely price
sensitive and subject to constant fluctuations in supply and demand. Transportation costs are a major
factor in whether or not the price is competitive in world markets.
Brazil is the biggest competitor to the US. Its peak season for export is May through September,
whereas US exports peak October through February. Table 1 shows various costs for shipments to
China. The Illinois-Iowa area had an approximately $30/MT advantage vs. Mato Grosso Brazil in
December 2013, out of a total customer cost of nearly $600/MT (STC, 2014). However, averages for the
2013 year indicate advantages for Brazil of about the same size. If infrastructure development in Brazil
takes place as planned (Salin, 2014), Brazil transport costs may drop. It is crucial for US costs to keep
pace if containerized exports are to grow.

4
Table 1 Customer costs and transportation costs from US and Brazil to Shanghai, December and year average. Source: author, from Salin, 2014; STC, 2014.
Illinois
Illinois was the largest soybean exporting state in the US in 2013 (the adjoining state of Iowa is also a
major soybean exporter), with a value estimated at $3.1 billion and a production of approximately 461
million bushels (ILSOY, 2013; USDA/NASS, 2014). Shipments out of state are about 40% of that, with
35% transported by barge, 35% by rail, and 29% by container. Ninety two percent (92%) of these are for
export to China, Europe and Japan; with the majority routed to Midwest and Southeast ports (Eriksen,
2013). Soybeans represent almost 2/3 of all container export agricultural inspections, dwarfing corn
and wheat (Eriksen, 2013). Major firms such as Archer Daniels Midland (ADM), Cargill, Louis Dreyfus,
and Bunge are involved in all phases. Containerized soybeans for export have grown every year and are
now about 8% of the Illinois market. (Ogard, 2012). Inland intermodal locations at Rochelle, Joliet, and
DeKalb in Illinois are important container export points for the beans.
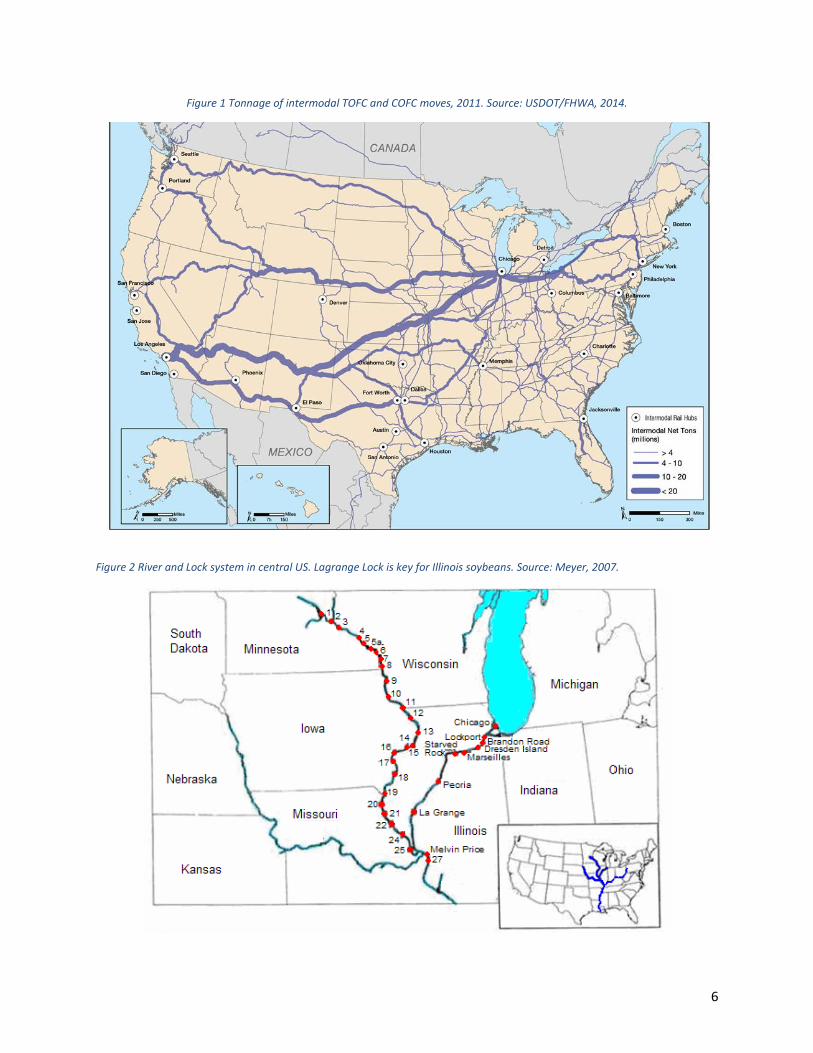
Rail carriers are most efficient when they can run full trains from one market to another without
intermediate stops. Illinois is one of the few which can support a railroad operating model (Figure 1,
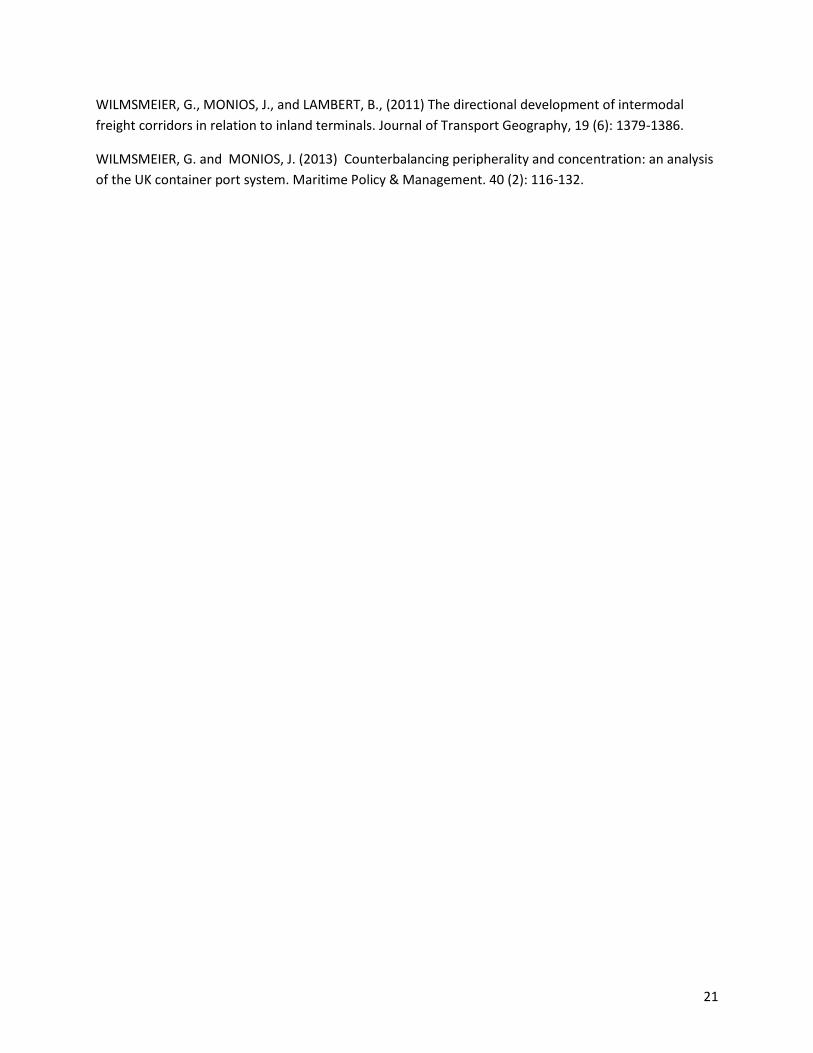
USDOT/FHWA 2014). Illinois exports can also use the U.S. inland waterway system (Figure 2, Meyer
2007), with more than 238 locks. Approximately 58% of US farm exports currently move by barge to
facilities on the lower Mississippi River where they are loaded on oceangoing bulk ships (Steenhoek,
2013).
4. Transport Modes for Soybeans
Barge and Rail Hopper Cars
Movement of bulk quantities of soybeans for export traditionally used river barges through the U.S.
inland waterways system to Gulf ports such as New Orleans. For crop producers located more than 60
miles away from the river barge networks, railroad shuttle trains have been an economic transport
alternative. These range from 60-120 railcars and move to coastal ports for transloading to bulk vessels.
Both rail and barge are more cost effective than trucking due to their ability to move large quantities of
heavy dense product efficiently with a minimum of handling. Rail is about 3 times more expensive than
barge ($90.91/MT vs $25.98 recently (USDA/AMS, 2014b) but typically moves product to Atlantic or
Pacific ports for export rather than Gulf ports, for better transit times.
Costs from Davenport IA Mato Grosso, BR Davenport IA Mato Grosso, BR
to Shanghai Dec-2013 Dec-2013 All 2013 All 2013
Product cost 466.64$ 445.27$ 517.76$ 415.28$
Ocean 54.13$ 42.50$ 46.76$ 40.96$
Barge 33.90$ 21.38$
Rail 27.93*
Truck 12.42$ 109.29$ 11.56$ 116.40$
Customer cost 567.09$ 597.06$ 604.46$ 572.64$
ADVANTAGE 29.97$ (29.97)$ (31.82)$ 31.82$
*IA transport cost for year is a blend of rail and barge since river freezes part of year;
customer cost reflects blend.

5
Barge delays can vary from hours at each lock to days over the entire journey, adding significantly to
total landed cost and uncertainty of product delivery. Half the locks are over 50 years old and one third
over 75 years old with a useful designed life of river locks of approximately 50 years (Kruse, 2011).
Major maintenance and rehabilitation investments have prolonged the useful life by about 50% from
the original designed lifespan, but time is running out on these life extending measures (Ford, 2013).
Control and maintenance of the inland waterway locks in the United States has long been under the U.S.
Army Corps of Engineers, with deferred maintenance issues threatening the reliability of the overall
system (Belz, 2013; Kruse, 2011).
Due largely to uncertainties of barge transportation, farmers are looking to rail lines to haul shipments
from the Midwest for export. The western based BNSF, Union Pacific (UP), and Canadian National (CN)
Class I railroads have made significant capital investments in rail transport and terminal expansion to
move agricultural shipments from the Midwest to the West Coast. In 2013, private sector rail capital
investment approached $24 billion (AAR, 2014). The Eastern US based Norfolk Southern (NS) and CSX
Transportation railroads have upgraded capabilities in the East and Southeast US to handle agricultural
exports to growing ports on the Atlantic Ocean and Gulf of Mexico. However, rail costs have increased
more than barge freight rates, and the movement of shale based energy inputs such as fracking sand
and oil machinery as well as tank cars of crude oil has caused rail capacity and congestion issues in the
Upper Midwest US (Doering, 2014). The increased competition for unit train capacity has created a
scenario for rising rail prices; Meyer (2007) modeled a potential 25% increase for agricultural products.
Since the rapid adoption of corn to make ethanol, the majority of rail hopper cars are utilized for grain
moves out of the Great Plains states, (Minnesota, North and South Dakota, Nebraska, Kansas) to the
ports of Tacoma and Seattle (Prentice, 2003; Keith, 2013).
Containers
A simple economic advantage for moving soybeans in containers is eliminating competition for scarce
rail bulk equipment capacity. Containerized soybeans can move with other intermodal rail cargo, subject
to those tariffs, rather than potential price increases for bulk movements. Unit trains for soybeans
could be built at some depots, but others could mix soybean containers with other intermodal traffic,
say machinery or retail product export in containers. Rail congestion affects intermodal traffic, of
course; but there would be increased flexibility in routing, improved reliability, potentially quicker
scheduling and movement, and pricing commensurate with other containerized loads. Railroads would
have increased cargo to build large intermodal trains for moves to ports.
The need to segregate ‘Identity Preserved’ product, which can be traced throughout the chain and can be distinguished from Genetically Modified Organisms (GMO’s), is essential to global soybean buyers (Stein and Rodriguez-Cerezo, 2010). Containerized shipping helps buyers maintain a traceable link between the point of origin, the seeds used, and the designated overseas buyer.
6
Figure 1 Tonnage of intermodal TOFC and COFC moves, 2011. Source: USDOT/FHWA, 2014.
Figure 2 River and Lock system in central US. Lagrange Lock is key for Illinois soybeans. Source: Meyer, 2007.

7
The process of linking origin to destination is very difficult in bulk moves designed to channel large
volumes from multiple farms that export via barge or hopper car. Few international buyers of soybeans
desire a full bulk ship load, or the entire contents of one hold. It is not economical to charter a ship
unless it is nearly full, so cargoes are often layered in holds separated by plastic tarpaulins. This
increases the possibility of contamination or mixing of one crop by another, posing potential quality and
identity problems. Crops that can be traced to a specific growing region and seed stock can bring a
higher price. A buyer who pays a premium for a soybean with superior protein content expects all to
meet a minimum standard. Contaminated shipments may require additional testing or be refused
altogether (Kosior, et. al, 2002).
Soybeans loaded in containers are not subject to additional handling and can be more easily traced back
to the origin so the specific characteristics of a shipment are what were contracted for. Containerized
soybean exports can be bagged for more expensive food grade soy, shipped in ventilated containers, or
blown into an ordinary container and distributed by means of an auger. Containerized cargo can be
certified and move intact to interior markets in China which typically have little to no storage. Grain
bulk terminals in China and some other countries are less efficient than container terminals, where
there has been more modernization to support export growth (Merk and Deng, 2012). Other benefits
for soybean producers include scheduling to meet capacity and minimize inventory holding costs.
Containers allow for expanded transportation alternatives with minimum public sector investment if
they can be loaded at the terminal to full visual capacity of the container (Kulisch, 2013).
There are some problems with the export of agricultural commodities like soybeans in containers.
1) Soybeans loaded away from the rail terminal must conform to Federal, State and Local truck size and
weight rules or apply for a permit to move on public highways. Growing concern has been expressed
about the damage to highways as a result of overloaded containers; Bilal (2010) estimates overweight
trucks approximately quadruple the highway maintenance cost per 1000 mi traveled, from about $100
to about $400. But others (Informa, 2009) say modest weight limit increases, sufficient for fully loaded
soybean containers, may cause less damage by reducing miles. State and local truck size and weight
regulatory governance limits the potential of container exports (Reese, 2010); smaller rural communities
with roads that move agricultural products want to recover increased maintenance costs through local
overweight permits, adding increased transaction cost and delay to each move. Policies to unify
permitting and weight limits have proved very difficult to implement because of these local interests
(Greuling, 2013).
2) Product is located on farms far from the cities that are typically destinations for containerized
imports. To alleviate this, import steering alliances, or “matchbacks”, are being pursued by major
importers, exporters, ocean carriers and merchandisers, to coordinate supply chains and attempt to
utilize inland rail hubs as points for container consolidation (Leach and Mongelluzzo, 2013).
3) The seasonal nature of agricultural production concentrates high demand during particular harvest
periods, and must be balanced against variable import demand for consumer goods (Leach and
Mongelluzzo, 2013). 75% to 80% of all U.S. export soybeans move in the September to February period,

8
prior to the South American harvest season, to maximize farmer profit (Keith, 2013). Containers must
be available at that time to be used for export.
4) Crop yields can rise and fall dependent upon weather related variables from year to year. Drought
periods can stay for multiple years while bumper harvests can be difficult to predict with certainty. The
hedging of prices for agricultural commodities through institutions such as the Chicago Board of Trade
(CBOT) has long been in place to manage these supply and demand discrepancies. This means that
cargo ownership can change during transit. Both price and supply volatility challenge operations
planning and governance has limited effect in the US in these areas.
5) The heavier weight of agricultural commodities bulk or bag loaded into containers creates the need
for 20 foot containers that will weigh out vs. predominant moves of consumer imports in 40 foot
containers that cannot be loaded to full cubic capacity with soybeans, due to truck size and weight
restrictions on U.S. highways. There is relatively less demand for imports of 20’ containers in the
interior of the U.S. compared to 40’ containers. Containers may be loaded on a truck scale to meet
weight distribution limits for over the road movement, and to comply with ISO standards for containers
for cargo carriage. Blocking and bracing is required to protect whoever opens the container door from
product cascading over workers. As ocean carriers have largely ceased to provide wheeled chassis for
U.S. moves, truckers, transloaders and draymen are investing in the more robust apparatus for legal
permitted movement.
6) Timing issues regarding rail cut-offs to the West Coast put a premium on the ability to share
information electronically on the location and status of equipment. Agricultural shipments tend to
move in very large quantities requiring 50-80 containers for a single load, with attendant storage costs
and limitations of trying to manage the inventory (Clott, 2014).
5. Directional flows
Constraints on long haul trucking due to a driver shortage and rising fuel costs have created new market
opportunities for the major U.S. rail carriers. They have invested heavily in developing intermodal
terminals where there is space for containers to be mounted or unloaded from rail cars, and where
there are available chassis to move product for short hauls. An industry transition in the United States
from ocean carrier owned and managed pools to a new business model in which pool operators,
trucking and leasing companies supply wheeled chassis is changing the business and responsibility for
equipment management.
Market demand creates “headhauls” from original import to consumer, and equipment moves with the
load. “Backhauls” are needed to help reload containers and relocate them to an import market.
Headhauls often pay a premium for transportation, with a nominal repositioning fee included in the
overall rate. Backhauls are needed to get equipment back in circulation. The oversupply of ocean
capacity in recent years has led carriers to avoid empty repositioning costs. Many ocean carriers reduced
the number of inland points they support and simplified inland networks. If a lane was not balanced,
carriers might discontinue service. For example, Canadian Pacific Railroad recently closed the
Milwaukee Intermodal Terminal and now Wisconsin exporters must truck containers to intermodal load

9
centers in Illinois (Ogard, 2012). Supply chain integration, driven by improved inventory management by
retailers, is reducing transportation costs for shippers (Lam and Van de Voorde, 2012). Transloading and
cross dock consolidation have lowered cycle times for transportation equipment. Shippers who can
reload equipment quickly for preferred markets in Asia can enjoy beneficial export rates (Ogard, 2013).
The key to this integration is the information on where ocean containers are. The United States
Department of Agriculture launched the Ocean Shipping Container Availability Report (OSCAR). It tracks
various container sizes and provides a forward looking estimate of capacity. Weekly updates are
provided by ocean carriers of the Westbound Transpacific Stabilization Agreement. Private firms such as
Loadmatch.com in the Chicago area provide lists of drayage companies and terminals for the intermodal
industry. The Drayage Dictionary website also links drayage providers with product shippers (Ogard,
2013). But there can still be a delay before a container gets returned.
Governance issues are also a factor for agricultural products. Many states, since the 1930’s, have
imposed regulatory separation between farmers and elevators, to assure farmers get paid for their
crops. Larger farmers may invest in on-site storage so they can hedge sales each month in order to take
advantage of fluctuating demand; most small farmers sell to local elevators because they lack it.
Farmers must sell to merchandisers or local elevators, unless they are federal export certified to sell
directly to international buyers. Few choose certification because of the reporting and documentation
required; but many Asian buyers want to buy soybeans directly from the farmer. Recently, transloading
firms have located at Midwest intermodal locations. They fill ocean containers within intermodal
complexes with private roads, so that overweight containers can move without permits. Transloaders
also locate near barge sites for container on barge (COB) moves through the inland waterway via
container (Clarkson, 2013). Currently there may be an oversupply of transloaders (Ogard, 2013).
The advantages of putting soybeans in containers for export are many, but clearly there are operational
and governance challenges if this export supply chain is to increase to almost double the number of
containers that flow today. As an example, we look in more detail at the effects of barge link delays on
the matching of containers with product.
6. Modeling effect of delay cost on soybean chain
Coping with delays in this regional soybean export supply chain is an important managerial issue. Delays
en route to the port, particularly on a barge link, not only raise the total shipment cost, but could
substantially alter supply paths and flows, making planning for capacity and deploying empty containers
difficult. From a policy standpoint, cost increases affect the competitive position of US farmers relative
to Brazil, the major competitor, for export markets; unreliable and untraceable delivery patterns also
discourage foreign purchasers. Operationally, the increased variability is hard to manage; the peak
season of October through February stresses capacity, making delays more costly. Such factors could
prevent increasing container exports of soybeans from the region. Management and policy efforts might
be needed to reduce these delays.
To estimate the possible size of the effect, a multiple objective container matching model was
constructed. Such flow models have been used for related problems. Kuroda, et. al (2005) model ocean
carrier service link scheduling and shipper route selection networks in Japan, constrained by supply of

10
slots equaling shipper demand, and link prices set via perfect competition, fixed by cost per demand
unit. Iannone (2012) models port hinterland distribution in Campania, Italy for containers by rail or
truck modes, emphasizing social and environmental cost and transport cost, using a Nash equilibrium
constraint. In our model the supply chain, led by customer demand, optimizes flow costs from a
selection of source nodes to its destinations, considering the cost of obtaining boxes in the right place
from a box source node, and the use of different modes of transport.
Figure 3 is a typical product network. Farms or local elevators (F) are product supply nodes. Distribution
(D) nodes receive product from F sites via FD links, and move it onward, transloading from bulk to
container. The chosen FD link depends on proximity, cost, and capability. For instance, some D nodes
might provide drying or packaging services, whereas some farmers have those capabilities at the farm or
local elevator. Port (P) nodes provide containerized export service by ocean; they can export anywhere,
but some routes would be cost prohibitive, or there might be uneconomical multiple hop service. They
could also transload on premises, receiving bulk beans, though not in our example. Some D nodes link
directly to ports via a DP link, or to other distribution nodes via a DD link. Customer (C) nodes have
demands for product, and are reached by PC links from P nodes.
There is an overlapping network of box nodes (B), sources of containers suitable for the crop. They
might be existing nodes, such as P and D nodes, or might be other sources of boxes (O nodes), such as
nearby intermodal facilities or retailers. B nodes have a supply of containers, and connect via BF or BD
links to each node that loads beans for export.
Figure 3 Example soybean export supply chain. Source: Author drawing.
Each F node has a supply measured in container loads. A FEU for export holds about 23.6 MT (metric
tonnes) (866bu) and a TEU about 17.24MT (633bu), the production of about 18 or 13.1ac on an Illinois
farm, based on current truck weight limits in Illinois (ILSOY, 2012; STC, 2009). Direct rail loading of
containers or use of overweight permitting would allow loading up to about 56000 lbs. or 25.40 MT in

11
an FEU. An earlier study (PLC, 2006) indicated only 733 bushels per container on average. Material price
at the F node for the product is separate from the transport cost, and depends on quality and
processing. C nodes have demands similarly measured. Each product link has a capacity and a cost; box
links have only a cost of deployment of the box, which assumes carriage can be found for deployment
trips. Separate links are identified for modes truck, rail, barge, and ship. In the example, links PC are
only ship; links FD are only truck. Because of the particular geography modeled, DD links are only truck;
but DP links may be truck, rail, or barge.
Optimization of the two interlocking networks, for product flow and box provisioning, first minimizes
cost of product transport by selecting paths for product, and then box movement cost, linked by
requiring product demand be satisfied by movement of box supply. In an agricultural environment,
when product is ready it must move; the model covers a short time frame, with static assumptions
about costs and contracting.
A small example emulates a freight forwarder securing the lowest cost for two customers. It uses a few
regional F locations, certain barge and rail D nodes, one O node, and a small set of possible export ports,
with two C nodes, Busan, Korea and Tin Can Island, Nigeria (4th largest importer of US soybeans)
ordering in the same time frame. Link costs were estimated using available data (USDA/AMS 2014a;
Steenhoek, 2013; Ogard, 2012), and some field research with carriers.
Link delay can occur through port congestion, handling and loading; rail and barge availability issues;
waiting for equipment; yard congestion; contention for delivery slots; or waits for a run, and applies to
PC links and to modal DP links. Box delays apply to B nodes; these could be locating a container to use,
finding drayage, and delays on the move itself. Delay produces an increase in cost (Kuroda et al, 2005),
using an increasing exponential function of a ratio U of usage to capacity; d = U. Linear delay cost
functions have been used in the literature also and =1 captures these; here delay cost escalates with
the congestion or time, and >1 is appropriate (Mallinckrodt, 2010).
Table 2 Model variables, parameters, and calculated quantities
Variable Description Relevant Links/nodes Use Xij, Xijm No of containers of beans moved on link ij (by
mode m) FD, DD, DP, PC Choice, integer
Yij No of empty boxes moved on link from i to j BF, BD Choice, integer Cij, Cijm Cost of moving one loaded container on link ij
(using mode m) FD, DD, DP, PC Parameter
Bij, Bijm Backhaul cost of deploying empty container vial link ij (using mode m)
BF, BD Parameter
Fsupplyi Supply of beans at node i (containers) F (nodes) Parameter Demandj Demand of beans at node j C (nodes) Parameter Bsupplyb Supply of Boxes at node B B (nodes) Parameter dij, dijm Delay or congestion cost added to link ij (by
mode m) as percentage of link cost DP, PC Calculated
di Delay or congestion cost added at node i for provision of empties
B (nodes) Calculated
Reqb Net requirement for boxes at node b B (nodes) Calculated Outb Net boxes sent out at node b B (nodes) Calculated TC Transport cost Network Objective

12
BC Backhaul cost Network Objective
Table 2 specifies the variables and parameters for the model. Table 3 gives the formulation. Objectives
1-2 are minimized in order, assuming backhauls will be found because timely bean shipment is of first
priority. Constraints 3-6 express the material balance in beans; all demand is met, all supply shipped if
feasible, and intermediate nodes do not store. Constraints 7-9 express a similar balance for boxes;
supply is not exceeded and all shipments get a box. Constraints 10-11 assure that box supplies at B
nodes are not exceeded. Auxiliary constraint 12 calculates the box output at a B node, and 13-14
calculate net box requirements at nodes which have flows in and out. Table 3 Model equations and constraints
Description Objectives ID Minimize TC = ij FD CijXij + ijm DD CijmXijm + ijm DP CijmXijm(1+dijm) + ij PC CijXij(1+dij) 1 Minimize BC = ij BF BijYij(1+di) + ij BD BijYij(1+di) 2
Bean Balance constraints
Balance (f F) fj FD Xfj ≤ Fsupplyf 3
Balance (d D) id FD Xid + idm DD Xidm = djm DD Xijm + djm DP Xdjm 4
Balance (p P) ipm DP Xipm = pj PC Xpj 5
Balance (c C) ic PC Xic ≥ Demandc 6
Box Balance constraints
Balance (b B) bj BF Ybj ≤ Bsupplyb + Reqb 7
Balance (f F) if BF,i≠f Yif = Reqf 8
Balance (d D) id BD Yid = Reqd 9
Box Capacity constraints
Capacity (b O,P) Bsupplyb ≥ bj BF Ybj + bj BD Ybj 10
Capacity (b D) Bsupplyb + ib BF,I F Yib + ib BD,i O Yib + ib BD,i P Yib ≥ bj BD,j D Ybj + bj BF,j F Ybj
11
Calculated variables
Outb (b B) bj BD,BF Ybj = Outb 12
Reqb (b F,B) Reqb = Fsupplyb - Bsupplyb 13
Reqb (b D,B) Reqb = Outb - Bsupplyb 14
We used AMPL modeling language (Fourer et al, 2003), NEOS (Dolan, 2001) server, with MINLP (Leyffer,
2014) optimizer. Runs were made with business as usual (BAU) and increased delay (Delay) penalty on
the barge link, such as would occur if a lock was disabled for maintenance with reduced traffic capacity.
BAU results were shipping cost of $344549 for 200 containers; with Delay, shipping costs rose to
$358986, from decreased use of the cheap barge link, a difference of $72.19 per container or about
$3.06 per MT. These are similar to Kruse (2011), who independently estimates a $2.45 per MT decrease
in price from the closure for 2 weeks of La Grange Lock on the Mississippi River, serving this region. This
10% of the swing between Brazil and the US in Table 1 would disadvantage US soybean exports, and
make increasing exports by intermodal means harder. A concurrent rail intermodal price increase would
be even worse (Meyer, 2007).
Table 4 shows movements on links under BAU and Delay conditions. Empty container deployment did
not change, as expected. Routings by barge from Quincy to New Orleans went from 88 to 49, a 44%
reduction. Changes in source occurred as well, with three F nodes switching D location, one by 83%. F

13
node changes affect specific farmers; changes at D or P nodes affect volumes at those inland ports, and
would significantly impact port and distributor planning and profitability. This variability is of significant
terminal management concern, especially at the inland D ports, and governance and operational
measures to eliminate potential barge delays might be called for. Pricing will not be effective in
resolving the problem; cost of fixing the delay is exogenous to the shipping market.
Price differences at farms (due to quality or handling) also could motivate buying from specific farms
and leaving others out; these would affect transport costs through selection of F nodes, and would also
affect choice of supply routes; but in our model all beans were shipped and the farm price paid.
Table 4 Supply link container volumes, business as usual (BAU) and Delay, with changes.
Farm to Distribution BAU Delay Change (% of total shipped from)
From / To 7 Quincy 8 Decatur 7 Quincy 8 Decatur 7 Quincy 8 Decatur
1 B61368 25 5 0 30 -83% +83%
2 K60560 25 40 25 40 - -
3 S51053 18 22 14 40 -10% +10%
4 S61774 0 10 0 10 - -
5 TISK5 0 35 0 35 - -
6 W61473 20 0 14 6 -30% +30%
Total 88 112 49 151 -19.5% +19.5%
Distribution to Port BAU Delay Change (absolute quantity)
From / To 10 New
Orleans
11
Norfolk
12 Los
Angeles
10 New
Orleans
11
Norfolk
12 Los
Angeles
10 New
Orleans
11
Norfolk
12 Los
Angeles
7 QUINCY 98 0 0 39 0 0 -59 - -
8 DECATUR 5 43 54 24 67 70 +19 +24 +16
Total 103 43 54 63 67 70 -40 +24 +16
Port to Consumer BAU Delay Change (absolute quantity)
From / To 13 Busan 14 TincanIs 13 Busan 14 TincanIs 13 Busan 14 TincanIs
10 NORLEANS 79 24 41 22 -38 -2
11 NORFOLK 18 25 40 27 +22 +2
12 LOSANGELES 53 1 69 1 +16 -
Total 150 50 150 50 - -
Box to Farm, Distribution
BAU = Delay (Box deliveries same for either scenario since barge is not used for box relocation.)
**relocated BD then used on farm
From / To 1 B61368 2 K60560 3 S51053 4 S61774 5 TISK5 6 W61473 7 QUINCY 8 DECATUR
7 QUINCY 10 20 8 DECATUR 20
9 JOLIET 10 65 20 10
NORLEANS 40 35
Total 30 65 40 10 35 20 20**
7. Discussion and Conclusion
Summary
Containerized soybean delivery chains for export are of growing interest in the US and elsewhere due to
a convergence of supply chain interests. Export customers want traceable product while merchandisers
want to preserve quality. Ocean carriers want to reduce empty repositioning costs while railroads
would like to make more money on full loads vs. empty repositioning rates. Overall, export operations

14
desire the means to adjust to volatility in the many system factors. Illinois, a chief soybean producing
area, is located where import containers are available for backhaul, offering maximum potential to
increase this trade. Several factors which enhance and impede it are highlighted by this study.
1. Preserving low transportation cost and reliability on inexpensive barge links is important in
maintaining the competitiveness of U.S. sources. Significant challenges to the global position of the US
in agricultural exports could arise from catastrophic lock failure or unscheduled closure (Kruse, 2011).
These not only impact cost, but force supply chain alterations and increased volatility due to reliability
issues and equipment pricing and availability. Limiting delay and keeping infrastructure in operating
order requires infrastructure investment to repair key locks and dams along the inland waterways. The
United States Water Resources & Reform Development Act signed into law in June, 2014 will provide
some badly needed federal funding to begin infrastructure repairs. The majority of soy and agricultural
products from the US Midwest, containerized or bulk, will still need to move to overseas markets from
inland points via barge. Investment in more containerization will not increase substantially without
effective container barge movements.
2. An adequate supply of empty containers of the right kind is crucial because of the limited opportunity
to move product. Locations within competitive trucking distance to the Chicago metropolitan region,
for example, can benefit from the existing imbalance of imports over exports, but the supply chain
manager must be able to match available containers to product loads. While Illinois has an advantage
over neighboring states in access to transportation and speed to market, these can be replicated
elsewhere in slightly different configurations. In the US, Kansas City and Memphis are major points for
potential consolidation of agricultural product in ocean containers. With increased information about
availability and routing status, major Asia-to-Europe transit points could determine the volume of
product that might be nearby and available to be loaded in a cost effective manner. Freight
intermediaries are the best informed stakeholder group with the most up to date information on where
the equipment shortages and surpluses are, what carriers’ requirements are, and what regulatory issues
might be changing. Visibility of loads and containers is therefore the key to making the process work.
State and local agricultural agencies such as the Illinois Soybean Association work in collaboration with
farmers and intermediaries to share information on transport and determine what types of beans are
needed for unique markets. Cooperative information exchange is often viewed as risky by competing
supply chain participants; government initiatives like the OSCAR report can help make the participants
more competitive globally. As with container drayage in general, matching truckers with loads one by
one has proved effective in improving turnaround, and 3PLs can also facilitate it if they and their clients
benefit rate-wise.
3. Rail to the West Coast is the next most competitive option to barge, and players on these links have
both incentive and resources to apply to the problem. Any faltering in the barge arena will allow the
long distance rail links to benefit. Rail lines profit more from bulk cargo transport in shuttle trains which
move hopper cars than from container moves of low value product. The interest of ocean carriers as
container owners is to negotiate rail rates from particular inland markets on market volumes, balance
and density. Hence rail operators’ desire to invest is conditioned by the current low volume of
containers relative to bulk traffic. However, when bulk rail loading is constrained by lack of cars, and

15
prices rise, shippers may be able to moderate rates by using containers, which may be mixed with other
containerized product on unit trains. Containerizing also increases flexibility of routes, a help in
congested periods.
4. Network models inform supply chain design by customers in this market and also allow investigating
sensitivity of route choice to important factors: supply, demand, empty container positioning, on farm
product cost, and costs of transit, delay and congestion. Delays cause substantial realignment of supply
networks, even when demands are met. With complex multi-player supply chains, instability will tend
to reduce cooperative partnerships. Producers, processors, and soybean elevator operators (storage),
as well as governance, using modeling, can be informed about effects of changes.
5. Variability in agricultural movements is a problem, unlike some other cargo. Planning begins for
farmers many months before the crop is planted; the seed selected and the land used depends on the
market the product is destined for. Producers investing in on-farm storage are better able to utilize the
container option and hold their product until market prices meet objectives. Modeling inventory
position, effects of futures vs. spot pricing, container placement options, and supply of empties would
be valuable extensions.
Contribution to Scholarly Knowledge
Transport of food related commodities by container in specialized supply chains such as soybeans has
not often been addressed in the academic literature to date. Containers will play an increased role in
agricultural exports, and other agricultural export chains could face similar governance and operational
issues. This research on policies or practice that enhance private sector equipment flows could benefit
other commodities such as scrap, food and raw materials. With increasing standards of living of
countries in Asia and elsewhere, innovative ideas to address the empty container problem should
include more sophisticated modeling of port choice (Monios and Wang, 2014). The soybean export
chain in Illinois provides a look into the future of this trade, identifies factors necessary for success, and
governance and operational issues impeding it.
Implications for Managerial Practice and Policy
Analysis of the UK port system by Wilmsmeier and Monios (2013) suggested that container imbalances
will hurt dryports in peripheral regions with fewer direct links to the volume of transportation options at
larger regional ports. This is occurring for soybean producers in the neighboring state of Iowa that are
hard pressed to find adequate equipment to ship their product. We suggest that overall transportation
costs should be part of larger issues of state and regional infrastructure development. Small steps are
happening now, but the US has to date not done the type of overall transportation planning commonly
done elsewhere. This case shows that attention to supply chain details is an operational necessity, and
affects longer term planning and regional policy initiatives governing trade.
The total landed cost of commodities has a direct impact upon their competiveness in the marketplace.
The soybean container case shows that policy makers must understand the variables and timing that
make up transportation costs. Local, state and federal levels must harmonize to achieve overall

16
transportation objectives. The Illinois State Freight Advisory Committee has strongly urged statewide
and regional partners from the public and private sectors to build an economic development freight
coalition creating a state freight plan and supportive public activities (ISFAC, 2014).
Conclusion
The critical nature of key export products such as soybeans demands coordination of information,
supply chain visibility and collaboration to improve competitiveness and increase reliability while
limiting costs. Partnerships between neighboring states and regions can be problematic due to the
political process; however solutions that benefit all participants are particularly important, due to
factors exogenous to the markets. Addressing key regulatory barriers such as weight limits demand
joint solutions to succeed.
Further research in agricultural product containerization could include regional characteristics
differentiating dryports by shipper and carrier needs. More study is needed on visible, flexible supply
chains that can allow producers and consumers to adjust readily to risk. Better governance and
operational practice in agricultural exporting and container repositioning should accompany increased
collaboration and information sharing.
References
AMERICAN ASSOCIATION OF RAILROADS (AAR). (2013) Press Release, February 6, 2013. URL:
https://www.aar.org/newsandevents/Press-Releases/Pages/Freight-Railroads-Plan-to-Invest-24-Billion-
in-Private-Dollars-in-2013-On-Americas-Rail-Network-So-Taxpayers-Dont-Have-To.aspx#.VCwcExZ8F8E
Retrieved September 10, 2014.
BELZ, A. (2013) Cargill: Mississippi River locks and dams need maintenance badly. Minneapolis Star
Tribune, February 26, 2013. http://www.startribune.com/business/193446011.html
BICHOU, K. and GRAY, R. (2005) A critical review of conventional terminology for classifying seaports.
Transportation Research Part A: Policy and Practice vol. 39, no. 1, pp.75-92.
BILAL, M., IRFAN, M., AHMED, A., LABI, S. AND SINHA, K. (2010) A Synthesis of Overweight Truck
Permitting. Publication FHWA/IN/JTRP-2010/12. Joint Transportation Research Program, Indiana
Department of Transportation and Purdue University, West Lafayette, Indiana, 2010. doi:
10.5703/1288284314260.
CLARKSON, L. (2013) Delivering Higher Ag Value thru Supply Chain Infrastructure. Presentation, Illinois
Soybean Association 2013 Transportation Summit, University of St. Francis, Joliet, IL.
http://www.summit.ilsoy.org/isa/soy-news/events-education/2013-transportation-
summit/presentations/
CLOTT, C. (2014) Private communication with MOL-America executive. Chicago, IL, January 5, 2014.

17
DILLERUD, C. (2013) The Challenges, Realities and Opportunities for Container-on-Barge (COB) Shipping.
Presentation, Illinois Soybean Association 2013 Transportation Summit, University of St. Francis, Joliet,
IL. http://www.summit.ilsoy.org/isa/soy-news/events-education/2013-transportation-
summit/presentations/
DOERING, C. (2014) Farmers, ag businesses brace for rail delays. Des Moines Register, September 13,
2014. URL: http://www.desmoinesregister.com/story/money/agriculture/2014/09/13/agriculture-rail-
delays-concern-farmers-businesses-brace/15568431/, Retrieved September 20, 2014.
DOLAN, E. (2001) NEOS Server 4.0 Administrative Guide, Technical Memorandum ANL/MCS-TM-250,
Mathematics and Computer Science Division, Argonne National Laboratory, May 2001.
ERICKSEN, K. (2013) Condition of Illinois Infrastructure for Commodities. Presentation, Illinois Soybean
Association 2013 Transportation Summit, University of St. Francis, Joliet, IL, USA, June 13, 2013.
http://www.summit.ilsoy.org/isa/soy-news/events-education/2013-transportation-
summit/presentations/.
FORD, G. (2013) Funding shortfall leaves aging Mississippi locks and dams vulnerable. The Gazette,
Cedar Rapids, Iowa, 9 June 2013. http://thegazette.com/2013/06/09/funding-shortfall-leaves-aging-
mississippi-locks-and-dams-vulnerable/
FOURER, R., GAY, D. AND KERNIGHAN, B. (2002) AMPL: A Modeling Language for Mathematical
Programming. Duxbury Press. GREULING, J. (2013) Private conversation with the authors, August, 2013.
HARTMAN, B. and CLOTT, C. (2014) Intermodal chassis supply in the US –a Bayesian game model. Paper
delivered at IAME 2014 conference, Norfolk VA, USA.
IANNONE, F. (2012) The private and social cost efficiency of port hinterland container distribution
through a logistical system. Transportation Research Part A (46) 1424-1448.
ILLINOIS SOYBEAN ASSOCIATION (ILSOY). (2013) Facts & Statistics for the Illinois Soybean Industry.
http://www.ilsoy.org/_data/mediaCenter/files/1580.pdf, Retrieved December 15, 2013.
ILLINOIS SOYBEAN ASSOCIATION (ILSOY). (2012) Impacts of higher road weights on Illinois soybean
value chain. Prepared by Informa Associates, August 2012. URL:
http://www.ilsoy.org/_data/mediacenter/files/1799.pdf. Retrieved January 15, 2014.
ILLINOIS STATE FREIGHT ADVISORY COUNCIL REGIONAL FREIGHT PLANNING & DEVELOPMENT
SUBCOMMITTEE (ISFAC). (2014) Recommendations to the Illinois Department of Transportation.
August, 2014.
KEITH, K. (2013) Maintaining a Track Record of Success: Expanding Rail Infrastructure to accommodate
growth in agriculture and other sectors. Prepared for United Soybean Board by TRC Consulting. URL:
http://unitedsoybean.org/wp-content/uploads/2013/07/Rail-Study-Maintaining-a-Track-Record-of-
Success-January-20131.pdf, Retrieved April 10, 2014

18
KOSIOR, J., PRENTICE, B AND VIDO, E. (2002) A Mixed Logistics Strategy for Grain: The Competitiveness
of Containers versus Bulk. Winnipeg, MB: Report Prepared for PFRA, Agriculture and Agri-Food Canada,
October 2002. URL: http://ww.umanitoba.ca/transport_institute/publications
KRUSE, J., PROTOPAPAS, A., AHMEDOV, Z., MCCARL, B., WU, X. and MJELDE, J. (2011) America’s locks & dams: a ticking time bomb for agriculture? Prepared by Texas Transportation Institute for United Soybean Board, December 2011. URL: http://d2dtl5nnlpfr0r.cloudfront.net/tti.tamu.edu/documents/TTI-2011-9.pdf. Retrieved: September 10, 2014. KULISCH, E. (2013) Reverse transloads. American Shipper, March, 2013. URL: http://digital.americanshipper.com/i/111901/10 Retrieved September 10, 2014.
KURODA, K., TAKAEBAYASHI, M. AND TSUJI, T. (2005) International Container Transportation Network
Analysis Considering Post-Panamax Class Container Ships. Research in Transportation Economics 2005
(13) 369-391. doi:10.1016/S0739-8859(05)13016-9
LAM J., and VAN DE VOORDE, E. (2011) Scenario analysis for supply chain integration in container
shipping. Maritime Policy and Management, 38(7): 705-725.
LEACH, P. AND MONGELLUZZO, B. (2013) US Agricultural Exports: Opportunities and Challenges for
Containerized Shippers. Whitepaper, PIERS, Journal of Commerce, November 2013.
LEYFFER, S. (2014) Dundee Solvers for Mixed Integer Nonlinear Programming. Argonne National
Laboratory. URL: http://wiki.mcs.anl.gov/leyffer/index.php/Sven_Leyffer%27s_Software, Retrieved
January 15, 2014.
MALLINCKRODT, J. (2010) VCI, a Regional Volume/Capacity Index Model of Urban Congestion. Journal
of Transportation Engineering. 136(2), February 1, 2010. DOI: 10.1061/_ASCE_TE.1943-5436.0000080
MERK, O. AND DENG, T. (2012) Efficiency of world ports in container and bulk cargo (oil, coal, ores and
grain). OECD Regional Development Working Papers, 2012/09, OECD Publishing. DOI:
10.1787/5k92vgw39zs2-en
MEYER, S., FELLIN, L. and STONE, P. (2007) Impact of a Lock Failure on Commodity Transportation on
the Mississippi or Illinois Waterway. Food and Agricultural Policy Research Institute, University of
Missouri (FAPRI). FAPRI-MU Report #30-07. URL: http://www.fapri.missouri.edu. Retrieved September
18, 2014.
MONIOS, J and WANG, Y. (2014) Regional stakeholder solutions to empty container repositioning costs
in peripheral regions. Paper delivered at IAME 2014 conference, Norfolk VA, USA.
MONIOS, J. and WILMSMEIER, G. (2012) Giving a direction to port regionalisation. Transportation
Research Part A: Policy & Practice. 46 (10): 1551-1561.

19
NOTTEBOOM, T. AND RODRIGUE, J.-P. (2005) Port regionalization: towards a new phase in port development. Maritime Policy and Management, 32(3):297-313. OGARD, E. (2012) Headhaul-Backhaul for Illinois Containers. Prepared for Illinois Soybean Association,
December 25, 1012, by Prime Focus LLC, Illinois Soybean Association, and Beckett Group.
OGARD, E. (2013) Enhancing and Expanding Containerized Commodity Movements. Presentation,
Illinois Soybean Association 2013 Transportation Summit, University of St. Francis, Joliet, IL USA, June
2013. URL: http://www.summit.ilsoy.org/isa/soy-news/events-education/2013-transportation-
summit/presentations/
POLLOCK LOGISTICS CONSULTING (PLC). (2006) The Network For Containerized Soybean Exports.
Project 6057, US Soybean Export Council. August 1, 2006. URL:
http://www.ilsoy.org/sites/default/files/documents/1031.pdf. Retrieved April 15, 2014
PRENTICE, B. (2003) Importance of Intermodal Connectivity and Bottleneck Elimination. Technical
Report CTRF03, Center for Transportation Research, University of Manitoba, Canada.
Prentice, B. (2012) European opportunities for containerized exports and lessons from Canada.
Presentation made at the Illinois Soy Summit, February 11, 12, 2012. Governors State University,
University Park, IL. USA.
REESE, M. (2010) New weight limit for trucking containers levels the playing field for Ohio ag. Ohio
Country Journal, November 9, 2010. URL: http://ocj.com/2010/11/new-weight-limit-for-trucking-
containers-levels-the-playing-field-for-ohio-ag/, Retrieved January 5, 2014.
RODRIGUE, J.-P. (2013) The Repositioning of Empty Containers, in The Geography of Transport Systems,
Chapter 5, New York, Routledge, 2013.
RODRIGUE, J-P., DEBRIE, J., FREMONT, A. and GOUVERNAL, E., (2010) Functions and actors of inland
ports: European and North American dynamics. Journal of Transport Geography. 18 (4): 519-529.
RODRIGUE, J-P., and NOTTEBOOM, T. (2012) Dry ports in European and North American intermodal rail
systems: two of a kind? Research in Transportation Business and Management 5 (December); 4-15.
ROSO, V. and LUMSDEN, K. (2010) A review of dry ports. Maritime Economics and Logistics. 12 (2): 196-
213. doi:10.1057/mel.2010.5
SCHERR, B. (2013) Agricultural Markets Outlook and Longer Term Drivers. Informa Economics,
Presentation, Illinois Soybean Association 2013 Transportation Summit, University of St. Francis, Joliet, IL
USA, June 2013. URL: http://www.summit.ilsoy.org/isa/soy-news/events-education/2013-
transportation-summit/presentations/, Retrieved September 10, 2014.
SALIN, D. 2014. Soybean Transportation Guide: Brazil. June 2014. U.S. Dept. of Agriculture, Agricultural
Marketing Service (USDA/AMS). DOI: 10.9752/TS048.06-2014

20
SOY TRANSPORTATION COALITION (STC). (2009) Analysis Summary: Heavier Semis: A good idea? July,
2009. URL: http://www.soytransportation.org/newsroom/SemiWeightLimitAnalysisSummary.pdf,
Retrieved August 18, 2014
SOY TRANSPORTATION COALITION (STC). (2014) Why should farmers care about transportation? URL
http://www.soytransportation.org/_img/chartLG.jpg. Retrieved April 18, 2014.
STEENHOEK, M. (2013) Why Should Farmers Care About Transportation? Presentation, Illinois Soybean
Association 2013 Transportation Summit, University of St. Francis, Joliet, IL USA, June 2013. URL:
http://www.summit.ilsoy.org/isa/soy-news/events-education/2013-transportation-
summit/presentations/.
STEIN, A. AND RODRIGUEZ-CEREZO, E. (2010) Low-Level Presence of New GM Crops: an Issue on the
Rise for Countries Where they Lack Approval. AgBioForum, 13 (2) 173-182.
US DEPARTMENT OF AGRICULTURE AGRICULTURAL MARKETING SERVICE (USDA/AMS). (2014a) Tariff
Rail Rates, and Spot Barge Rates. Agricultural Transportation Data. URL: http://www.ams.usda.gov/,
Retrieved January 1, 2014.
US DEPARTMENT OF AGRICULTURE AGRICULTURAL MARKETING SERVICE (USDA/AMS). (2014b) Grain
Transportation Report (GTR). Agricultural Transportation Data, URL:
http://www.ams.usda.gov/AMSv1.0/getfile?dDocName=STELPRDC5083593, Retrieved January 15, 2014.
US DEPARTMENT OF AGRICULTURE, ECONOMIC RESEARCH SERVICE (USDA/ERS). (2013) Outlook for U.S.
Agricultural Trade. Report AES-79, August 29, 2013.
US DEPARTMENT OF AGRICULTURE, NATIONAL AGRICULTURE STATISTICS SERVICE (USDA/NASS). (2014)
Crop Production 2013 Summary. January, 2014. URL:
http://usda01.library.cornell.edu/usda/current/CropProdSu/CropProdSu-01-10-2014.pdf, Retrieved
April 26, 2014.
US DEPARTMENT OF AGRICULTURE (USDA/WASDE). (2014) World Agricultural Supply and Demand
Estimates Report (WASDE), WASDE – 528, April 9, 2014.
US DEPARTMENT OF TRANSPORTATION Federal Highway Administration (USDA/FHWA). (2014) Tonnage
of Trailer-on-Flatcar and Container-on-Flatcar Rail Intermodal Moves: 2011 Map. From USDOT, Federal
Railway Administration, 2013. URL:
http://www.ops.fhwa.dot.gov/Freight/freight_analysis/nat_freight_stats/intermodalrail2011.htm.
Retrieved September 10, 2014.
VAN KLINK, H. (1998) The port network as a new stage in port development: the case of Rotterdam.
Environment and Planning A. 30 (1): 143-160.
21
WILMSMEIER, G., MONIOS, J., and LAMBERT, B., (2011) The directional development of intermodal
freight corridors in relation to inland terminals. Journal of Transport Geography, 19 (6): 1379-1386.
WILMSMEIER, G. and MONIOS, J. (2013) Counterbalancing peripherality and concentration: an analysis
of the UK container port system. Maritime Policy & Management. 40 (2): 116-132.