presco plc - dec 2016 audited · pdf file1985, the bendel state ... presco plc specializes in...
TRANSCRIPT

PRESCO PLC
FINANCIAL STATEMENTS FOR THE YEAR ENDED 31 DECEMBER 2015

PRESCO PLC Financial statements
For the year ended 31 December 2015
Table of Contents
Certification pursuit to section 60(2) of investment and securities act no.29 of 2007............................................. i
Statement of Directors’ responsibilities ................................................................................................................. ii
Report of the Independent Auditor ....................................................................................................................... 1
Statement of profit or loss and other comprehensive income .............................................................................. 2
Statement of financial position ............................................................................................................................. 3
Statement of changes in equity ............................................................................................................................ 4
Statement of cash flows ....................................................................................................................................... 5
Notes to the financial statements ......................................................................................................................... 6
Statement of value added .................................................................................................................................. 43
Five-year financial summary .............................................................................................................................. 44

PRESCO PLC Financial statements
For the year ended 31 December 2015
2
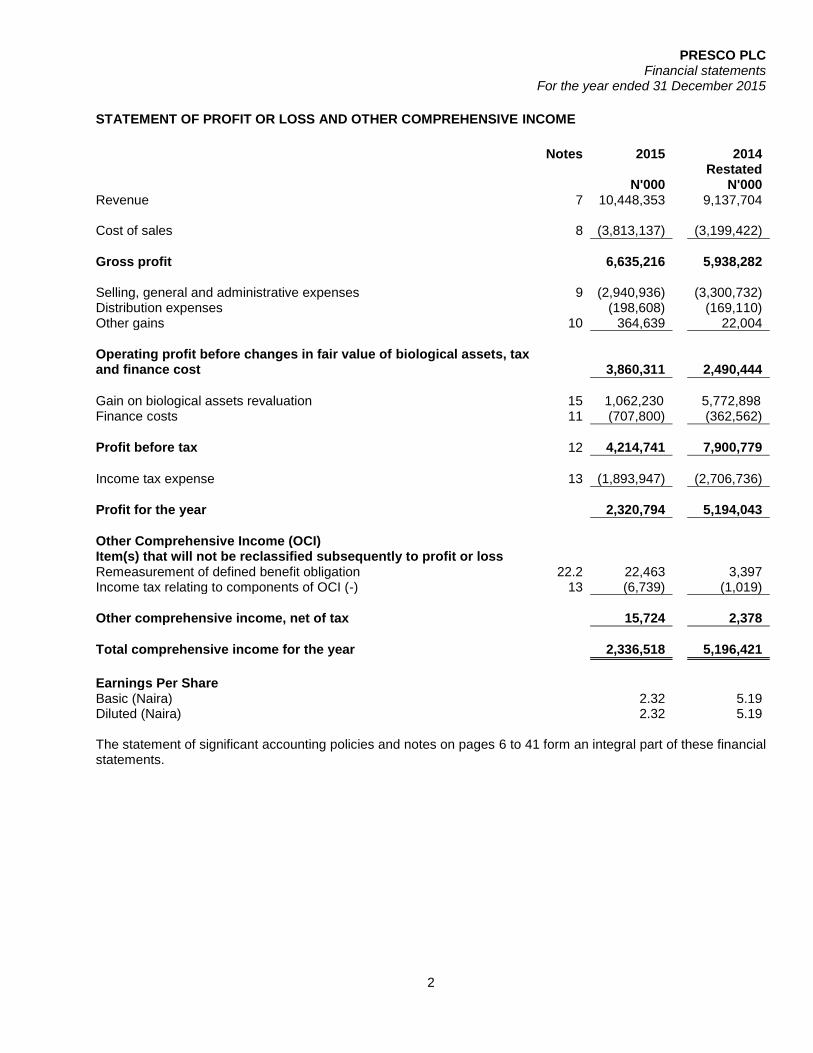
STATEMENT OF PROFIT OR LOSS AND OTHER COMPREHENSIVE INCOME
Notes 2015 2014 Restated N'000 N'000
Revenue 7 10,448,353 9,137,704
Cost of sales 8 (3,813,137) (3,199,422)
Gross profit 6,635,216 5,938,282
Selling, general and administrative expenses 9 (2,940,936) (3,300,732) Distribution expenses (198,608) (169,110) Other gains 10 364,639 22,004
Operating profit before changes in fair value of biological assets, tax and finance cost 3,860,311 2,490,444
Gain on biological assets revaluation 15 1,062,230 5,772,898 Finance costs 11 (707,800) (362,562)
Profit before tax 12 4,214,741 7,900,779
Income tax expense 13 (1,893,947) (2,706,736)
Profit for the year 2,320,794 5,194,043
Other Comprehensive Income (OCI)
Item(s) that will not be reclassified subsequently to profit or loss
Remeasurement of defined benefit obligation 22.2 22,463 3,397 Income tax relating to components of OCI (-) 13 (6,739) (1,019)
Other comprehensive income, net of tax
15,724 2,378
Total comprehensive income for the year 2,336,518 5,196,421
Earnings Per Share
Basic (Naira) 2.32 5.19 Diluted (Naira) 2.32 5.19 The statement of significant accounting policies and notes on pages 6 to 41 form an integral part of these financial statements.


PRESCO PLC Financial statements
For the year ended 31 December 2015
4
STATEMENT OF CHANGES IN EQUITY
Share
Capital Share
Premium Retained Earnings
Other Reserves TOTAL
N’000 N’000 N’000 N’000 N’000
Balance - 1 January 2014 (as restated) 500,000 1,173,528 22,248,384 40,622 23,962,534 Profit for the year - - 5,194,043 - 5,194,043 Actuarial gain on defined benefit plans - - - 2,378 2,378
Total comprehensive income
- 5,194,043 2,378 5,196,421
Dividend paid - - (100,000) - (100,000)
Balance - 31 December 2014 (as restated)
500,000 1,173,528 27,342,427 43,000 29,058,955
Balance - 1 January 2015 500,000 1,173,528 27,342,427 43,000 29,058,955 Profit for the year - - 2,320,794 - 2,320,794 Actuarial gain on defined benefit plans - - - 15,724 15,724
Total comprehensive income 2,286,513 22,463 2,308,976
Dividend paid - - (1,000,000) - (1,000,000)
Balance - 31 December 2015
500,000 1,173,528 28,663,221 58,724 30,395,473
By a written resolution of the Directors of Presco Plc. dated March 31, 2016 it was resolved that a dividend of 100kobo per share amounting to N1 billion (2014: N1billion) be recommended for declaration by the members of the company at the next general meeting of the company.

PRESCO PLC Financial statements
For the year ended 31 December 2015
5
STATEMENT OF CASH FLOWS
2015 2014
Restated N'000 N'000
CASH FLOWS FROM OPERATING ACTIVITIES
Profit for the year 2,336,518 5,196,421
Adjustments for:
Income tax recognized in profit or loss 13 1,900,686 2,707,755 Depreciation and Amortization 16 904,979 1,260,150 Gain/Loss on disposal property plant and equipment -net 757 13,105 Tax paid 27 (387,217) (92,986)
Movements in working capital:
(Increase)/decrease in trade and other receivable 19 (1,216,954) 145,733 (Increase) in biological assets (Non-current) 15 (1,975,068) (7,399,888) (Increase) in biological assets (Current) 15 (68,106) (255,169) Decrease in inventories 18 258,297 763,033 (Increase)/decrease in intangible assets 14 (35,648) 155,363 (Decrease)/increase in trade and other payable 29 (40,315) 5,161 Increase/(decrease) in retirement benefits 22 36,584 (7,428) (Decrease)/increase in finance lease- non-current 26 (428,230) 949,480 Increase in finance lease- current 26 658 26,883 Decrease in provisions - (730) Increase/(decrease) in deferred income- non-current 25 112,404 (65,214) Increase in deferred income -current 25 58,701 5,727
Net cash provided by operating activities
1,458,043 3,407,396
CASH FLOWS FROM INVESTING ACTIVITIES - Capital expenditures (2,983,976) (1,532,971) Proceeds from sale of property, plant and equipment 62,630 -
Net cash (used in) investing activities
(2,921,346) (1,532,971)
CASH FLOWS FROM FINANCING ACTIVITIES
Payments on loan principal (1,921,249) (1,796,353) Dividends paid (1,000,000) (100,000) Additions to current debts 220,295 307,426 Additional long term borrowings 3,608,600 -
Net cash provided by (used in) financing activities 907,646 (1,588,927)
NET INCREASE/DECREASE IN CASH AND CASH EQUIVALENT (555,656) 285,497
CASH AT BEGINNING OF PERIOD (289,633) (575,131)
CASH AND CASH EQUIVALENT AT END OF YEAR 20 (845,289) (289,634)

PRESCO PLC Financial statements
For the year ended 31 December 2015
6
NOTES TO THE FINANCIAL STATEMENTS
1 General Information
Presco Plc was incorporated in Nigeria on 24th September, 1991 as Presco Industries Limited, a private limited liability Company, and became a public limited liability Company in February, 2002. The Company owns oil palm plantations, a palm oil mill and palm kernel crushing plant, vegetable oil refining and fractionation plants and is at present the only fully integrated Company of its kind in Nigeria. The Obaretin Estate was initiated by the then Bendel State Government in the second half of the seventies with financial support from World Bank as part of the State Government oil palm development programme. The implementing agency was the Oil Palm Company Limited (OPCL), a state government concern. In 1985, the Bendel State Government relinquished control of Obaretin Estate to President Industries Nigeria Limited, a textile manufacturing group. Planting activities resumed in 1986 and construction of an integrated processing facility began in 1989.
The President group operated the project, then known as Presco Oil Mill and Plantations, as a division until 1991, when Presco was established as an incorporated Company and all the assets and liabilities of the project were transferred to the new Company.
Societe d’Investissement pour l’Agriculture Tropicale (‘SIAT sa’), a Belgian Company involved in plantation investment and management in West Africa was invited to participate in the Company as Shareholders and Technical Partners in order to effect an intended broadening of the Company’s capital base by bringing in professional managers as shareholders.
President Industries then held 67% of Presco’s paid-up share capital of N50,000,000 comprising 50 million ordinary shares of N1 each. Siat sa of Belgium held the balance of 33%. Following a capitalization exercise in 1995, the Siat group increased its shareholding in Presco to 50%. The Siat Group subsequently became the sole shareholders in December 1997 when the President Group divested its interest in the Company. In 2002, the Company became a public limited liability Company and with a successful Initial Public Offer (IPO) completed in October the same year, Presco shares were admitted to quotation at The Nigerian Stock Exchange. Presco Plc’s shares are now actively traded on The Nigerian Stock Exchange, with the Siat Group holding 60% while the Nigerian Public holds 40%.
On re-registration as Public Company in 2002, the authorized share capital of the Company was increased to N250,000,000 divided into 500,000,000 ordinary shares of 50k each. In 2008, the authorized share capital was increased to N500,000,000 divided into 1,000,000,000 ordinary shares of 50k each, issued and fully paid up. The Company also increased its authorized share capital to N550,000,000 divided into 1,100,000,000 ordinary shares of 50k each with 1,000,000,000 issued and fully paid in 2014. There are currently 9,066 shareholders on the Company’s register of shareholders.
1.1 Principal activities Presco Plc specializes in the cultivation of oil palms and in the extraction, refining and fractioning of crude palm oil into vegetable oil and palm stearin. The Company supplies these specialty fats and oils to the high quality specifications of its customers and assures a reliability of supply of its products all year round, due to the integration of the entire cycle. The Company operates from two States, Obaretin Estate and Ologbo Estate in Edo State and Cowan Estate in Delta State.
PRESCO PLC Financial statements
For the year ended 31 December 2015
7
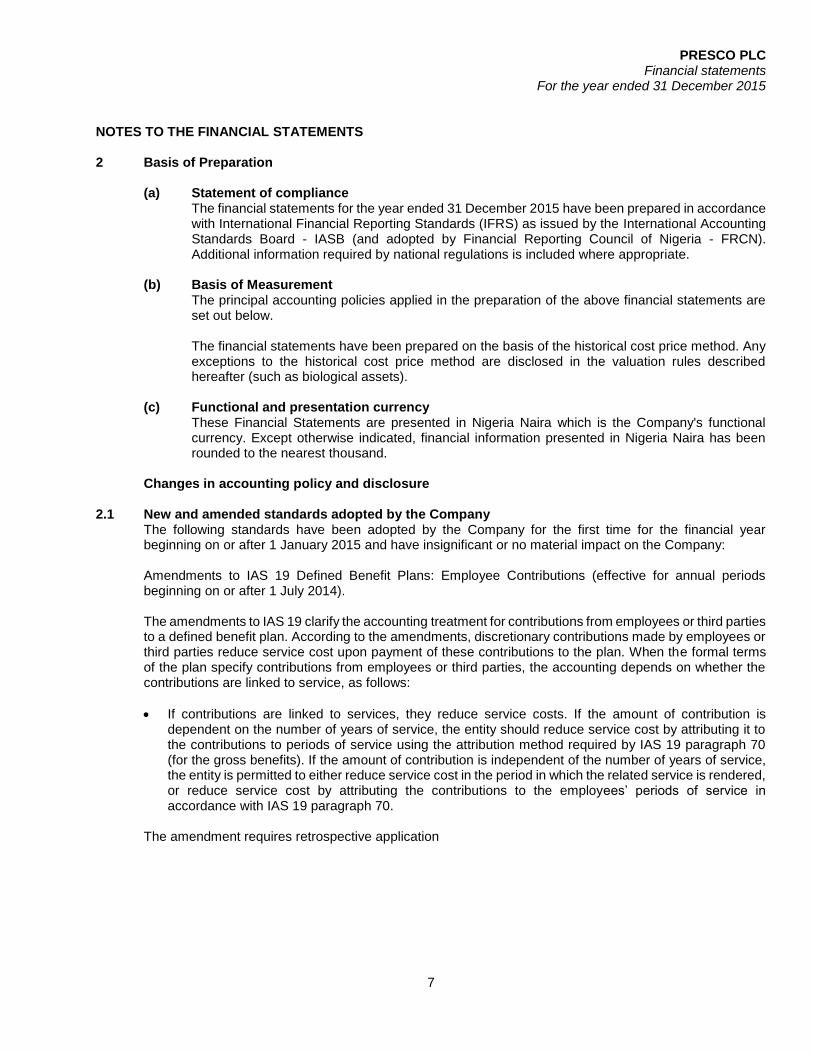
NOTES TO THE FINANCIAL STATEMENTS 2 Basis of Preparation
(a) Statement of compliance The financial statements for the year ended 31 December 2015 have been prepared in accordance with International Financial Reporting Standards (IFRS) as issued by the International Accounting Standards Board - IASB (and adopted by Financial Reporting Council of Nigeria - FRCN). Additional information required by national regulations is included where appropriate.
(b) Basis of Measurement The principal accounting policies applied in the preparation of the above financial statements are set out below.
The financial statements have been prepared on the basis of the historical cost price method. Any exceptions to the historical cost price method are disclosed in the valuation rules described hereafter (such as biological assets).
(c) Functional and presentation currency
These Financial Statements are presented in Nigeria Naira which is the Company's functional currency. Except otherwise indicated, financial information presented in Nigeria Naira has been rounded to the nearest thousand.
Changes in accounting policy and disclosure 2.1 New and amended standards adopted by the Company
The following standards have been adopted by the Company for the first time for the financial year beginning on or after 1 January 2015 and have insignificant or no material impact on the Company: Amendments to IAS 19 Defined Benefit Plans: Employee Contributions (effective for annual periods beginning on or after 1 July 2014).
The amendments to IAS 19 clarify the accounting treatment for contributions from employees or third parties to a defined benefit plan. According to the amendments, discretionary contributions made by employees or third parties reduce service cost upon payment of these contributions to the plan. When the formal terms of the plan specify contributions from employees or third parties, the accounting depends on whether the contributions are linked to service, as follows:
If contributions are linked to services, they reduce service costs. If the amount of contribution is dependent on the number of years of service, the entity should reduce service cost by attributing it to the contributions to periods of service using the attribution method required by IAS 19 paragraph 70 (for the gross benefits). If the amount of contribution is independent of the number of years of service, the entity is permitted to either reduce service cost in the period in which the related service is rendered, or reduce service cost by attributing the contributions to the employees’ periods of service in accordance with IAS 19 paragraph 70.
The amendment requires retrospective application

PRESCO PLC Financial statements
For the year ended 31 December 2015
8
NOTES TO THE FINANCIAL STATEMENTS 2.2 New standards not yet effective IFRS 14, 'Regulatory Deferral Accounts', issued in January 2014 (effective 1 January 2016)
The Standard was issued in January 2014 and is effective from 1 January 2016, with earlier application permitted. Many governments regulate the supply and pricing of particular types of activity by private entities, including utilities such as gas, electricity and water. These regulations are often designed to allow the suppliers to recover specified costs and other amounts through the prices they charge to customers. However, rate regulation is also designed to protect the interests of customers. Consequently, the rate regulation may defer the recovery of these amounts in order to reduce price volatility. The suppliers usually keep track of these deferred amounts in separate regulatory deferral accounts until they are recovered through future sales of the regulated goods or services.
In some jurisdictions, national accounting standard setting bodies permit or require entities that are subject to particular types of rate regulation to recognise these deferred amounts as part of assets (such as the related property, plant and equipment) or as separate receivables or payables. This changes the timing of when these amounts are recognised in profit or loss. IFRS does not have requirements specific to rate regulation. The IFRS Interpretations Committee has previously concluded that simply applying the specific requirements of another jurisdiction, such as US generally accepted accounting principles (US GAAP), might lead to the recognition of some items in the statement of financial position that would potentially conflict with the requirements of other Standards. The established practice of most entities that currently apply IFRS is not to recognise these regulatory deferral account balances but to allow them, instead, to flow through profit or loss as they arise.
IFRS 15, 'Revenue from Contracts with Customers', Issued: May 2014 (effective 1 January 2017)
IFRS 15 specifies how and when an IFRS reporter will recognise revenue as well as requiring such entities to provide users of financial statements with more informative, relevant disclosures. The standard provides five-step model to be applied to all contracts with customers. IFRS 15 was issued in May 2014 and applies to an annual reporting period beginning on or after 1 January 2017.
IFRS 9, ‘Financial instruments’, issued in November 2009 (effective 1 January 2018) IFRS 9 was issued in November 2009 and October 2010. It replaces the parts of IAS 39 that relate to the classification and measurement of financial instruments. IFRS 9 requires financial assets to be classified into two measurement categories: those measured as at fair value and those measured at amortised cost. The determination is made at initial recognition. The classification depends on the entity’s business model for managing its financial instruments and the contractual cash flow characteristics of the instrument. For financial liabilities, the standard retains most of the IAS 39 requirements. The main change is that, in cases where the fair value option is taken for financial liabilities, the part of a fair value change due to an entity’s own credit risk is recorded in other comprehensive income rather than the income statement, unless this creates an accounting mismatch. The Company is yet to assess IFRS 9’s full impact and intends to adopt IFRS 9 no later than the accounting period beginning on or after 1 January 2015.
PRESCO PLC Financial statements
For the year ended 31 December 2015
9
NOTES TO THE FINANCIAL STATEMENTS 2.2 New standards not yet effective (cont’d) IAS 16 and IAS 41 - Amendments to Agriculture: Bearer Plants (effective 1 January 2016)
"IAS 41 ‘Agriculture’ requires all biological assets that are related to agricultural activity to be measured at fair value less costs to sell (subject to fair value being reliably measurable), based on the principle that their biological transformation is best reflected by fair value measurement. However, there is a class of biological assets, known as bearer plants, that, once mature, are held by an entity solely to grow produce over their productive life. Examples include grape vines, rubber trees and oil palms. Constituents told the IASB that IAS 41’s fair value model was not appropriate for mature bearer plants that are no longer undergoing significant biological transformation as the way they use these assets is more similar in nature to manufacturing. The IASB listened to these concerns and made changes by issuing ‘Agriculture: Bearer Plants (Amendments to IAS 16 and IAS 41)’."
The Amendments define a bearer plant as a living plant that:
is used in the production or supply of agricultural produce;
is expected to bear produce for more than one period; and
has a remote likelihood of being sold as agricultural produce, except for incidental scrap sales (this definition is not met if there is a more than ‘remote’ likelihood that the plant will be sold as agricultural produce, incidental scrap sales excepted)
include bearer plants within the scope of IAS 16 ‘Property, plant and equipment’ instead of IAS 41 (produce growing on bearer plants remains within the scope of IAS 41)
clarify that until bearer plants are mature, they are to be accounted for as self-constructed items of property, plant and equipment
require any difference between fair value and the carrying amount under IAS 41 (fair value less costs to sell) at the time of initial adoption to be recognized in opening retained earnings 'exempt entities from the requirement in IAS 8 ‘Accounting Policies, Changes in Accounting Estimates and Errors’ to disclose the impact of initial application on each financial statement line item affected.
permit the fair value of the bearer plants at the beginning of the earliest period presented to be used as the deemed cost for IAS 16 purposes when first applied.
The Amendments do not result in any changes to existing accounting for ‘bearer livestock’ or plants with more than a remote likelihood of being harvested and sold as agricultural produce." Amendments to IAS 1 Disclosure Initiative. The amendments were a response to comments that there were difficulties in applying the concept of materiality in practice as the wording of some of the requirements in IAS 1 had in some cases been read to prevent the use of judgement. Certain key highlights in the amendments are as follows:
An entity should not reduce the understandability of its financial statements by obscuring material information with immaterial information or by aggregating material items that have different natures or functions.
An entity needs not provide a specific disclosure required by an IFRS if the information resulting from that disclosure is not material.
In the other comprehensive income section of a statement of profit or loss and other comprehensive income, the amendments require separate disclosures for the following items:
o the share of other comprehensive income of associates and joint ventures accounted for using the equity method that will not be reclassified subsequently to profit or loss; and
o the share of other comprehensive income of associates and joint ventures accounted for using the equity method that will be reclassified subsequently to profit or loss.
The amendments to IAS 1 are effective for annual periods beginning on or after 1 January 2016 with earlier application permitted. Application of the amendments need not be disclosed

PRESCO PLC Financial statements
For the year ended 31 December 2015
10
NOTES TO THE FINANCIAL STATEMENTS 2.2 New standards not yet effective (cont’d)
There are no other IFRSs or IFRIC interpretations that are not yet effective that would be expected to have a material impact on the company.
2.3 Correction of an error The following errors were corrected in respect of the prior year(s):
1 Biological assets. The fair value of biological asset was understated by N14.7 billion in 2014 (N13.5 billion in 2013)
2 Defined benefit obligation: Amounts recognized were different from amounts stated in the valuation report.
3 Property, plant and equipment. Error noted in accounting for finance lease obligation (land) for 2014 was corrected.
2.3.1 The impact on equity (increase/ (decrease)) of the above restatements is as follows:
2014 2013 N'000 N'000
Biological assets 14,795,199 13,576,619 Property, plant and equipment 78,119 -
Total assets
14,873,318 13,576,619
Finance lease obligation - Defined benefit obligation - 91,944
Total liabilities
- 91,944
Net impact on equity
14,873,318 13,668,563
2.3.2 Impact on statement of profit or loss and other comprehensive income (increase/ (decrease)):
2014 N'000
Gain on biological assets revaluation 4,425,928 Selling, general and administrative expenses 54,544 Income tax expense (1,892,759)
Net impact on profit or loss for the year
2,587,713
Other comprehensive income net of tax:
Remeasurement of defined benefit obligation 68,369
Total comprehensive income for the year
2,656,082
2.3.3 Impact on basic and diluted earnings per share (EPS) (increase):
2014 N'000
Earnings per share:
Basic (Naira) 2.59
Diluted (Naira) 2.59
PRESCO PLC Financial statements
For the year ended 31 December 2015
11
NOTES TO THE FINANCIAL STATEMENTS 3 Summary of Significant Accounting Policies
(a) Foreign currency transactions
Transactions in foreign currencies are translated at the exchange rate ruling at the date of the transaction. Monetary assets and liabilities denominated in foreign currencies are translated at the exchange rate ruling at the reporting date. Foreign exchange differences arising on translation are recognized in the income statement part of the statement of comprehensive income. Non-monetary assets and liabilities denominated in foreign currencies are translated at the foreign exchange rate ruling at the date of the transaction.
(b) Intangible assets
Intangible assets with finite useful lives that are acquired separately are carried at cost less accumulated amortisation and accumulated impairment losses. Amortisation is recognised on a straight-line basis over their estimated useful lives. The estimated useful life and amortisation method are reviewed at the end of each reporting period, with the effect of any changes in estimate being accounted for on a prospective basis. Intangible assets with indefinite useful lives that are acquired separately are carried at cost less accumulated impairment losses.
Expenditure on research activities is recognised as an expense in the period in which it is incurred.
An internally-generated intangible asset arising from development (or from the development phase of an internal project) is recognised if, and only if, all of the following have been demonstrated:
the technical feasibility of completing the intangible asset so that it will be available for use or sale;
the intention to complete the intangible asset and use or sell it;
the ability to use or sell the intangible asset;
how the intangible asset will generate probable future economic benefits;
the availability of adequate technical, financial and other resources to complete the development and to use or sell the intangible asset; and
the ability to measure reliably the expenditure attributable to the intangible asset during its development.
The amount initially recognised for internally-generated intangible assets is the sum of the expenditure incurred from the date when the intangible asset first meets the recognition criteria listed above. Where no internally-generated intangible asset can be recognised, development expenditure is recognised in profit or loss in the period in which it is incurred.
Subsequent to initial recognition, internally-generated intangible assets are reported at cost less accumulated amortisation and accumulated impairment losses, on the same basis as intangible assets that are acquired separately.
An intangible asset is derecognised on disposal, or when no future economic benefits are expected from use or disposal. Gains or losses arising from derecognition of an intangible asset, measured as the difference between the net disposal proceeds and the carrying amount of the asset, are recognised in profit or loss when the asset is derecognised.
(c) Biological Assets
Biological activities are measured at fair value (IAS 41). Biological assets are recognised at the fair value according to an internal valuation model. This model is based on the discounted cash flow method (DCF).
The main variables in these models concern:
Production volumes
Selling price
Cost price
Discount rate A biological asset or agricultural produce is only recognised when it controls the asset as a result of past events, when it is probable that future economic benefits associated with the asset will flow to the Company and when the fair value or cost of the asset can be measured reliably.
A gain or loss arising on initial recognition of a biological asset at fair value less estimated selling costs and from the change in fair value less estimated selling costs of a biological asset is included in net profit or loss in the period in which it arises.
PRESCO PLC Financial statements
For the year ended 31 December 2015
12
NOTES TO THE FINANCIAL STATEMENTS (d) Property, plant & equipment
Items of property, plant and equipment held for use in the production or supply of goods or services, or for administrative purposes, are stated in the statement of financial position at their cost, less accumulated depreciation and accumulated impairment losses. Revaluations are performed with sufficient regularity such that the carrying amounts do not differ materially from those that would be determined using fair values at the end of each reporting period.
Depreciation is recognised so as to write off the cost or valuation of assets (other than freehold land and properties under construction) less their residual values over their useful lives, using the straight-line method. The estimated useful lives, residual values and depreciation method are reviewed at the end of each reporting period, with the effect of any changes in estimate accounted for on a prospective basis.
Unless revised due to specific changes in the estimated useful life, annual depreciation rates are as follows:
Buildings: 30 years
Leasehold land: 25-99 years
Processing equipment, Heavy duty equipment: 10-20 years
Furniture & Utilities: 5-7 years
Vehicles: 5-10 years
IT equipment: 3 years
An item of property, plant and equipment is derecognised upon disposal or when no future economic benefits are expected to arise from the continued use of the asset. Any gain or loss arising on the disposal or retirement of an item of property, plant and equipment is determined as the difference between the sales proceeds and the carrying amount of the asset and is recognised in profit or loss.
(e) Leases Assets held under finance leases are initially recognised as assets of the Group at their fair value at the inception of the lease or, if lower, at the present value of the minimum lease payments. The corresponding liability to the lessor is included in the statement of financial position as a financial liability. Lease payments are apportioned between finance expenses and reduction of the lease obligation so as to achieve a constant rate of interest on the remaining balance of the liability. Finance expenses are recognised immediately in profit or loss, unless they are directly attributable to qualifying assets, in which case they are capitalised in accordance with the Company's general policy on borrowing costs. Contingent rentals are recognised as expenses in the periods in which they are incurred. Operating lease payments are recognised as an expense on a straight-line basis over the lease term, except where another systematic basis is more representative of the time pattern in which economic benefits from the leased asset are consumed. Contingent rentals arising under operating leases are recognised as an expense in the period in which they are incurred. In the event that lease incentives are received to enter into operating leases, such incentives are recognised as a liability. The aggregate benefit of incentives is recognised as a reduction of rental expense on a straight-line basis, except where another systematic basis is more representative of the time pattern in which economic benefits from the leased asset are consumed.

PRESCO PLC Financial statements
For the year ended 31 December 2015
13
NOTES TO THE FINANCIAL STATEMENTS (f) Impairment of assets
At the end of each reporting period, the Company reviews the carrying amounts of its tangible and intangible assets to determine whether there is any indication that those assets have suffered an impairment loss. If any such indication exists, the recoverable amount of the asset is estimated in order to determine the extent of the impairment loss (if any). Where it is not possible to estimate the recoverable amount of an individual asset, the Company estimates the recoverable amount of the cash-generating unit to which the asset belongs. Where a reasonable and consistent basis of allocation can be identified, corporate assets are also allocated to individual cash-generating units, or otherwise they are allocated to the smallest group of cash-generating units for which a reasonable and consistent allocation basis can be identified. Intangible assets with indefinite useful lives and intangible assets not yet available for use are tested for impairment at least annually, and whenever there is an indication that the asset may be impaired. Recoverable amount is the higher of fair value less costs to sell and value in use. In assessing value in use, the estimated future cash flows are discounted to their present value using a pre-tax discount rate that reflects current market assessments of the time value of money and the risks specific to the asset for which the estimates of future cash flows have not been adjusted. If the recoverable amount of an asset (or cash-generating unit) is estimated to be less than its carrying amount, the carrying amount of the asset (or cash-generating unit) is reduced to its recoverable amount. An impairment loss is recognised immediately in profit or loss. Where an impairment loss subsequently reverses, the carrying amount of the asset (or a cash-generating unit) is increased to the revised estimate of its recoverable amount, but so that the increased carrying amount does not exceed the carrying amount that would have been determined had no impairment loss been recognised for the asset (or cash-generating unit) in prior years. A reversal of an impairment loss is recognised immediately in profit or loss.
(g) Financial assets
Financial assets are classified into the following specified categories: financial assets ‘at fair value through profit or loss' (FVTPL), ‘held-to-maturity' investments, ‘available-for-sale' (AFS) financial assets and ‘loans and receivables'. The classification depends on the nature and purpose of the financial assets and is determined at the time of initial recognition. All regular way purchases or sales of financial assets are recognised and derecognised on a trade date basis.
For the current year, the Company does only have financial assets classified as “loans and receivables”.
Loans and receivables are non-derivative financial assets with fixed or determinable payments that are not quoted in an active market. Loans and receivables (including trade and other receivables, bank balances and cash, and others) are measured at amortised cost using the effective interest method, less any impairment.
Interest income is recognised by applying the effective interest rate, except for short-term receivables when the recognition of interest would be immaterial.
The effective interest method is a method of calculating the amortised cost of a debt instrument and of allocating interest income over the relevant period. The effective interest rate is the rate that exactly discounts estimated future cash receipts (including all fees and points paid or received that form an integral part of the effective interest rate, transaction costs and other premiums or discounts) through the expected life of the debt instrument, or, where appropriate, a shorter period, to the net carrying amount on initial recognition.

PRESCO PLC Financial statements
For the year ended 31 December 2015
14
NOTES TO THE FINANCIAL STATEMENTS (g) Financial assets (cont’d)
Financial assets are assessed for indicators of impairment at the end of each reporting period. Financial assets are considered to be impaired when there is objective evidence that, as a result of one or more events that occurred after the initial recognition of the financial asset, the estimated future cash flows of the investment have been affected.
For certain categories of financial assets, such as trade receivables, assets that are assessed not to be impaired individually are, in addition, assessed for impairment on a collective basis. Objective evidence of impairment for a portfolio of receivables could include the Group's past experience of collecting payments, an increase in the number of delayed payments in the portfolio past the average credit period of 60 days, as well as observable changes in national or local economic conditions that correlate with default on receivables.
For financial assets measured at amortised cost, if, in a subsequent period, the amount of the impairment loss decreases and the decrease can be related objectively to an event occurring after the impairment was recognised, the previously recognised impairment loss is reversed through profit or loss to the extent that the carrying amount of the investment at the date the impairment is reversed does not exceed what the amortised cost would have been had the impairment not been recognised.
(h) Inventories Inventories are stated at the lower of cost and net realisable value. Costs of inventories are determined on a weighted average cost basis.
The stock finished products (including biological assets after harvest) are valued by adding production cost to the fair value of the biological asset concerned.
Inventories are written down on a case-by-case basis if the estimated net realizable value declines below the carrying amount of the inventories. Net realizable value is the estimated selling price less the estimated costs necessary to make the sale. When the reason for a write-down of the inventories has ceased to exist, the write-down is reversed.
(i) Cash and cash equivalent
Cash and cash equivalents includes cash in hand, deposits held at call with banks and other short term highly liquid investments with original maturities of three months or less. For the purpose of the statements of cash flows, cash and cash equivalents includes cash on hand and deposits held at call or short term maturity with banks (three months or less), net of bank overdrafts. Bank overdrafts, if any, are shown within borrowings in current liabilities on the balance sheet.
(j) Shareholders' equity An equity instrument is any contract that evidences a residual interest in the assets of an entity after deducting all of its liabilities. Equity instruments issued by the Company are recognised at the proceeds received, net of direct issue costs.
Where the Company purchases the Company’s equity share capital (treasury shares), the consideration paid, including any directly attributable incremental costs (net of income taxes) is deducted from equity attributable to the Company’s equity holders until the shares are cancelled, reissued or disposed of. Where such shares are subsequently sold or reissued, any consideration received, net of any directly attributable incremental transaction costs and the related income tax effects is included in equity attributable to the Company’s equity holders.

PRESCO PLC Financial statements
For the year ended 31 December 2015
15
NOTES TO THE FINANCIAL STATEMENTS (k) Provisions
Provisions are recognised when the Company has a present obligation (legal or constructive) as a result of a past event, it is probable that the Company will be required to settle the obligation, and a reliable estimate can be made of the amount of the obligation.
The amount recognised as a provision is the best estimate of the consideration required to settle the present obligation at the end of the reporting period, taking into account the risks and uncertainties surrounding the obligation. When a provision is measured using the cash flows estimated to settle the present obligation, its carrying amount is the present value of those cash flows (where the effect of the time value of money is material). When some or all of the economic benefits required to settle a provision are expected to be recovered from a third party, a receivable is recognised as an asset if it is reasonably certain that reimbursement will be received and the amount of the receivable can be measured reliably.
(l) Retirement benefits and other long term employees' benefits Employee benefits mainly concern:
retirement benefits: pension plans, termination benefits, other retirement obligations and supplemental benefits;
other long-term employee benefits: long-service benefits granted to employees according to their seniority in the Group;
other employee benefits: post-employment medical care.
Payments to defined contribution retirement benefit plans are recognised as an expense when employees have rendered service entitling them to the contributions.
For defined benefit retirement benefit plans, the cost of providing benefits is determined using the Projected Unit Credit Method, with actuarial valuations being carried out at the end of each reporting period. Actuarial gains and losses are recognised immediately in profit or loss. Past service cost is recognised immediately to the extent that the benefits are already vested, and otherwise is amortised on a straight-line basis over the average period until the benefits become vested.
The retirement benefit obligation recognised in the statement of financial position represents the present value of the defined benefit obligation as adjusted for unrecognised actuarial gains and losses and unrecognised past service cost, and as reduced by the fair value of plan assets. Any asset resulting from this calculation is limited to unrecognised actuarial losses and past service cost, plus the present value of available refunds and reductions in future contributions to the plan.
(m) Financial liabilities
Debt and equity instruments issued by the Company are classified as either financial liabilities or as equity in accordance with the substance of the contractual arrangements and the definitions of a financial liability and an equity instrument.
Financial liabilities are classified as either “financial liabilities at fair value through profit or loss” or “other financial liabilities”.
The Company does not hold any financial liabilities at fair value through profit or loss.
Other financial liabilities (including borrowings) are subsequently measured at amortised cost using the effective interest method.
The effective interest method is a method of calculating the amortised cost of a financial liability and of allocating interest expense over the relevant period. The effective interest rate is the rate that exactly discounts estimated future cash payments (including all fees and points paid or received that form an integral part of the effective interest rate, transaction costs and other premiums or discounts) through the expected life of the financial liability, or (where appropriate) a shorter period, to the net carrying amount on initial recognition.
PRESCO PLC Financial statements
For the year ended 31 December 2015
16
NOTES TO THE FINANCIAL STATEMENTS (n) Government Grants
Government grants are not recognised until there is reasonable assurance that the Company will comply with the conditions attaching to them and that the grants will be received. Government grants are recognised in profit or loss on a systematic basis over the periods in which the Company recognises as expenses the related costs for which the grants are intended to compensate. Specifically, government grants whose primary condition is that the Company should purchase, construct or otherwise acquire non-current assets are recognised as deferred revenue in the statement of financial position and transferred to profit or loss on a systematic and rational basis over the useful lives of the related assets. The benefit of a government loan at a below-market rate of interest is treated as a government grant, measured as the difference between proceeds received and the fair value of the loan based on prevailing market interest rates.
(o) Income Taxes Income tax expense represents the sum of the tax currently payable and deferred tax.
The tax currently payable is based on taxable profit for the year. Taxable profit differs from profit as reported in the statement of comprehensive income because of items of income or expense that are taxable or deductible in other years and items that are never taxable or deductible. The Company's liability for current tax is calculated using tax rates that have been enacted or substantively enacted by the end of the reporting period. Deferred tax is recognised on temporary differences between the carrying amounts of assets and liabilities in the financial statements and the corresponding tax bases used in the computation of taxable profit (e.g. differences between carrying amounts under IFRS and the statutory tax bases). Deferred tax liabilities are generally recognised for all taxable temporary differences. Deferred tax assets are generally recognised for all deductible temporary differences to the extent that it is probable that taxable profits will be available against which those deductible temporary differences can be utilised. Such deferred tax assets and liabilities are not recognised if the temporary difference arises from goodwill or from the initial recognition (other than in a business combination) of other assets and liabilities in a transaction that affects neither the taxable profit nor the accounting profit. The carrying amount of deferred tax assets is reviewed at the end of each reporting period and reduced to the extent that it is no longer probable that sufficient taxable profits will be available to allow all or part of the asset to be recovered.
Deferred tax assets and liabilities are measured at the tax rates that are expected to apply in the period in which the liability is settled or the asset realised, based on tax rates (and tax laws) that have been enacted or substantively enacted by the end of the reporting period. The measurement of deferred tax liabilities and assets reflects the tax consequences that would follow from the manner in which the Company expects, at the end of the reporting period, to recover or settle the carrying amount of its assets and liabilities.
(p) Revenue Recognition Revenue is measured at the fair value of the consideration received or receivable. Revenue is reduced for estimated customer returns, rebates and other similar allowances. Revenue from the sale of goods is recognized when significant risks and rewards of ownership of the goods are transferred to the buyer.
PRESCO PLC Financial statements
For the year ended 31 December 2015
17
NOTES TO THE FINANCIAL STATEMENTS (q) Borrowing costs
Borrowing costs directly attributable to the acquisition, construction or production of qualifying assets, which are assets that necessarily take a substantial period of time to get ready for their intended use or sale, are added to the cost of those assets, until such time as the assets are substantially ready for their intended use or sale.
Investment income earned on the temporary investment of specific borrowings pending their expenditure on qualifying assets is deducted from the borrowing costs eligible for capitalisation.
All other borrowing costs are recognised in profit or loss in the period in which they are incurred. (r) Segment information
The Chief Executive Officer is the Company's chief operating decision-maker. The Chief Executive Officer has determined that there is only one business and operating segment. Based on the information reviewed by the Chief Executive Officer for the purposes of allocating resources and assessing performance, the Company is only involved in cultivation of oil palms and in the extraction, refining and fractioning of crude palm oil into vegetable oil and palm stearin.
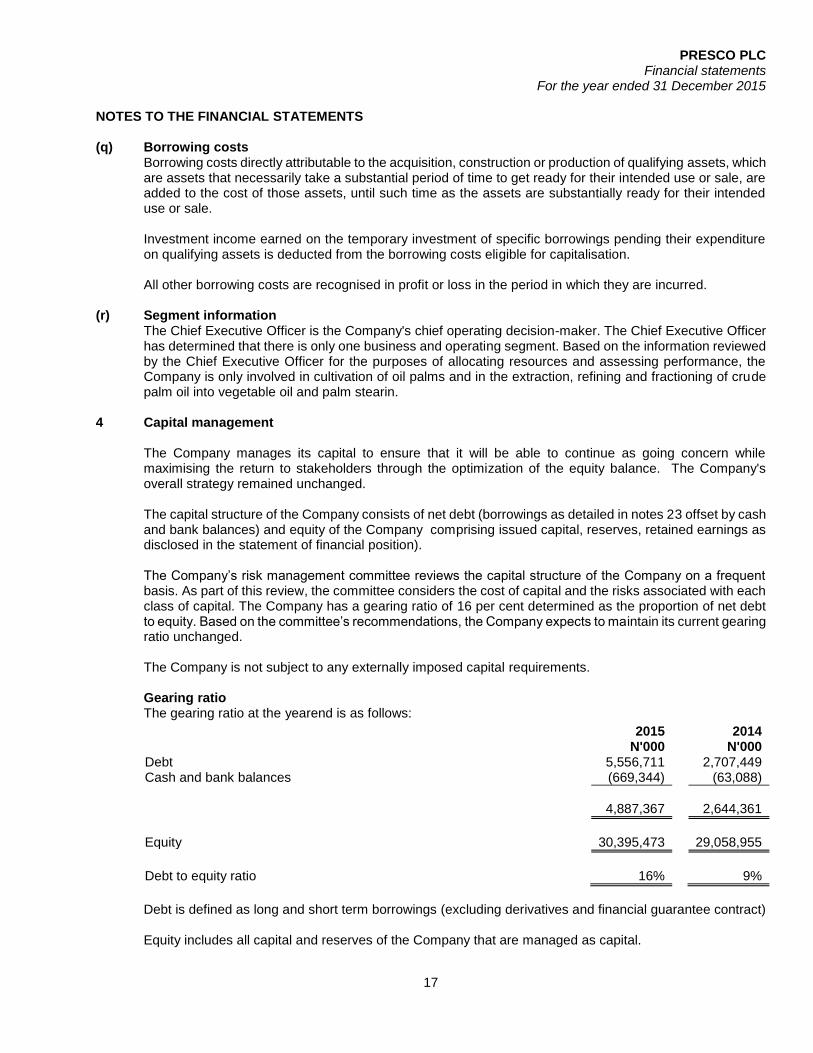
4 Capital management
The Company manages its capital to ensure that it will be able to continue as going concern while maximising the return to stakeholders through the optimization of the equity balance. The Company's overall strategy remained unchanged.
The capital structure of the Company consists of net debt (borrowings as detailed in notes 23 offset by cash and bank balances) and equity of the Company comprising issued capital, reserves, retained earnings as disclosed in the statement of financial position).
The Company’s risk management committee reviews the capital structure of the Company on a frequent basis. As part of this review, the committee considers the cost of capital and the risks associated with each class of capital. The Company has a gearing ratio of 16 per cent determined as the proportion of net debt to equity. Based on the committee’s recommendations, the Company expects to maintain its current gearing ratio unchanged.
The Company is not subject to any externally imposed capital requirements. Gearing ratio The gearing ratio at the yearend is as follows:
2015 2014 N'000 N'000
Debt 5,556,711 2,707,449 Cash and bank balances (669,344) (63,088)
4,887,367 2,644,361
Equity 30,395,473 29,058,955
Debt to equity ratio 16% 9%
Debt is defined as long and short term borrowings (excluding derivatives and financial guarantee contract) Equity includes all capital and reserves of the Company that are managed as capital.

PRESCO PLC Financial statements
For the year ended 31 December 2015
18
NOTES TO THE FINANCIAL STATEMENTS 5 Financial instruments
5.1 Categories of financial instruments
2015 2014 Financial assets N'000 N'000
Cash and bank balances 669,344 63,088 Loans and receivables 2,985,728 1,768,774
3,655,072 1,831,862
Financial liabilities
Amortized cost:
Borrowings 4,042,077 2,354,727 Overdrafts 1,514,634 352,722 Trade and other payables 3,356,707 3,397,025
8,913,418 6,104,473
5.2 Financial Risk Management
Risk Management is essential to help ensure business sustainability thereby providing customers and the shareholders with a long-term value proposition.
Key elements of risk management are:
- Strong corporate governance including relevant and reliable management information and internal control processes;
- Ensuring significant and relevant skills and services are available consistently to the Company;
- Influencing the business and environment by being active participants in the relevant regulatory and business forums; and
- Keeping abreast of technology and consumer trends and investing capital and resources where required.
The overall Company focus within an appropriate risk framework is to give value to the customers through effective and efficient execution of transactions. The board of directors acknowledges its responsibility for establishing, monitoring and communicating appropriate risk and control policies.
The Company monitors and manages financial risks relating to its operations through internal risk report which analyses exposures by degree and magnitude of risks. These risks include market risk (including currency risk and interest rate risk), credit risk and liquidity risk.
5.2.1 Market risk Market risk is the risk that the fair value or future cash flows of a financial instrument will fluctuate because
of changes in market prices such as interest rate, exchange rates and other prices.
The Company's activities expose it primarily to financial risks of changes in foreign currency exchange rates and interest rates. Market risks exposures are measured using sensitivity analysis.

PRESCO PLC Financial statements
For the year ended 31 December 2015
19
NOTES TO THE FINANCIAL STATEMENTS 5.2.1.1 Foreign currency risk management
The Company undertakes transactions denominated in foreign currencies; consequently, exposures to exchange rate fluctuations arise. The Company are mainly exposed to USD and EUR.
The following table details the Company's sensitivity to a 3%, increase and decrease in Naira against USD and EUR currencies. Management believes that a 3% movement in either direction is reasonably possible at the balance sheet date. The sensitivity analyses below include outstanding balances of USD and EUR denominated assets and liabilities. A positive number indicates an increase in profit where Naira strengthens by 3% against the USD and EUR. For a 3% weakening of Naira against the USD and EUR there would be an equal and opposite impact on profit, and the balances below would be negative.
2015 2014 N'000 N'000 Profit/(loss)
after tax Profit/(loss)
after tax Naira strengthens by 3% against the USD 1,512 -
Naira strengthens by 3% against the EUR 25,884 -
Naira weakens by 3% against the USD (1,512) - Naira weakens by 3% against the EUR (25,884) -
5.2.1.2 Interest rate risk Interest rate risk is the risk that the fair value or future cash flows of a financial instrument will fluctuate due
to the changes in market interest rates. The Company is exposed to interest rate risk because it borrows funds denominated in USD and Naira at
floating interest rates. The sensitivity analyses below have been determined based on the exposure to interest rates for both USD and Naira denominated borrowings at the end of the reporting period. For floating rate liabilities, the analysis is prepared assuming the amount of the liability outstanding at the end of the reporting period was outstanding for the whole year. 10 basis points (BP) increase or decrease are used when reporting LIBOR and NIBOR risks internally to key management personnel and these represent management’s assessment of the reasonably possible change in interest rates.
If LIBOR had been 10 basis points (i.e. 1%) higher/lower and all other variables were held constant, the
Company's profit or loss will be affected as follows:
2015 2014 N'000 N'000 Profit/(loss)
after tax Profit/(loss)
after tax If LIBOR is 10 BP lower:
Borrowings (USD) 612 3,138
If LIBOR is 10 BP higher:
Borrowings (USD) (612) (3,138)
If NIBOR is 10 BP lower:
Borrowings (NGN) 19,189 86,392
If NIBOR is 10 BP higher:
Borrowings (NGN) (19,189) (86,392)

PRESCO PLC Financial statements
For the year ended 31 December 2015
20
NOTES TO THE FINANCIAL STATEMENTS 5.2.2 Liquidity risk management Liquidity risk is the risk that the Company will encounter difficulty in meeting obligations associated with
financial liabilities that are settled by delivering cash or another financial asset.
Ultimate responsibility for liquidity risk management rests with the board of directors, which has established an appropriate liquidity risk management framework for the management of the Company’s short-, medium- and long-term funding and liquidity management requirements. The Company manages liquidity risk by maintaining adequate reserves, banking facilities and reserve borrowing facilities, by continuously monitoring forecast and actual cash flows, and by matching the maturity profiles of financial assets and liabilities.
5.2.2.1 Maturity analysis of financial liabilities The following table details the Company’s expected maturity for its non-derivative financial liabilities with
agreed repayment periods. The tables below have been drawn up based on the undiscounted contractual maturities of the financial assets including interest that will be earned on those assets. The inclusion of information on non-derivative financial assets is necessary to understand the Company’s liquidity risk management as the liquidity is managed on a net asset and liability basis.
0-6 months
6-12 months
12-24 months
24 months and above Total
N'000 N'000 N'000 N'000 N'000 2015
Trade and other payables 389,873 3,467,810 - - 3,857,683 Borrowings 616,145 4,114,669 - - 4,730,814
2014
Trade and other payables 51,600 3,345,424 - - 3,397,024 Borrowings 539,414 3,099,105 - - 3,638,519
5.2.3 Credit risk management Credit risk refers to the risk that a counterparty will default on its contractual obligations resulting in financial
loss to the Company. The Company has adopted a policy of only dealing with creditworthy counterparties, as a means of mitigating the risk of financial loss from defaults. The Company only transacts with entities that are rated the equivalent of investment grade and above. This information is supplied by independent rating agencies where available and, if not available, the Company uses other publicly available financial information and its own trading records to rate its major customers. The Company's exposures to its counterparties are continuously monitored and the aggregate value of transactions concluded is spread amongst approved counterparties. Credit exposure is controlled by counterparty limits that are reviewed and approved by the risk management committee annually.
Financial assets and other credit exposures
Maximum credit risk
2015 2014 N'000 N'000
Bank balances 669,344 63,088 Trade and other receivables 2,985,728 1,768,774
The Company does not hold any collateral or other credit enhancements to cover this credit risk.
PRESCO PLC Financial statements
For the year ended 31 December 2015
21
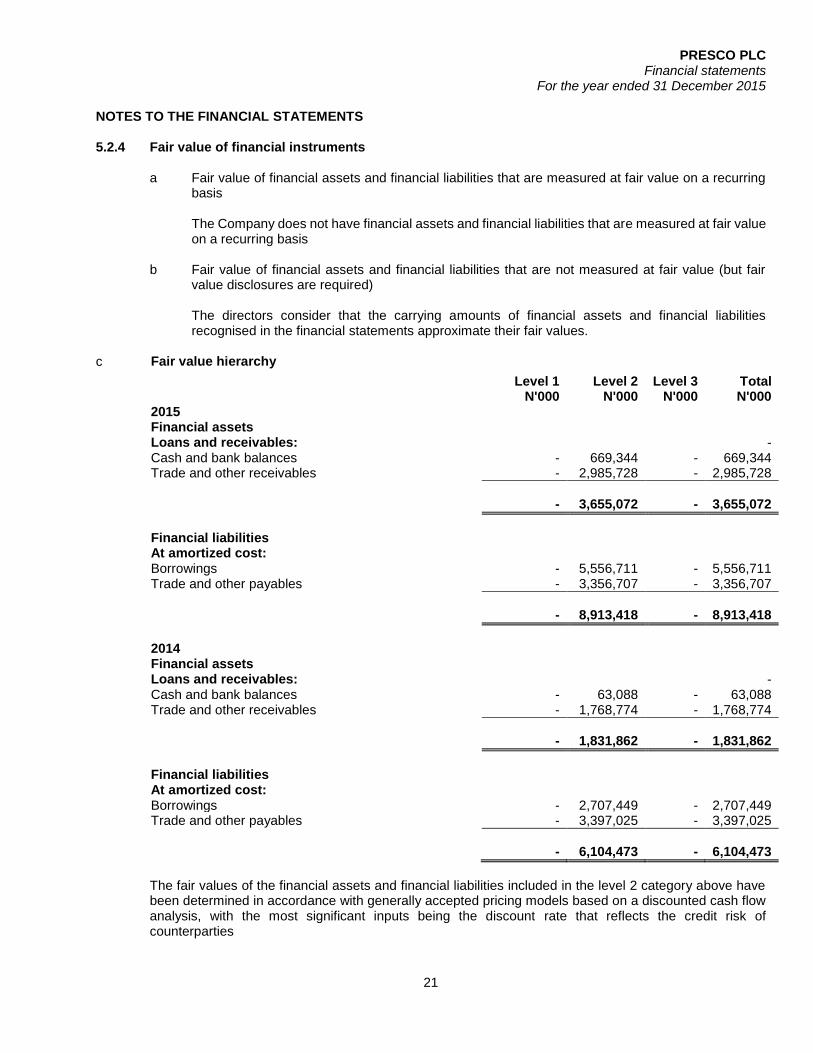
NOTES TO THE FINANCIAL STATEMENTS 5.2.4 Fair value of financial instruments
a Fair value of financial assets and financial liabilities that are measured at fair value on a recurring basis The Company does not have financial assets and financial liabilities that are measured at fair value on a recurring basis
b Fair value of financial assets and financial liabilities that are not measured at fair value (but fair
value disclosures are required)
The directors consider that the carrying amounts of financial assets and financial liabilities recognised in the financial statements approximate their fair values.
c Fair value hierarchy
Level 1 Level 2 Level 3 Total N'000 N'000 N'000 N'000 2015
Financial assets
Loans and receivables: - Cash and bank balances - 669,344 - 669,344 Trade and other receivables - 2,985,728 - 2,985,728
- 3,655,072 - 3,655,072
Financial liabilities
At amortized cost:
Borrowings - 5,556,711 - 5,556,711 Trade and other payables - 3,356,707 - 3,356,707
- 8,913,418 - 8,913,418
2014
Financial assets
Loans and receivables: - Cash and bank balances - 63,088 - 63,088 Trade and other receivables - 1,768,774 - 1,768,774
- 1,831,862 - 1,831,862
Financial liabilities
At amortized cost:
Borrowings - 2,707,449 - 2,707,449 Trade and other payables - 3,397,025 - 3,397,025
- 6,104,473 - 6,104,473
The fair values of the financial assets and financial liabilities included in the level 2 category above have been determined in accordance with generally accepted pricing models based on a discounted cash flow analysis, with the most significant inputs being the discount rate that reflects the credit risk of counterparties
PRESCO PLC Financial statements
For the year ended 31 December 2015
22
NOTES TO THE FINANCIAL STATEMENTS 5.2.4 Fair value of financial instruments (cont’d)
Financial instruments in level 1 The fair value of financial instruments traded in active markets is based on quoted market prices at the balance sheet date. A market is regarded as active if quoted prices are readily and regularly available from an exchange, dealer, broker, industry Company, pricing service, or regulatory agency, and those prices represent actual and regularly occurring market transactions on an arm’s length basis. The quoted market price used for financial assets held by the Company is the current bid price. These instruments are included in level 1. Instruments included in level 1 comprise primarily NSE equity investments classified as trading securities or available for sale. Financial instruments in level 2 The fair value of financial instruments that are not traded in an active market is determined by using valuation techniques. These valuation techniques maximise the use of observable market data where it is available and rely as little as possible on entity specific estimates. If all significant inputs required to fair value an instrument are observable, the instrument is included in level 2. Financial instruments in level 3 If one or more of the significant inputs is not based on observable market data, the instrument is included in level 3.
6 Critical accounting judgements and key sources of estimation uncertainty
In the application of the Company’s accounting policies, which are described in note 3, the directors are
required to make judgements, estimates and assumptions about the carrying amounts of assets and liabilities that are not readily apparent from other sources. The estimates and associated assumptions are based on historical experience and other factors that are considered to be relevant. Actual results may differ from these estimates.
The estimates and underlying assumptions are reviewed on an ongoing basis. Revisions to accounting estimates are recognised in the period in which the estimate is revised if the revision affects only that period, or in the period of the revision and future periods if the revision affects both current and future periods.
The following are the critical judgements and estimates that the directors have made in the process of applying the Company’s accounting policies and that have the most significant effect on the amounts recognised in financial statements.
6.1 Property, plant and equipment Property plant and equipment represent a significant proportion of the asset base of the Company.
Therefore the estimates and assumptions made to determine their carrying value and related depreciation are critical to the Company’s financial position and performance.
The charge in respect of periodic depreciation is derived after determining an estimate of an asset’s expected useful life and the expected residual value at the end of its life. Increasing an asset’s expected life or its residual value would result in the reduced depreciation charge in the statement of comprehensive income.
6.2 Provision for defined benefit obligation The Company operates an unfunded defined benefit scheme. IAS 19 requires the application of the
Projected Unit Credit Method for actuarial valuations. Actuarial measurements involve the making of several demographic projections regarding mortality, rates of employee turnover etc. and financial projections in the area of future salaries and benefit levels, discount rate, inflation etc.
PRESCO PLC Financial statements
For the year ended 31 December 2015
23
NOTES TO THE FINANCIAL STATEMENTS 6.3 Taxation The Company’s tax charge on ordinary activities is the sum of the total current and deferred tax charges.
The calculation of the Company’s total tax charge necessarily involves a degree of estimation and judgment in respect of certain items whose treatment cannot be finally determined until resolution has been reached with the relevant tax authority. Under the Nigerian tax system, self-assessment returns are subjected to a desk review for the determination of tax due for remittance in the relevant year of assessment. This is however not conclusive as field audits are carried out within six years of the end of the relevant year of assessment to determine the adequacy or otherwise of sums remitted under self-assessment thus making tax positions uncertain.
6.4 Valuation of financial liabilities As at the end of the reporting period, the Company was granted some government assisted loans at below
market rates (see note 23). In accordance with IAS 20, the government grant which is the difference between the proceeds of the loans and their fair value has been accounted for and disclosed in note 25. Based on IAS 39, all financial liabilities should be initially recognized at fair value. In computing the fair value of these loans, the imputed interest rate used in discounting the cashflows associated with the loans is based on management judgement of best estimate of its borrowing cost at the time the loans were granted.
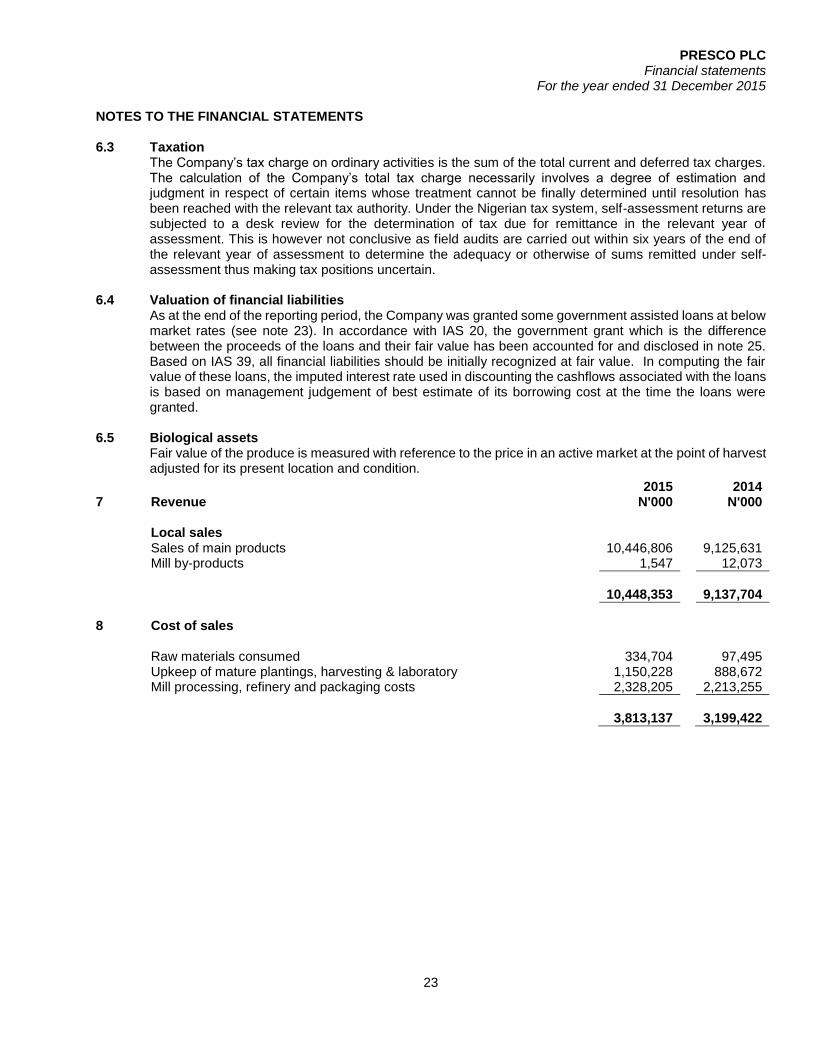
6.5 Biological assets Fair value of the produce is measured with reference to the price in an active market at the point of harvest
adjusted for its present location and condition.
2015 2014 7 Revenue N'000 N'000 Local sales
Sales of main products 10,446,806 9,125,631 Mill by-products 1,547 12,073
10,448,353 9,137,704
8 Cost of sales
Raw materials consumed 334,704 97,495 Upkeep of mature plantings, harvesting & laboratory 1,150,228 888,672 Mill processing, refinery and packaging costs 2,328,205 2,213,255
3,813,137 3,199,422

PRESCO PLC Financial statements
For the year ended 31 December 2015
24
NOTES TO THE FINANCIAL STATEMENTS
9 Selling, general and administrative expenses 2015 2014 N'000 N'000 Clearing and handling 195,682 85,837 Office and housing expenses 54,531 43,027 Rent and rate 14,645 9,245 Repairs and maintenance 162,748 80,983 Postage and telephone 15,577 17,940 Insurance 102,275 69,512 Legal 23,509 4,182 Audit fees 24,000 12,000 Professional and other consultancy fees 65,989 95,655 Donation 1,327 500 Subscription and licences 25,456 9,867 Transport and travelling 240,813 553,141 Management fees (note 34) - 300,000 Security 45,395 55,399 Selling expenses 37,323 1,641 Community development 58,125 54,515 Meeting, entertainment and public relations 38,455 22,342 Directors' fees 26,184 20,617 Staff costs 799,937 679,009 Depreciation 466,265 763,317 Bank charges 91,478 43,570 Exchange losses 392,880 249,809 Others 58,341 128,624
2,940,936 3,300,732
10 Other gains
Livestock sales 1,587 378 Others 313,766 15,680 Financial income 49,286 5,946
364,639 22,004
11 Finance costs N'000 N'000 Interests on loans 524,028 20,825 Interests on overdrafts, etc. 156,684 161,472 Other interests 27,088 180,265
707,800 362,562
12 Profit before taxation
Profit before taxation is stated after charging the following:
Depreciation of property plant and equipment 1,118,697 1,260,150 Directors' remuneration 26,184 7,289 Auditors' remuneration 24,000 12,000 Loss on disposal of fixed assets 1,007 5,945 Interest on loans, overdraft, etc. 707,800 362,562 Management fee (note 34) - 300,000 Seconded staff cost 599,675 563,212 Exchange loss 443,312 -
PRESCO PLC Financial statements
For the year ended 31 December 2015
25
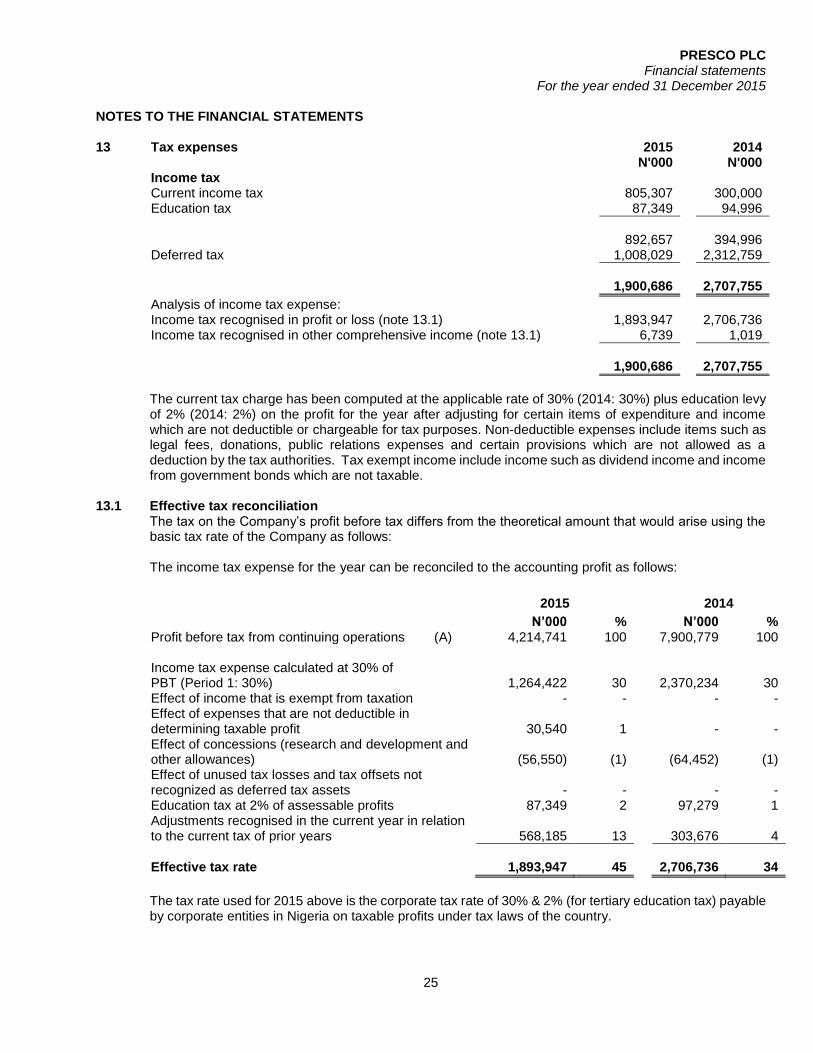
NOTES TO THE FINANCIAL STATEMENTS 13 Tax expenses 2015 2014 N'000 N'000 Income tax
Current income tax 805,307 300,000 Education tax 87,349 94,996
892,657 394,996 Deferred tax 1,008,029 2,312,759
1,900,686 2,707,755
Analysis of income tax expense: Income tax recognised in profit or loss (note 13.1) 1,893,947 2,706,736 Income tax recognised in other comprehensive income (note 13.1) 6,739 1,019
1,900,686 2,707,755
The current tax charge has been computed at the applicable rate of 30% (2014: 30%) plus education levy
of 2% (2014: 2%) on the profit for the year after adjusting for certain items of expenditure and income which are not deductible or chargeable for tax purposes. Non-deductible expenses include items such as legal fees, donations, public relations expenses and certain provisions which are not allowed as a deduction by the tax authorities. Tax exempt income include income such as dividend income and income from government bonds which are not taxable.
13.1 Effective tax reconciliation The tax on the Company’s profit before tax differs from the theoretical amount that would arise using the
basic tax rate of the Company as follows: The income tax expense for the year can be reconciled to the accounting profit as follows:
2015 2014
N’000 % N’000 % Profit before tax from continuing operations (A) 4,214,741 100 7,900,779 100
Income tax expense calculated at 30% of PBT (Period 1: 30%) 1,264,422 30
2,370,234 30
Effect of income that is exempt from taxation - - - - Effect of expenses that are not deductible in determining taxable profit 30,540 1
- -
Effect of concessions (research and development and other allowances) (56,550) (1)
(64,452) (1)
Effect of unused tax losses and tax offsets not recognized as deferred tax assets - -
- -
Education tax at 2% of assessable profits 87,349 2 97,279 1 Adjustments recognised in the current year in relation to the current tax of prior years 568,185 13
303,676 4
Effective tax rate
1,893,947 45
2,706,736 34
The tax rate used for 2015 above is the corporate tax rate of 30% & 2% (for tertiary education tax) payable by corporate entities in Nigeria on taxable profits under tax laws of the country.
PRESCO PLC Financial statements
For the year ended 31 December 2015
26
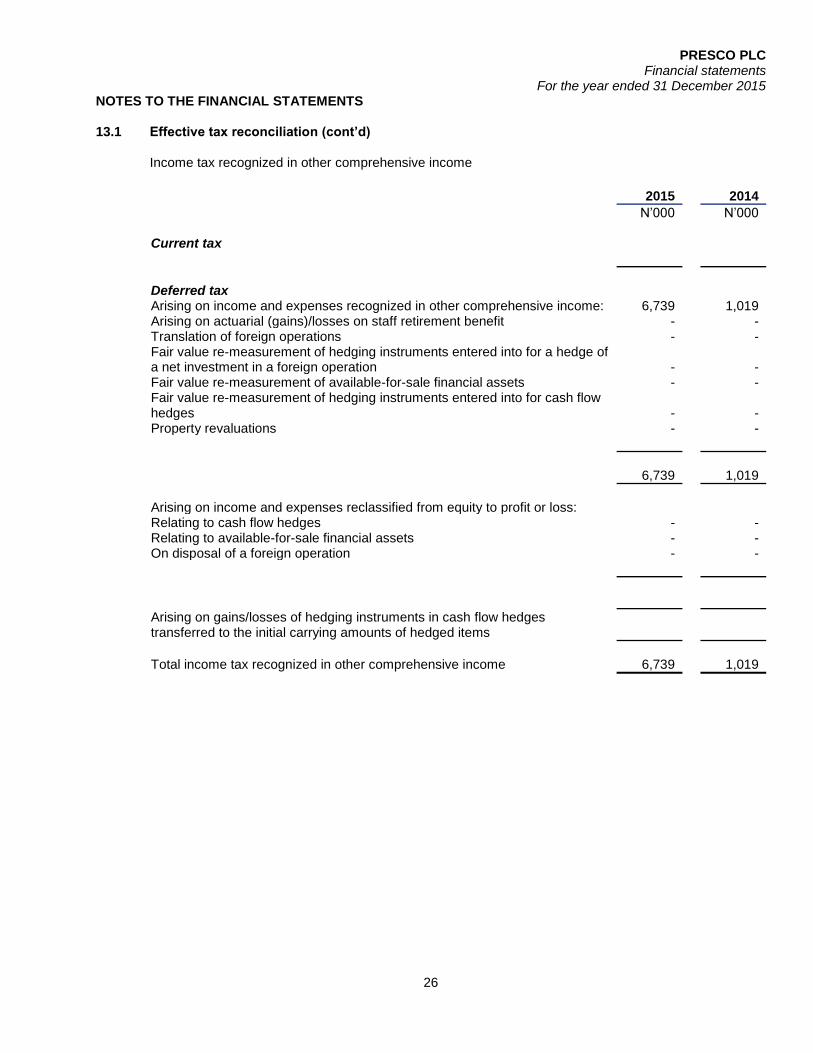
NOTES TO THE FINANCIAL STATEMENTS 13.1 Effective tax reconciliation (cont’d)
Income tax recognized in other comprehensive income
2015 2014
N’000 N’000
Current tax
Deferred tax
Arising on income and expenses recognized in other comprehensive income: 6,739 1,019 Arising on actuarial (gains)/losses on staff retirement benefit - - Translation of foreign operations - - Fair value re-measurement of hedging instruments entered into for a hedge of a net investment in a foreign operation - - Fair value re-measurement of available-for-sale financial assets - - Fair value re-measurement of hedging instruments entered into for cash flow hedges - - Property revaluations - -
6,739 1,019
Arising on income and expenses reclassified from equity to profit or loss:
Relating to cash flow hedges - - Relating to available-for-sale financial assets - - On disposal of a foreign operation - -
Arising on gains/losses of hedging instruments in cash flow hedges transferred to the initial carrying amounts of hedged items
Total income tax recognized in other comprehensive income 6,739 1,019
PRESCO PLC Financial statements
For the year ended 31 December 2015
27
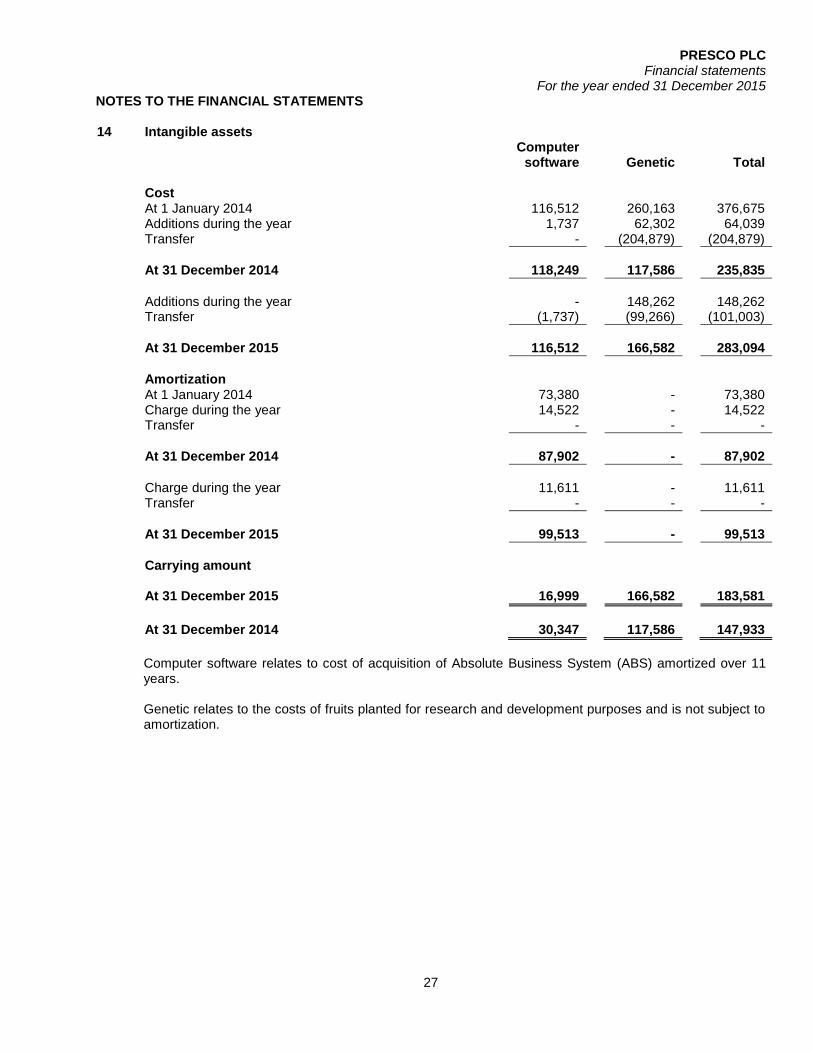
NOTES TO THE FINANCIAL STATEMENTS 14 Intangible assets
Computer software Genetic Total
Cost
At 1 January 2014 116,512 260,163 376,675 Additions during the year 1,737 62,302 64,039 Transfer - (204,879) (204,879)
At 31 December 2014
118,249 117,586 235,835
Additions during the year
- 148,262 148,262
Transfer (1,737) (99,266) (101,003)
At 31 December 2015
116,512 166,582 283,094
Amortization
At 1 January 2014 73,380 - 73,380 Charge during the year 14,522 - 14,522 Transfer - - -
At 31 December 2014
87,902 - 87,902
Charge during the year
11,611 - 11,611
Transfer - - -
At 31 December 2015
99,513 - 99,513
Carrying amount
At 31 December 2015 16,999 166,582 183,581
At 31 December 2014 30,347 117,586 147,933
Computer software relates to cost of acquisition of Absolute Business System (ABS) amortized over 11 years. Genetic relates to the costs of fruits planted for research and development purposes and is not subject to amortization.

PRESCO PLC Financial statements
For the year ended 31 December 2015
28
NOTES TO THE FINANCIAL STATEMENTS
15 Biological assets 2015 2014
N’000 N’000
Biological assets consist of palm tree and its kernels.
At fair value
At 1 January 35,528,186 27,873,130 Additions for the year 1,203,773 1,997,534 Transfer (20,723) - Amortization (202,107) (115,375) Fair value gain/(loss) 1,062,230 5,772,898
37,571,360 35,528,186
Analysis of biological assets
The company's biological assets are analysed as follows:
Matured plantation 26,675,665 25,225,012 Immature plantation 10,895,695 10,303,174
37,571,360 35,528,186
Further analysed into:
Current 1,252,379 1,184,273 Non-current 36,318,981 34,343,913
37,571,360 35,528,186
At 31 December 2015, Presco's material biological asset consists only of palm trees coming from 3 existing estates (Obaretin, Cowan and Ologbo):
Mature Palm trees for a total of 15,356 hectares; Immature Palm trees for a total of 1,294 hectares and; Pre nursery and Main nursery seedlings available to generate a total of 1,800 hectares of planting.
Since no reliable market-based prices are available to value the biological asset, the calculation method used (the income approach method) determines the present value of expected net cash flows from the biological asset in its present location and condition, discounted at a current market-determined rate. The net cash flows that the asset is expected to generate in its most relevant market, meaning at the earliest point at which a market exists being the price/ MT of FFB used to value the harvest net of cost of up keeping, harvesting, transporting and selling the fruits. Any cash flows for financing the assets, taxation or re-establishing biological assets after harvest have been excluded. The assumptions applied in the valuation were average CPO price in the local market and taking into account Nigerian Market specificities like interest rates, inflation rates etc., and a discount rate of 23% at 31 December 2015.
PRESCO PLC Financial statements
For the year ended 31 December 2015
29
NOTES TO THE FINANCIAL STATEMENTS
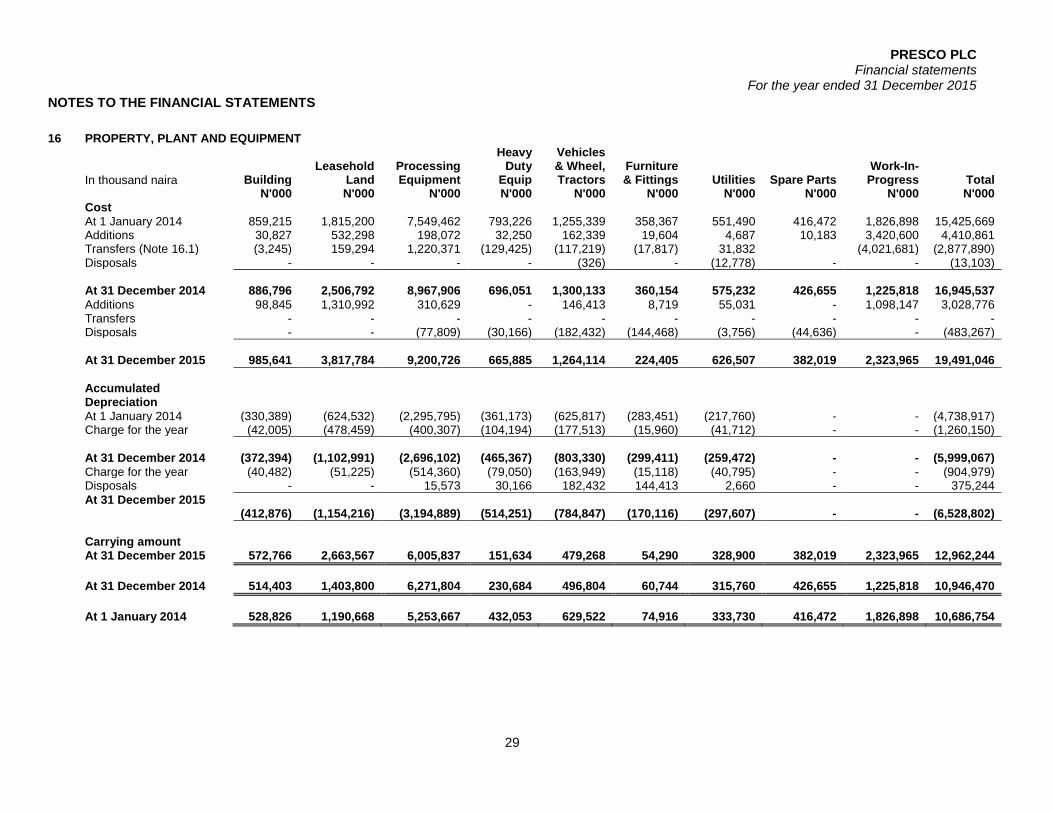
16 PROPERTY, PLANT AND EQUIPMENT
In thousand naira Building Leasehold
Land Processing Equipment
Heavy Duty
Equip
Vehicles & Wheel, Tractors
Furniture & Fittings Utilities Spare Parts
Work-In-Progress Total
N'000 N'000 N'000 N'000 N'000 N'000 N'000 N'000 N'000 N'000 Cost
At 1 January 2014 859,215 1,815,200 7,549,462 793,226 1,255,339 358,367 551,490 416,472 1,826,898 15,425,669 Additions 30,827 532,298 198,072 32,250 162,339 19,604 4,687 10,183 3,420,600 4,410,861 Transfers (Note 16.1) (3,245) 159,294 1,220,371 (129,425) (117,219) (17,817) 31,832 (4,021,681) (2,877,890) Disposals - - - - (326) - (12,778) - - (13,103)
At 31 December 2014
886,796 2,506,792 8,967,906 696,051 1,300,133 360,154 575,232 426,655 1,225,818 16,945,537 Additions 98,845 1,310,992 310,629 - 146,413 8,719 55,031 - 1,098,147 3,028,776 Transfers - - - - - - - - - - Disposals - - (77,809) (30,166) (182,432) (144,468) (3,756) (44,636) - (483,267)
At 31 December 2015
985,641 3,817,784 9,200,726 665,885 1,264,114 224,405 626,507 382,019 2,323,965 19,491,046
Accumulated Depreciation
At 1 January 2014 (330,389) (624,532) (2,295,795) (361,173) (625,817) (283,451) (217,760) - - (4,738,917) Charge for the year (42,005) (478,459) (400,307) (104,194) (177,513) (15,960) (41,712) - - (1,260,150)
At 31 December 2014
(372,394) (1,102,991) (2,696,102) (465,367) (803,330) (299,411) (259,472) - - (5,999,067) Charge for the year (40,482) (51,225) (514,360) (79,050) (163,949) (15,118) (40,795) - - (904,979) Disposals - - 15,573 30,166 182,432 144,413 2,660 - - 375,244
At 31 December 2015 (412,876) (1,154,216) (3,194,889) (514,251) (784,847) (170,116) (297,607) - - (6,528,802)
Carrying amount
At 31 December 2015 572,766 2,663,567 6,005,837 151,634 479,268 54,290 328,900 382,019 2,323,965 12,962,244
At 31 December 2014 514,403 1,403,800 6,271,804 230,684 496,804 60,744 315,760 426,655 1,225,818 10,946,470
At 1 January 2014 528,826 1,190,668 5,253,667 432,053 629,522 74,916 333,730 416,472 1,826,898 10,686,754

PRESCO PLC Financial statements
For the year ended 31 December 2015
30
NOTES TO THE FINANCIAL STATEMENTS 16.1 It refers to asset transfer/movement from one asset class to another within the property plant and equipment
class. 16.2 Assets pledged as security There are no asset pledged as security for loan or other form of borrowing. Impairment of tangible and intangible assets excluding goodwill
At each reporting date, the company reviews the carrying amounts of its tangible and intangible assets to determine whether there is any indication that those assets have suffered an impairment loss. If any such indication exists, the recoverable amount of the asset is estimated to determine the extent of the impairment loss (if any). Where the asset does not generate cash flows that are independent from other assets, the group estimates the recoverable amount of the cash-generating unit to which the asset belongs. An intangible asset with an indefinite useful life is tested for impairment at least annually and whenever there is an indication that the asset may be impaired. Recoverable amount is the higher of fair value less costs to sell and value in use. In assessing value in use, the estimated future cash flows are discounted to their present value using a pre-tax discount rate that reflects current market assessments of the time value of money and the risks specific to the asset for which the estimates of future cash flows have not been adjusted. If the recoverable amount of an asset (or cash-generating unit) is estimated to be less than its carrying amount, the carrying amount of the asset (or cash-generating unit) is reduced to its recoverable amount. An impairment loss is recognised immediately in profit or loss, unless the relevant asset is carried at a revalued amount, in which case the impairment loss is treated as a revaluation decrease. Where an impairment loss subsequently reverses, the carrying amount of the asset (or cash-generating unit) is increased to the revised estimate of its recoverable amount, but so that the increased carrying amount does not exceed the carrying amount that would have been determined had no impairment loss been recognised for the asset (or cash-generating unit) in prior years. A reversal of an impairment loss is recognised immediately in profit or loss, unless the relevant asset is carried at a revalued amount, in which case the reversal of the impairment loss is treated as a revaluation increase.
2015 2014 17 Other non-current assets N'000 N'000 Guarantee paid in cash 110 110
18 Inventories
Supplies 778,649 787,204 Finished Goods 120,712 105,832 Goods in Transit 206,271 470,893
1,105,632 1,363,929
The cost of inventories recognized as an expense during the year in respect of continuing operations was N633.4 million ( 2014 - N637 million).
PRESCO PLC Financial statements
For the year ended 31 December 2015
31
NOTES TO THE FINANCIAL STATEMENTS
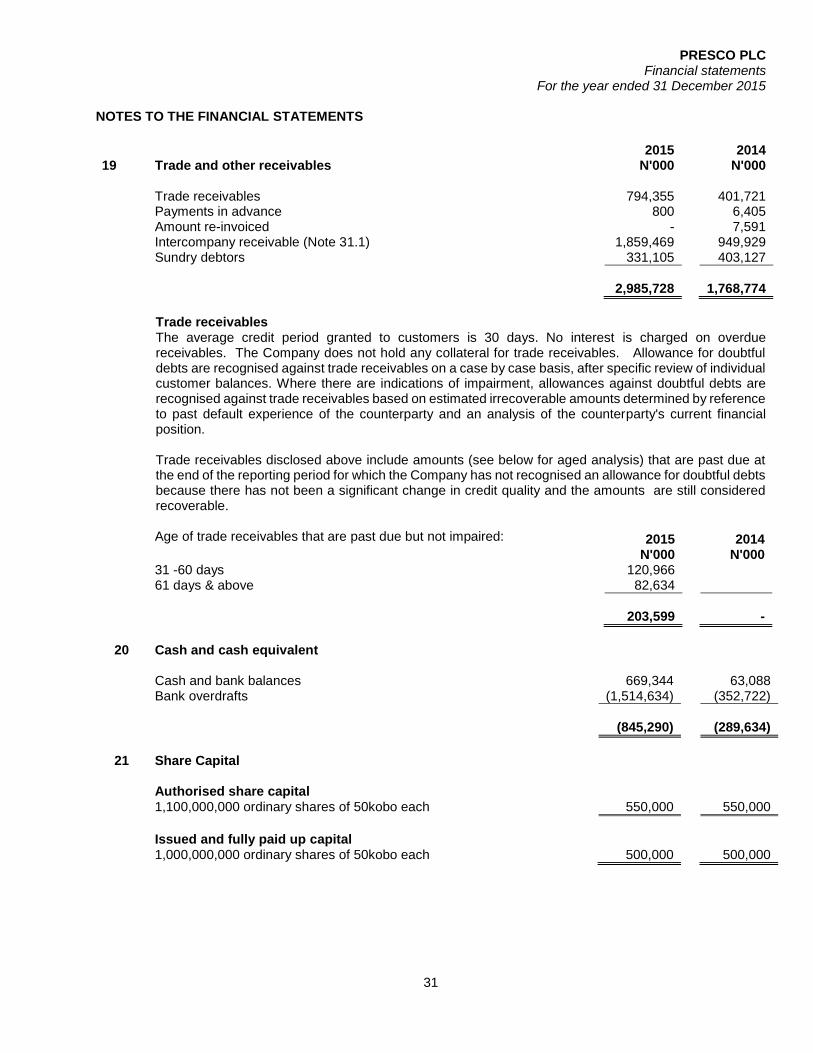
2015 2014 19 Trade and other receivables N'000 N'000 Trade receivables 794,355 401,721 Payments in advance 800 6,405 Amount re-invoiced - 7,591 Intercompany receivable (Note 31.1) 1,859,469 949,929 Sundry debtors 331,105 403,127
2,985,728 1,768,774
Trade receivables The average credit period granted to customers is 30 days. No interest is charged on overdue receivables. The Company does not hold any collateral for trade receivables. Allowance for doubtful debts are recognised against trade receivables on a case by case basis, after specific review of individual customer balances. Where there are indications of impairment, allowances against doubtful debts are recognised against trade receivables based on estimated irrecoverable amounts determined by reference to past default experience of the counterparty and an analysis of the counterparty's current financial position. Trade receivables disclosed above include amounts (see below for aged analysis) that are past due at the end of the reporting period for which the Company has not recognised an allowance for doubtful debts because there has not been a significant change in credit quality and the amounts are still considered recoverable.
Age of trade receivables that are past due but not impaired: 2015 2014 N'000 N'000 31 -60 days 120,966
61 days & above 82,634
203,599 -
20 Cash and cash equivalent
Cash and bank balances 669,344 63,088 Bank overdrafts (1,514,634) (352,722)
(845,290) (289,634)
21 Share Capital
Authorised share capital
1,100,000,000 ordinary shares of 50kobo each 550,000 550,000
Issued and fully paid up capital
1,000,000,000 ordinary shares of 50kobo each 500,000 500,000

PRESCO PLC Financial statements
For the year ended 31 December 2015
32
NOTES TO THE FINANCIAL STATEMENTS 22 Defined benefit obligation 22.1 Defined contribution plans
The employees of the Company are members of a state-managed retirement benefit plan operated by the government of Nigeria. The Company is required to contribute a specified percentage of payroll costs to the retirement benefit scheme to fund the benefits. The only obligation of the Company with respect to the retirement benefit plan is to make the specified contributions.
The total expense recognised in the Company's statement of comprehensive income of N28.6 million (2014: N25 million) represents contributions payable to these plans by the Company at rates specified in the rules of the plans. As at 31 December 2015, contributions of N3.5 million (2014: N6.4 million) due in respect of the 2015 (2014) reporting period had not been paid over to the plans. The amounts were paid subsequent to the end of the reporting period.
22.2 Defined benefit plans
The company recognises provision for post-employment benefits for all its permanent employees in accordance with the statute. The provision is based on an actuarial calculation by an independent actuary using the "Projected Unit Credit Method". Post-employment benefit recognised by the company amounted to approximately NGN271 million as at 31 December 2015 (2014: NGN 235 million). The most recent actuarial valuations of the present value of the defined benefit obligation were carried out at 31 December 2015 by Alexander Forbes Consulting Actuaries Nigeria Ltd. The present value of the defined benefit obligation, and the related current service cost and past service cost, were measured using the Projected Unit Credit Method. Details at the end of December 2015 were: Gratuity Scheme NGN 52.50 million, Retirement Scheme NGN196.51 million and Long Service Awards NGN 22.48 million
2015 2014 N'000 N'000 As at 1st January 234,897 242,326
Current service costs 40,326 27,081 Interest costs 33,552 29,865 Payment during the year (14,831) (60,977)
As at 31st December 293,944 238,294
Premeasurements - OCI (22,463) (3,397)
271,481 234,897
Amounts recognised in statement of comprehensive income in respect of these defined benefit schemes are as follows:
2015 2014 N'000 N'000 Current service cost 40,326 27,081
Interest on obligation 33,552 29,865 Premeasurements - OCI (22,463) (3,397)
51,415
53,549
Of the expense for the year, N73.88 million (2014: N56.95 million) has been included in administrative expenses. Actuarial gains and losses have been reported in other comprehensive income.
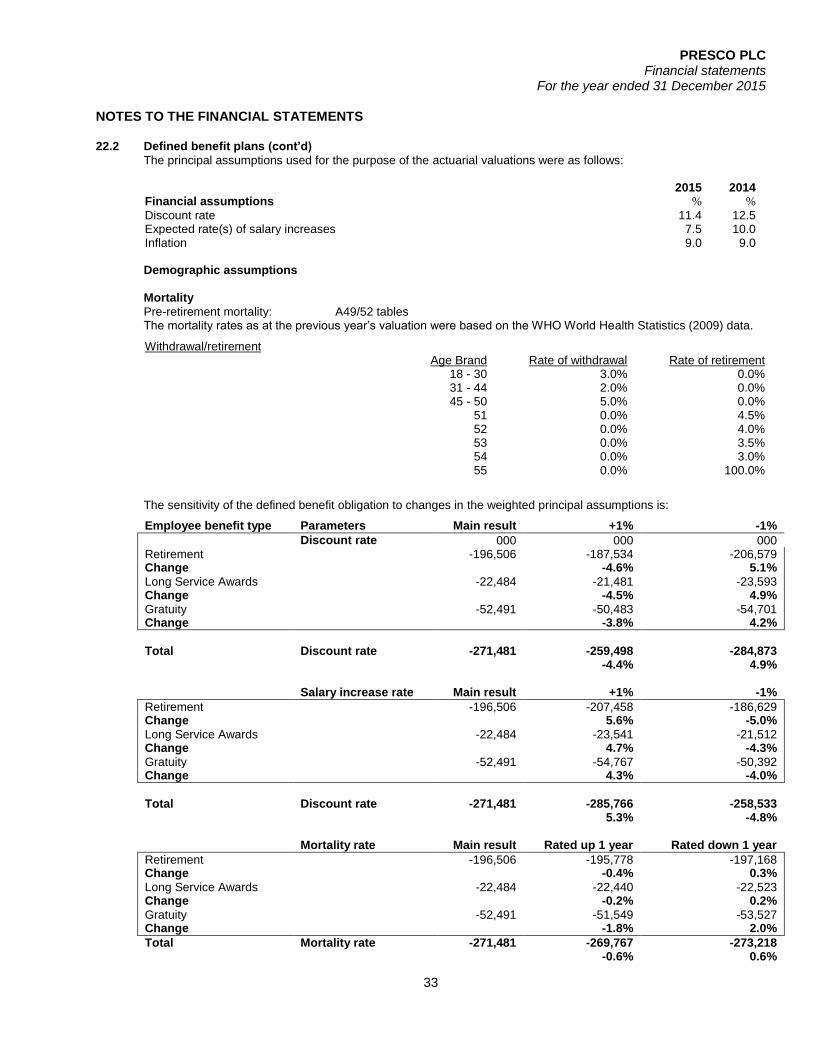
PRESCO PLC Financial statements
For the year ended 31 December 2015
33
NOTES TO THE FINANCIAL STATEMENTS 22.2 Defined benefit plans (cont’d)
The principal assumptions used for the purpose of the actuarial valuations were as follows:
2015 2014 Financial assumptions % %
Discount rate 11.4 12.5 Expected rate(s) of salary increases 7.5 10.0 Inflation 9.0 9.0
Demographic assumptions
Mortality
Pre-retirement mortality: A49/52 tables The mortality rates as at the previous year’s valuation were based on the WHO World Health Statistics (2009) data.
Withdrawal/retirement
Age Brand Rate of withdrawal Rate of retirement 18 - 30 3.0% 0.0% 31 - 44 2.0% 0.0% 45 - 50 5.0% 0.0% 51 0.0% 4.5% 52 0.0% 4.0% 53 0.0% 3.5% 54 0.0% 3.0% 55 0.0% 100.0%
The sensitivity of the defined benefit obligation to changes in the weighted principal assumptions is:
Employee benefit type Parameters Main result +1% -1%
Discount rate 000 000 000 Retirement -196,506 -187,534 -206,579
Change -4.6% 5.1% Long Service Awards -22,484 -21,481 -23,593 Change -4.5% 4.9% Gratuity -52,491 -50,483 -54,701 Change -3.8% 4.2%
Total Discount rate -271,481 -259,498 -284,873 -4.4% 4.9%
Salary increase rate Main result +1% -1%
Retirement -196,506 -207,458 -186,629 Change 5.6% -5.0% Long Service Awards -22,484 -23,541 -21,512 Change 4.7% -4.3% Gratuity -52,491 -54,767 -50,392 Change 4.3% -4.0%
Total Discount rate -271,481 -285,766 -258,533 5.3% -4.8%
Mortality rate Main result Rated up 1 year Rated down 1 year
Retirement -196,506 -195,778 -197,168 Change -0.4% 0.3% Long Service Awards -22,484 -22,440 -22,523 Change -0.2% 0.2% Gratuity -52,491 -51,549 -53,527 Change -1.8% 2.0%
Total Mortality rate -271,481 -269,767 -273,218 -0.6% 0.6%

PRESCO PLC Financial statements
For the year ended 31 December 2015
34
NOTES TO THE FINANCIAL STATEMENTS 22.2 Defined benefit plans (cont’d)
The above sensitivity analyses are based on a change in an assumption while holding all other assumptions constant. In practice, this is unlikely to occur, and changes in some of the assumptions may be correlated. When calculating the sensitivity of the defined benefit obligation to significant actuarial assumptions the same method (present value of the defined benefit obligation calculated with the projected unit credit method at the end of the reporting period) has been applied as when calculating the pension liability recognised within the statement of financial position. The methods and types of assumptions used in preparing the sensitivity analysis did not change compared to the previous period.
23 Borrowings 2015 2014 N'000 N'000 UBA CACS loan 1,793,194 - Fidelity Nistra loan 2,000,000 - IBTC PAIF loan 776,604 918,583 Intercompany loan- SIAT - 1,743,570
4,569,798 2,662,153
Included in the statement of financial position as:
Current 527,721 307,426 Non-current 4,042,077 2,354,727
4,569,798 2,662,153
UBA CACS loan: The Company obtained a 7% N2 billion loan under the CBN Commercial Agriculture Credit Scheme (CACS) in two tranches of N982 million and N1.018 billion in July 2015 and November 2015 respectively. The loan was facilitated by United Bank for Africa (UBA) for the purpose of financing the expansion program of the company in rubber planting. The loan has a tenor of 6 years inclusive of 9 months moratorium. Using imputed market interest rates of 14% for an equivalent loan of 9%, the fair value of the loan is estimated at N1.78billion. The difference of N220million between the gross proceeds and the fair value of the loan is the benefit derived from the below-market interest rate loan and is recognised as deferred revenue (see note 25).
Fidelity Nistra loan: This is a N2 billion loan granted to the Company in February 2015 by Fidelity Bank as an interest rate of 18% which was reviewed upward to 20% in July 2015. The loan which has a tenor of 5 years (inclusive of 18 months moratorium) was granted for the purpose of financing the establishment of 14,400 hectares rubber plantation at Upper Sakponba area of Benin City, Edo State. This is secured by a negative pledge, letter of comfort from the SIAT Group, Brussels and credit guarantee from NIRSAL. IBTC PAIF loan : In November 2013, the Company received a 7% N1.066 billion loan under the CBN =N=500b Power and Aviation Intervention Fund (PAIF) facilitated by Stanbic IBTC Bank for the purpose of financing the purchase of a 2.5MW steam turbine with a view to expanding the Company's power generating capacity. The loan has a tenor of 7 years inclusive of 12 months moratorium. Using imputed market interest rates of 14% for an equivalent loan of 7%, the fair value of the loan is estimated at N859million. The difference of N207million between the gross proceeds and the fair value of the loan is the benefit derived from the below-market interest rate loan and is recognised as deferred revenue (see note 25).
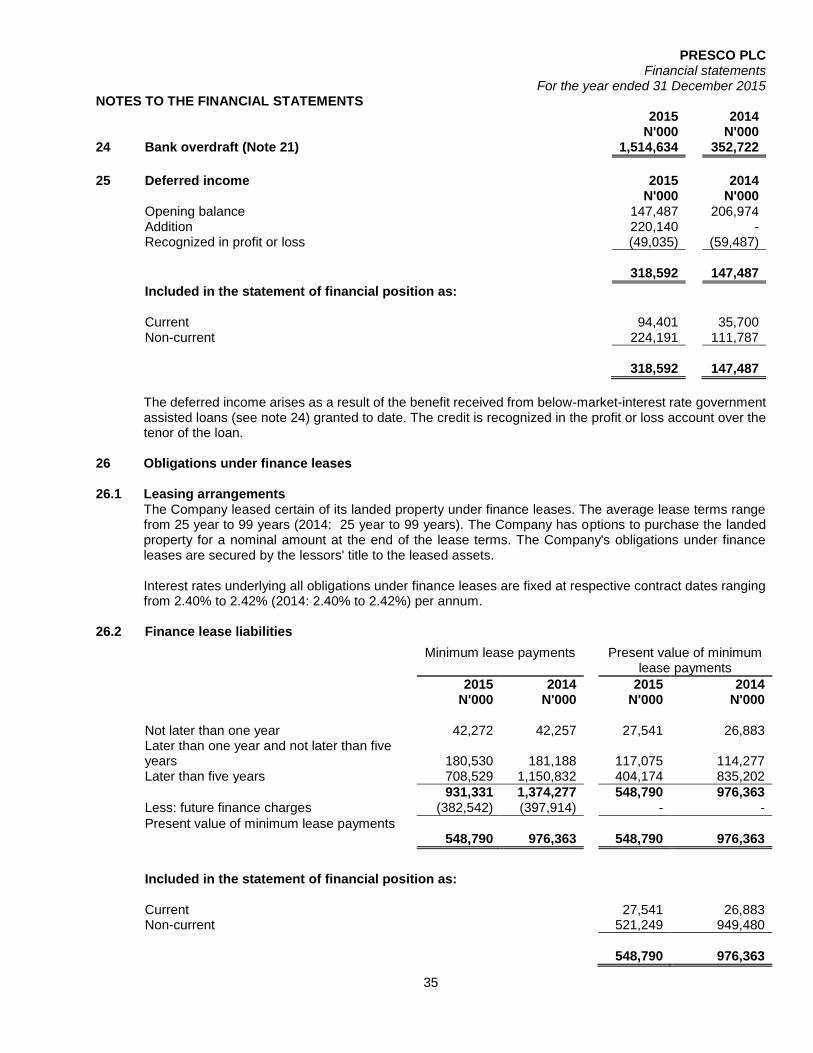
PRESCO PLC Financial statements
For the year ended 31 December 2015
35
NOTES TO THE FINANCIAL STATEMENTS 2015 2014 N'000 N'000 24 Bank overdraft (Note 21) 1,514,634 352,722
25 Deferred income 2015 2014 N'000 N'000 Opening balance 147,487 206,974 Addition 220,140 - Recognized in profit or loss (49,035) (59,487)
318,592 147,487
Included in the statement of financial position as:
Current 94,401 35,700 Non-current 224,191 111,787
318,592 147,487
The deferred income arises as a result of the benefit received from below-market-interest rate government assisted loans (see note 24) granted to date. The credit is recognized in the profit or loss account over the tenor of the loan.
26 Obligations under finance leases 26.1 Leasing arrangements
The Company leased certain of its landed property under finance leases. The average lease terms range from 25 year to 99 years (2014: 25 year to 99 years). The Company has options to purchase the landed property for a nominal amount at the end of the lease terms. The Company's obligations under finance leases are secured by the lessors' title to the leased assets.
Interest rates underlying all obligations under finance leases are fixed at respective contract dates ranging from 2.40% to 2.42% (2014: 2.40% to 2.42%) per annum.
26.2 Finance lease liabilities
Minimum lease payments Present value of minimum lease payments
2015 2014 2015 2014 N'000 N'000 N'000 N'000
Not later than one year 42,272 42,257 27,541 26,883 Later than one year and not later than five
years 180,530 181,188 117,075 114,277 Later than five years 708,529 1,150,832 404,174 835,202
931,331 1,374,277 548,790 976,363 Less: future finance charges (382,542) (397,914) - -
Present value of minimum lease payments 548,790 976,363 548,790 976,363
Included in the statement of financial position as:
Current 27,541 26,883 Non-current 521,249 949,480
548,790 976,363

PRESCO PLC Financial statements
For the year ended 31 December 2015
36
NOTES TO THE FINANCIAL STATEMENTS 27 Current Tax Liabilities 2015 2014 N'000 N'000 Opening balance 399,453 97,443 Charge for the year 892,657 394,996
1,292,110 492,439
Underprovision for the previous year 165 - Payment during the year (387,217) (92,986)
905,058 399,453
28 Deferred taxes
Balance as at 1 January (12,589,436) (10,276,677) Charge for the year (1,008,029) (2,312,759)
Balance at 31 December
(13,597,465) (12,589,436)
Opening balance
Movements Recognised
Closing balance
recognized directly in
in the year by equity
the company
N'000 N'000 N'000 N'000
12/31/2015
Deferred tax (liabilities)/assets in relation to:
Property, plant and equipment @ 30% 12,659,905 1,007,665 - 13,667,572 Property, plant and equipment @ 10% - - - - Loss - - - -
Provisions -
70,469 -
10,975 - (81,444) Exchange difference - 11,339 11,339
12,589,436 1,008,029 - 13,597,465
12/31/2014
Deferred tax (liabilities)/assets in relation to:
Property, plant and equipment @ 30% 10,349,375 2,310,530 12,659,905 Property, plant and equipment @ 10% - - - Loss - - - Provisions (72,698) 2,229 (70,469) Exchange difference - - -
10,276,677 2,312,759 - 12,589,436

PRESCO PLC Financial statements
For the year ended 31 December 2015
37
NOTES TO THE FINANCIAL STATEMENTS 28 Deferred taxes
The following is the analysis of deferred tax assets / (liabilities) presented in the statement of financial position.
2015 2014 N'000 N'000
Deferred tax assets - - Deferred tax liabilities (13,597,465) (12,589,436)
(13,597,465) (12,589,436)
The following are the major deferred tax liabilities recognised by the Company and movements thereon during the current and prior reporting period.
2015 2014 N'000 N'000
At 1 January (12,589,436) (10,276,677) Charge to profit or loss (1,001,290) (2,311,740) Charge to other comprehensive income (6,739) (1,019)
At 31 December
(13,597,465) (12,589,436)
Deferred tax assets and liabilities are offset where the Company has a legally enforceable right to do so.
There are no unrecognised deductible temporary differences, unused tax losses and unused tax credits for which no deferred tax assets have been recognised.
29 Trade and other payables 2015 2014 N'000 N'000 Trade payables 83,060 176,010 Accruals 79,471 46,779 Sundry creditors 883,683 562,734 Intercompany payables (Note 33.1) 2,310,493 2,611,502
3,356,707 3,397,025
The average credit period on purchases is 30 days. No interest is charged on trade payables. The Company has financial risk management policies in place to ensure that all payables are paid within a reasonable time of the credit time frame.
30 Earnings per share from continuing operations 2015 2014 N'000 N'000 Net profit attributable to equity holders of the Company 2,320,794 5,194,043 Effect of dilutive potential ordinary shares: - -
Earnings from continuing operations for the purpose of diluted earnings per share excluding discontinued operations 2,320,794 5,194,043
The denominators used are the same as those detailed above for both basic and diluted earnings per share from continuing and discontinued operations.
N'000 N'000 Weighted average number of shares ('000) 1,000,000 1,000,000
Basic (Naira) 2.32 5.19
Diluted (Naira) 2.32 5.19

PRESCO PLC Financial statements
For the year ended 31 December 2015
38
NOTES TO THE FINANCIAL STATEMENTS 31 Related party transactions
Details of transactions and outstanding balances between the company and its related parties during the year are disclosed below:
31.1 Trading transactions The company entered into transactions with its related parties during the year:
Sales of goods and services
Purchases of goods and services
2015 2014 2015 2014 N'000 N'000 N'000 N'000 SIAT Nigeria Limited 262,987 - 216,053 -
SIAT SA - - 2,897,263 -
The following balances were outstanding at the end of the reporting period:
Due from related parties Due to related parties
2015 2014 2015 2014 N'000 N'000 N'000 N'000 SIAT Nigeria Limited 663,766 - 217,440 -
SIAT SA 1,188,315 - 2,093,053 - SIAT Gabon 2,430 - - - GOPDC (Ghana) 4,683 - - -
1,859,194 - 2,310,493 -
Sales and purchases of goods and services were done at prevailing market prices. The outstanding balances are unsecured and will settled in cash. No guarantee has been given or received. No expense has been recognised in the current or prior year for bad debts in respect of amounts owed by related parties.
31.2 Loans to related parties 2015 2014 N'000 N'000 Loans to key management personnel - -
Others - -
The Company did not provide loans to its key management personnel at rates comparable to the average commercial interest rate during the year. Loans to key management personnel are unsecured.
31.3 Loans from related parties 2015 2014 N'000 N'000 sa Siat nv, Belgium - 1,743,570
The Company was provided loans at rates comparable to the average commercial interest rate in the prior year. The loans from the ultimate controlling company were unsecured and was repaid during the current year.

PRESCO PLC Financial statements
For the year ended 31 December 2015
39
NOTES TO THE FINANCIAL STATEMENTS 31.4 Details of related companies a sa Siat nv, Belgium
Presco Plc is a subsidiary of sa Siat nv, Belgium, with 60% holding. The company had significant transactions of N2.2 billion during the year. There was a closing balance of N1.74 million in favour of sa Siat nv during the year.
. b Ghana oil Palm Development Company Limited
Ghana oil Palm Development Company Limited is a related company to Presco Plc. During the year, the company had no significant transactions. Sa SIAT nv, Belgium (the parent company of Presco) is also the parent company of Ghana oil Palm Development Company limited.
c Siat Gabon Siat Gabon is a related company of Presco Plc. There was no material transactions between the two companies during the year. Sa SIAT nv, Belgium (the parent company of Presco) is also the parent company Siat Gabon
d Compagnie Heveicole de Cavally, Ivory Coast
Compagnie Heveicole de Cavally, Ivory Coast is a related company to Presco Plc. There was no transactions between the companies during the year. Sa SIAT nv, Belgium (the parent company of Presco) is also the parent company Compagnie Heveicole de Cavally.
e Siat Nigeria Limited
Siat Nigeria Limited is a related company of Presco Plc. There was no material transactions between the two companies during the year. Sa SIAT nv, Belgium (the parent company of Presco) is also the parent company Siat Nigeria Limited.
31.5 Compensation of key management personnel
The remuneration of key management personnel was as follows:
2015 2014 N'000 N'000 Short-term benefits 6,145 3,084
Post-employment benefits - - Other long term benefits - - Termination benefits - -
6,145 3,084
The remuneration of key management personnel is determined by remuneration committee having regard to the performance of individuals and market trends.
32 Directors 2015 2014
N'000 N'000
Directors' remuneration and fees 16,287 6,389 Others 9,897 900
26,184 7,289
Fees and other emoluments disclosed above include amount paid to:
Chairman 1,100 1,000 Other directors 25,084 6,289
26,184 7,289
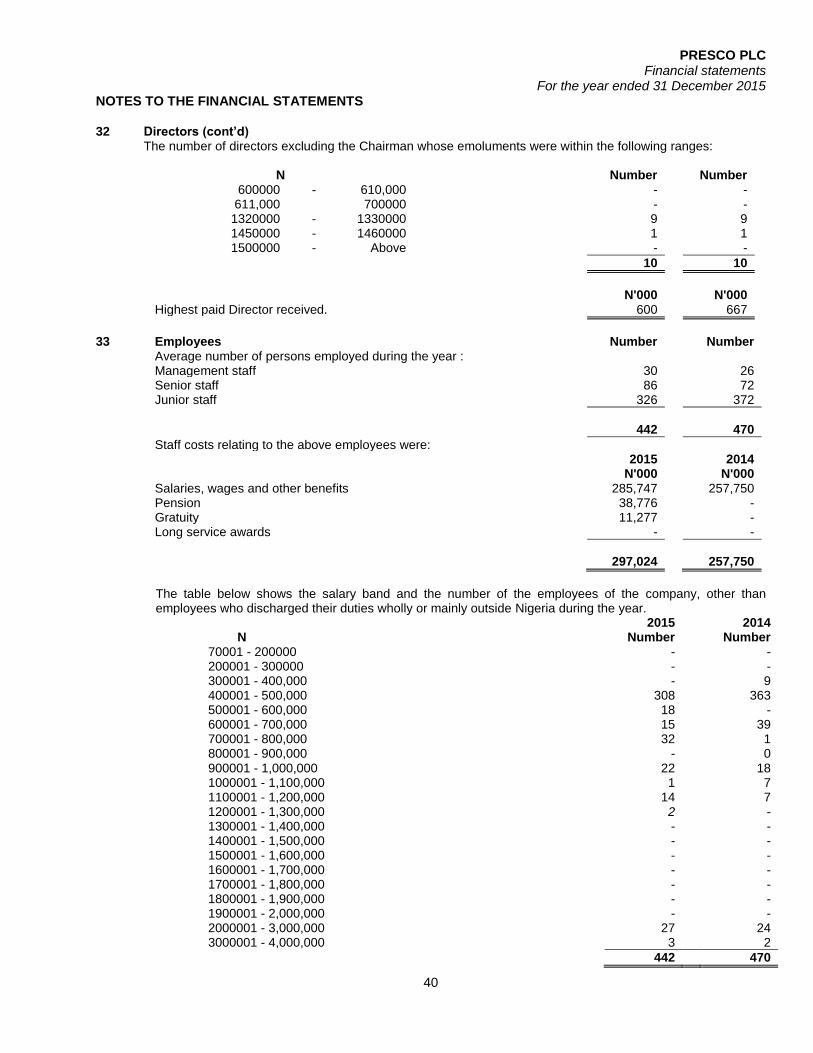
PRESCO PLC Financial statements
For the year ended 31 December 2015
40
NOTES TO THE FINANCIAL STATEMENTS 32 Directors (cont’d)
The number of directors excluding the Chairman whose emoluments were within the following ranges:
N Number Number 600000 - 610,000 - -
611,000 700000 - - 1320000 - 1330000 9 9
1450000 - 1460000 1 1 1500000 - Above - -
10 10
N'000 N'000 Highest paid Director received. 600 667
33 Employees Number Number Average number of persons employed during the year :
Management staff 30 26 Senior staff 86 72 Junior staff 326 372
442 470
Staff costs relating to the above employees were: 2015 2014 N'000 N'000 Salaries, wages and other benefits 285,747 257,750 Pension 38,776 - Gratuity 11,277 - Long service awards - -
297,024 257,750
The table below shows the salary band and the number of the employees of the company, other than employees who discharged their duties wholly or mainly outside Nigeria during the year.
2015 2014 N Number Number 70001 - 200000 - - 200001 - 300000 - - 300001 - 400,000 - 9 400001 - 500,000 308 363 500001 - 600,000 18 - 600001 - 700,000 15 39 700001 - 800,000 32 1 800001 - 900,000 - 0 900001 - 1,000,000 22 18 1000001 - 1,100,000 1 7 1100001 - 1,200,000 14 7 1200001 - 1,300,000 2 - 1300001 - 1,400,000 - - 1400001 - 1,500,000 - - 1500001 - 1,600,000 - - 1600001 - 1,700,000 - - 1700001 - 1,800,000 - - 1800001 - 1,900,000 - - 1900001 - 2,000,000 - - 2000001 - 3,000,000 27 24 3000001 - 4,000,000 3 2
442 470
PRESCO PLC Financial statements
For the year ended 31 December 2015
41
NOTES TO THE FINANCIAL STATEMENTS 34 Contingent Liabilities
The company is the defendant in various law suits arising from normal course of business. There were contingent liabilities as at 31 December 2015 in respect of pending litigation estimated at N 2.092billion. The Directors are of the opinion that it is most likely that this will not result to any significant liability on the Company.
A total of N361 million relating to management fees to be paid to the parent company (SIAT BV) has not been recognised in the books of Presco Plc. as the National Office of Technology Acquisition and Promotion (NOTAP) approval which is statutorily required for such fees to become payable is pending as at year end. The fees will become a liability and will be recognised as such in the books upon approval by NOTAP.
35 Capital Commitments
Capital expenditure authorized by the Board, but not provided for in the accounts was nil (2014: Nil). 36 Events after the reporting period
There were no events after the reporting period could have had a material effect on the financial statements of the Company that have not been provided for or disclosed in the financial statements.
37 Dividend Proposed By a written resolution of the Directors of Presco Plc. dated March 31, 2016 it was resolved that a dividend of 100kobo per share amounting to N1 billion (2014: N1billion) be recommended for declaration by the members of the company at the next general meeting of the company.
38 Restatement of some comparative Figures
Some comparative figures have been restated to reflect a more meaningful comparison due to changes in format to comply with statutory requirements.

PRESCO PLC Financial statements
For the year ended 31 December 2015
42
OTHER NATIONAL DISCLOSURES
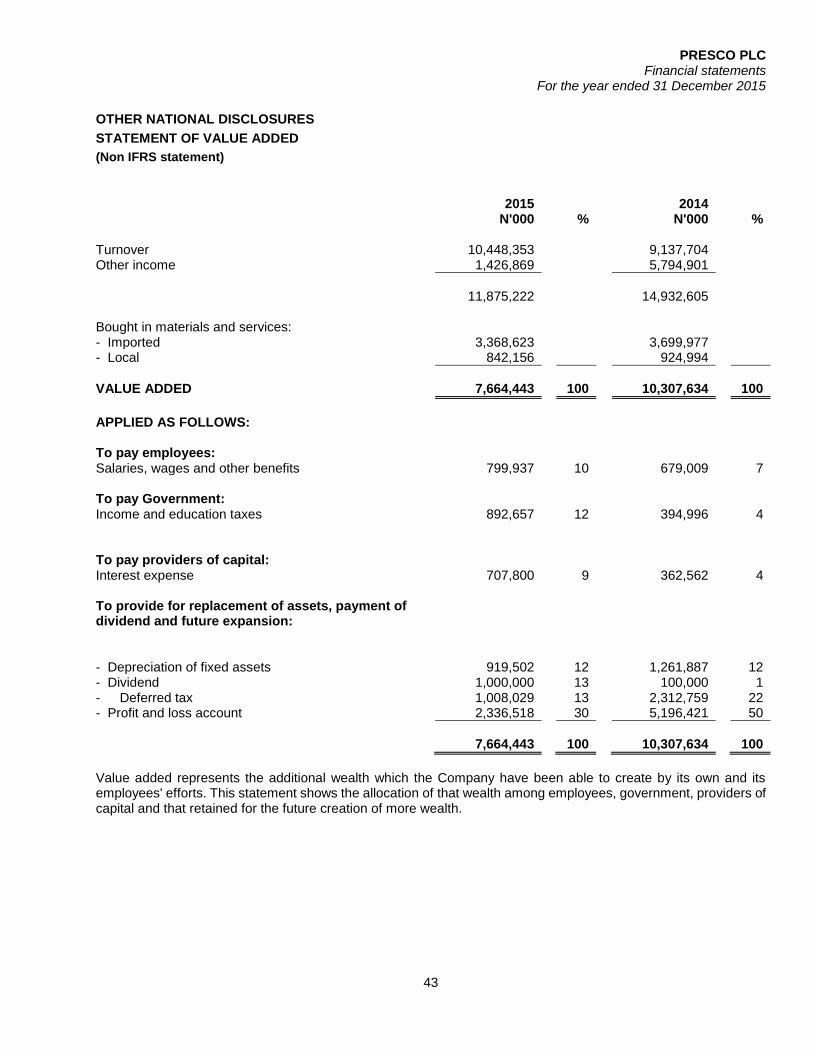
PRESCO PLC Financial statements
For the year ended 31 December 2015
43
OTHER NATIONAL DISCLOSURES
STATEMENT OF VALUE ADDED
(Non IFRS statement)
2015 2014 N'000 % N'000 %
Turnover 10,448,353 9,137,704 Other income 1,426,869 5,794,901
11,875,222 14,932,605 Bought in materials and services: - Imported 3,368,623 3,699,977 - Local 842,156 924,994
VALUE ADDED 7,664,443 100 10,307,634 100
APPLIED AS FOLLOWS: To pay employees: Salaries, wages and other benefits 799,937 10 679,009 7 To pay Government: Income and education taxes 892,657 12 394,996 4 To pay providers of capital: Interest expense 707,800 9 362,562 4 To provide for replacement of assets, payment of dividend and future expansion:
- Depreciation of fixed assets 919,502 12 1,261,887 12 - Dividend 1,000,000 13 100,000 1 - Deferred tax 1,008,029 13 2,312,759 22 - Profit and loss account 2,336,518 30 5,196,421 50
7,664,443 100 10,307,634 100
Value added represents the additional wealth which the Company have been able to create by its own and its employees' efforts. This statement shows the allocation of that wealth among employees, government, providers of capital and that retained for the future creation of more wealth.
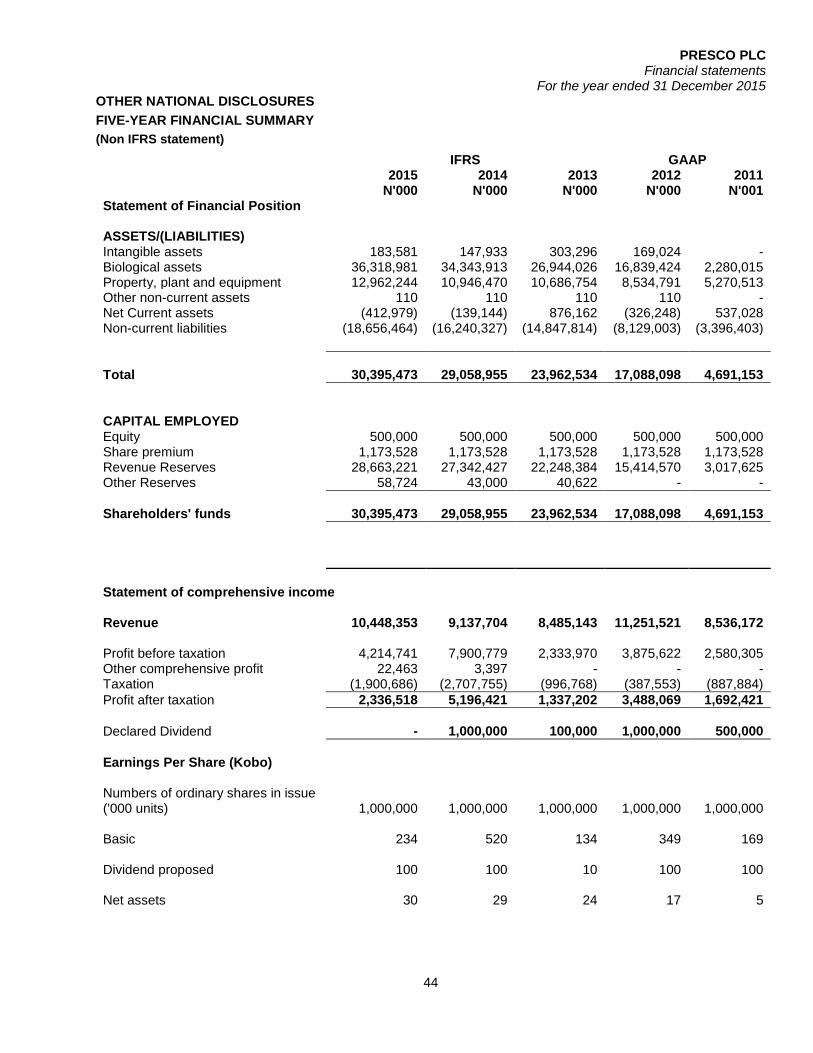
PRESCO PLC Financial statements
For the year ended 31 December 2015
44
OTHER NATIONAL DISCLOSURES
FIVE-YEAR FINANCIAL SUMMARY
(Non IFRS statement)
IFRS GAAP 2015 2014 2013 2012 2011
N'000 N'000 N'000 N'000 N'001
Statement of Financial Position
ASSETS/(LIABILITIES)
Intangible assets 183,581 147,933 303,296 169,024 - Biological assets 36,318,981 34,343,913 26,944,026 16,839,424 2,280,015 Property, plant and equipment 12,962,244 10,946,470 10,686,754 8,534,791 5,270,513 Other non-current assets 110 110 110 110 - Net Current assets (412,979) (139,144) 876,162 (326,248) 537,028 Non-current liabilities (18,656,464) (16,240,327) (14,847,814) (8,129,003) (3,396,403)
Total
30,395,473 29,058,955 23,962,534 17,088,098 4,691,153
CAPITAL EMPLOYED
Equity 500,000 500,000 500,000 500,000 500,000 Share premium 1,173,528 1,173,528 1,173,528 1,173,528 1,173,528 Revenue Reserves 28,663,221 27,342,427 22,248,384 15,414,570 3,017,625 Other Reserves 58,724 43,000 40,622 - -
Shareholders' funds
30,395,473 29,058,955 23,962,534 17,088,098 4,691,153
Statement of comprehensive income
Revenue 10,448,353 9,137,704 8,485,143 11,251,521 8,536,172
Profit before taxation 4,214,741 7,900,779 2,333,970 3,875,622 2,580,305 Other comprehensive profit 22,463 3,397 - - - Taxation (1,900,686) (2,707,755) (996,768) (387,553) (887,884)
Profit after taxation 2,336,518 5,196,421 1,337,202 3,488,069 1,692,421
Declared Dividend - 1,000,000 100,000 1,000,000 500,000
Earnings Per Share (Kobo)
Numbers of ordinary shares in issue ('000 units) 1,000,000 1,000,000 1,000,000 1,000,000 1,000,000
Basic 234 520 134 349 169
Dividend proposed 100 100 10 100 100
Net assets 30 29 24 17 5