present and projected degree days in china from ... · under different representative concentration...
TRANSCRIPT

Present and projected degree days in China from observation,reanalysis and simulations
Qinglong You • Klaus Fraedrich • Frank Sielmann •
Jinzhong Min • Shichang Kang • Zhenming Ji •
Xiuhua Zhu • Guoyu Ren
Received: 23 August 2013 / Accepted: 30 September 2013 / Published online: 8 October 2013
� Springer-Verlag Berlin Heidelberg 2013
Abstract Degree days are usually defined as the accu-
mulated daily mean temperature varying with the base
temperature, and are one of the most important indicators
of climate changes. In this study, the present-day and
projected changes of four degree days indices from daily
mean surface air temperature output simulated by Max
Planck Institute, Earth Systems Model of low resolution
(MPI-ESM-LR) model are evaluated with the high reso-
lution gridded-observation dataset and two modern rea-
nalyses in China. During 1979–2005, the heating degree
days (HDD) and the numbers of HDD (NHDD) have
decreased for observation, reanalyses (ERA-Interim and
NCEP/NCAR) and model simulations (historical and dec-
adal experiments), consistent with the increasing cooling
degree days (CDD) and the numbers of CDD (NCDD).
These changes reflect the general warming in China during
the past decades. In most cases, ERA-Interim is closer to
observation than NCEP/NCAR and model simulations.
There are discrepancies between observation, reanalyses
and model simulations in the spatial patterns and regional
means. The decadal hindcast/forecast simulation perfor-
mance of MPI-ESM-LR produce warmer than the observed
mean temperature in China during the entire period, and
the hindcasts forecast a trend lower than the observed.
Under different representative concentration pathway
(RCP) emissions scenarios, HDD and NHDD show sig-
nificant decreases, and CDD and NCDD consistently
increase during 2006–2100 under RCP8.5, RCP4.5 and
RCP2.6, especially before the mid-21 century. More pro-
nounced changes occur under RCP8.5, which is associated
with a high rate of radiative forcing. The 20th century runs
reflect the sensitivity to the initial conditions, and the
uncertainties in terms of the inter-ensemble are small,
whereas the long-term trend is well represented with no
differences among ensembles.
Keywords Degree days � MPI-ESM-LR �NCEP/NCAR and ERA-Interim � China
1 Introduction
According to the Intergovernmental Panel on Climate
Change (IPCC) Fourth Assessment Report (AR 4), the
global average surface air temperature has risen by
0.74 ± 0.18 �C during 1906–2005, and most of the
observed increase in globally averaged temperature since
the mid-20th century is very likely due to the observed
increase in anthropogenic greenhouse gas concentrations
(IPCC 2007). However, trends of temperature always
Q. You (&) � J. Min
Key Laboratory of Meteorological Disaster, Ministry of
Education, Nanjing University of Information Science and
Technology, Nanjing 210044, China
e-mail: [email protected]
Q. You � K. Fraedrich � F. Sielmann � X. Zhu
Max Plank Institute for Meteorology, KlimaCampus,
20144 Hamburg, Germany
S. Kang
State Key Laboratory of Cryospheric Science, Chinese Academy
of Sciences (CAS), Lanzhou 730000, China
S. Kang � Z. Ji
Laboratory of Tibetan Environment Changes and Land Surface
Processes, Institute of Tibetan Plateau Research, Chinese
Academy of Sciences (CAS), Beijing 100085, China
G. Ren
Laboratory for Climate Studies, National Climate Center, China
Meteorological Administration (CMA), Beijing 100081, China
123
Clim Dyn (2014) 43:1449–1462
DOI 10.1007/s00382-013-1960-0
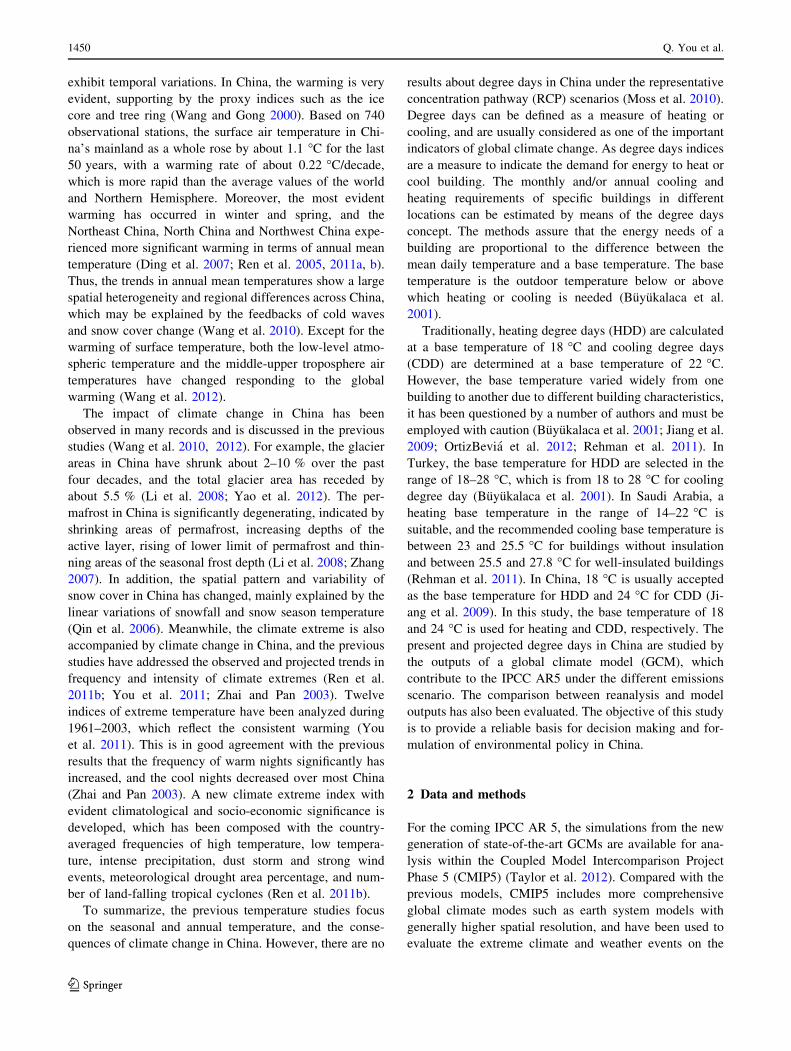
exhibit temporal variations. In China, the warming is very
evident, supporting by the proxy indices such as the ice
core and tree ring (Wang and Gong 2000). Based on 740
observational stations, the surface air temperature in Chi-
na’s mainland as a whole rose by about 1.1 �C for the last
50 years, with a warming rate of about 0.22 �C/decade,
which is more rapid than the average values of the world
and Northern Hemisphere. Moreover, the most evident
warming has occurred in winter and spring, and the
Northeast China, North China and Northwest China expe-
rienced more significant warming in terms of annual mean
temperature (Ding et al. 2007; Ren et al. 2005, 2011a, b).
Thus, the trends in annual mean temperatures show a large
spatial heterogeneity and regional differences across China,
which may be explained by the feedbacks of cold waves
and snow cover change (Wang et al. 2010). Except for the
warming of surface temperature, both the low-level atmo-
spheric temperature and the middle-upper troposphere air
temperatures have changed responding to the global
warming (Wang et al. 2012).
The impact of climate change in China has been
observed in many records and is discussed in the previous
studies (Wang et al. 2010, 2012). For example, the glacier
areas in China have shrunk about 2–10 % over the past
four decades, and the total glacier area has receded by
about 5.5 % (Li et al. 2008; Yao et al. 2012). The per-
mafrost in China is significantly degenerating, indicated by
shrinking areas of permafrost, increasing depths of the
active layer, rising of lower limit of permafrost and thin-
ning areas of the seasonal frost depth (Li et al. 2008; Zhang
2007). In addition, the spatial pattern and variability of
snow cover in China has changed, mainly explained by the
linear variations of snowfall and snow season temperature
(Qin et al. 2006). Meanwhile, the climate extreme is also
accompanied by climate change in China, and the previous
studies have addressed the observed and projected trends in
frequency and intensity of climate extremes (Ren et al.
2011b; You et al. 2011; Zhai and Pan 2003). Twelve
indices of extreme temperature have been analyzed during
1961–2003, which reflect the consistent warming (You
et al. 2011). This is in good agreement with the previous
results that the frequency of warm nights significantly has
increased, and the cool nights decreased over most China
(Zhai and Pan 2003). A new climate extreme index with
evident climatological and socio-economic significance is
developed, which has been composed with the country-
averaged frequencies of high temperature, low tempera-
ture, intense precipitation, dust storm and strong wind
events, meteorological drought area percentage, and num-
ber of land-falling tropical cyclones (Ren et al. 2011b).
To summarize, the previous temperature studies focus
on the seasonal and annual temperature, and the conse-
quences of climate change in China. However, there are no
results about degree days in China under the representative
concentration pathway (RCP) scenarios (Moss et al. 2010).
Degree days can be defined as a measure of heating or
cooling, and are usually considered as one of the important
indicators of global climate change. As degree days indices
are a measure to indicate the demand for energy to heat or
cool building. The monthly and/or annual cooling and
heating requirements of specific buildings in different
locations can be estimated by means of the degree days
concept. The methods assure that the energy needs of a
building are proportional to the difference between the
mean daily temperature and a base temperature. The base
temperature is the outdoor temperature below or above
which heating or cooling is needed (Buyukalaca et al.
2001).
Traditionally, heating degree days (HDD) are calculated
at a base temperature of 18 �C and cooling degree days
(CDD) are determined at a base temperature of 22 �C.
However, the base temperature varied widely from one
building to another due to different building characteristics,
it has been questioned by a number of authors and must be
employed with caution (Buyukalaca et al. 2001; Jiang et al.
2009; OrtizBevia et al. 2012; Rehman et al. 2011). In
Turkey, the base temperature for HDD are selected in the
range of 18–28 �C, which is from 18 to 28 �C for cooling
degree day (Buyukalaca et al. 2001). In Saudi Arabia, a
heating base temperature in the range of 14–22 �C is
suitable, and the recommended cooling base temperature is
between 23 and 25.5 �C for buildings without insulation
and between 25.5 and 27.8 �C for well-insulated buildings
(Rehman et al. 2011). In China, 18 �C is usually accepted
as the base temperature for HDD and 24 �C for CDD (Ji-
ang et al. 2009). In this study, the base temperature of 18
and 24 �C is used for heating and CDD, respectively. The
present and projected degree days in China are studied by
the outputs of a global climate model (GCM), which
contribute to the IPCC AR5 under the different emissions
scenario. The comparison between reanalysis and model
outputs has also been evaluated. The objective of this study
is to provide a reliable basis for decision making and for-
mulation of environmental policy in China.
2 Data and methods
For the coming IPCC AR 5, the simulations from the new
generation of state-of-the-art GCMs are available for ana-
lysis within the Coupled Model Intercomparison Project
Phase 5 (CMIP5) (Taylor et al. 2012). Compared with the
previous models, CMIP5 includes more comprehensive
global climate modes such as earth system models with
generally higher spatial resolution, and have been used to
evaluate the extreme climate and weather events on the
1450 Q. You et al.
123
global scales (Sillmann et al. 2013a, b). The model used in
this study is the latest version of Max Planck Institute for
Meteorology (MPI-M), Earth Systems Model (MPI-ESM),
Hamburg, Germany, performed with the version of MPI-
ESM coupled model of low resolution (MPI-ESM-LR). The
model outputs by MPI-ESM-LR have been organized by the
Program for Climate Model Diagnosis and Intercomparison
(PCMDI) for the IPCC AR 5. The historical, decadal and
long-term experiments simulations are selected in this
study. The historical experiments are aimed at reproducing
the climate evolution of the twentieth century as accurately
as possible, by considering all major natural and anthro-
pogenic forcing, such as changes in atmospheric green-
house gases, aerosol loadings, solar output and land use
(Wild et al. 2013). Most historical experiments start around
1860 and end around 2005. The decadal experiments will be
possible to assess the skill of the forecast system in pre-
dicting climate statistics for times when the initial climate
state may exert some detectable influences, which is a set of
10-year hindcasts initialized from observed climate states
near the years 1960, 1965, and every 5 years to 2005
(Taylor et al. 2012). The long-term experiments are forced
by observed atmospheric composition changes (reflecting
both anthropogenic and natural sources) and include time-
evolving land cover. The long-term experiments have three
future projection simulations forced with specified con-
centrations, consistent with a high emissions scenario
(RCP8.5), a midrange mitigation emissions scenario
(RCP4.5), and a low emissions scenario (RCP2.6) (Taylor
et al. 2012). The CMIP5 projections of climate change are
driven by concentration or emission scenarios consistent
with the RCPs (Moss et al. 2010). In contrast to the sce-
narios described in the IPCC ‘‘Special Report on Emissions
Scenarios’’ (SRES) used for CMIP3, which did not include
policy intervention, the RCPs are mitigation scenarios that
assume policy actions will be taken to achieve certain
emission targets (Taylor et al. 2012). For example, RCP8.5
emission scenarios mean that radiative forcing increases
throughout the 21st century before reaching a level of about
8.5 W m-2 at the end of the century.
In addition to the CMIP5 models, daily mean surface
temperatures estimated from NCEP/NCAR and ERA-
Interim reanalysis are selected. NCEP/NCAR reanalysis is
provided by the National Oceanic and Atmospheric
Administration (NOAA)/Earth System Research Labora-
tory (ESRL)/Physical Sciences Division (PSD), Boulder,
Colorado, USA, from their website at http://www.cdc.noaa.
gov/. The datasets cover January 1948 to the present with a
spatial resolution of 2.5� 9 2.5� (Kalnay et al. 1996), and
are initialized with a wide variety of weather observations,
including ships, planes and satellite. The ERA-Interim
reanalysis data are obtained from the European Centre for
Medium-Range Weather Forecasts (ECMWF) website
(http://www.ecmwf.int/), available from January 1979 to
the present with a spatial resolution of 1.5� 9 1.5� (Dee
et al. 2011). It includes a large variety of 3-h surface
parameters, describing weather as well as ocean-wave and
land-surface conditions, and 6-h upper-air parameters
covering the troposphere and stratosphere (Dee et al.
2011). Compared with ERA-40 (Uppala et al. 2005), ERA-
Interim has been improved on the representation of the
hydrological cycles, the quality of the stratospheric, and the
consistency in time of reanalyzed geophysical fields.
For the purpose of reanalyses (NCEP/NCAR and ERA-
Interim) and MPI-ESM-LR climate model validation (his-
tory and decadal experiments), we use the 0.5� 9 0.5�daily temperature datasets in China for the period of
1979–2005 (Xu et al. 2009). The dataset is primarily
developed for the validation of climate models, and has
potential applications in the studies such as climate,
hydrology and ecology.
Four indices of degree days are used and detailed
descriptions are provided in Table 1. The HDD, the numbers
of HDD (NHDD), the CDD and the numbers of CDD (NCDD)
are based on the daily mean temperatures from multi-datasets.
In order to validate the indices from model simulations and
reanalyses, they are compared with observations during
1979–2005. After that, indices from the long-term experi-
ments under RCP8.5, RCP4.5 and RCP2.6 are analyzed from
2006 to 2100. Due to different resolutions between CMIP5
output, reanalyses and observations, all the indices are inter-
polated into a common 144 9 73 grid (2.5� 9 2.5�) using the
bilinear interpolation procedure implemented in the Climate
Data Operators (http://code.zmaw.de/projects/cdo). To pro-
duce the values for the whole China, there are 190 grid points
covering the entire region (Fig. 1).
The Mann–Kendall test for a trend and Sen’s slope
estimates are used to detect trends in degree days indices
series (Sen 1968). A trend is considered to be statistically
significant if it is significant at the 5 % level. Three sta-
tistical metrics are used to quantify the accuracy of the
reanalysis and simulations: Relative bias (RB), root-mean-
square error (RMSE) and correlation coefficient (R).
Table 1 Definitions of four degree days indices used in this study
Index Descriptive name Definition Units
HDD Heating degree day Sum of absolute TG where
TG \ 18 �C
�C
CDD Cooling degree day Sum of TG where
TG [ 18 �C
�C
NHDD Number of heating
degree day
Account number of days
where TG \ 24 �C
day
NCDD Number of cooling
degree day
Account number of days
where TG [ 24 �C
day
TG is daily mean temperature
Present and projected degree days in China 1451
123
3 Results: past and future changes of degree days
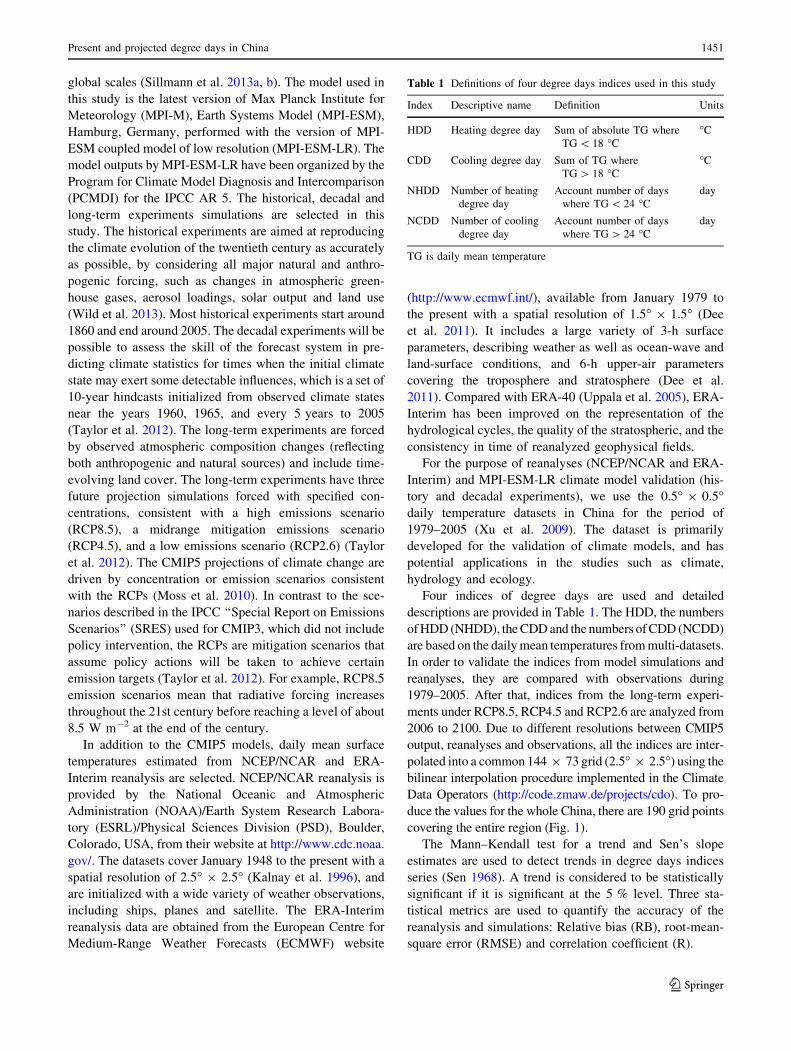
Figure 2 shows the regional changes of HDD, CDD,
NHDD and NCDD from observation, two reanalyses and
two experiments simulations in China on the annual basis
during 1979–2005. The spatial patterns of trends for HDD,
CDD, NHDD and NCDD from multi-datasets in China
during 1979–2005 are shown in Figs. 3, 4 and 5, respec-
tively. The seasonal and annual trends of each series of
indices calculated by Mann–Kendall slope estimator (Sen
1968) are summarized in Table 2. The correlation coeffi-
cients between multi-datasets are listed in Table 3.
Fig. 1 Topography of China and the distribution of 190 grid points used in this study
Fig. 2 Anomalies of HDD,
CDD, NHDD and NCDD from
observation, ERA-Interim,
NCEP/NCAR reanalysis data,
the historical and decadal
experiments simulation outputs
in China during 1979–2005
1452 Q. You et al.
123

3.1 Heating degree days (HDD)
It can be seen from Fig. 2 that the HDD from multi-datasets
has decreased during the studied period. The decreasing
rates are -130.97, -82.48, -80.52, -65.45 and
-69.48 �C/decade for observation, ERA-Interim, NCEP/
NCAR, the decadal experiments and historical experiments,
respectively. The HDD from both ERA-Interim and NCEP/
NCAR reanalyses is closer to observation than the decadal
experiment than the historical experiments, indicated by the
high correlation coefficients (R [ 0.9). There are some
differences of the season with the largest trend magnitudes.
The largest decreasing trends for observation, ERA-Interim
and NCEP/NCAR occur in the transition season of spring
and autumn, respectively, while both the decadal experi-
ments and historical experiments reveal largest decreasing
trends in winter. Overall, the multi-datasets show large
decreasing trend magnitudes in the high terrain (such as the
Tibetan Plateau) and in high latitude regions (such as the
northeastern China), with the exception of the historical
experiments. Due to the lower altitudes and latitudes,
southeastern China has smallest decreasing trends for all the
used datasets. It should be noted that the historical experi-
ments show greatest increases in the northern China, which
is not consistent with the observed global warming in the
region (Liu et al. 2004).
3.2 Cooling degree days (CDD)
In contrast to HDD, the decreasing trends of CDD are
significant for all datasets during 1979–2005, and the
observed trend magnitude is 76.91 �C/decade on the annual
basis. The correlation coefficients between observation,
reanalyses and simulations are higher (R [ 0.45), and
reanalyses are very well captured than the simulations. In
most cases, the pronounced increases occur in spring and
autumn. For the spatial patterns, the southeastern China
have larger increasing trends and the Tibetan Plateau have
Fig. 3 Spatial trends of HDD, NHDD, CDD and NCDD from observation in China during 1979–2005. The unit is �C/decade for HDD and
CDD, and is day/decade for NHDD and NCDD, respectively
Present and projected degree days in China 1453
123

the smaller increases, and the differences between reanal-
yses and model simulations exist in the northeastern TP.
3.3 Number of degree days (NHDD and NCDD)
For NHDD and NCDD, the decreased NHDD and
increased NCDD are clear during 1979–2005 for
observation, reanalyses and model simulations. Compared
with observation, ERA-Interim data reproduce the vari-
abilities of NHDD and NCDD better than NCEP/NCAR, as
reflected by the mean anomalies and correlation coeffi-
cients. NCEP/NCAR overestimate NHDD and underesti-
mate NCDD, due to the data assimilation in the model
system (Ma et al. 2008). On the annual basis, the
Fig. 4 Spatial trends of HDD
from ERA-Interim, NCEP/
NCAR reanalysis data and the
historical and decadal
experiments simulation outputs
in China during 1979–2005. The
unit is �C/decade
Fig. 5 Same as Fig. 4, but for
CDD
1454 Q. You et al.
123

decreasing trends of NHDD for observation, ERA-Interim,
NCEP/NCAR, the historical and decadal experiments are
-3.84, -2.99, -3.22, -2.66 and -2.80 day/decade,
respectively, which are mostly contributed by winter.
Meanwhile, the increased annual trends of NHDD for
observation, ERA-Interim, NCEP/NCAR, the historical
and decadal experiments are 2.83, 2.76, 2.47, 2.73 and
2.01 day/decade, respectively, which are slightly larger
than NHDD with the exception of the historical experi-
ments. For the spatial patterns of NHDD, the multi-datasets
reveal the negative trends in the western China, and posi-
tive trends in the southern China. The differences between
ERA-Interim and NCEP/NCAR are found in the Tibetan
Plateau, where the pronounced upward trends occur in
NCEP/NCAR and slight downward trends for ERA-
Interim. In most regions, both the historical and decadal
experiments show similar spatial patterns of trends, while
they differ for ERA-Interim and NCEP/NCAR in the
northeastern China. For the spatial trends of NCDD, the
multi-datasets show slight increases in the southern China,
and larger increases in the northeastern China. The
differences between ERA-Interim and NCEP/NCAR occur
in the Tibetan Plateau, similar to NHDD, and both rea-
nalyses depict pronounced positive trends in the north-
eastern China. Both the historical and decadal experiments
of NCDD show consistencies, which differ from renalyses
in the northeastern China.
3.4 Future changes
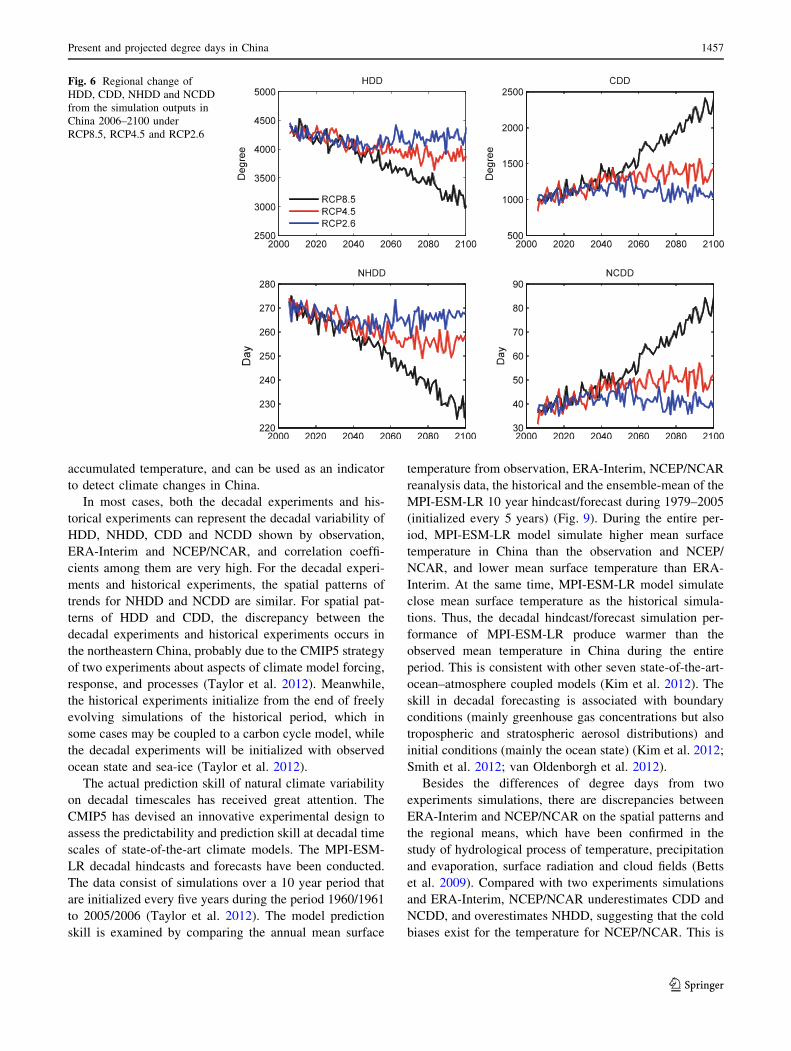
Figure 6 shows the regional changes of HDD, CDD,
NHDD and NCDD from the long-term simulations in
China during 2006–2100 under RCP8.5, RCP4.5 and
RCP2.6. The spatial patterns of trends for HDD, CDD,
NHDD and NCDD under RCP8.5 and RCP2.6 are dis-
played in Figs. 7 and 8, respectively. The seasonal and
annual trends of HDD, CDD, NHDD and NCDD are
summarized in Table 4.
During the period 2006–2100, HDD and NHDD in China
display significant decreases under RCP8.5, with the rates
of -142.17 �C/decade and -5.11 day/decade, respectively,
mostly contributed by winter. Both HDD and NHDD show
Table 2 Regional trend of HDD, CDD, NHDD and NCDD from observation, ERA-Interim, NCEP/NCAR reanalysis data and the simulation
outputs under different run experiments in China during 1979–2005 on the annual and seasonal basis
Index Unit Annual Spring Summer Autumn Winter
Observation
HDD �C/decade 2130.97 243.61 -2.17 237.71 -40.32
CDD �C/decade 76.91 6.18 53.26 12.27 0
NHDD Day/decade 23.84 21.30 21.45 21.09 -0.13
NCDD Day/decade 2.83 0.23 1.86 0.47 0
ERA-Interim
HDD �C/decade 282.48 233.52 -0.93 –19.25 -21.81
CDD �C/decade 74.95 6.68 44.14 14.97 0.59
NHDD Day/decade 22.99 20.94 20.90 20.93 -0.26
NCDD Day/decade 2.67 0.26 1.68 0.56 0.02
NCEP/NCAR
HDD �C/decade 280.52 219.06 11.80 230.29 -31.67
CDD �C/decade 64.64 5.75 43.54 12.86 0.13
NHDD Day/decade 23.22 20.68 21.10 21.18 -0.30
NCDD Day/decade 2.47 0.22 1.55 0.49 0.01
MPI/decadal
HDD �C/decade 265.45 225.81 212.98 -3.77 -35.15
CDD �C/decade 76.93 0.52 56.73 22.66 1.84
NHDD Day/decade 22.66 20.79 -0.93 -0.92 -0.29
NCDD Day/decade 2.73 0.02 2.01 0.87 0.08
MPI/history
HDD �C/decade 269.48 -1.37 220.04 220.19 -21.75
CDD �C/decade 55.49 21.04 27.86 4.41 0.01
NHDD Day/decade 22.80 20.72 -0.93 21.05 -0.07
NCDD Day/decade 2.01 0.74 0.95 0.17 0
The linear trends of all series are calculated by Mann–Kendall slope estimator. Trends at the 5 % level are marked in bold
Present and projected degree days in China 1455
123
larger decreasing trends in the northeastern China and the
Tibetan Plateau, and slight changes in the southeastern
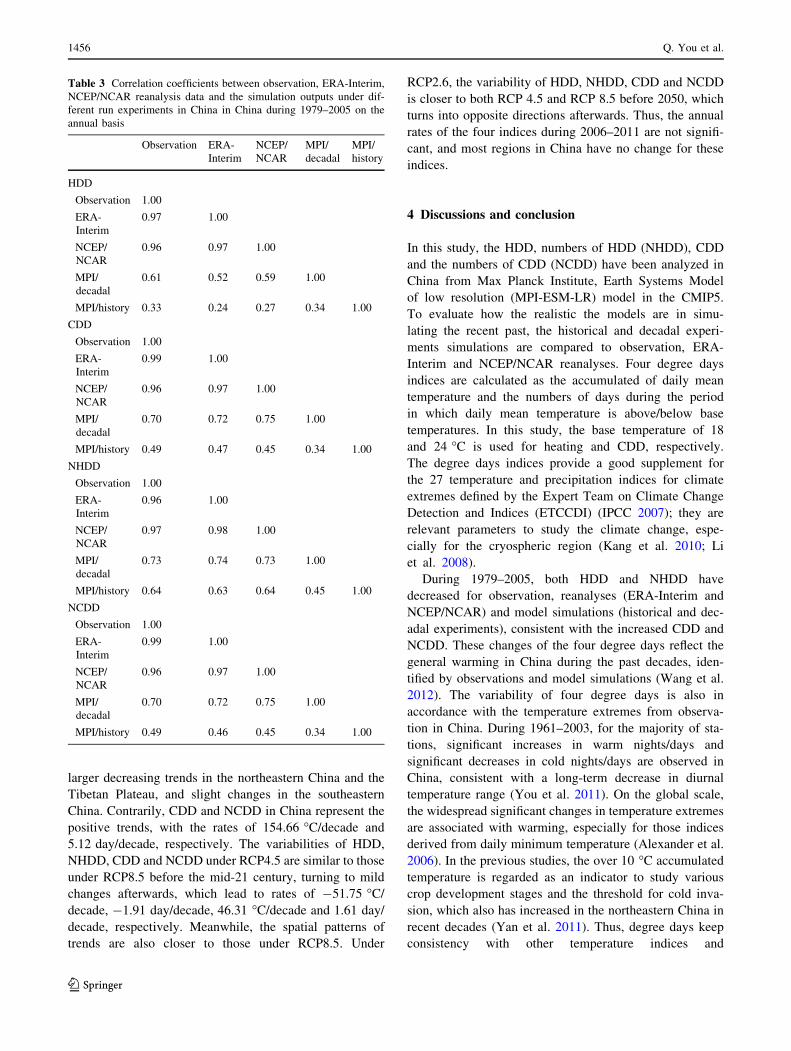
China. Contrarily, CDD and NCDD in China represent the
positive trends, with the rates of 154.66 �C/decade and
5.12 day/decade, respectively. The variabilities of HDD,
NHDD, CDD and NCDD under RCP4.5 are similar to those
under RCP8.5 before the mid-21 century, turning to mild
changes afterwards, which lead to rates of -51.75 �C/
decade, -1.91 day/decade, 46.31 �C/decade and 1.61 day/
decade, respectively. Meanwhile, the spatial patterns of
trends are also closer to those under RCP8.5. Under
RCP2.6, the variability of HDD, NHDD, CDD and NCDD
is closer to both RCP 4.5 and RCP 8.5 before 2050, which
turns into opposite directions afterwards. Thus, the annual
rates of the four indices during 2006–2011 are not signifi-
cant, and most regions in China have no change for these
indices.
4 Discussions and conclusion
In this study, the HDD, numbers of HDD (NHDD), CDD
and the numbers of CDD (NCDD) have been analyzed in
China from Max Planck Institute, Earth Systems Model
of low resolution (MPI-ESM-LR) model in the CMIP5.
To evaluate how the realistic the models are in simu-
lating the recent past, the historical and decadal experi-
ments simulations are compared to observation, ERA-
Interim and NCEP/NCAR reanalyses. Four degree days
indices are calculated as the accumulated of daily mean
temperature and the numbers of days during the period
in which daily mean temperature is above/below base
temperatures. In this study, the base temperature of 18
and 24 �C is used for heating and CDD, respectively.
The degree days indices provide a good supplement for
the 27 temperature and precipitation indices for climate
extremes defined by the Expert Team on Climate Change
Detection and Indices (ETCCDI) (IPCC 2007); they are
relevant parameters to study the climate change, espe-
cially for the cryospheric region (Kang et al. 2010; Li
et al. 2008).
During 1979–2005, both HDD and NHDD have
decreased for observation, reanalyses (ERA-Interim and
NCEP/NCAR) and model simulations (historical and dec-
adal experiments), consistent with the increased CDD and
NCDD. These changes of the four degree days reflect the
general warming in China during the past decades, iden-
tified by observations and model simulations (Wang et al.
2012). The variability of four degree days is also in
accordance with the temperature extremes from observa-
tion in China. During 1961–2003, for the majority of sta-
tions, significant increases in warm nights/days and
significant decreases in cold nights/days are observed in
China, consistent with a long-term decrease in diurnal
temperature range (You et al. 2011). On the global scale,
the widespread significant changes in temperature extremes
are associated with warming, especially for those indices
derived from daily minimum temperature (Alexander et al.
2006). In the previous studies, the over 10 �C accumulated
temperature is regarded as an indicator to study various
crop development stages and the threshold for cold inva-
sion, which also has increased in the northeastern China in
recent decades (Yan et al. 2011). Thus, degree days keep
consistency with other temperature indices and
Table 3 Correlation coefficients between observation, ERA-Interim,
NCEP/NCAR reanalysis data and the simulation outputs under dif-
ferent run experiments in China in China during 1979–2005 on the
annual basis
Observation ERA-
Interim
NCEP/
NCAR
MPI/
decadal
MPI/
history
HDD
Observation 1.00
ERA-
Interim
0.97 1.00
NCEP/
NCAR
0.96 0.97 1.00
MPI/
decadal
0.61 0.52 0.59 1.00
MPI/history 0.33 0.24 0.27 0.34 1.00
CDD
Observation 1.00
ERA-
Interim
0.99 1.00
NCEP/
NCAR
0.96 0.97 1.00
MPI/
decadal
0.70 0.72 0.75 1.00
MPI/history 0.49 0.47 0.45 0.34 1.00
NHDD
Observation 1.00
ERA-
Interim
0.96 1.00
NCEP/
NCAR
0.97 0.98 1.00
MPI/
decadal
0.73 0.74 0.73 1.00
MPI/history 0.64 0.63 0.64 0.45 1.00
NCDD
Observation 1.00
ERA-
Interim
0.99 1.00
NCEP/
NCAR
0.96 0.97 1.00
MPI/
decadal
0.70 0.72 0.75 1.00
MPI/history 0.49 0.46 0.45 0.34 1.00
1456 Q. You et al.
123
accumulated temperature, and can be used as an indicator
to detect climate changes in China.
In most cases, both the decadal experiments and his-
torical experiments can represent the decadal variability of
HDD, NHDD, CDD and NCDD shown by observation,
ERA-Interim and NCEP/NCAR, and correlation coeffi-
cients among them are very high. For the decadal experi-
ments and historical experiments, the spatial patterns of
trends for NHDD and NCDD are similar. For spatial pat-
terns of HDD and CDD, the discrepancy between the
decadal experiments and historical experiments occurs in
the northeastern China, probably due to the CMIP5 strategy
of two experiments about aspects of climate model forcing,
response, and processes (Taylor et al. 2012). Meanwhile,
the historical experiments initialize from the end of freely
evolving simulations of the historical period, which in
some cases may be coupled to a carbon cycle model, while
the decadal experiments will be initialized with observed
ocean state and sea-ice (Taylor et al. 2012).
The actual prediction skill of natural climate variability
on decadal timescales has received great attention. The
CMIP5 has devised an innovative experimental design to
assess the predictability and prediction skill at decadal time
scales of state-of-the-art climate models. The MPI-ESM-
LR decadal hindcasts and forecasts have been conducted.
The data consist of simulations over a 10 year period that
are initialized every five years during the period 1960/1961
to 2005/2006 (Taylor et al. 2012). The model prediction
skill is examined by comparing the annual mean surface
temperature from observation, ERA-Interim, NCEP/NCAR
reanalysis data, the historical and the ensemble-mean of the
MPI-ESM-LR 10 year hindcast/forecast during 1979–2005
(initialized every 5 years) (Fig. 9). During the entire per-
iod, MPI-ESM-LR model simulate higher mean surface
temperature in China than the observation and NCEP/
NCAR, and lower mean surface temperature than ERA-
Interim. At the same time, MPI-ESM-LR model simulate
close mean surface temperature as the historical simula-
tions. Thus, the decadal hindcast/forecast simulation per-
formance of MPI-ESM-LR produce warmer than the
observed mean temperature in China during the entire
period. This is consistent with other seven state-of-the-art-
ocean–atmosphere coupled models (Kim et al. 2012). The
skill in decadal forecasting is associated with boundary
conditions (mainly greenhouse gas concentrations but also
tropospheric and stratospheric aerosol distributions) and
initial conditions (mainly the ocean state) (Kim et al. 2012;
Smith et al. 2012; van Oldenborgh et al. 2012).
Besides the differences of degree days from two
experiments simulations, there are discrepancies between
ERA-Interim and NCEP/NCAR on the spatial patterns and
the regional means, which have been confirmed in the
study of hydrological process of temperature, precipitation
and evaporation, surface radiation and cloud fields (Betts
et al. 2009). Compared with two experiments simulations
and ERA-Interim, NCEP/NCAR underestimates CDD and
NCDD, and overestimates NHDD, suggesting that the cold
biases exist for the temperature for NCEP/NCAR. This is
Fig. 6 Regional change of
HDD, CDD, NHDD and NCDD
from the simulation outputs in
China 2006–2100 under
RCP8.5, RCP4.5 and RCP2.6
Present and projected degree days in China 1457
123

in accordance with the previous studies that ERA-40
temperatures correspond closely to the observations than
NCEP/NCAR, and the biases are due mainly to the ele-
vation differences in the model assimilation (Ma et al.
2008; You et al. 2010). Moreover, ERA-Interim uses
mostly the sets of observations acquired for ERA-40,
supplemented by data for later years from the European
Centre for Medium-Range Weather Forecasts (ECMWF)
operational archive (Dee et al. 2011), and could capture the
observations better than ERA-40 and NCEP/NCAR.
Under different RCP emissions scenarios in the CMIP5,
HDD and NHDD show significant decreases, and both
CDD and NCDD consistently increase during 2006–2100
under RCP8.5, RCP4.5 and RCP2.6, especially before the
mid-21 century. More pronounced changes of degree days
indices occur in most regions in China under RCP8.5. The
variability of HDD, NHDD, CDD and NCDD has good
agreements with the radiative forcing trajectories in RCP,
which can reflect various possible combinations of
economic, technological, demographic, and policy devel-
opments (Moss et al. 2010). For example, the RCP2.6
scenario is designed to meet the 2 �C global average
warming target compared to pre-industrial conditions, and
it has a peak in the radiative forcing at approximately
3 W/m2 (440 ppm CO2) before 2050 and then declines to
2.6 W/m2 by the end of 2100 (330 ppm CO2). Radiative
forcing in RCP4.5 peaks at about 4.5 W/m2 (540 ppm
CO2) in 2100, which is comparable to the ‘‘Special Report
on Emissions Scenarios’’ (SRES) scenarios B1 with similar
CO2 concentrations and median temperature increases by
2100. RCP8.5 assumes a high rate of radiative forcing
increasing, peaking at 8.5 W/m2 (940 ppm CO2) in 2100
(Rogelj et al. 2012). The degree days indices are results of
daily mean temperature influenced by the radiative forcing.
Models lose their memory of the initial conditions and
create their own climates and trends. As shown by Bordi
et al. (2010) for ECMWF model forecasts, a trend mismatch
between observations and model occurs at midlatitudes,
Fig. 7 Spatial trends of HDD, CDD, NHDD and NCDD from the simulation outputs in China during during 2006–2100 under RCP8.5 scenario
1458 Q. You et al.
123

which might be connected with the model dynamic response
rather than with the variations in the imposed external
forcing (Bordi et al. 2010). That is, climate extrapolation by
simply using climate models may be affected by different
trends that observations and models have even at short lead
time. Thus, both reanalyses and short-term forecasts by
GCMs are required, if the climate has to be predicted. That
is, appears to be more important to comprehend the statistics
of the short-term tendencies rather than the forecast accu-
racy of long-term averages. A first step in this direction is
the detailed use of the lead-time dependent climate pre-
dictions based on the five year updated forecasts. Such
analysis needs to be supported by dynamical underpinning
as, for example, the dynamics of stationary waves and the
stratosphere–troposphere interaction.
There is considerable interest in exploring the degree
days to which future climate states depend on the initial
climate state, focusing in particular on whether we can
more accurately predict the actual trajectory of future
climate (including both forced and unforced change) if we
initialize the models with at least the observed ocean state
(and perhaps also sea ice and land surface) (Taylor et al.
2012). Hence, the differences of decadal runs and the 20th
century runs simply reflect the sensitivity to the initial
conditions, as stated above. Addressing these uncertainties,
that are an intrinsic feature of all climate models, being the
main motivation for decadal predictions. To estimate the
uncertainty of decadal experiment, the three ensembles are
taken showing the time series of annual mean surface
temperature in China for the mean of MPI decadal hind-
casts and forecasts during 1979–2005 (Fig. 10). For three
ensembles, the decadal hindcasts and forecasts are con-
sistent and similar, indicating there is no strong positive/
negative deviations from the ensemble mean temperature.
The uncertainties in terms of the inter-ensemble root mean
square difference are in a range of some tenth of a degree,
whereas the long-term trend is well represented and
showing no difference among ensembles.
Fig. 8 Spatial trends of HDD, CDD, NHDD and NCDD from the simulation outputs in China during 2006–2100 under RCP2.6 scenario
Present and projected degree days in China 1459
123

In this study, the differences of degree days between
CMIP3 and CMIP5 are not evaluated, while the main
results should be the same from both CMIP3 and CMIP5.
The previous studies have addressed that for the tempera-
ture indices, the performance of the CMIP3 and CMIP5
multi-model ensembles is similar in regard to their
ensemble mean and median, but that the spread amongst
CMIP3 models tends to be larger than amongst CMIP5
models, probably due to higher spatial resolution and more
comprehensive GCMs of CMIP5 (Sillmann et al. 2013a, b).
Table 4 Regional trend of HDD, CDD, NHDD and NCDD from the simulation outputs under RCP8.5, RCP4.5 and RCP2.6 in China during
2006–2100 on the annual and seasonal basis
Index Unit Annual Spring Summer Autumn Winter
RCP8.5
HDD �C/decade 2142.17 –30.38 29.10 238.62 254.00
CDD �C/decade 154.66 25.65 93.97 29.26 4.34
NHDD Day/decade 25.11 21.40 21.71 21.63 20.33
NCDD Day/decade 5.12 0.89 2.97 1.03 0.17
RCP4.5
HDD �C/decade 251.75 212.18 23.73 212.42 220.74
CDD �C/decade 46.31 9.09 27.43 8.00 1.22
NHDD Day/decade 21.91 20.51 20.72 20.53 20.12
NCDD Day/decade 1.61 0.33 0.93 0.28 0.05
RCP2.6
HDD �C/decade -3.51 -1.63 0.32 -0.08 -1.57
CDD �C/decade 1.12 1.80 -0.28 -0.56 0.25
NHDD Day/decade -0.14 20.11 0.01 -0.04 -0.05
NCDD Day/decade 0.04 0.06 -0.01 -0.02 0.01
The linear trends of all series are calculated by Mann–Kendall slope estimator. Trends at the 5 % level are marked in bold
Fig. 9 Time series of averaged
annual mean surface
temperature (K) in China for
observation, ERA-Interim,
NCEP/NCAR reanalysis data,
the historical and the ensemble-
mean of MPI decadal hindcasts
and forecasts (Red and blue
line) during 1979–2005. It is
5-year decadal forecasts with
0-year lead for every 5 years
during 1979–2005
1460 Q. You et al.
123

More attention should be paid to the relationship between
degree days and the cryosphere, to improve the under-
standing and predictability of cryosphere in China in the
context of future climate change.
Acknowledgments This study is supported by the National Natural
Science Foundation of China (41201072). The authors thank the
National Climate Center, China Meteorological Administration, for
providing the meteorological data for this study. QY and KF
acknowledge support of the Max Planck Fellowship. This study is
also funded by the Ministry of Science and Technology of China
(Grand No. GYHY201206012) and ‘‘the Priority Academic Program
Development of Jiangsu Higher Education Institutions’’ (PAPD). We
are very grateful to the reviewers for their constructive comments and
thoughtful suggestions.
References
Alexander LV et al (2006) Global observed changes in daily climate
extremes of temperature and precipitation. J Geophys Res-
Atmos 111:D05109
Betts AK, Kohler M, Zhang YC (2009) Comparison of river basin
hydrometeorology in ERA-Interim and ERA-40 reanalyses with
observations. J Geophys Res-Atmos 114:D02101
Bordi I, Fraedrich K, Sutera A (2010) Northern Hemisphere climate
trends in reanalysis and forecast model predictions: the 500 hPa
annual means. Geophys Res Lett 37:L11809
Buyukalaca O, Bulut H, Yılmaz T (2001) Analysis of variable-base
heating and cooling degree-days for Turkey. Appl Energy
69(4):269–283
Dee DP et al (2011) The ERA-Interim reanalysis: configuration and
performance of the data assimilation system. Q J R Meteorol Soc
137(656):553–597
Ding YH, Ren GY, Zhao ZC, Xu Y, Luo Y, Li QP, Zhang J
(2007) Detection, causes and projection of climate change over
China: an overview of recent progress. Adv Atmos Sci
24(6):954–971
IPCC (2007) Summary for policymakers of climate change 2007: the
physical science basis. Contribution of working group I to the
fourth assessment report of the Intergovernmental Panel on
Climate Change. Cambridge University Press, Cambridge
Jiang F, Li X, Wei B, Hu R, Li Z (2009) Observed trends of heating
and cooling degree-days in Xinjiang Province, China. Theor
Appl Climatol 97(3–4):349–360
Kalnay E et al (1996) The NCEP/NCAR 40-year reanalysis project.
Bull Am Meteorol Soc 77(3):437–471
Kang SC, Xu YW, You QL, Flugel WA, Pepin N, Yao TD (2010)
Review of climate and cryospheric change in the Tibetan
Plateau. Environ Res Lett 5(1):015101
Kim HM, Webster PJ, Curry JA (2012) Evaluation of short-term
climate change prediction in multi-model CMIP5 decadal
hindcasts. Geophys Res Lett 39:L10701
Li X, Cheng GD, Jin HJ, Kang E, Che T, Jin R, Wu LZ, Nan ZT,
Wang J, Shen YP (2008) Cryospheric change in China. Glob
Planet Change 62(3–4):210–218
Liu BH, Xu M, Henderson M, Qi Y, Li YQ (2004) Taking China’s
temperature: daily range, warming trends, and regional varia-
tions, 1955–2000. J Clim 17(22):4453–4462
Ma LJ, Zhang TJ, Li QX, Frauenfeld OW, Qin DH (2008) Evaluation
of ERA-40, NCEP-1, and NCEP-2 reanalysis air temperatures
with ground-based measurements in China. J Geophys Res-
Atmos 113:D15115
Moss RH et al (2010) The next generation of scenarios for climate
change research and assessment. Nature 463(7282):747–756
Fig. 10 Time series of
averaged annual mean surface
temperature (K) in China for
three ensembles for the mean of
MPI decadal hindcasts and
forecasts (Red and blue line)
during 1979–2005. It is 5-year
decadal forecasts with 0-year
lead for every 5 years during
1979–2005
Present and projected degree days in China 1461
123
OrtizBevia M, Sanchez-Lopez G, Alvarez-Garcıa F, RuizdeElvira A
(2012) Evolution of heating and cooling degree-days in Spain:
trends and interannual variability. Glob Planet Change 92:236–247
Qin DH, Liu SY, Li PJ (2006) Snow cover distribution, variability,
and response to climate change in western China. J Clim
19(9):1820–1833
Rehman S, Al-Hadhrami LM, Khan S (2011) Annual and seasonal
trends of cooling, heating, and industrial degree-days in coastal
regions of Saudi Arabia. Theor Appl Climatol 104(3–4):479–488
Ren GY, Gu J, Xu MZ, Li QX, Liu XN (2005) Climate changes of
China’s mainland over the past half century. Acta Meteorol
Sinica 63:942–956 (in Chinese with English abstract)
Ren GY, Guan ZY, Shao XM, Gong DY (2011a) Changes in climatic
extremes over mainland China. Clim Res 50:105–111
Ren GY, Chen Y, Zou X, Zhou KYQ, Ren YY, Jiang Y, Ren FM,
Zhang Q, Wang XL, Zhang L (2011b) Change in climatic
extremes over mainland China based on an integrated extreme
climate index. Clim Res 50:113–124
Rogelj J, Meinshausen M, Knutti R (2012) Global warming under old
an new scenarios using IPCC climate sensitivity range estimates.
Nat Clim Change 2(4):248–253
Sen PK (1968) Estimates of Regression Coefficient Based on
Kendalls Tau. J Am Stat Assoc 63(324):1379–1389
Sillmann J, Kharin V, Zhang X, Zwiers F, Bronaugh D (2013a)
Climate extremes indices in the CMIP5 multimodel ensemble:
part 1. Model evaluation in the present climate. J Geophys Res-
Atmos 118:1716–1733
Sillmann J, Kharin V, Zwiers F, Zhang X, Bronaugh D (2013b)
Climate extremes indices in the CMIP5 multimodel ensemble:
part 2. Future climate projections. J Geophys Res-Atmos
118:2473–2493
Smith DM, Scaife AA, Boer GJ, Caian M, Doblas-Reyes FJ, Guemas
V, Hawkins E, Hazeleger W, Hermanson L, Ho CK (2012) Real-
time multi-model decadal climate predictions. Clim Dyn. doi:10.
1007/s00382-012-1600-0
Taylor KE, Stouffer RJ, Meehl GA (2012) An overview of CMIP5
and the experiment design. Bull Am Meteorol Soc 93(4):
485–498
Uppala SM et al (2005) The ERA-40 re-analysis. Q J R Meteorol Soc
131(612):2961–3012
van Oldenborgh GJ, Doblas-Reyes FJ, Wouters B, Hazeleger W
(2012) Decadal prediction skill in a multi-model ensemble. Clim
Dyn 38(7–8):1263–1280
Wang SW, Gong DY (2000) Enhancement of the warming trend in
China. Geophys Res Lett 27(16):2581–2584
Wang SP, Wang ZH, Piao SL, Fang JY (2010) Regional differences
in the timing of recent air warming during the past four decades
in China. Chin Sci Bull 55(19):1968–1973
Wang HJ, Sun JQ, Chen HP, Zhu YL, Zhang Y, Jiang DB, Lang XM,
Fan K, Yu ET, Yang S (2012) Extreme climate in China: facts,
simulation and projection. Meteorol Zeitschrift 21(3):279–304
Wild M, Folini D, Schaer C, Loeb N, Dutton EG, Koenigh-Langlo G
(2013) The global energy balance from a surface perspective.
Clim Dyn 40:3107–3134
Xu Y, Gao XJ, Yan SY, Xu CH, Shi Y, Giorgi F (2009) A daily
temperature dataset over China and its application in validating a
RCM simulation. Adv Atmos Sci 26(4):763–772
Yan M, Liu X, Zhang W, Li X, Liu S (2011) Spatio-temporal changes
of [= 10� accumulated temperature in northeastern China since
1961. Chin Geogr Sci 21(1):17–26
Yao T et al (2012) Different glacier status with atmospheric
circulations in Tibetan Plateau and surroundings. Nat Clim
Change 2(9):663–667
You QL, Kang SC, Pepin N, Flugel WA, Yan YP, Behrawan H,
Huang J (2010) Relationship between temperature trend magni-
tude, elevation and mean temperature in the Tibetan Plateau
from homogenized surface stations and reanalysis data. Glob
Planet Change 71(1–2):124–133
You QL, Kang SC, Aguilar E, Pepin N, Flugel WA, Yan YP (2011)
Changes in daily climate extremes in China and their connection
to the large scale atmospheric circulation during 1961–2003.
Clim Dyn 36:2399–2417
Zhai PM, Pan XH (2003) Trends in temperature extremes during
1951–1999 in China. Geophys Res Lett 30(17):1913
Zhang TJ (2007) Perspectives on environmental study of response to
climatic and land cover/land use change over the Qinghai-
Tibetan plateau: an introduction. Arct Antarct Alp Res
39:631–634
1462 Q. You et al.
123