presentación de powerpoint · 20,0 40,0 60,0 80,0 100,0 120,0 2005 2006 2007 2008 2009 2010 2011...
TRANSCRIPT
Asociación Latinoamericana de Exportadores de Servicios
Semana de Smart TalentPrograma Servicios Globales – UruguayXXI
Facultad de Ciencias Económicas de UdelaR
Montevideo – Abril 2016
JAVIER PEÑA CAPOBIANCOSecretario General ALES,Uruguay.@JavierPenaCapob

COFCO Jiangxi Rice Processing Limited (CHINA)
Whenzhen, Jiangxi, China

-
20,0
40,0
60,0
80,0
100,0
120,0
2005 2006 2007 2008 2009 2010 2011 2012 2013 2014
Fixed-telephone subscriptions Mobile-cellular subscriptions
Active mobile-broadband subscriptions Fixed (wired)-broadband subscriptions
Revolución de TIC

Economía del Conocimiento
Source: World Economic Forum, “The Shifting Geography of Global Value Chains: Implications for Developing Countries and Trade Policy”, 2012.

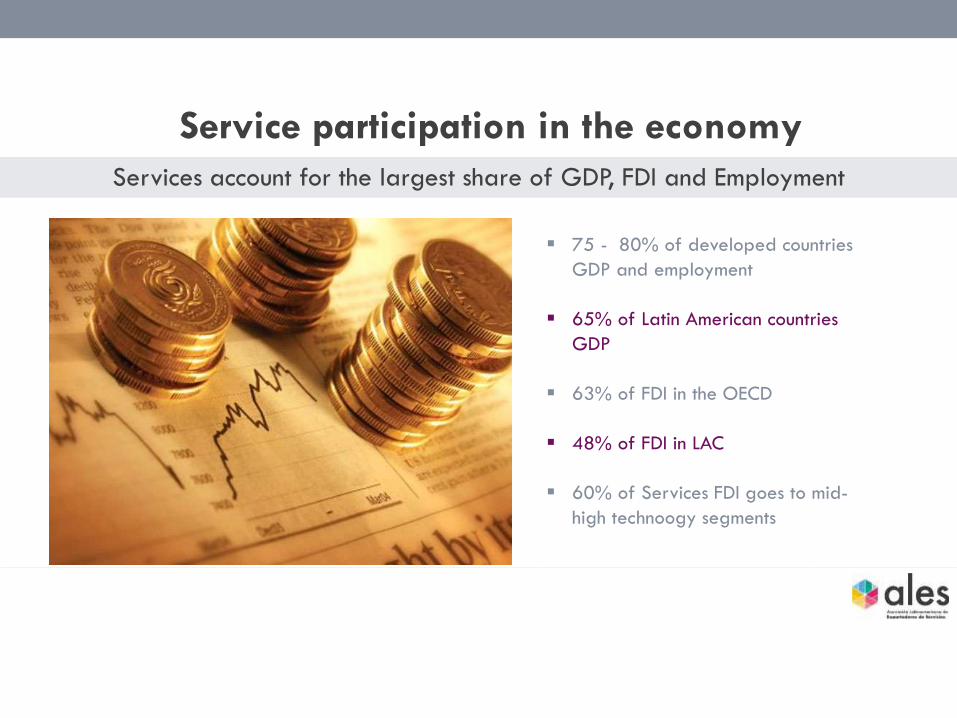
75 - 80% of developed countries
GDP and employment
65% of Latin American countries
GDP
63% of FDI in the OECD
48% of FDI in LAC
60% of Services FDI goes to mid-
high technoogy segments
Service participation in the economy
Services account for the largest share of GDP, FDI and Employment
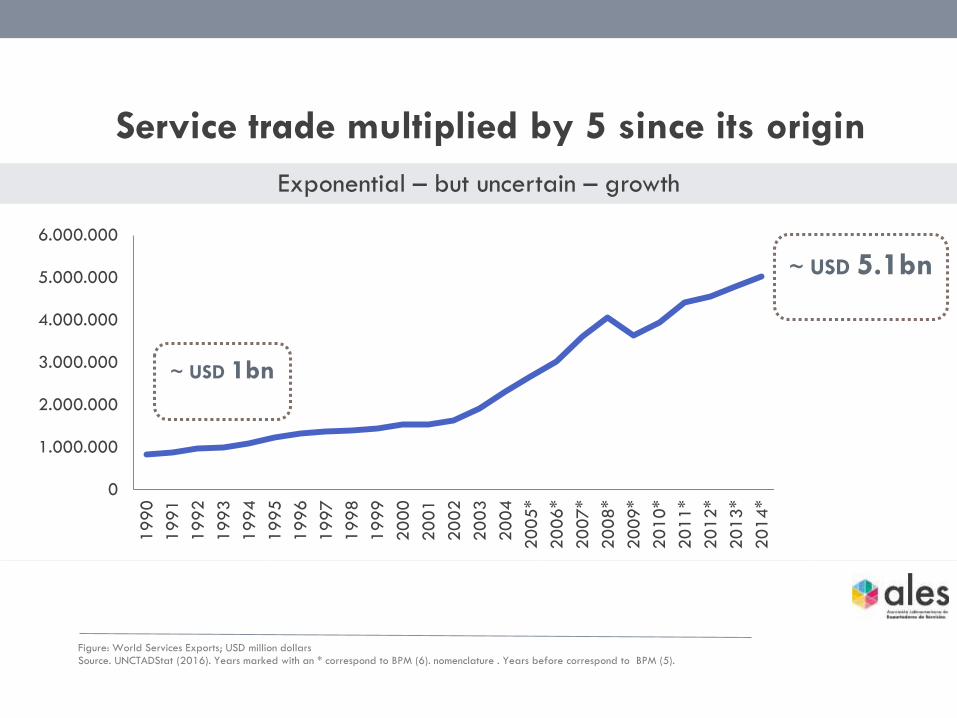
Figure: World Services Exports; USD million dollars
Source. UNCTADStat (2016). Years marked with an * correspond to BPM (6). nomenclature . Years before correspond to BPM (5).
0
1.000.000
2.000.000
3.000.000
4.000.000
5.000.000
6.000.000
19
90
19
91
19
92
19
93
19
94
19
95
19
96
19
97
19
98
19
99
20
00
20
01
20
02
20
03
20
04
20
05
*
20
06
*
20
07
*
20
08
*
20
09
*
20
10
*
20
11
*
20
12
*
20
13
*
20
14
*
Service trade multiplied by 5 since its origin
Exponential – but uncertain – growth
~ USD 5.1bn
~ USD 1bn

19,50%
-10,70%
4,81%
16,12%
-22,26%
0,77%
-25%
-20%
-15%
-10%
-5%
0%
5%
10%
15%
20%
25%
Services seem tougher than goods
Higher growth rates, dynamism and more resilient to crisis
Figure: Interannual growth rate of goods and services1990 – 2014; (%)
Source: UNCTADStat (2015).
Goods Services
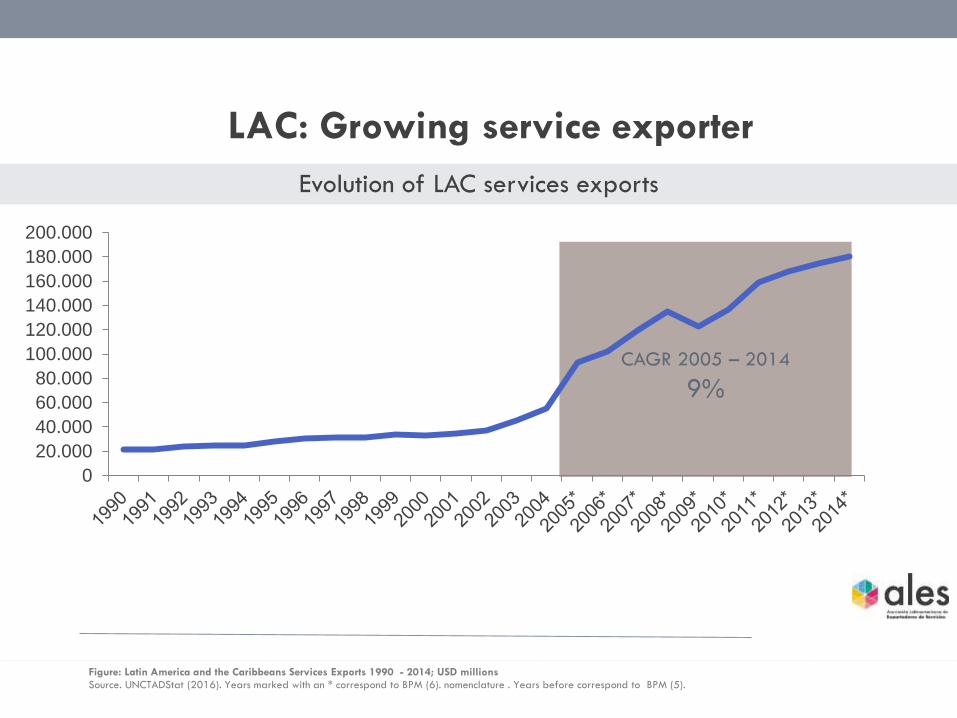
LAC: Growing service exporter
Evolution of LAC services exports
CAGR 2005 – 2014
9%
0
20.000
40.000
60.000
80.000
100.000
120.000
140.000
160.000
180.000
200.000
Figure: Latin America and the Caribbeans Services Exports 1990 - 2014; USD millions
Source. UNCTADStat (2016). Years marked with an * correspond to BPM (6). nomenclature . Years before correspond to BPM (5).
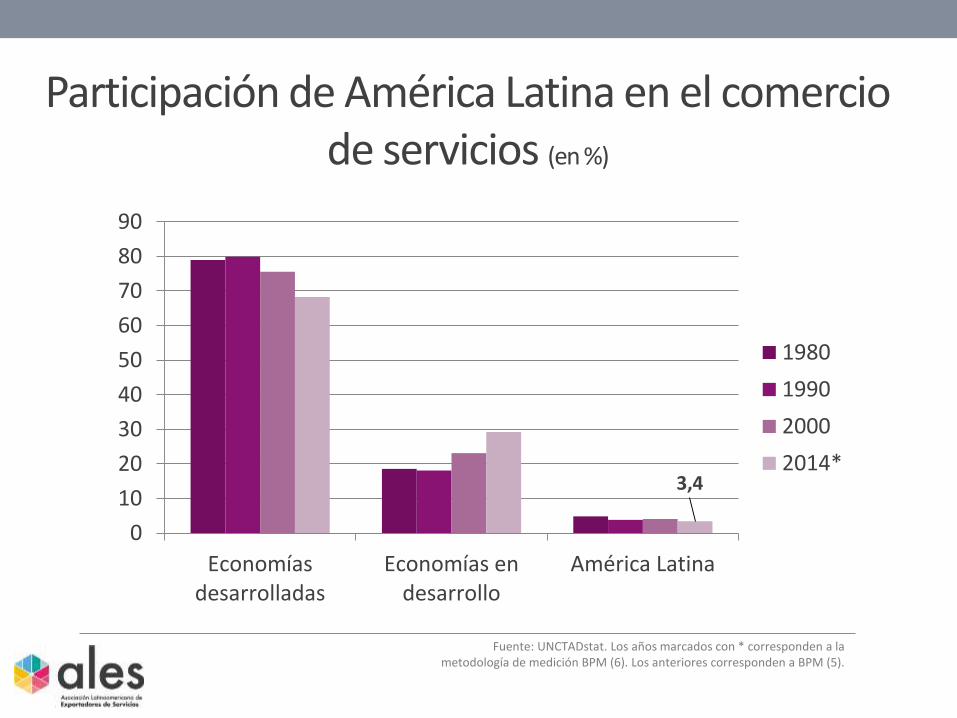
Participación de América Latina en el comercio de servicios (en %)
Fuente: UNCTADstat. Los años marcados con * corresponden a la metodología de medición BPM (6). Los anteriores corresponden a BPM (5).
3,4
0
10
20
30
40
50
60
70
80
90
Economíasdesarrolladas
Economías endesarrollo
América Latina
1980
1990
2000
2014*
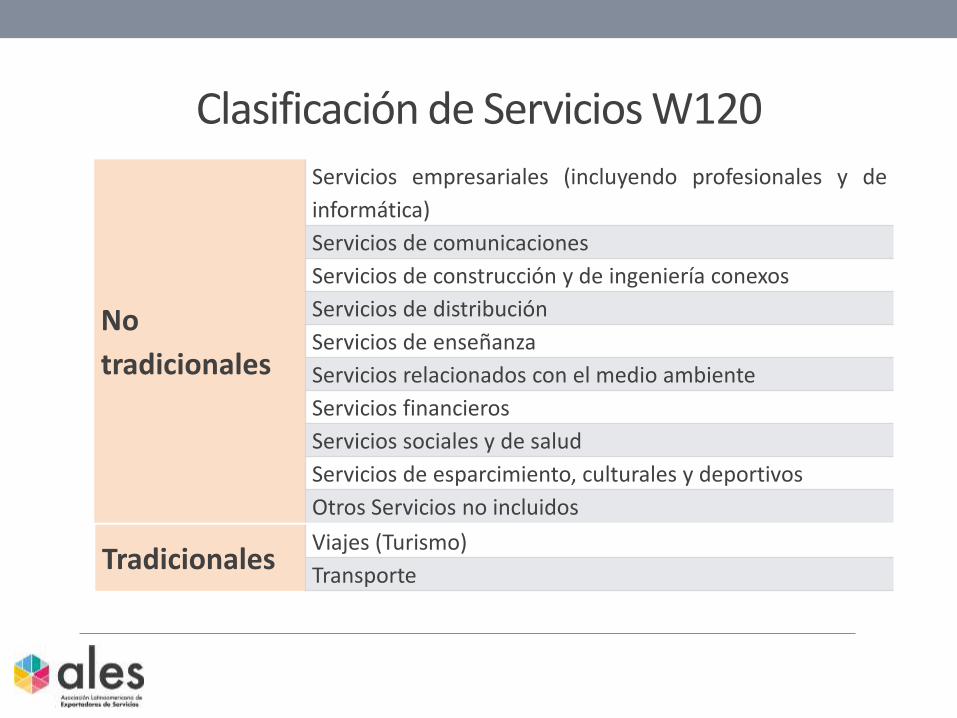
Clasificación de Servicios W120
No
tradicionales
Servicios empresariales (incluyendo profesionales y de
informática)
Servicios de comunicaciones
Servicios de construcción y de ingeniería conexos
Servicios de distribución
Servicios de enseñanza
Servicios relacionados con el medio ambiente
Servicios financieros
Servicios sociales y de salud
Servicios de esparcimiento, culturales y deportivos
Otros Servicios no incluidos
TradicionalesViajes (Turismo)
Transporte

Crecimiento de Servicios No tradicionales Participación en total de exportaciones de servicios por categoría (%)
Fuente: UNCTADstat. Los años seleccionados corresponden a la metodología de medición BPM (6).
21,8 21,9 21,4 21,6 22,5 19,7 20,9 20,4 20,2 19,5 19,0
28,2 25,8 24,8 24,0 23,824,2 24,3 24,3 24,4 24,8 24,7
49,9 48,8 50,2 50,8 50,3 52,7 51,6 52,2 52,0 52,5 53,1
0%
10%
20%
30%
40%
50%
60%
70%
80%
90%
100%
2004 2005* 2006* 2007* 2008* 2009* 2010* 2011* 2012* 2013* 2014*
Transporte Viajes No tradicionales
Tasa de Crecimiento Anual: 10,03%
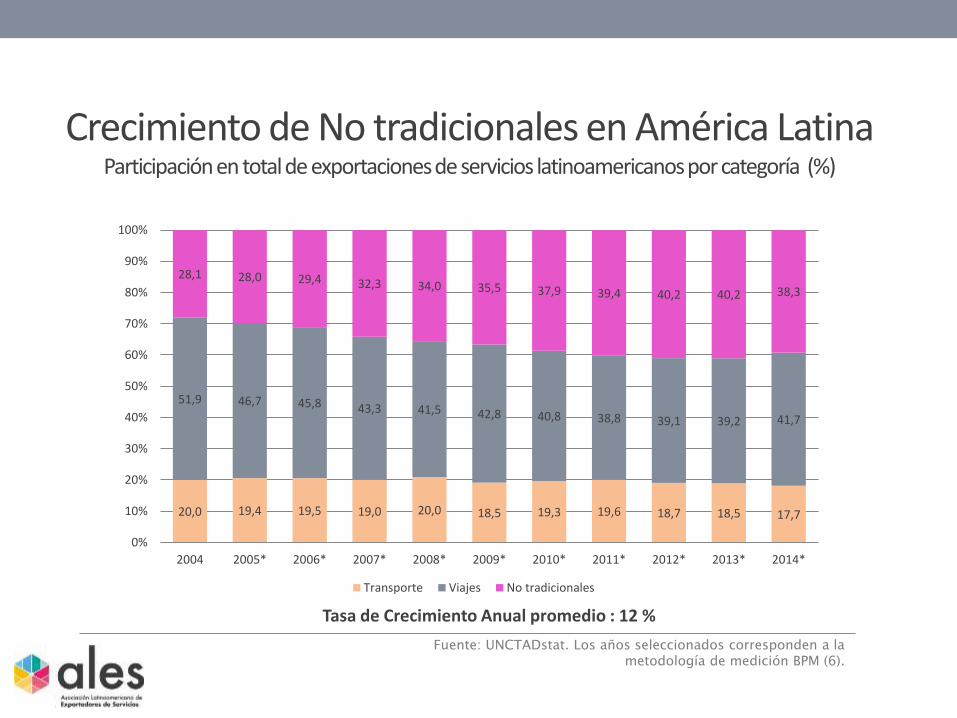
Crecimiento de No tradicionales en América Latina Participación en total de exportaciones de servicios latinoamericanos por categoría (%)
Fuente: UNCTADstat. Los años seleccionados corresponden a la metodología de medición BPM (6).
20,0 19,4 19,5 19,0 20,0 18,5 19,3 19,6 18,7 18,5 17,7
51,9 46,7 45,8 43,3 41,5 42,8 40,8 38,8 39,1 39,2 41,7
28,1 28,0 29,4 32,3 34,0 35,5 37,9 39,4 40,2 40,2 38,3
0%
10%
20%
30%
40%
50%
60%
70%
80%
90%
100%
2004 2005* 2006* 2007* 2008* 2009* 2010* 2011* 2012* 2013* 2014*
Transporte Viajes No tradicionales
Tasa de Crecimiento Anual promedio : 12 %

Sillicom ValeyCosta Rica
UruguayIndia
En cualquier parte
La decisión de deslocalizar
Tip
o d
e a
ctiv
idad
Cualquier tarea en cualquier momentoKPOITOBPO
Captive Center
Proveedor

Razones para deslocalizar
57%
55%
45%
45%
43%
42%
35%
49%
50%
45%
46%
51%
45%
39%
0% 10% 20% 30% 40% 50% 60%
Mejorar eficiencias
Reducir costos
Asegurar la continuidad del negocio
Acceder a conocimientosespecializados
Concentrarse en el core business
Mitigar riesgos utilizandoespecialistas
Reducir la cantidad de empleados
Global
BRIC
Fuente: Grant Thornton IBR (2014), p.5. Los valores asignados a cada elemento corresponden al porcentaje de empresas que respondió: “Qué tan importantes son los siguientes
elementos en la decision de tercerizar operaciones de back-office?”.

Why considering Latin America?
Nearshore | ‘follow-the-sun’ strategy
The new state of the art
Skills | young, creative and effective
Language capabilities | english, spanish and portuguese
Cultural similarity | us and spain
Cost-effective pricing structure | 40% savings + decline of currency
Complementarity| scalability & specialization
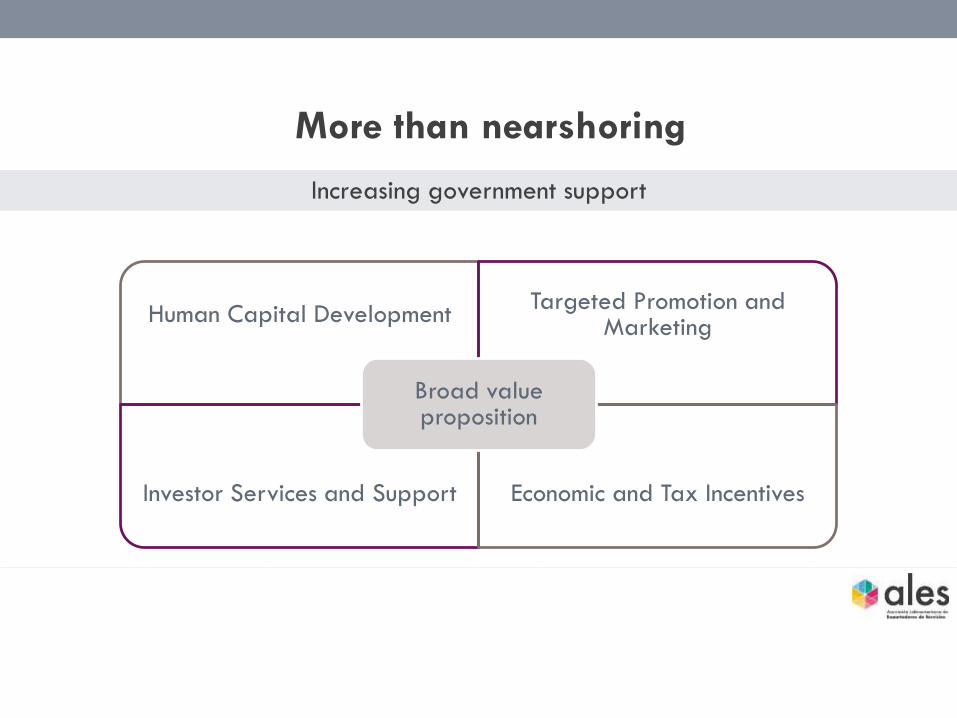
More than nearshoring
Increasing government support
Human Capital DevelopmentTargeted Promotion and
Marketing
Investor Services and Support Economic and Tax Incentives
Broad value proposition
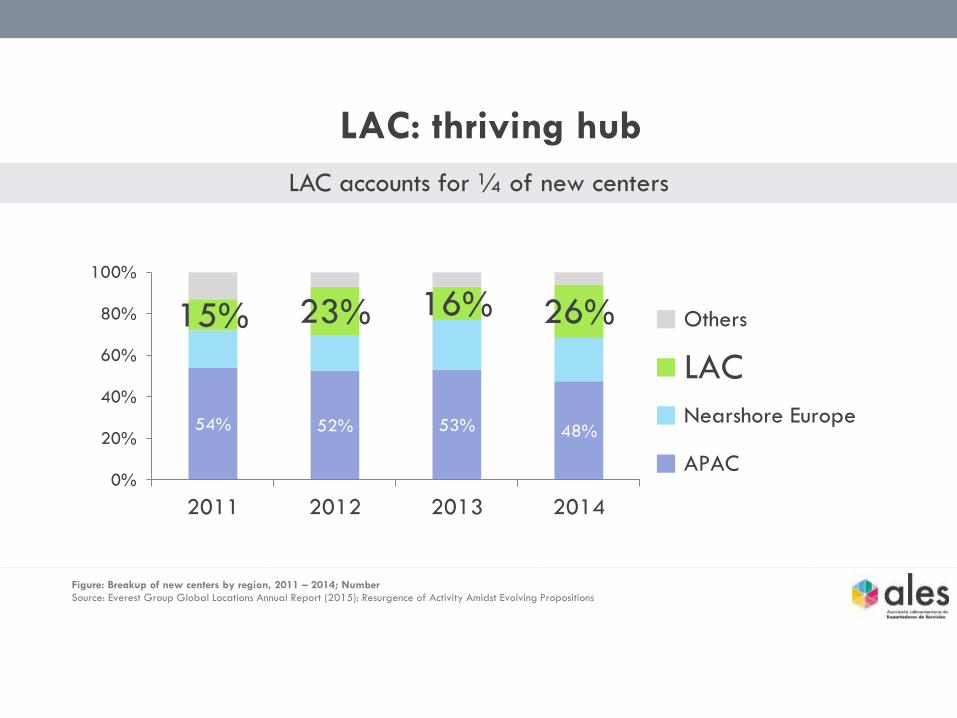
LAC accounts for ¼ of new centers
54% 52% 53% 48%
15% 23% 16% 26%
0%
20%
40%
60%
80%
100%
2011 2012 2013 2014
Others
LAC
Nearshore Europe
APAC
Figure: Breakup of new centers by region, 2011 – 2014; Number
Source: Everest Group Global Locations Annual Report (2015): Resurgence of Activity Amidst Evolving Propositions
LAC: thriving hub

Several competitive players
Growing number of hot locations
9 Nascent locations
3 Emerging locations
2 Mature locations
14 Hot locations
out of 20
Figure: Location Heatmap
Source: Everest Group Global Locations Annual Report (2015)
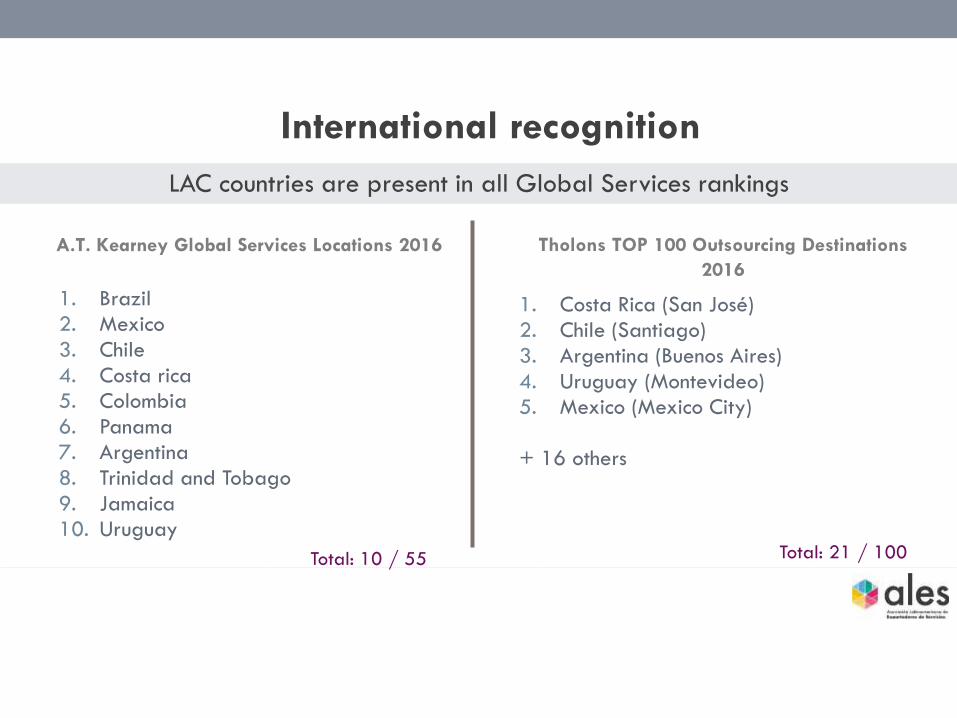
International recognition
LAC countries are present in all Global Services rankings
1. Brazil
2. Mexico
3. Chile
4. Costa rica
5. Colombia
6. Panama
7. Argentina
8. Trinidad and Tobago
9. Jamaica
10. Uruguay
A.T. Kearney Global Services Locations 2016 Tholons TOP 100 Outsourcing Destinations
2016
1. Costa Rica (San José)
2. Chile (Santiago)
3. Argentina (Buenos Aires)
4. Uruguay (Montevideo)
5. Mexico (Mexico City)
+ 16 others
Total: 10 / 55 Total: 21 / 100
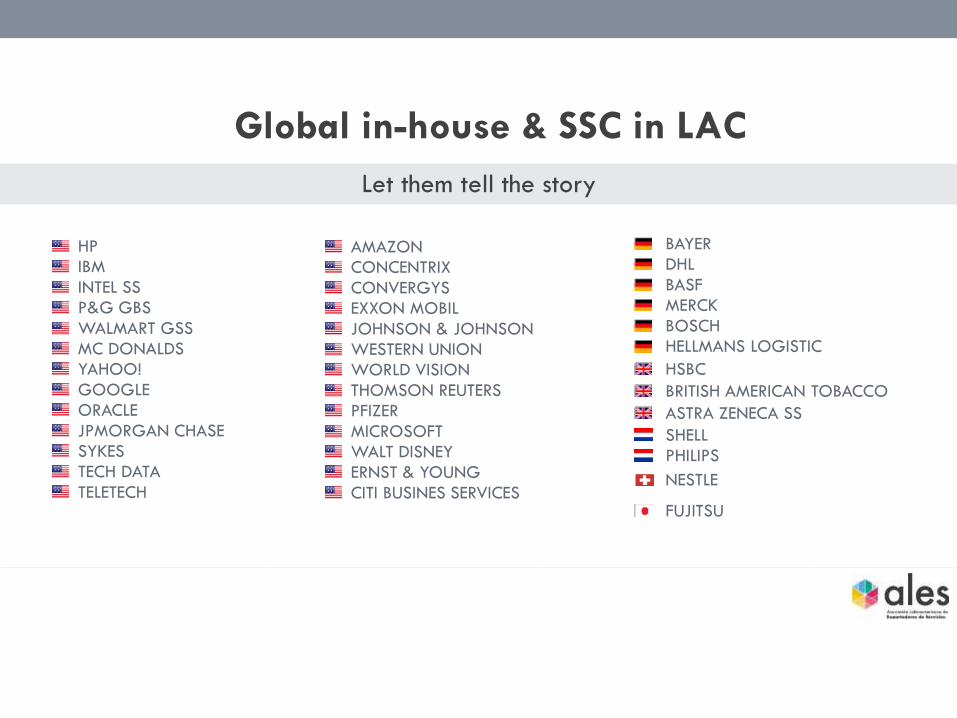
Global in-house & SSC in LAC
Let them tell the story
HP
IBM
INTEL SS
P&G GBS
WALMART GSS
MC DONALDS
YAHOO!
ORACLE
JPMORGAN CHASE
SYKES
TECH DATA
TELETECH
BAYER
DHL
BASF
MERCK
BOSCH
HELLMANS LOGISTIC
FUJITSU
AMAZON
CONCENTRIX
CONVERGYS
EXXON MOBIL
JOHNSON & JOHNSON
WESTERN UNION
WORLD VISION
THOMSON REUTERS
PFIZER
MICROSOFT
WALT DISNEY
ERNST & YOUNG
CITI BUSINES SERVICES
SHELL
PHILIPS
HSBC
BRITISH AMERICAN TOBACCO
ASTRA ZENECA SS
NESTLE
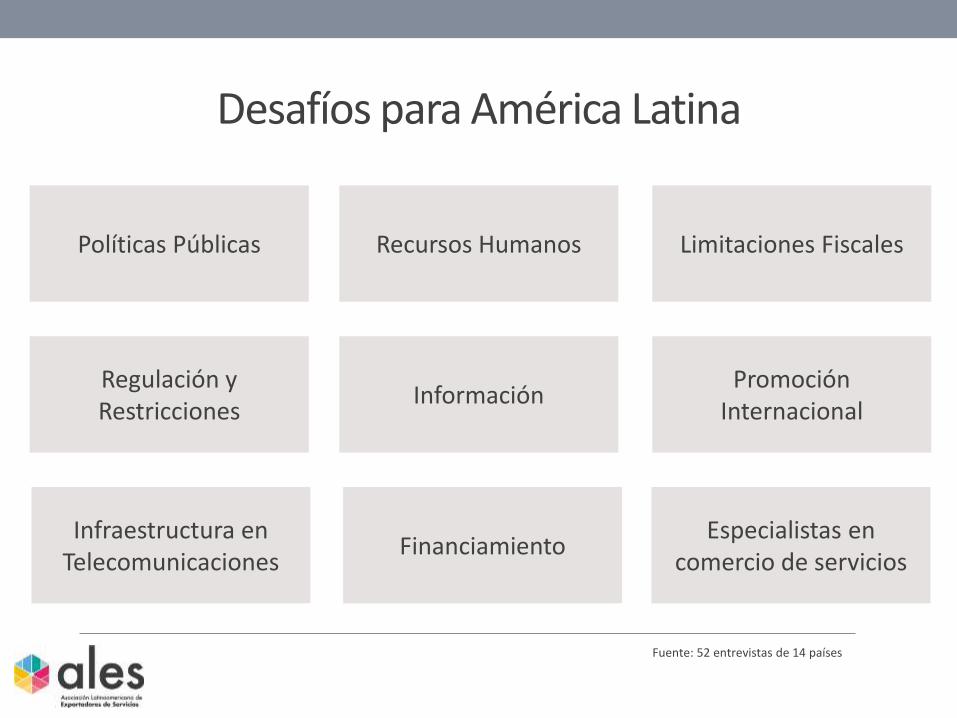
Desafíos para América Latina
Políticas Públicas Recursos Humanos Limitaciones Fiscales
Regulación y Restricciones
Información Promoción
Internacional
Infraestructura en Telecomunicaciones
Especialistas en comercio de servicios
Fuente: 52 entrevistas de 14 países
Financiamiento
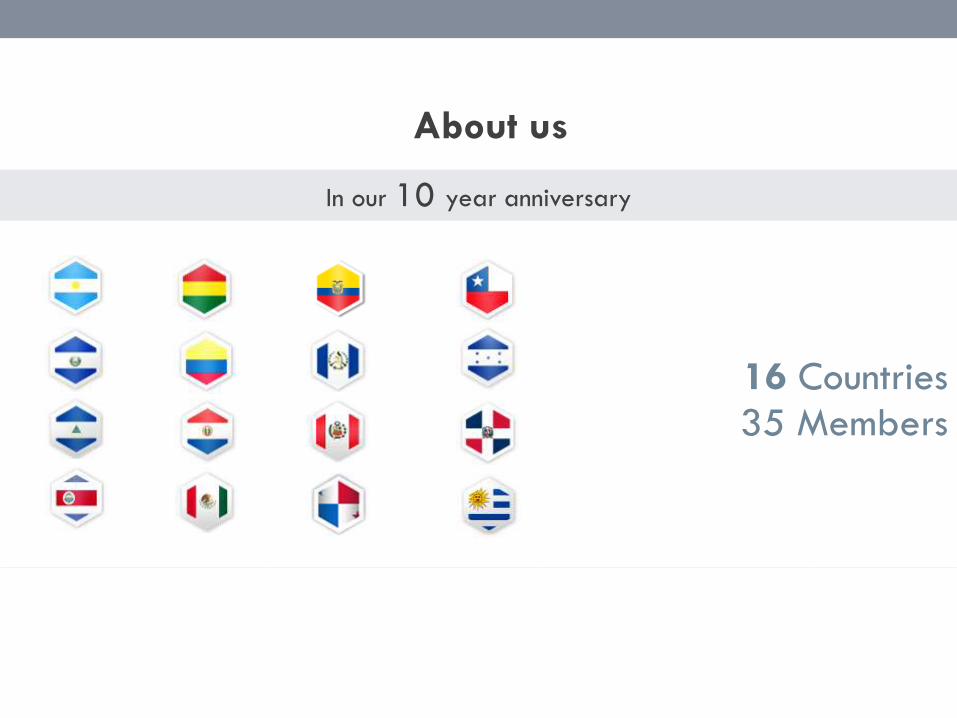
About us
16 Countries
35 Members
In our 10 year anniversary


EVENTO
Pulse para añadir un título
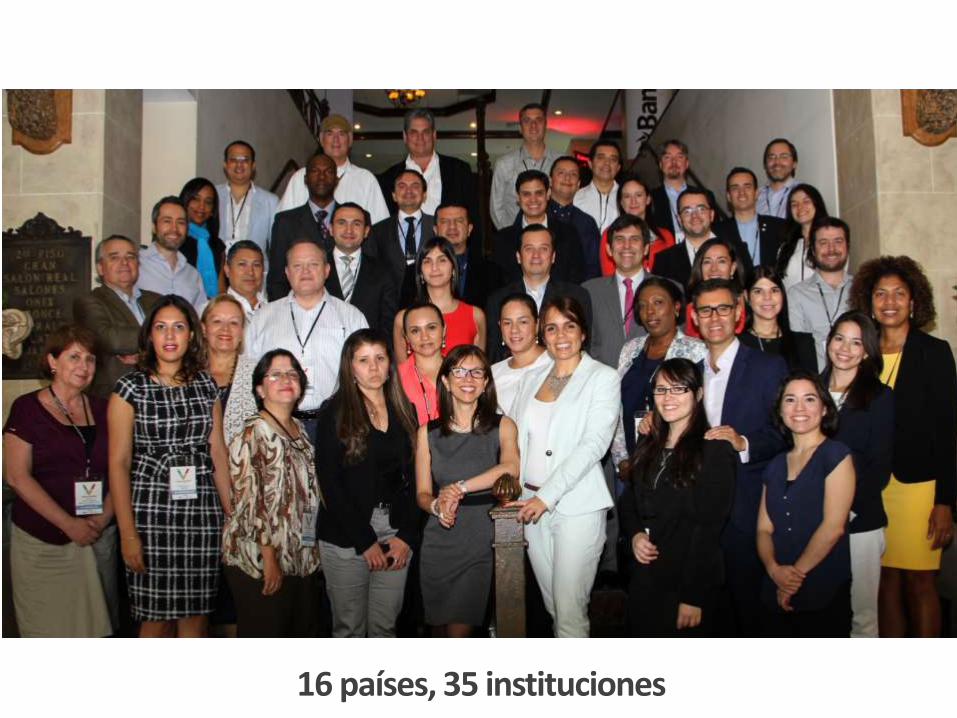
16 países, 35 instituciones