presentación de powerpoint - panel de estado - facultad ... · •study of allocation of filters...
TRANSCRIPT

Análise de Alocação de Filtros para Mitigação
de Distorção Harmônica em Sistemas
Elétricos de Distribuição
Code: 23.004
Mauren Pomalis Coelho da Silva1
Roberto Chouhy Leborgne1, Viviane Barrozo2
UFRGS1(Universidade Federal do Rio Grande do Sul), UNIR2
13/11/2017 1

• STUDY OF ALLOCATION OF FILTERS FOR HARMONICDISTORTION MITIGATION IN DISTRIBUTION SYSTEMS: THE
RESULTS AND CONSEQUENCES.
• Specifics objectives:
- Analysis of the harmonic flow.
- Modelling and simulation (case study).
- Filters to be apply.
- Choice of the local to be apply.
Objectives
13/11/2017 2

• Harmonic Distortion are perturbation in the voltage and current wavelet
signal.
• Indicators of Harmonic Distortion are used to asses the harmonic
content in a system.
• There are the individual harmonic distortion (IHDV) and total harmonic
distortion (THDV).
• Where, Vh is the harmonic voltage of order h, V1 is the fundamental frequency voltage
and H the maximum harmonic being considered in the calculation.
Introduction
13/11/2017 3

• According to each country there are different standard limits to ensure a
level of quality in the supply of electricity.
• Some of these standards:
- IEEE Std. 519/2014
o (upgrade of 1992)
- PRODIST Módulo 8/2017.
o (upgrade annually)
Introduction
13/11/2017 4
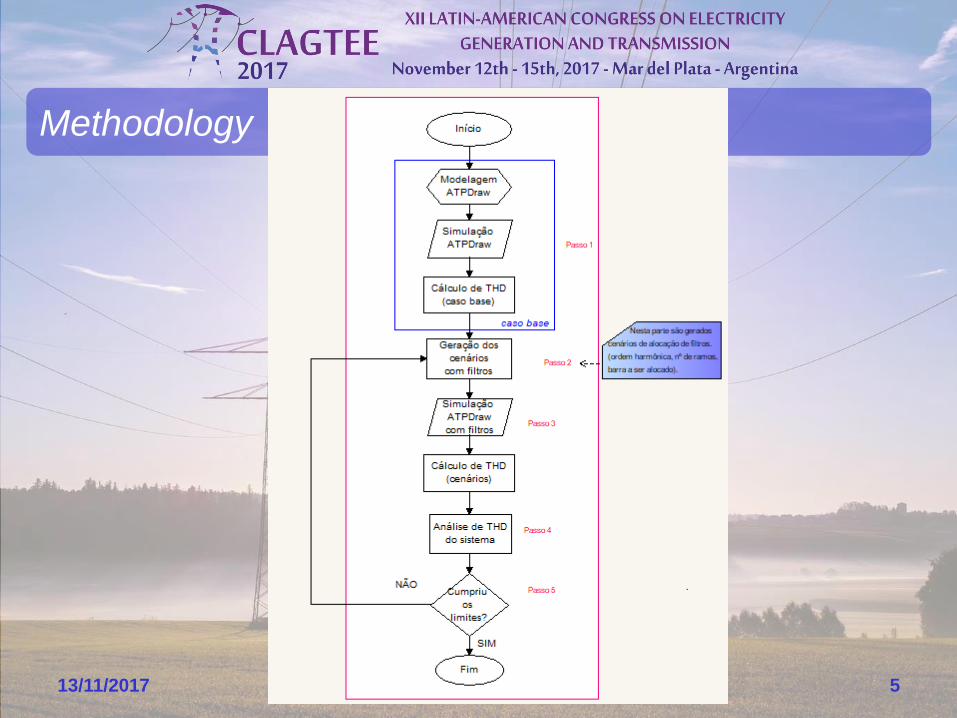
Methodology
13/11/2017 5

• The modelling and simulation there are made with the program
ATPDraw.
Methodology
13/11/2017 6
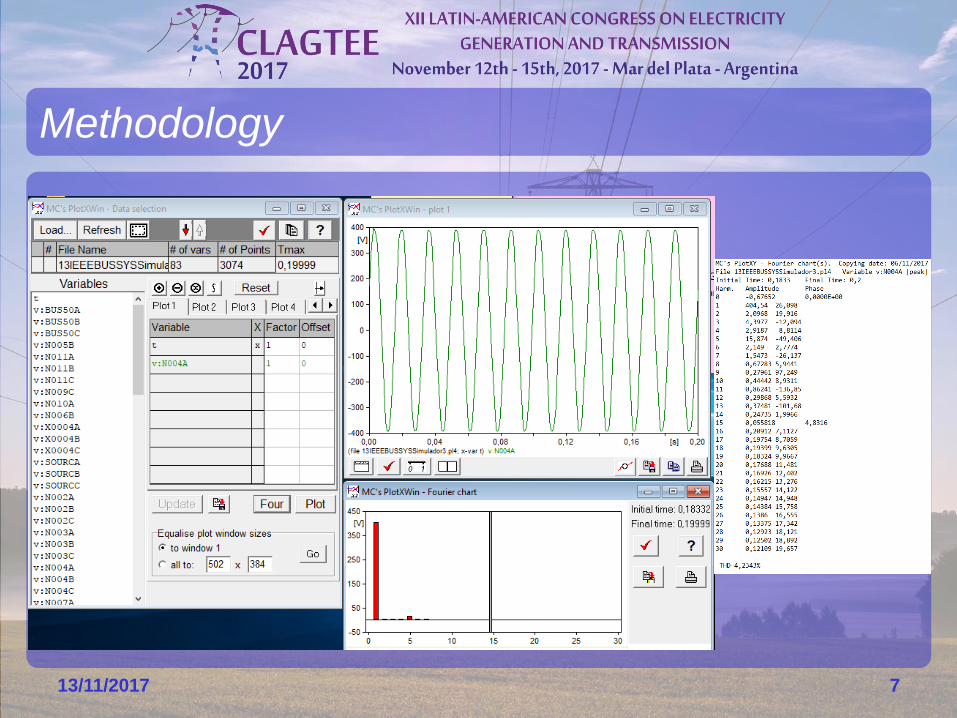
Methodology
13/11/2017 7

Methodology
13/11/2017 8

• THD of the Base Case in each bus, per phase:
• 1 kV < Vn ≤ 13,8 kV : < 8%
Methodology
13/11/2017 9
Nó Fase A Fase B Fase C
31 (INI) 3.37% 3.23% 3.18%
32 8.87% 8.52% 8.35%
33 8.75% 9.15% 8.37%
34 4.23% 4.88% 4.50%
45 8.77%
46 8.82%
71 14.50% 13.51% 14.04%
92 14.51% 13.52% 14.05%
75 14.97% 13.82% 14.34%
150 14.50% 13.51% 14.04%
84 14.55% 14.32%
52 14.57%
911 14.60%

• Cases were simulated to observe the behavior of harmonic distortions
according to the allocation of filters.
• The bus with the worst THDV was initialy choiced to receive a filter.
• Then, the filter components were calculate for this bus.
• The filter was allocate in the bus, and every bus of the system was
analized.• Cases:
Methodology
13/11/2017 10

• The cases were created with a “slave simulator” in MATLAB.
• This simulator provides the
THDv of each bus of the system
for each case.
Methodology
13/11/2017 11

• Simulated Cases:
• Interesting Results: (THD of each bus, per phase)
Experimental results
13/11/2017 12
Filtro Caso base - sem filtros Caso 2 Caso 9
barra Fase A Fase B Fase C Fase A Fase B Fase C Fase A Fase B Fase C
31 3.37% 3.23% 3.18% 2.95% 2.21% 2.48% 2.73% 1.96% 2.11%
32 8.87% 8.52% 8.35% 6.30% 4.15% 5.21% 5.51% 3.70% 4.24%
33 8.75% 9.15% 8.37% 6.30% 4.15% 5.21% 5.76% 3.88% 4.53%
34 4.23% 4.88% 4.50% 4.02% 4.52% 3.81% 3.80% 4.23% 2.91%
45 8.77% 4.19% 3.72%
46 8.82% 4.22% 3.76%
71 14.50% 13.51% 14.04% 10.70% 8.01% 9.84% 7.92% 5.61% 6.51%
92 14.51% 13.52% 14.05% 10.71% 8.02% 9.84% 7.92% 5.62% 6.52%
75 14.97% 13.82% 14.34% 11.08% 8.26% 10.08% 8.09% 5.69% 6.65%
150 14.50% 13.52% 14.04% 10.70% 8.01% 9.84% 7.92% 5.61% 6.51%
52 14.57% 10.76% 7.95%
911 14.60% 10.32% 6.97%

13/11/2017 13
Caso base: sem filtro Caso 3: no nó 33
THD Com deltat= 6.508E-5 THD
Nó Fase A Fase B Fase C Nó Fase A Fase B Fase C
31 (INI) 3.37% 3.23% 3.18% 31 (INI) 2.97% 2.21% 2.52%
32 8.87% 8.52% 8.35% 32 6.45% 4.35% 5.44%
33 8.75% 9.15% 8.37% 33 6.18% 3.94% 5.04%
34 4.23% 4.88% 4.50% 34 4.02% 4.44% 3.74%
45 8.77% 45 4.42%
46 8.82% 46 4.46%
71 14.50% 13.51% 14.04% 71 10.99% 8.37% 10.16%
92 14.51% 13.52% 14.05% 92 11.00% 8.38% 10.17%
75 14.97% 13.82% 14.34% 75 11.38% 8.63% 10.41%
150 14.50% 13.52% 14.04% 150 10.99% 8.37% 10.16%
84 14.55% 14.32% 84
52 14.57% 52 11.05%
911 14.60% 911 10.65%
Caso 1: no nó 31 Caso 4: no nó 34
THD THD
Nó Fase A Fase B Fase C Nó Fase A Fase B Fase C
31 (INI) 3.16% 2.46% 2.94% 31 (INI) 3.37% 3.22% 3.18%
32 8.46% 7.28% 7.96% 32 8.87% 8.51% 8.34%
33 8.46% 7.28% 7.96% 33 8.87% 8.51% 8.34%
34 4.19% 4.66% 4.17% 34 4.22% 4.84% 4.49%
45 7.51% 45 8.76%
46 7.56% 46 8.81%
71 13.92% 12.04% 13.50% 71 14.5% 13.5% 14.03%
92 13.93% 12.04% 13.51% 92 14.51% 13.51% 14,04%
75 14.38% 12.32% 13.80% 75 14.97% 13.8% 14.33%
150 13.92% 12.04% 13.50% 150 14.5% 13.5% 14.03%
84 84
52 14.00% 52 14.57%
911 14.05% 911 14.60%
Caso 2: no nó 32 Caso 5: no nó 45
THD THD
Nó Fase A Fase B Fase C Nó Fase A Fase B Fase C
31 (INI) 2.95% 2.21% 2.48% 31 (INI) 3.37% 3.22% 3.18%
32 6.30% 4.15% 5.21% 32 8.87% 8.52% 8.35%
33 6.30% 4.15% 5.21% 33 8.87% 8.52% 8.35%
34 4.02% 4.52% 3.81% 34 4.23% 4.88% 4.50%
45 4.19% 45 8.77%
46 4.22% 46 8.82%
71 10.70% 8.01% 9.84% 71 14.5% 13.51% 14.04%
92 10.71% 8.02% 9.84% 92 14.51% 13.52% 14.05%
75 11.08% 8.26% 10.08% 75 14.97% 13.82% 14.34%
150 10.70% 8.01% 9.84% 150 14.5% 13.51% 14.04%
84 84
52 10.76% 52 14.57%
911 10.32% 911 14.60%
Caso 6: no nó 46 Caso 9: no nó 75
THD THD
Nó Fase A Fase B Fase C Nó Fase A Fase B Fase C
31 (INI) 3.37% 3.23% 3.18% 31 (INI) 2.73% 1.96% 2.11%
32 8.87% 8.52% 8.35% 32 5.51% 3.70% 4.24%
33 8.87% 8.52% 8.35% 33 5.76% 3.88% 4.53%
34 4.23% 4.88% 4.50% 34 3.80% 4.23% 2.91%
45 8.77% 45 3.72%
46 8.82% 46 3.76%
71 14.5% 13.51% 14.04% 71 7.92% 5.61% 6.51%
92 14.51% 13.52% 14.05% 92 7.92% 5.62% 6.52%
75 14.97% 13.82% 14.34% 75 8.09% 5.69% 6.65%
150 14.5% 13.51% 14.04% 150 7.92% 5.61% 6.51%
84 84
52 14.57% 52 7.95%
911 14.60% 911 6.97%
Caso 7: no nó 71 Caso 10: no nó 150
THD THD
Nó Fase A Fase B Fase C Nó Fase A Fase B Fase C
31 (INI) 2.73% 1.94% 2.11% 31 (INI) 2.78% 1.96%
32 5.52% 3.65% 4.23% 32 5.76% 3.88% 4.53%
33 5.52% 3.65% 4.23% 33 5.76% 3.88% 4.53%
34 3.81% 4.21% 2.92% 34 3.82% 4.23% 2.91%
45 3.67% 45 3.94%
46 3.71% 46 3.97%
71 7.94% 5.55% 6.50% 71 8.40% 5.86% 7.06%
92 7.94% 5.55% 6.50% 92 8.40% 5.87% 7.07%
75 8.22% 5.76% 6.72% 75 8.70% 6.09% 7.29%
150 7.94% 5.55% 6.50% 150 7.92% 5.13% 6.26%
84 84
52 7.97% 52 8.44%
911 6.95% 911 7.52%
Caso 8: no nó 92 Caso 11: no nó 52
THD THD
Nó Fase A Fase B Fase C Nó Fase A Fase B Fase C
31 (INI) 2.73% 1.94% 2.11% 31 (INI) 3.37% 3.23% 3.18%
32 5.52% 3.65% 4.23% 32 8.87% 8.52% 8.35%
33 5.52% 3.65% 4.23% 33 8.87% 8.52% 8.35%
34 3.81% 4.21% 2.92% 34 4.23% 4.88% 4.50%
45 3.67% 45 8.77%
46 3.71% 46 8.82%
71 7.94% 5.55% 6.50% 71 14.5% 13.51% 14.04%
92 7.94% 5.55% 6.50% 92 14.51% 13.52% 14.05%
75 8.21% 5.76% 6.72% 75 14.97% 13.82% 14.34%
150 7.93% 5.55% 6.50% 150 14.5% 13.51% 14.04%
84 84
52 7.97% 52 14.57%
911 6.95% 911 14.60%
Caso 12: no nó 911
THD
Nó Fase A Fase B Fase C
31 (INI) 3.37% 3.23% 3.18%
32 8.87% 8.52% 8.35%
33 8.87% 8.52% 8.35%
34 4.23% 4.88% 4.50%
45 8.77%
46 8.82%
71 14.5% 13.51% 14.04%
92 14.51% 13.52% 14.05%
75 14.97% 13.82% 14.34%
150 14.5% 13.51% 14.04%
84
52 14.57%
911 14.60%

• It was observed that the best results to mitigate system
average harmonic distortion did not occur with the
installation of the filter in the initial proposed buses but in
another bus which is more distant.
• This occurred as a consequence of the change of the
harmonic current flow, and this highlighted the need for
attention in choosing the buses for filters installation.
Discussion
13/11/2017 14

• Because of this, the precaution in the analysis is very
important. Considering only the worst bus in terms of power
quality, may be a mistake, the total system must also be
considered.
• The development of new methods for the solution of
problems in power quality area is quite necessary and good
for the research with new skills.
Discussion
13/11/2017 15

• UFRGS – Universidade Federal do Rio Grande do Sule PPGEE – Programa de pós-Graduação em Engenharia Elétrica
• CAPES – Coordenação de Aperfeiçoamento de Pessoal de Nível
Superior
• UNIR – Fundação Universidade de Rondônia e DEE – Departamento
de Engenharia Elétrica
• Termonorte Energia
Acknowledgments
13/11/2017 16