presentation 2q17
TRANSCRIPT

EARNINGS RESULTS 2Q17August, 2017
Disclaimer
2
This presentation may contain certain forward-looking projections and trends that neither
represent realized financial results nor historical information.
These forward-looking projections and trends are subject to risk and uncertainty, and
future results may differ materially from the projections. Many of these risks and
uncertainties are related to factors that are beyond CCR’s ability to control or to estimate,
such as market conditions, currency swings, the behavior of other market participants, the
actions of regulatory agencies, the ability of the company to continue to obtain financing,
changes in the political and social context in which CCR operates or economic trends or
conditions, including changes in the rate of inflation and changes in consumer confidence
on a global, national or regional scale.
Readers are advised not to fully trust these projections and trends. CCR is not obliged to
publish any revision of these projections and trends that should reflect new events or
circumstances after the realization of this presentation.

TRAFFIC:
Consolidated traffic¹ fell 0.8%.
ADJUSTED EBITDA:
Adjusted EBITDA increased by 69.7%, with an adjusted margin of 88.4% (+28.4 p.p.). Same-basis2 adjusted EBITDA grew 4.8%, with a margin of 58.4%.
NET PROFIT:
Net income totaled R$667.1 million, 357.9% up. Same-basis² netincome totaled R$ 287.5 million, 195.8% up.
2Q17 Highlights
3
1 Excluding the proportional traffic of Renovias and ViaRio.
² Same-basis figures exclude: (i) one-off effects of the acquisition of stakes in ViaQuatro and ViaRio; (ii) ViaQuatro, which became a subsidiary in 2Q17; and (iii) STP,
ViaRio, VLT and ViaQuatro, in same-basis profit and same-basis pro-forma comparisons.

On April 20, we concluded the acquisition of control in ViaQuatro,
reaching a 75% stake. As of 2Q17, the Concessionaire’s results have
been consolidated on a line-by-line basis rather than only under the equity
income method.
On May 24, the Company acquired an additional stake of 33.33% in
ViaRio, totaling a 66.66% stake. The Concessionaire’s results are still
consolidated under the equity income method.
Corporate Event

Financial Highlights
5
1 Net revenue excludes construction revenue.
2 Same-basis figures exclude: (i) one-offs effects of the acquisition of stakes in ViaQuatro and ViaRio; (ii) ViaQuatro, which became a subsidiary in 2Q17; and (iii) STP,
ViaRio, VLT and ViaQuatro, in same-basis profit and same-basis pro-forma comparisons.
3 Calculated by adding net revenue, construction revenue, cost of services and administrative expenses.
4 The adjusted EBIT and EBITDA margins were calculated by dividing EBIT and EBITDA by net revenue, excluding construction revenue, as required by IFRS.
5 Calculated excluding non-cash expenses: depreciation and amortization, provision for maintenance and the recognition of prepaid concession expenses.
Financial Indicators (R$ MM) 2Q16 2Q17 Chg % 2Q16 2Q17 Chg %
Net Revenues1 1,599.6 1,842.1 15.2% 1,865.8 1,985.0 6.4%
Adjusted Net Revenues on the same basis2 1,599.6 1,722.1 7.7% 1,725.4 1,844.5 6.9%
Adjusted EBIT3 634.7 1,268.3 99.8% 738.5 1,327.4 79.7%
Adjusted EBIT Mg.4 39.7% 68.8% 29.1 p.p. 39.6% 66.9% 27.3 p.p.
EBIT on the same basis2 634.7 654.6 3.1% 684.6 707.8 3.4%
EBIT Mg. on the same basis2 39.7% 38.0% -1.7 p.p. 39.7% 38.4% -1.3 p. p
Adjusted EBITDA5 960.2 1,629.3 69.7% 1,106.7 1,721.3 55.5%
Adjusted EBITDA Mg.4 60.0% 88.4% 28.4 p.p. 59.3% 86.7% 27,4 p.p.
Adjusted EBITDA on the same basis2 960.2 1,006.1 4.8% 1,042.2 1,088.5 4.4%
Adjusted EBITDA Mg. on the same basis2 60.0% 58.4% -1.6 p.p. 60.4% 59.0% -1.4 p.p.
Net Income 145.7 667.1 357.9% 145.7 667.1 357.9%
Net Income on the same basis2 97.2 287.5 195.8% 97.2 287.5 195.8%
IFRS Proforma
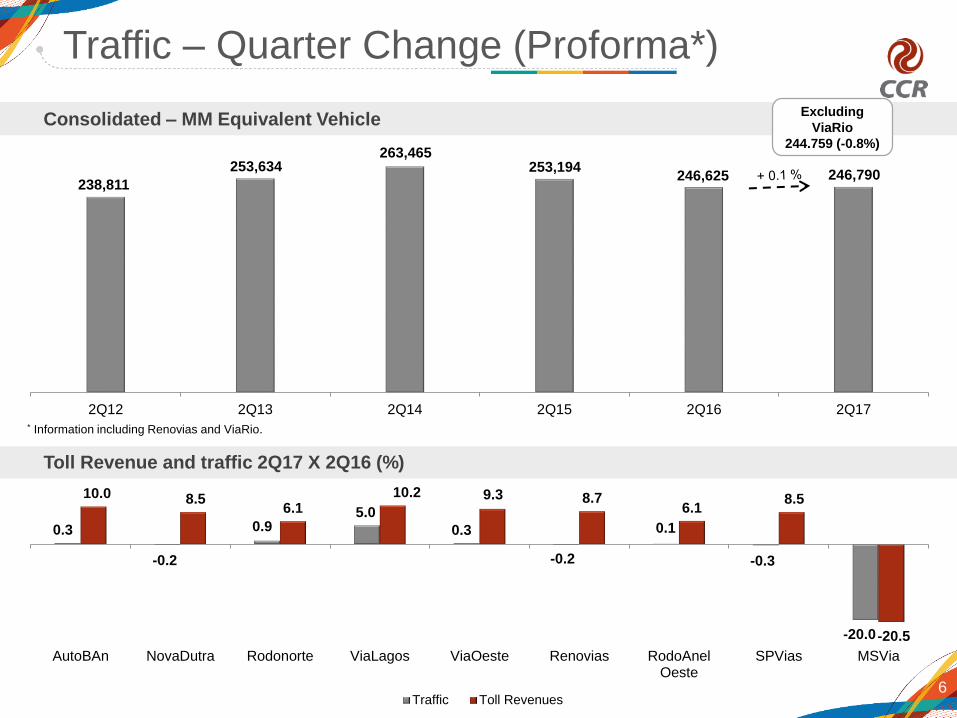
238,811
253,634 263,465
253,194 246,625 246,790
2Q12 2Q13 2Q14 2Q15 2Q16 2Q17
Traffic – Quarter Change (Proforma*)
6
Consolidated – MM Equivalent Vehicle
Toll Revenue and traffic 2Q17 X 2Q16 (%)
* Information including Renovias and ViaRio.
Excluding
ViaRio
244.759 (-0.8%)
0.3
-0.2
0.9 5.0
0.3
-0.2
0.1
-0.3
-20.0
10.0 8.5 6.1
10.2 9.3 8.7 6.1
8.5
-20.5
AutoBAn NovaDutra Rodonorte ViaLagos ViaOeste Renovias RodoAnelOeste
SPVias MSVia
Traffic Toll Revenues
7
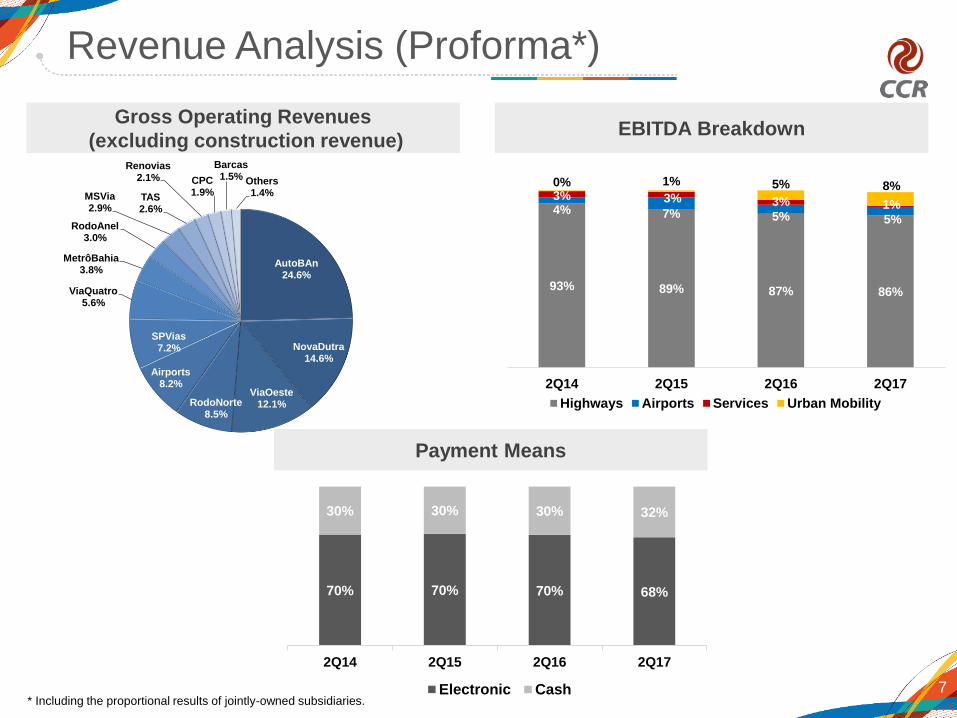
Revenue Analysis (Proforma*)
* Including the proportional results of jointly-owned subsidiaries.
Gross Operating Revenues
(excluding construction revenue) EBITDA Breakdown
Payment Means
AutoBAn24.6%
NovaDutra14.6%
ViaOeste12.1%RodoNorte
8.5%
Airports8.2%
SPVias7.2%
ViaQuatro5.6%
MetrôBahia3.8%
RodoAnel3.0%
MSVia2.9%
TAS2.6%
Renovias2.1% CPC
1.9%
Barcas1.5% Others
1.4%
93% 89% 87% 86%
4% 7% 5% 5%
3% 3% 3% 1%
0% 1% 5% 8%
2Q14 2Q15 2Q16 2Q17
Highways Airports Services Urban Mobility
70% 70% 70% 68%
30% 30% 30% 32%
2Q14 2Q15 2Q16 2Q17
Electronic Cash

1,906
1,064
1,537
53 7 269 451
18 505
54875
2Q16 Depreciationand
Amortization
Third-partyServices
GrantingPower andAdvancedExpenses
PersonnelCosts
ConstructionCosts
MaintenanceProvision
OtherCosts*
2Q17 One-offViaQuatro and
ViaRio
ViaQuatro 2Q17SameBasis
8
Cash cost:
R$ 660 MMProforma same-
basis cash costs:
R$ 777 MM
(+10.3%)
IFRS Costs Evolution
Total Costs (R$ MM)
Conclusion of civil
works in Rodonorte,
NovaDutra and
ViaOeste
Variable
compensation
and Collective
bargaining
agreement
3% 29% 48%23% 2% 26% 44%
IFRS same-basis
cash costs: R$
736 MM (+11.6%)
CCR
NovaDutra, AutoBAn,
ViaOeste and
RodoAnel Oeste
RodoAnel, AutoBAn
and NovaDutra.
SPVias
* Materials, insurance, rent, marketing, trips, electronic means of payment, fuel and other general expenses: Due to the acquisition of control in ViaQuatro in 2Q17, CCR’s previous 60% stake
in the concessionaire was remeasured, generating an intangible asset in the amount of R$511.7 million, with a counter-entry recorded in the year’s income statement at the CCR holding
company; (ii) In addition, CCR’s stake in ViaRio grew by 33.33%, without the acquisition of control, generating positive goodwill in the amount of R$36.4 million under this line also at the CCR
holding company.

Proforma EBITDA*
9
59.3%
Mg.
* Same-basis figures exclude: (i) non-recurring effects of the acquisition of stakes in ViaQuatro and ViaRio; (ii) ViaQuatro, which became a subsidiary in 2Q17; and
(iii) STP, ViaRio, VLT and ViaQuatro, in same-basis profit and same-basis pro-forma comparisons.
2Q16 Same basis
R$ 1,042 MM
60.4% Mg.
R$ MM
86.7%
Mg.
59.0%
Mg.
1,107
1,721
1,089
(85)(548)
2Q16ProformaEBITDA
2Q17ProformaEBITDA
NewProjects
One-offViaQuatro and
ViaRio
2Q17ProformaEBITDA
Same Basis*

501.7
271,1
248.3
26.8 23.4
( 247.1 ) ( 2.3 ) 111.3
45.8
16.3 8.1
2Q16 NetFinancial Result
Income fromHedge Operation
Monetaryvariation on
loans, financ.and debentures
MonetaryVariation on
Liabilitiesrelated to the
Granting Power
Exchange RateVariation onLoans andFinancing
Present ValueAdjustment ofMaintenance
Prov. andLiabilities
related to theGranting Power
Interest onLoans,
Financing andDebentures
InvestmentIncome and
Other Income
Fair Value ofHedge Operation
Others 2Q17 NetFinancial Result
10
46%
•Average cash balance 2Q17 x 2Q16 = +98.4%
• Chg. of average CDI 2Q17 X 2Q16 = - 3.2 p.p.
• Gross Debt = R$ 14.7 bi (-0.1%)
R$ MM
IFRS Financial Results

CDI42.8%
IPCA21.2%
TJLP23.1%
USD12.8%
2Q17
2Q16
11
• Total Gross Debt: R$ 14.7 bi
(R$15.7 bi proforma)
• Net Debt / EBITDA: 1.8 x
(1.8 x proforma)
Not hedged
Hedged
2Q17
Debt in June 30, 2017
*LTM 2Q17 adjusted EBITDA includes the sale of the stake in STP (R$1,307.7) and one-off effects of the acquisition of stakes in ViaQuatro and ViaRio (R$548.1
million). Excluding these effects on EBITDA, the Net Debt/EBITDA ratio came to 2.6x (2.6x in pro-forma figures) in June 2017.
*
Hedged
CDI78.4%
IPCA4.7%
TJLP15.1%
USD1.7%
CDI68.3%
IPCA6.3%
TJLP23.1%
USD2.3%
Indebtedness and leverage position
Gross debt by indexer Hedged gross debt by indexer

Debt Structure and Amortization
Amortization 2017 - 2018 Amortization Schedule/ Not hedged (R$ MM)
12
628
2,760
2,172
389 360
414
89
87
129
2,666
453
528
696
96
92
301
776 1,159
542
377
2017 2018 2019 2020 From2021
CDI TJLP USD Others
3,495
4,1154,169
1,796
1,157
Amortization (R$ MM) 2017 2018
BH AIRPORT 394 0
AutoBAn 320 1,612
Barcas 214 0
NovaDutra 179 163
ViaOeste 143 0
SPVias 118 249
CCR Espanha S.L.U. 100 0
CCR USA Airport 83 33
ViaLagos 72 0
CCR S.A. 64 832
ViaQuatro 64 134
RodoAnel Oeste 21 275
Metrô Bahia 18 589
RodoNorte 3 178
Outras 3 103
TOTAL 1,796 4,169
13
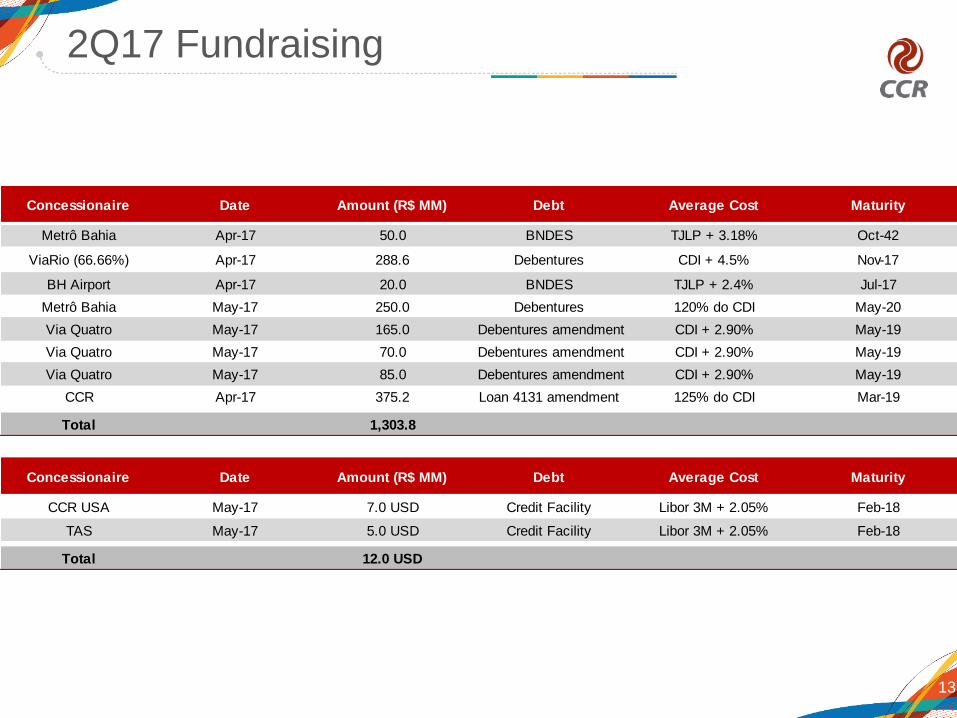
2Q17 Fundraising
Concessionaire Date Amount (R$ MM) Debt Average Cost Maturity
Metrô Bahia Apr-17 50.0 BNDES TJLP + 3.18% Oct-42
ViaRio (66.66%) Apr-17 288.6 Debentures CDI + 4.5% Nov-17
BH Airport Apr-17 20.0 BNDES TJLP + 2.4% Jul-17
Metrô Bahia May-17 250.0 Debentures 120% do CDI May-20
Via Quatro May-17 165.0 Debentures amendment CDI + 2.90% May-19
Via Quatro May-17 70.0 Debentures amendment CDI + 2.90% May-19
Via Quatro May-17 85.0 Debentures amendment CDI + 2.90% May-19
CCR Apr-17 375.2 Loan 4131 amendment 125% do CDI Mar-19
Total 1,303.8
Concessionaire Date Amount (R$ MM) Debt Average Cost Maturity
CCR USA May-17 7.0 USD Credit Facility Libor 3M + 2.05% Feb-18
TAS May-17 5.0 USD Credit Facility Libor 3M + 2.05% Feb-18
Total 12.0 USD

7,859 8,081
9,562 9,82610,413 10,734
12,42312,971
13,94513,261
14,443
10,759
11,961
9,665
11,084
2.0 2.0 2.3 2.4 2.5 2.53.0 3.0 3.1
2.2 2.41.8 1.8 1.8 1.8
-5.5
-4.5
-3.5
-2.5
-1.5
-0.5
0.5
1.5
2.5
3.5
5,000
7,000
9,000
11,000
13,000
15,000
17,000
19,000
2Q14 3Q14 4Q14 1Q15 2Q15 3Q15 4Q15 1Q16 2Q16 3Q16 4Q16 1Q17 2Q17 1Q17 2Q17
Net Debt (R$ MM) Net Debt/EBITDA (x)
14
R$ MM
Proforma Data IFRS 10 and 11
Debt
Net Debt / EBITDA LTM R$ MM
*LTM adjusted EBITDA since 3Q16 includes the sale of the stake in STP and one-off effects of the acquisition of stakes in ViaQuatro and ViaRio as of 2Q17, as
mentioned in the costs section.
15
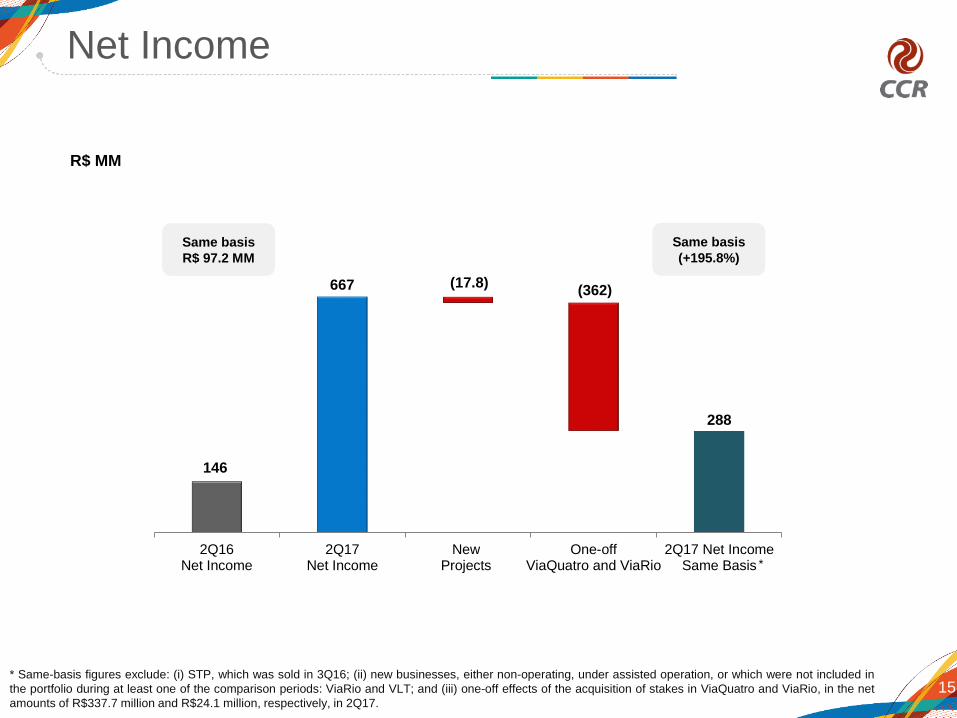
R$ MM
Same basis
R$ 97.2 MM
*
Net Income
* Same-basis figures exclude: (i) STP, which was sold in 3Q16; (ii) new businesses, either non-operating, under assisted operation, or which were not included in
the portfolio during at least one of the comparison periods: ViaRio and VLT; and (iii) one-off effects of the acquisition of stakes in ViaQuatro and ViaRio, in the net
amounts of R$337.7 million and R$24.1 million, respectively, in 2Q17.
Same basis
(+195.8%)
146
288
667 (17.8)(362)
2Q16Net Income
2Q17Net Income
NewProjects
One-offViaQuatro and ViaRio
2Q17 Net IncomeSame Basis

16
1- The investments made by the Company, which will be reimbursed by the granting authority as monetary consideration or contribution, compose the financial
assets.
2- Includes CCR, MTH, CPC and eliminations
3- Booking of site in the municipalities of Cajamar and Caieiras
Investments and Maintenance
2Q17 1H17 2Q17 1H17 2Q17 1H17 2Q17 1H17 2Q17 1H17
NovaDutra 23.3 43.9 1.8 4.6 25.1 48.5 10.6 14.4 0.0 0.0
ViaLagos 0.4 1.4 0.2 0.3 0.6 1.7 0.1 0.1 0.0 0.0
RodoNorte (100%) 66.3 125.3 0.8 2.1 67.1 127.4 10.1 13.5 0.0 0.0
AutoBAn 31.2 59.1 1.3 5.2 32.5 64.3 28.1 45.6 0.0 0.0
ViaOeste 16.6 39.5 1.4 3.3 18.0 42.8 8.5 24.2 0.0 0.0
ViaQuatro (100%) 22.6 22.6 0.7 0.7 23.3 23.3 0.0 0.0 0.0 0.0
RodoAnel Oeste (100%) 17.6 28.3 0.5 1.1 18.1 29.4 0.0 0.0 0.0 0.0
Samm 16.7 16.7 2.2 3.1 18.9 19.8 0.0 0.0 0.0 0.0
SPVias 14.9 21.4 2.1 3.8 17.0 25.2 3.2 3.8 0.0 0.0
CAP 19.5 24.8 0.0 0.0 19.5 24.8 0.0 0.0 0.0 0.0
Barcas (0.1) (0.1) 0.0 0.0 (0.1) (0.1) 0.0 0.0 0.0 0.0
Metrô Bahia 219.6 517.5 1.8 3.6 221.4 521.1 0.0 0.0 341.6 560.0
BH Airport 20.7 72.6 1.3 8.6 22.0 81.2 0.0 0.0 0.0 0.0
MSVia 88.2 196.9 3.2 4.7 91.4 201.6 0.0 0.0 0.0 0.0
TAS 0.0 0.1 1.2 4.1 1.2 4.2 0.0 0.0 0.0 0.0
Renovias (40%) 0.2 0.2 0.4 1.2 0.6 1.4 1.9 1.9 0.0 0.0
ViaRio (66.66%) 0.6 1.6 1.0 1.1 1.6 2.7 0.0 0.0 0.0 0.0
VLT (24.93%) 86.6 84.4 0.0 0.0 86.6 84.4 0.0 0.0 32.1 38.2
Quito - Quiport (50%) 4.7 9.4 0.0 0.0 4.7 9.4 0.0 0.0 0.0 0.0
San José - Aeris (48.75%) 4.6 14.4 0.2 0.3 4.8 14.7 0.0 0.0 0.0 0.0
Others2(6.4) (4.1) 1.8 4.7 (4.6) 0.6 0.0 0.0 0.0 0.0
Total 647.8 1,275.9 21.9 52.5 669.7 1,328.4 62.5 103.5 373.7 598.2
SPCP30.0 0.0 31.3 62.3 31.3 62.3 0.0 0.0 0.0 0.0
Intangible AssetsPerformad
Maintenance
R$ MMImprovements
Performa Financial
Asset1Equipments and
OthersTotal Maintenance Cost
