presentation april 26, 2007 at the nasa gsfc earth day celebrations our home planet as viewed from...
TRANSCRIPT

Presentation April 26, 2007 at the NASA GSFC Earth Day celebrations
Our Home Planet as Viewed from the Aqua SatelliteClaire L. Parkinson/Aqua Project Scientist
NASA Goddard Space Flight Center

Photograph by Apollo 17 astronauts, December 1972

Water in the Earth Environment

The Aqua Spacecraft
May 4, 2002 launch

Aqua’s Orbit
(animation by Jesse Allen)
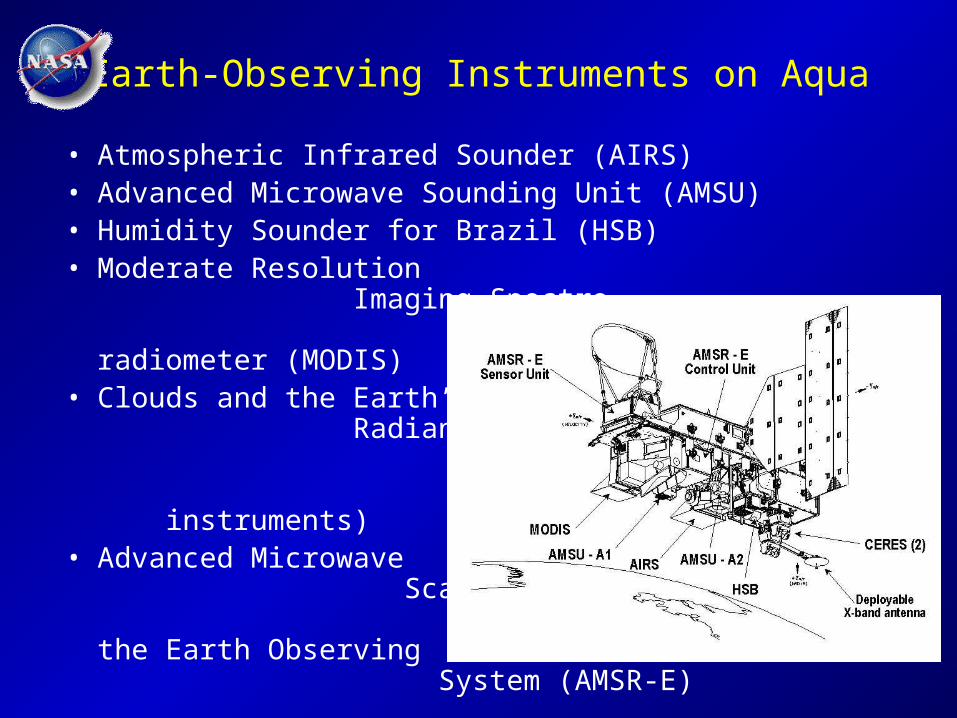
Earth-Observing Instruments on Aqua
• Atmospheric Infrared Sounder (AIRS)• Advanced Microwave Sounding Unit (AMSU)• Humidity Sounder for Brazil (HSB)• Moderate Resolution
Imaging Spectro- radiometer (MODIS)
• Clouds and the Earth’s Radiant Energy System (CERES; two instruments)
• Advanced Microwave Scanning Radiometer for the Earth Observing System (AMSR-E)

Methods of Sending the Aqua Data to the Ground
• Direct playback from the solid state recorder (SSR), while in view of one of the EOS Polar Ground Stations.
• Direct broadcast, to anyone with a receiving system.
Direct Playback (150 Mbps) or
Direct Broadcast (10 Mbps)X-band Direct B
roadcast (10 M
bps)
Polar GroundStation

Hurricane Isabel, September 2003
Image from the Aqua MODIS, 9/14/2003.
Baltimore aftermath, 9/19/03 (photo by P. Hawkes).

Fires in Oregon, August 12, 2002
Image from the Aqua MODIS.

Dust Storm over the Eastern Mediterranean, October 19, 2002
Syria
Jordan
Image from the Aqua MODIS.

MODIS Imagery Captures a Dust Storm Overriding Baghdad, August 2005
Syria
Saudi Arabia
Iraq
Iran
Courtesy of the MODIS Science Team.

August 12, 2003, from the Aqua MODIS
Changes in the Aral Sea
July - September 1989, from Landsat
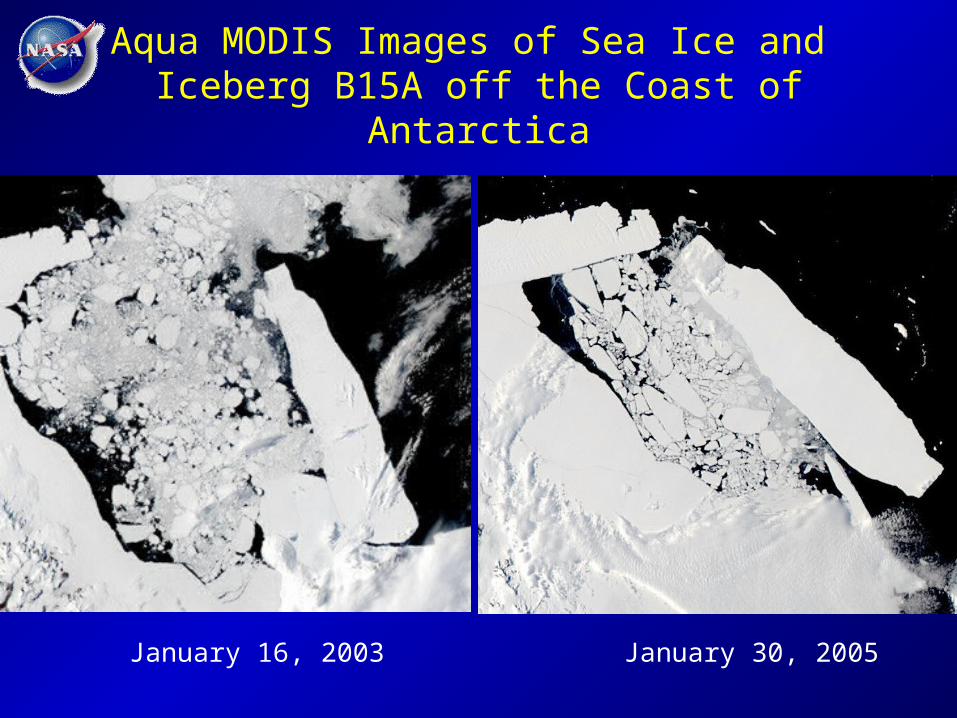
Aqua MODIS Images of Sea Ice and Iceberg B15A off the Coast of Antarctica
January 16, 2003 January 30, 2005

Aqua MODIS View of the Greenland Ice Sheet, July 13, 2002

Electro-magnetic Spectrum
Wavelength (short to long)
Radiation Type Frequency (high to low)
Aqua measure-ment ranges
CE
RE
S
MO
DIS
AIR
S H
SB A
MS
U A
AM
SR
-E

Outgoing Shortwave and Longwave Radiation, June 22, 2002, from the Aqua CERES
(images courtesy of the CERES Science Team)
256
128
0
Reflected shortwave radiation (W/m2)
150
250
350
Outgoing longwave radiation (W/m2)
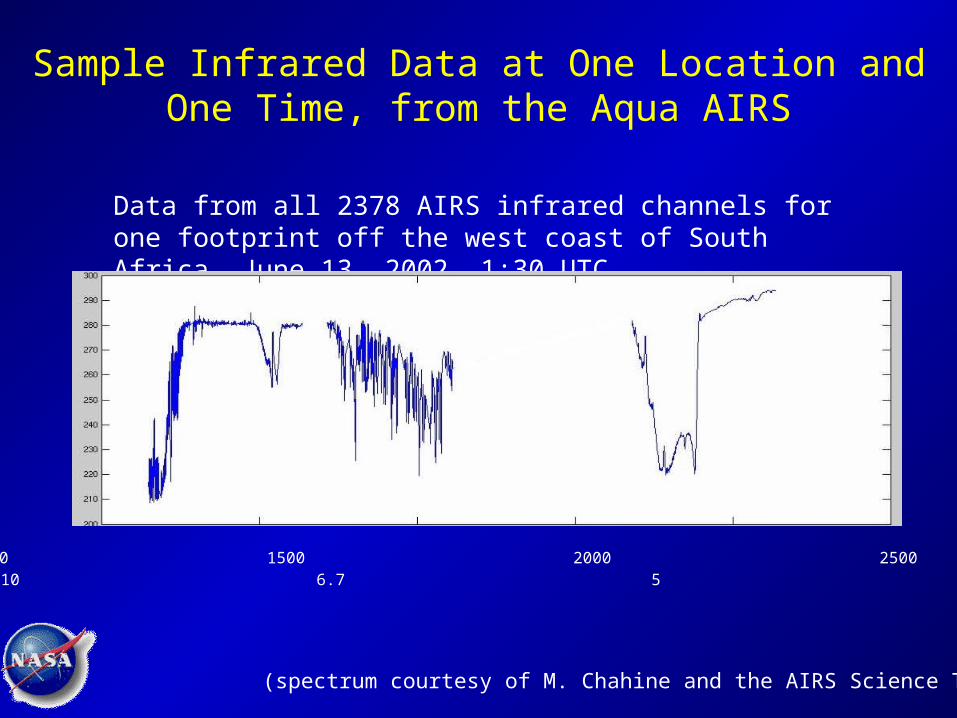
Sample Infrared Data at One Location and One Time, from the Aqua AIRS
Data from all 2378 AIRS infrared channels for one footprint off the west coast of South Africa, June 13, 2002, 1:30 UTC.
(spectrum courtesy of M. Chahine and the AIRS Science Team)
500 1000 1500 2000 2500 wavenumber (cm -1) 20 10 6.7 5 4 wavelength ( m)

AIRS Mid-Tropospheric (8 km) CO2 July 2003
(image courtesy of M. Chahine)
Concentration (ppm)
364 370 376 382

Northern Hemisphere Total Ozone Amounts, December 25,
2002 - January 1, 2003, from AIRS/AMSU and TOMS Data
(animations courtesy of Stephanie Granger and the AIRS Science Team)
Ozone (in Dobson Units) from Aqua’s AIRS/AMSU
QuickTime™ and aCinepak decompressor
are needed to see this picture.
Ozone (in Dobson Units) from the Earth Probe Total Ozone Mapping Spectrometer (TOMS)

AIRS Carbon Monoxide (CO) and Methane (CH4)
Carbon Monoxide, 8/11/2005
Methane Volume Mixing Ratio at 210 mb, 8/8/2005
Dob
son
Uni
ts
3.5
3.0
2.5
2.0
1.5
1.0
1.85
1.80
1.75
1.70
1.65
1.60
(images courtesy of the AIRS Science Team)

Mt. Etna Eruption as Seen in Aqua Imagery, October 28, 2002
Visible/Near IR image
(images courtesy of M. Chahine and the AIRS Science Team)
IR difference image highlighting SO2

Water Vapor, January and July 2003, from the Aqua AIRS and AMSU
(images courtesy of C. Thompson and E. Olsen)
January 2003
July 2003

Surface Air Temperatures, January and July 2003, from the Aqua AIRS
January 2003
July 2003(images from C. (images from C. Thompson and E. Olsen)Thompson and E. Olsen)

Enhanced Vegetation Index from the Aqua MODIS December 19, 2003 - January 4, 2004
(image courtesy of the University of Arizona and the MODIS Science Team)

Ocean Chlorophyll Concentrations for Autumn 2005from Aqua MODIS Data
(image courtesy of the NASA/Goddard Ocean Color Processing Group)

Phytoplankton Bloom north of Norway, as seen in Aqua Imagery, July 19, 2003
(image courtesy of the MODIS Science Team)

Sea Surface Temperatures, December 2003, from the Aqua MODIS and AMSR-E
From AMSR-E
From MODIS

Sea Surface Temperatures, June 2002 - May 2003, from AMSR-E Data
(animation courtesy of JAXA)

Hurricane Katrina
(visualization by the NASA GSFC SVS)
GOES clouds, AMSR-E SSTs, MODIS land, August 27, 2005
AMSR-E SSTs, depicting the Katrina cold wake, August 30, 2005

Typhoon in the East China Sea, July 4, 2002, from the Aqua AMSR-E
(image courtesy of JAXA)
AMSR-E image, 2:26 a.m. Japan Standard Time (JST). Philippines
Japan

Hurricane Frances, September 1, 200489 GHz Data from the Aqua AMSR-E
(image from the NOAA/NASA Near Real Time Processing Effort)

Global Sea Ice Coverage, June 2-4, 2002 (top) and July 21-22, 2002 (bottom), from Aqua’s AMSR-E
(images courtesy of JAXA)

Sample Aqua Validation Activities

The A-Train Constellation of Satellites
(animation by Jesse Allen)

Photograph by Apollo 17 astronauts, December 1972
