presentation attack detection for finger recognition
TRANSCRIPT
Chapter 14Presentation Attack Detection for FingerRecognition
Jascha Kolberg, Marta Gomez-Barrero, Sushma Venkatesh,Raghavendra Ramachandra and Christoph Busch
Abstract Whereas other biometric characteristics, such as the face, are readily avail-able for an eventual attacker through social media or easy to capture with a conven-tional smartphone, vein patterns can only be acquired with dedicated sensors. Thisfact makes them relevant not only for recognition purposes but especially for Presen-tation Attack Detection (PAD), for instance, in combination with fingerprint recogni-tion. In this chapter, we make use of this combination and present a finger vein-basedPAD algorithm to detect presentation attacks targeting fingerprint recognition. Theexperiments are carried out on a newly collected database, comprising 32 species ofPresentation Attack Instruments ranging from printed artefacts to more sophisticatedfingerprint overlays. The results show that our method preserves a convenient usagewhile detecting around 90% of the attacks. However, thin and transparent fingerprintoverlays remain very challenging.
Keywords Presentation attack detection · Fingerprint recognition14.1 Introduction
In spite of the many advantages offered by biometric recognition with respect toother traditional authenticationmethods (thewell-knownLema “forget about PINs or
J. Kolberg (B) · M. Gomez-Barrero · C. Buschda/sec - Biometrics and Internet Security Research Group, Hochschule Darmstadt, Darmstadt,Germanye-mail: [email protected]
M. Gomez-Barreroe-mail: [email protected]
C. Busche-mail: [email protected]
S. Venkatesh · R. RamachandraNorwegian Information Security Laboratory, Norwegian University of Science and Technology,NTNU, Gjøvik, Norwaye-mail: [email protected]
R. Ramachandrae-mail: [email protected]
© The Author(s) 2020A. Uhl et al. (eds.), Handbook of Vascular Biometrics, Advances in Computer Visionand Pattern Recognition, https://doi.org/10.1007/978-3-030-27731-4_14
435

436 J. Kolberg et al.
passwords, you are your own key”), biometric systems are also vulnerable to externalattacks. As a consequence, the security and privacy offered by biometric recognitionsystems can be undermined. Given its serious implications, the vulnerabilities ofbiometric systems to different types of attacks have been the subject of numerousstudies in the last decades for different characteristics, including fingerprint [9, 18,64], face [1], iris [23, 26, 27], voice [3] or multimodal systems [2, 10, 28].
Among other possible points of attack [64], the biometric capture device is prob-ably the most exposed one: the attacker does not need to know any details aboutthe inner modules of the biometric system in order to attack the sensor. To foolthe biometric system, he can present the capture device with a Presentation AttackInstrument (PAI), such as a 3D mask [16], a printed finger vein image [76] or afingerprint overlay [18]. These attacks are known in the literature as PresentationAttacks (PA) [38].
In order to prevent such attacks, Presentation Attack Detection (PAD) methodshavebeen recently developed to automatically distinguish betweenbonafide (i.e. real,live or genuine) presentations and access attempts carried out by means of PAIs [49].Incorporating such countermeasures in biometric systems are crucial, especially inunattended scenarios. Given the importance of increasing the robustness of biometricsystems to these attacks, and hence the systems’ security, this area of research hasattracted a considerable attention within the biometric community in the last decade.In fact, several international projects like the European Tabula Rasa [70] and BEAT[48], or the more recent US Odin research program [55], deal with these securityconcerns. In addition, the LivDet liveness detection competition series on iris [79]and fingerprint [80] have been running since 2009. In turn, these initiatives haveled to a wide number of publications on PAD methodologies for several biometriccharacteristics, including iris [19], fingerprint [47, 67], or face [20].
Compared to other biometric characteristics, such as fingerprint or handwrittensignature, the use of finger vein for recognition purposes are relatively new: the firstcommercial applications date back to 2005 by Hitachi Ltd [45]. The first studieson the vulnerability of finger vein recognition systems to presentation attacks werecarried out only in 2014 [76]. In this work, Tome et al. showed how a simple print outof a finger vein image could successfully fool the system in up to 86%of the attempts.A similar evaluation was carried out by Tome and Marcel [74] in 2015 for palm veinimages,where the success rate of the attacks reachedfigures as high as 75%. It is hencecrucial to protect vein-based systems from these presentation attacks, which, giventheir simplicity, can be carried out by potentially any individual. This is especiallyrelevant for finger vein, due to the extended use of the corresponding sensors inATMs(i.e. unsupervised scenario) in countries as diverse as China,1 Turkey,2 Taiwan,3 orPoland.4
These facts call for a joint effort within the biometrics community to develop PADtechniques for vein-based systems. In this context, the first approach based on Fourier
1https://findbiometrics.com/finger-vein-authentication-atms-china-502087/.2http://www.hitachi.com/New/cnews/120206b.pdf.3http://www.hitachi-omron-ts.com/news/201607-001.html.4http://edition.cnn.com/2010/WORLD/europe/07/05/first.biometric.atm.europe/index.html.

14 Presentation Attack Detection for Finger Recognition 437
and wavelet transforms was proposed in 2013 by Nguyen et al. [51]. Two years later,the first competition on finger vein PAD was organised [75], where three differentteams participated. Since then, different PAD approaches have been presented, basedon either a video sequence and motion magnification [60], texture analysis [44, 61,71], image quality metrics [7], or more recently, neural networks [52, 59, 63] andimage decomposition [58].
All the aforementioned works are focused on the detection of printed finger veinimages, or, in some cases, of replay attacks carried outwith digital displays [61]. In allcases, almost perfect error rates are achieved, thereby indicating that such PAIs canbe easily detected with the current techniques. However, the applications of fingervein-based PAD are not limited to finger vein recognition. In fact, the developmentof multimodal capture devices which are able to acquire both finger vein images orvideos, and finger photos, opens new lines of research [62]: biometric recognitioncan be based on fingerprints extracted from the photos, and PAD techniques can bedeveloped for the finger vein data. This approach is being currently followed in theBATL project [6] within the US Odin research program [55]: among other sensors,finger vein images are used to detect fingerprint presentation attacks. As with theaforementioned finger vein print outs, it has already been shown that fingerprints canbe recovered even from the stored ISO templates [18], and then be transformed intoa PAI, which is recognised as a fingerprint. However, most fingerprint PAIs do nottake into account the blood flow, which is also harder to simulate. On the other hand,the finger vein printed images analysed in the finger vein PAD literature will not beable to fool the fingerprint scanner, as it contains no fingerprint. We can thereforealso include a finger vein PAD module in multimodal finger sensors designed forfingerprint recognition, thereby making it harder for an eventual attacker to design aPAI which is able to bypass both sensors.
In this chapter, we will first summarise in Sect. 14.2 the main concepts and evalu-ation metrics for biometric PAD defined in the recent ISO/IEC 30107 standard [38,39]. The state of the art in fingervein and fingerprint PAD is subsequently reviewedin Sect. 14.3. We will then describe the multimodal sensor developed in the BATLproject and the proposed approach to finger vein-based PAD to detect fingerprint PAIs(Sect. 14.4). The proposedmethod is evaluated according to the ISO/IEC 30107 stan-dard [39] in Sect. 14.5. The chapter ends with the final discussion and conclusionsin Sect. 14.6.
14.2 Presentation Attack Detection
Presentation attacks are defined within the ISO/IEC 30107 standard on biometricpresentation attack detection [38] as the “presentation to the biometric data capturesubsystem with the goal of interfering with the operation of the biometric system”.The attacker may aim at impersonating someone else (i.e. impostor) or avoidingbeing recognised due to black-listing (i.e. identity concealer).
438 J. Kolberg et al.
In the following, we include the main definitions presented within the ISO/IEC30107-3 standard on biometric presentation attack detection—part 3: testing andreporting [39], which will be used throughout the chapter:
• Bona fide presentation: “interaction of the biometric capture subject and the bio-metric data capture subsystem in the fashion intended by the policy of the biometricsystem”. That is, a normal or genuine presentation.
• Attack presentation/presentation attack: “presentation to the biometric data cap-ture subsystem with the goal of interfering with the operation of the biometricsystem”. That is, an attack carried out on the capture device to either conceal youridentity or impersonate someone else.
• Presentation Attack Instrument (PAI): “biometric characteristic or object used ina presentation attack”. For instance, a silicone 3D mask or an ecoflex fingerprintoverlay.
• PAI species: “class of presentation attack instruments created using a commonproduction method and based on different biometric characteristics”.
In order to evaluate the vulnerabilities of biometric systems to PAs, the followingmetrics should be used:
• Impostor Attack Presentation Match Rate (IAPMR): “proportion of impostorattack presentations using the same PAI species in which the target referenceis matched”.
• Attack Presentation Classification Error Rate (APCER): “ proportion of attackpresentations using the same PAI species incorrectly classified as bona fide pre-sentations in a specific scenario”.
• Bona Fide Presentation Classification Error Rate (BPCER): “ proportion of bonafide presentations incorrectly classified as presentation attacks in a specific sce-nario”.
Derived from the aforementioned metrics, a global measure can be computed foran easier benchmark across different systems: the Detection Equal Error Rate (D-EER). It is defined as the error rate at the operating point where APCER = BPCER.
14.3 Related Works
In addition to the initial review of the existing works on finger vein PAD presentedin the introductory chapter, we first survey those works in detail, further discussingthe PAI species analysed and the detection performance achieved (see Sect. 14.3.1).We subsequently summarise in Sect. 14.3.2 the most relevant works on fingerprintPAD, since our main aim is to detect fingerprint PAIs with finger vein images. Formore details and a more extensive survey on fingerprint PAD, the reader is referredto [47, 67].
14 Presentation Attack Detection for Finger Recognition 439
14.3.1 Finger Vein Presentation Attack Detection
A summary of the most relevant works in finger vein PAD is presented in Table14.1,classified according to the feature types extracted (handcrafted versus deep learning)and the publication year. In addition, the main performance metrics over the selecteddatabase is reported.
As mentioned in Sect. 14.1, research on finger vein recognition is relatively new.As a direct consequence, the pioneering work on finger vein PAD was publishedas recent as in 2013 [51]. Nguyen et al. proposed the combination of features inboth spatial and frequency domains through the Fourier and two different wavelettransforms (i.e. Haar and Daubechies). They achieved a D-EER as low as 1.5% intheir experiments on a self-acquired database comprising both bona fides and a singlePAI species: printed finger vein images.
One year later, in 2014, Tome et al. analysed in-depth the vulnerabilities of fin-ger vein recognition systems to PAs, revealing an alarming IAPMR up to 86% forsimple print outs of vein images [76]. This study motivated Tome et al. to organisethe first competition on finger vein PAD in 2015 [75]. In addition to the baselinesystem developed at Idiap,5 three teams participated, proposing different approachesto detect the PAs, namely: (i) Binarised Statistical Image Features (BSIF), (ii) amonogenic global descriptor to capture local energy and local orientation at coarselevel and (iii) a set of local descriptors including Local Binary Patterns (LBP), LocalPhase Quantisation (LPQ), a patch-wise Short-time Fourier transform (STFT) and aWeber Local Descriptor (WLD). In all cases, the final classification was carried outwith Support Vector Machines (SVMs), achieving remarkable detection rates with alow complexity. Another byproduct of the competition was the establishment of theIdiap Research Institute VERA Fingervein Database [77] as a benchmark for fingervein PAD (see Table14.1) with a single PAI species: printed images. This, in turn,motivated the biometrics community to pursue the development of more efficientPAD techniques.
Also in 2015, Raghavendra et al. [60] analysed short video sequences with the aidof Eulerian video magnification [78]. The goal was to amplify the blood flow andthus detect the printed artefacts. They compared the newly proposed method withreimplementations of the algorithms presented in [75] over a self-acquired database:the ACER was reduced 5 to 23 times, thus proving the soundness of the proposedapproach. In the same year, Tirunagari et al. proposed the use of Dynamic ModeDecomposition (DMD), which is a mathematical method developed to extract infor-mation from non-linear complex fluid flows [71]. They designed a windowed DMDtechnique in order to extract micro-texture information from a single image, whichis decomposed into its maximum variance at column level, and the correspondingresidual or noise image. Using SVMs for classification over the VERA DB, theyachieved D-EERs outperforming other texture descriptors.
As for other biometric characteristics, texture patterns have been extensivelyanalysed for finger vein PAD. In addition to the approaches presented in [71, 75],
5http://www.idiap.ch/en/scientific-research/biometrics-security-and-privacy.

440 J. Kolberg et al.
Table14.1
Summaryof
themostrelevant
methodologies
forfin
gervein
presentatio
nattack
detection.
Forperformance
evaluatio
n,themetrics
aretheon
esrepo
rted
intheartic
les,where
“Acc.”stands
fordetectionaccuracy
Category
Year
References
Descriptio
nPerformance
Database
Hand-crafted
2013
[51]
FFT,
HaarandDaubechieswavelets+Fu
sion
D-EER
≥1.5%
OwnDB
[60]
Video
analysiswith
Eulerian
APC
ER=5.20%
OwnDB
Video
Magnification(EVM)
BPC
ER=2.00%
[61]
Steerablepyramids
APC
ER=2.4%
OwnDB
BPC
ER=0.4%
2015
[75]
BSIF
APC
ER=0%
VERA(full)
BPC
ER=8.00%
Monogenicscalespacebasedtexturedescriptors
APC
ER=0%
BPC
ER=0%
LBP,LPQ
,STFT
,WLD
APC
ER=0%
BPC
ER=0%
[71]
Windowed
DMDas
micro-texture
descriptor
D-EER=0.08%
2016
[44]
LBPExtensions
Acc
≥95%
2017
[7]
ImageQualityAssessm
ent+
Fusion
Acc
≈99.8%
2018
[58]
TotalV
ariatio
nDecom
positio
n+LBP
APC
ER=0%
BPC
ER=0%
Deeplearning
2017
[59]
FPNet(ad-hocCNN)
APC
ER=0%
BPC
ER=0%
[52]
D-CNN(A
lexN
etor
VGG-16)
+PC
A+SV
MAPC
ER=0%
BPC
ER=0%
2018
[63]
D-CNN(A
lexN
et)+LDAor
SVM
APC
ER=1.82%
/0%
OwnDB
BPC
ER=0%

14 Presentation Attack Detection for Finger Recognition 441
Raghavendra and Busch included a new PAI species in a subsequent work [61]: asmartphone display. In this case, they considered the residual high frequency bandextracted from steerable pyramids and a SVM, achieving again ACERs around 3%.The following year, Kocher et al. thoroughly analysed different LBP extensions in[44], to finally conclude that the baseline LBP technique performs as good as its“improvements”. Finally, in a combined approach, Qiu et al. used total variationdecomposition to divide the finger vein sample into its structural and noise compo-nents [58]. Using again LBP descriptors and SVMs, they achieved a perfect detectionaccuracy with APCER = BPCER = 0% over the VERA DB.
Another approach followed for PAD, in general, is based on the use of image qual-ity assessment [21]. This techniquewas also analysed byBhogal et al. in [7] for fingervein. In particular, they considered six different measures and their combinations,achieving a detection accuracy over 99%.
Finally, in the last years, Deep Learning (DL) has become a thriving topic [33],allowing computers to learn from experience and understand the world in termsof a hierarchy of simpler units. This way, DL has enabled significant advances incomplex domains such as natural language processing [69], computer vision [81],biometric recognition in general, and finger vein PAD in particular. In this context,in 2017, Qiu et al. designed a new Convolutional Neural Network (CNN) for fingervein PAD, which they named FPNet [59]. This network achieved a perfect detectionaccuracy over the VERA DB. In the same year, Nguyen et al. used two differentpre-trained models (i.e. AlexNet [46] and VGG-16 [66]) for the same task. Afterextracting the features with these nets, Nguyen et al. reduced their dimensionalitywith Principal Component Analysis (PCA) and used SVMs for final classification.Again, a perfect detection rate over the VERADBwas reported. In a similar fashion,Raghavendra et al. analysed in [63] the use of AlexNet with Linear DiscriminantAnalysis (LDA) and SVMs for classification purposes, also achieving perfect errorrates over a self-acquired database.
14.3.2 Fingerprint Presentation Attack Detection
The excellent performance of the finger vein PAD methods described above hasmotivated us to also use finger vein images to detect fingerprint PAIs. However, letus first review the state of the art in fingerprint PAD. Given the vast number of articlesstudying this problem,wewill summarise themost relevant ones for the present studyand refer the reader to [47, 67, 72] for more comprehensive reviews.
In general, PAD approaches can be broadly classified into two categories:software-based methods perform a deeper analysis of the captured data to distin-guish between bona fide and attack presentations, hardware-based setups make useof information captured by additional sensors. In contrast to the younger finger veinPAD research field, where only the former have been studied so far, for fingerprintPAD both approaches have been followed. Tables14.2 and 14.3 provide a summaryof the reviewed works, classified into soft- and hardware-based approaches. In addi-

442 J. Kolberg et al.
Table 14.2 Summary of the most relevant methodologies for software-based fingerprint presen-tation attack detection. For performance evaluation, the metrics are the ones reported in the articles,where CCR stands for correct classification rate and ACER for average classification error rateYear References Description Performance #PAI Database
2007 [11] Score fusion of pore spacing,noise, and statisticalproperties
CCR = 85.2% 1 Own DB
2008 [53] LBP texture and waveletenergy fusion
CCR = 97.4% 2 Own DB
2011 [17] Closed sweat pore extraction APCER = 21.2% 4 Own DB
BPCER = 8.3%
[50] Active sweat porelocalisation
N/A 0 BFBIG-DB1
2014 [22] 25 image quality metrics APCER < 13% 3 LivDet 2009
BPCER ≤ 14%
[40] Multiscale LBP D-EER = 7.52% 7 LivDet 2011
2016 [54] Pre-trained CNNs (Best:VGG)
ACER = 2.90% 8 LivDet 2009-13
2017 [32] Bag of Words and SIFT APCER = 5% 7 LivDet 2011
BPCER = 4.3%
2018 [41] LBP extracted fromGaussian pyramids (PLBP)
ACER = 21.21% 7 LivDet 2013
[12] Minutiae-centred CNNseveral different scenarios
APCER < 7.3% 12 LivDet 2011-15,MSU-FPAD,PBSKD
BPCER = 1%
[13] Minutiae-centred CNNgeneralisation
APCER = 4.7% 12 MSU-FPAD,PBSKD
BPCER = 0.2%
tion, the number of PAI species and the main performance metrics over the selecteddatabases are reported.
A typical example of software-based approaches is the detection of sweat poresin high-resolution fingerprint images [11, 17, 50]. Sweat pores are not visible inlatent fingerprints and, because of their tiny size, it is challenging to include them inartefacts. Therefore, the existence of sweat pores can be utilised as an indicator of abona fide sample.
Another classical approach, widely applied not only to fingerprint but to otherbiometric characteristics, is the extraction of textural information. Nikam and Agar-wal [53] were among the first ones in 2008 to analyse this kind of approaches. Onthe one hand, they extracted Local Binary Pattern (LBP) histograms to capture tex-tural details. On the other hand, the ridge frequency and orientation informationwere characterised using wavelet energy features. Both feature sets were fused andthe dimensionality reduced with the Sequential Forward Floating Selection (SFFS)algorithm. For classification, the authors utilised a hybrid classifier, formed by fusingthree classifiers: a neural network, SVMs and K-nearest neighbours. Over a self-

14 Presentation Attack Detection for Finger Recognition 443
Table 14.3 Summary of the most relevant methodologies for hardware-based fingerprint pre-sentation attack detection. For performance evaluation, the metrics are the ones reported in thearticles
Year References Description Performance #PAI Database
2011 [34] Multi-spectral blanchingeffect, pulse
APCER = 0% 4 Own DB
BPCER = 0%
2013 [15] Optical methods pulse,pressure, skin reflections
APCER = 10% N/A Own DB
BPCER < 2%
2018 [29] SWIR spectral signatures+ SVM
APCER = 5.7% 12 Own DB
BPCER = 0%
[73] SWIR + CNN APCER = 0% 12 Own DB
BPCER = 0%
[43] LSCI + SVM APCER = 15.5% 32 Own DB
BSIF, LBP, HOG,histogram
BPCER = 0.2%
[37] SWIR, LSCI +patch-based CNN
APCER = 0% 17 Own DB
BPCER = 0%
[30] Weighted score fusion +SVM SWIR, LSCI, vein
APCER = 6.6% 35 Own DB
BPCER = 0.2%
2019 [72] SWIR + CNN fusion(pre-trained and fromscratch)
APCER ≈ 7% 35 Own DB
BPCER = 0.1%
[31] Fusion of: SWIR + CNNand LSCI + hand-craftedfeatures
APCER ≤ 3% 35 Own DB
BPCER ≤ 0.1%
acquired database comprising two different PAI fabrication materials and severalmould materials, an overall classification rate up to 97.4% is reported.
In 2009, the LivDet competition series on fingerprint and iris started in a bi-annual basis [25]. The datasets provided quickly became the de facto standard forfingerprint PAD evaluations. For instance, Jia et al. [40] continued the research linebased on texture information and proposed the use of two different variants of multi-scale LBP in combination with SVMs. Over the LivDet 2011 dataset, their methodachieved aD-EERof 7.52%.More recently, Jiang et al. presented another approach toextract LBP features from multiple scales in [41]. In particular, a Gaussian pyramidwas constructed from the input samples and the corresponding LBP histograms,extracted from three different levels, were classified using an SVM. Achieving an

444 J. Kolberg et al.
ACERof 21%over theLivDet 2013 dataset, thismethod outperformed the algorithmspresented in the competition.
In a more general approach, Galbally et al. [22] use 25 complementary imagequality features to detect presentation attacks for face, iris and fingerprint on legacydata. Regarding fingerprint, they compare their approach with other state-of-the-artmethods on the LivDet 2009 fingerprint database, which includes three different PAIspecies. Their results are competitive for 2014 and even outperform some previouslypublished PAD algorithms on the same dataset. Their main advantage is its indepen-dency of the modality, and, additionally, the method is “simple, fast, non-intrusive,user-friendly, and cheap”.
All the aforementioned approaches focus on the basic scenario where all PAIspecies in the test set are also included in the training test. However, a more realis-tic, and challenging, scenario should include additional “unknown attacks”, or PAIspecies only used for testing purposes. In such a case, the detection performanceusually decreases. To tackle this issue, Gonzalez-Soler et al. analysed in [32] theuse of the Bag of Words feature encoding approach applied to local keypoint-baseddescriptors (dense Scale Invariant Feature Transform, SIFT). They compare theirdetection performance with other existing methods using feature descriptors, withno encoding schemes, and show a relative 25% improvement on the average AverageClassification Error Rate (ACER, the performance metric used in the LivDet com-petitions) over the LivDet 2011 with respect to the state of the art. In addition, theypresent a fully compliant ISO evaluation in terms of APCER and BPCER for the firsttime for the LivDet datasets.
In contrast to the handcrafted approaches mentioned above, most of the newestapproaches rely on deep learning. One of the first works directly related to fingerprintPAD based on conventional capture devices (i.e. a software-based method), wascarried out by Nogueira et al. [54]. In more details, the following three CNNs weretested: (i) the pre-trained VGG [66], (ii) the pre-trained Alexnet [46] and (iii) a CNNwith randomly initialisedweights and trained from scratch. The authors benchmarkedtheACERobtainedwith the networks over the LivDet 2009, 2011 and 2013 databasesto a classical state of the art algorithm based on LBP. The best detection performanceis achieved using a VGG pre-trained model and data augmentation (average ACER= 2.9%), with a clear improvement with respect to LBP (average ACER = 9.6%).It should be also noted that the ACER decreased between 25% and 50% (relativedecrease) for all three networks tested when data augmentation was used.
More recently, Chugh et al. presented the current state of the art for the LivDetdatasets in [12], and they evaluated it onmultiple publicly available datasets includingthree LivDet datasets (2011, 2013, 2015), aswell as their own collected and publishedMSU-FPAD and Precise Biometric Spoof-Kit datasets (PBSKD), which includein total 12 PAI species and more than 20000 samples. The so-called FingerprintSpoof Buster [12] is a convolutional neural network (CNN) based onMobileNet [35],which is applied to minutiae-centred patches. Splitting the CNN input into patchesallows them to train the network from scratch without over-fitting. They evaluateseveral different test scenarios and outperform other state-of-the-art approaches onthe LivDet datasets. In a subsequent work [13], the Fingerprint Spoof Buster’s gen-

14 Presentation Attack Detection for Finger Recognition 445
eralisation capability is analysed by applying a leave-one-out protocol on all 12 PAIspecies from the MSU-FPAD and PBSKD datasets. They observe that some materi-als are harder to detect when not included during training and specify an optimisedtraining set comprising six of twelve PAIs. The testing results in an APCER of 4.7%at a BPCER of 0.2%.
Even if the aforementioned works manage to achieve remarkably low error rates,PAD can also benefit from information captured by additional sensors, as any otherpattern recognition task. To that end, some hardware-based approaches utilise dif-ferent illumination techniques or capture the pulse frequencies. Hengfoss et al. [34]analysed in 2011 the reflections for all wavelengths between 400 and 1650nm onthe blanching effect. This effect appears when the finger is pressed against a surfaceand the blood is squeezed out due to the compression of the tissue. Furthermore,they utilise pulse oximetry but admit that this approach takes more time and thus isless desirable for PAD. They manage to correctly distinguish living fingers, cadaverfingers and three PAIs for both methods, and conclude that those dynamic effects(i.e. blanching and pulse) only occur for living fingers. Two years later, Drahanskyet al. [15] proposed new optical handcrafted PAD methods for pulse, colour changeunder pressure and skin reflection for different wavelengths (470, 550 and 700 nm).These methods are evaluated on a database comprising 150 fingerprints, achievingthe best results for the wavelength approach. Additionally, they analyse 11 differ-ent skin diseases that could occur on the fingertip. However, the influence on thedetection performance was not tested.
Over the last five years, it has been shown that the skin reflection within theShort-wave Infrared (SWIR) spectrum of 900–1700 nm are independent from theskin tone. This fact was first analysed by NIST [14] and later on confirmed by Steineret al. [68] for face PAD. Building upon the work of [68], Gomez-Barrero et al. [29]apply the spectral signature concept first developed for facial images to fingerprintPAD. Their preliminary experiments, over a rather small database, show that mostmaterials, except for orange play doh, respond different than human skin in the SWIRwavelengths of 1200, 1300, 1450 and 1550 nm. However, with the use of fine-tunedCNNs, also the orange play doh is correctly classified in a subsequent work [73]. In afollow-up study [72], Tolosana et al. benchmark both pre-trained CNN models, anddesign and train a new residual CNN from scratch for PAD purposes for the sameSWIR data. Over a larger dataset including 35 different PAI species and more than4700 samples, they show that a combination of two different CNNs can achieve aremarkable performance: an APCER around 7% for a BPCER of 0.1%. In addition,the evaluation protocol includes 5 PAI species considered only for testing, therebyproving the soundness of their approach even in the presence of unknown attacks.
Additionally, it has been shown that Laser Speckle Contrast Imaging (LSCI)can be used for PAD purposes [43]. The LSCI technique comes from biomedicalapplications, where it has been applied to visualise and monitor microvascular bloodflow inbiological tissues, such as skin and retina [65].Keilbach et al. capture the bloodmovement beneath the skin to differentiate living fingers from presentation attacks in[43]. However, the utilised laser also penetrates thin transparent fingerprint overlays,thereby detecting the underlying blood flow and falsely classifying the presentation
446 J. Kolberg et al.
as a bona fide one. Therefore, for a BPCER of 0.2% (system focused on the userconvenience), the APCER increases to 15.5%.
Combining SWIR andLSCI, Hussein et al. [37] use a patch-basedCNN to classifymulti-spectral samples from both domains. For both techniques, low error rates arereported and a combined fusion achieves a perfect detection performance over adatabase compromising 551 bona fides and 227 PAs, including 17 different PAIspecies.
Further research by Gomez-Barrero et al. [30] applies a score-level fusion methodbased on handcrafted features to benefit from different domains, including SWIR,LSCI and vein images. Their training set comprises only 136 samples in order toevaluate the approach on 4531 samples in the test set containing 35 different PAIspecies. The weights for the fusion are computed on 64 samples of the developmentset. An APCER < 10% for a BPCER = 0.1% is reported, as well as an APCER of6.6% for a BPCER = 0.2%, thus yielding secure systems even for very low BPCERs.
Lastly, in a subsequent work by Gomez-Barrero et al. [31], the SWIR CNNapproaches proposed in [72] are combined with an enhancement of the handcraftedfeatures extracted from the LSCI data in [43]. This combined approach, tested onthe same database comprising 35 different PAI species, shows a clear improvementon the detection capabilities of the proposed method, even if only 2 sets of imagesare used (i.e. reduced capture device cost): the D-EER is reduced from 2.7 to 0.5%.
14.4 Proposed Finger Vein Presentation Attack Detection
As indicated in Sect. 14.1, we will now focus on the development of PAD techniquesbased on finger vein data, in order to detect fingerprint PAIs. It should be noted thatthe PAD algorithm can process data that is captured simultaneously with a singlecapture device from both the finger vein and the fingerprint. Otherwise, if the capturewith both sensors was done sequentially, the attacker might exchange the PAI usedfor fingerprint verification with his bona fide finger for the PAD capture process.Therefore, in this section, we first describe a multimodal capture device which is ableto acquire both fingerprint and finger vein images (Sect. 14.4.1). We subsequentlypresent an efficient PADmethod applied to the finger vein data in Sect. 14.4.2. Giventhat some fingerprint overlays may still reveal part of the vein structure, wewill focuson texture analysis to detect PAs in a real-time fashion using a single image.
14.4.1 Multimodal Finger Capture Device
Given the requirement to capture both fingerprint and finger veins, a contact-lessmul-timodal capture device is used to acquire photos of fingerprints aswell as finger veins.A diagram of the inner components of the capture device is depicted in Fig. 14.1. Asit may be observed, the camera and illumination boards are placed inside a closed

14 Presentation Attack Detection for Finger Recognition 447
Fig. 14.1 Sensor diagram: a box, with a slot in the middle to place the finger, encloses all thecomponents: a single camera, two sets of LEDs for visible (VIS) and NIR illumination and the lightguide necessary for the finger vein capture (more details in Sect. 14.4.1.2)
(a) Finger vein (NIR) sample. (b) Finger photo (VIS) sample.
Fig. 14.2 Full bona fide samples as they are captured by the camera
box, which includes an open slot in the middle. When the finger is placed there, allambient light is blocked and therefore only the desired wavelengths are used for theacquisition of the images. In particular, we have used a Basler acA1300-60gm Near-infrared (NIR) camera, which captures 1280 × 1024 px. images, with an EdmundsOptics 35mm C Series VIS-NIR Lens. This camera is used for both frontal visible(VIS) light images and NIR finger vein samples (see the following subsections formore details on each individual sensor).
An example finger photo as it is captured by the camera is shown in Fig. 14.2,for both the finger vein and the finger photo acquisition. As it can be seen, the
448 J. Kolberg et al.
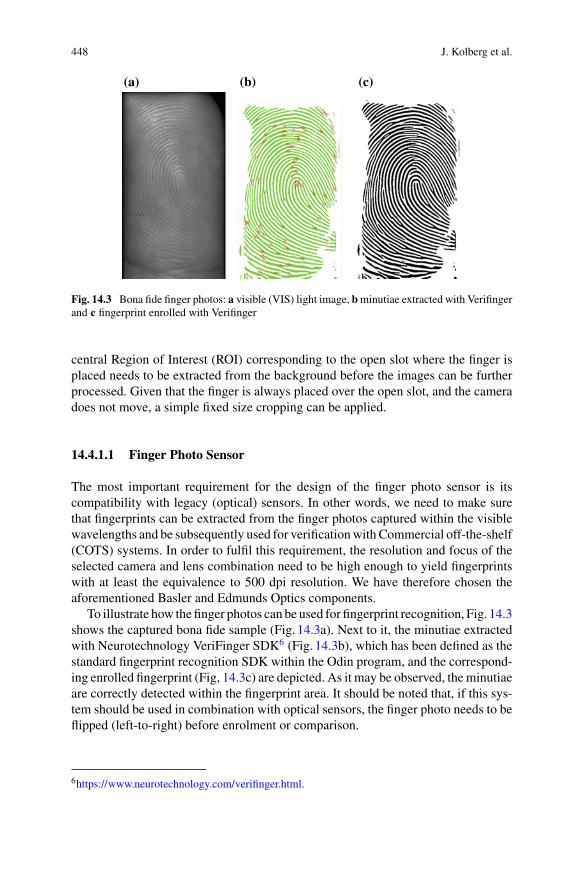
(a) (b) (c)
Fig. 14.3 Bona fide finger photos: a visible (VIS) light image, bminutiae extracted with Verifingerand c fingerprint enrolled with Verifinger
central Region of Interest (ROI) corresponding to the open slot where the finger isplaced needs to be extracted from the background before the images can be furtherprocessed. Given that the finger is always placed over the open slot, and the cameradoes not move, a simple fixed size cropping can be applied.
14.4.1.1 Finger Photo Sensor
The most important requirement for the design of the finger photo sensor is itscompatibility with legacy (optical) sensors. In other words, we need to make surethat fingerprints can be extracted from the finger photos captured within the visiblewavelengths and be subsequently used for verificationwith Commercial off-the-shelf(COTS) systems. In order to fulfil this requirement, the resolution and focus of theselected camera and lens combination need to be high enough to yield fingerprintswith at least the equivalence to 500 dpi resolution. We have therefore chosen theaforementioned Basler and Edmunds Optics components.
To illustrate how thefinger photos can be used for fingerprint recognition, Fig. 14.3shows the captured bona fide sample (Fig. 14.3a). Next to it, the minutiae extractedwith Neurotechnology VeriFinger SDK6 (Fig. 14.3b), which has been defined as thestandard fingerprint recognition SDK within the Odin program, and the correspond-ing enrolled fingerprint (Fig, 14.3c) are depicted. As it may be observed, theminutiaeare correctly detected within the fingerprint area. It should be noted that, if this sys-tem should be used in combination with optical sensors, the finger photo needs to beflipped (left-to-right) before enrolment or comparison.
6https://www.neurotechnology.com/verifinger.html.

14 Presentation Attack Detection for Finger Recognition 449
Fig. 14.4 Bona fide fingervein ROI, of size 830 × 240px
14.4.1.2 Finger Vein Sensor
The finger vein capture device comprises three main components, namely: (i) a NIRlight source behind the finger with 20 LEDs of 940 nm, (ii) the corresponding NIRcamera and lens and (iii) an elevated physical structure to obtain the adequate amountof light.
It should be noted that, in order to capture high-quality finger vein samples, it isvital to let only the right amount of light intensity penetrate through the finger. Toachieve the correct amount of light transmission, a physical structurewith elevation isplaced to concentrate the light intensity to the specified area, referred to in Fig. 14.1as “light guide”. The subject interacts with the sensor by placing a finger on thesmall gap provided between the NIR light source and the camera. The NIR spectrallight is placed facing the camera in a unique way, so that the light emitting from theNIR spectrum penetrates through the finger. Since the haemoglobin blocks the NIRillumination, the veins appear as darker areas in the captured image. A sample imageis depicted in Fig. 14.4, where the veins are clearly visible even before preprocessingthe sample.
14.4.2 Presentation Attack Detection Algorithm
As mentioned at the beginning of this Section, we will focus on texture analysis ofthe finger vein samples in order to discriminate bona fide samples from presentationattacks. To that end, we have chosen a combination of Gaussian pyramids and LocalBinary Patterns (LBP), referred to as PLBP, which was proposed in [57] as a generaldescriptor. The main advantage of this texture descriptor lies on the fact that, byextracting the LBP features from the hierarchical spatial pyramids, texture informa-tion at different resolution levels can be considered. In fact, the PLBP approach wasused in [41] for fingerprint PAD over the LivDet 2013 DB [24], achieving resultswithin the state of the art for only three pyramid levels. In order to analyse the influ-ence of the different pyramid levels, we compare the results using up to 16 pyramidlevels.
The flowchart of the proposed method is shown in Fig. 14.5. First, the Gaussianpyramids are computed from the original cropped image or ROI (see Fig. 14.4).Subsequently, LBP images are generated for every pyramid level, resulting in thePLBP images. Then, histograms are computed from the PLBP images and classified

450 J. Kolberg et al.
Fig. 14.5 General diagramof the proposedPADalgorithm.From thefinger vein photo, theGaussianpyramid is computed first, then LBP is applied and the corresponding histogram serves as input tothe SVM classifier
(a) (b)
Fig. 14.6 Illustration of example pyramids for: a Gaussian pyramid of vein images and b LBPimages of this Gaussian pyramid
with a Support Vector Machine (SVM). Each step is described in more detail in thefollowing paragraphs.
Gaussian pyramids. For multi-resolution analysis, lowpass pyramid transformsare widely used [8]. In particular, the Gaussian blur lowpass filter can be used todown-sample theoriginal image.This step canbe repeated toget continuously smallerimages, resembling a pyramid, as depicted in Fig. 14.6. In practice, one pixel of thedown-sampled image corresponds to a fixed size area of the previous pyramid level,thereby losing information the further up we go into the pyramid. However, in ourimplementation, all levels of the pyramid have the same size, which is obtained byup-sampling the output image in each iteration. As a consequence, the higher levelimages appear blurrier.
It should be highlighted that, in our implementation, different pyramids with up to16 levels are created. This allows us to determine how the PAD performance changewhen more levels of the pyramid are used.
Local Binary Patterns (LBP). Local binary patterns were introduced in [56] asa simple but efficient texture descriptor. Its computational simplicity and greyscaleinvariance are the most important properties of LBP. The algorithm compares neigh-bouring pixels and returns the result as a binary number, which is in turn stored asa decimal value. The process is illustrated in Fig. 14.7 for a radius of 1 pixel (3 × 3block). It should be noted that the binary representation can also be flipped and thedirection and starting point of reading the binary number does not matter as long

14 Presentation Attack Detection for Finger Recognition 451
182 179 186
179 181 192
176 180 183
1 0 1
0 1
0 0 1
101110002 18410
Fig. 14.7 LBP computation: Comparing the central pixel (orange) to each neighbouring pixelresults in a binary representation. The binary values are converted to a decimal number, which isstored in the resulting LBP image instead of the original central pixel
(a) 1st Pyramid level (b) 6th Pyramid level
(c) 11th Pyramid level (d) 16th Pyramid level
Fig. 14.8 Resulting bona fide LBP images of different Gaussian pyramid levels (i.e. PLBP images)
as it is fixed for the whole system (otherwise, the extracted feature would not becomparable). An example of the four selected PLBP images of the bona fide sampleshown in Fig. 14.4 is presented in Fig. 14.8.
Classification. In order to reduce the dimensionality of the feature vector, agreyscale histogram is computed from the resulting LBP images. Subsequently, lin-ear SVMs are used to classify the extracted histograms. These SVMs rely on a mainparameter, C , which can be tuned for an optimal performance. Intuitively, the Cparameter trades off misclassification of training examples against simplicity of thedecision surface. A low C makes the decision surface smooth, while a high C aimsat classifying all training examples correctly by giving the model freedom to selectmore samples as support vectors.
In addition, we benchmark two SVM approaches, as shown in Fig. 14.9 for thesimple case of three pyramid levels. On the one hand, we use separate SVMs foreach pyramid level (Fig. 14.9a). On the other hand, we utilise a single SVM for allpyramid levels (Fig. 14.9b). Both setups produce one label per pyramid level andthen apply a majority vote on the corresponding SVM outputs in order to reach afinal decision.

452 J. Kolberg et al.
Finger veinPLBP
histograms SVM
SVM
SVM
Majority Vote(mean) BF
PA
(a) Separate SVMs for 3 pyramid levels.
Finger veinPLBP
histograms SVMMajority Vote
(mean) BF
PA
(b) Single SVM for 3 pyramid levels.
Fig. 14.9 Diagram of the two SVM approaches on the example of 3 pyramid levels
14.5 Experimental Evaluation
With the aim of analysing the suitability of the proposedmethod for finger vein-basedPAD, several experiments were carried out using an identical experimental protocol.Our training and test sets are completely disjoint in order to avoid biased results.Furthermore, in order to allow reproducibility of the experiments, preprocessing andfeature extraction are based on the bob toolkit [4, 5].
14.5.1 Experimental Set-Up
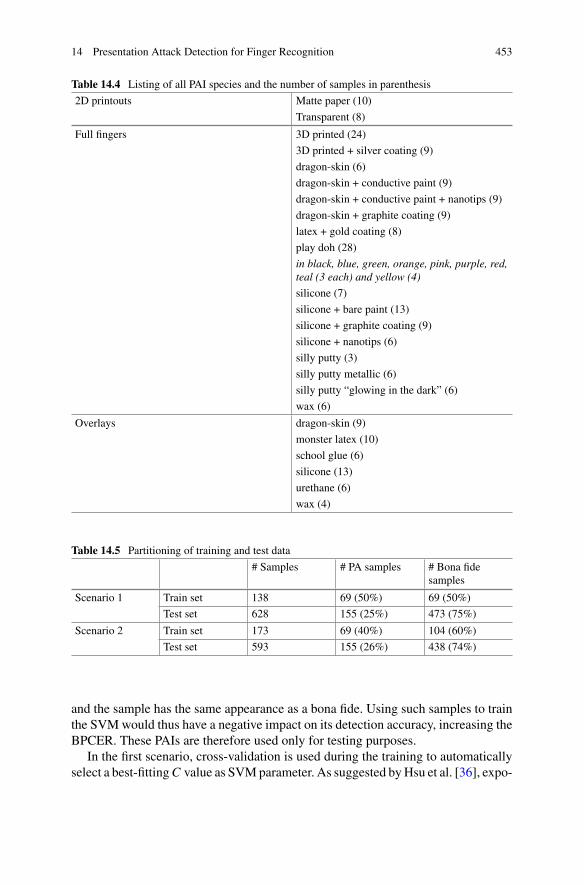
The captured dataset comprises 766 samples including 542 bona fides and 224 pre-sentation attacks, stemming from 32 different PAI species. The PAs can be classifiedinto three categories, namely: (i) 2D printouts, (ii) full fingers and (iii) overlays,whereby 2D printouts can also be used as an overlay during the presentation. Adetailed listing of all PAIs from the database is presented in Table14.4.
All samples were captured within the BATL project with our project partners atthe University of Southern California. Note that the project sponsor has indicated thatthey will make the complete dataset available in the near future such that researchresults presented in this work can be reproduced.
We have additionally considered two test scenarios (see Table14.5). The first oneuses the same number of bona fides and PAs in the training set (69 samples each). Toincrease the robustness on the detection of bona fide presentations (i.e. minimise theBPCER), the second scenario adds additional 35 bona fide samples to the training set,thus reducing the test set. The partitioning for both scenarios is shown in Table14.5.Both approaches, using a single SVM or separated SVMs, are compared using thesame training and test sets for each scenario.
In more details, the training set comprises all different PAIs except from dragon-skin overlays, since this thin and transparentmaterial does not blockNIR illuminationas known from previous experiments [30]. As a consequence, all veins are visible
14 Presentation Attack Detection for Finger Recognition 453
Table 14.4 Listing of all PAI species and the number of samples in parenthesis
2D printouts Matte paper (10)
Transparent (8)
Full fingers 3D printed (24)
3D printed + silver coating (9)
dragon-skin (6)
dragon-skin + conductive paint (9)
dragon-skin + conductive paint + nanotips (9)
dragon-skin + graphite coating (9)
latex + gold coating (8)
play doh (28)
in black, blue, green, orange, pink, purple, red,teal (3 each) and yellow (4)
silicone (7)
silicone + bare paint (13)
silicone + graphite coating (9)
silicone + nanotips (6)
silly putty (3)
silly putty metallic (6)
silly putty “glowing in the dark” (6)
wax (6)
Overlays dragon-skin (9)
monster latex (10)
school glue (6)
silicone (13)
urethane (6)
wax (4)
Table 14.5 Partitioning of training and test data
# Samples # PA samples # Bona fidesamples
Scenario 1 Train set 138 69 (50%) 69 (50%)
Test set 628 155 (25%) 473 (75%)
Scenario 2 Train set 173 69 (40%) 104 (60%)
Test set 593 155 (26%) 438 (74%)
and the sample has the same appearance as a bona fide. Using such samples to trainthe SVMwould thus have a negative impact on its detection accuracy, increasing theBPCER. These PAIs are therefore used only for testing purposes.
In the first scenario, cross-validation is used during the training to automaticallyselect a best-fittingC value as SVMparameter. As suggested byHsu et al. [36], expo-

454 J. Kolberg et al.
nential growing sequences forC (2x )were testedwithin the range x = {−20, ..., 20}.However, due to the increased number of training samples for the second scenario,and consequently, the training time required, only the range x = {−20, ..., 8} hasbeen used to cross-validate scenario 2.
Finally, all results are reported in terms of the APCER and BPCER over the testset (see Sect. 14.2), in compliance with the ISO/IEC 30107-3 standard on biometricpresentation attack detection - part 3: testing and reporting [39].
It should be noted that establishing a fair benchmark with previous works in thestate of the art are difficult since this is the first approach to carry out fingerprint PADbased on finger vein samples.
14.5.2 Results
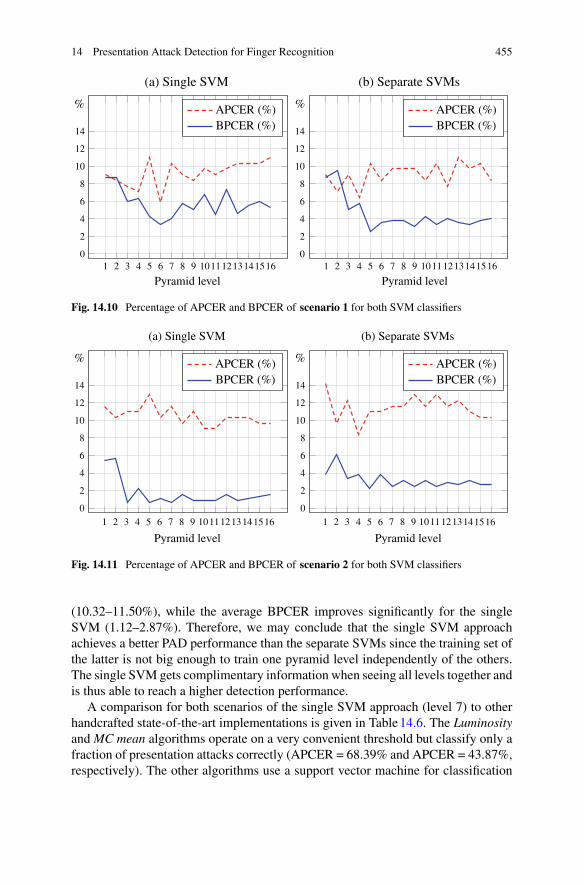
The results in terms of APCER (dashed) and BPCER (solid) for scenario 1 are plottedin Fig. 14.10, in order to facilitate the visualisation and comparison across differentpyramid levels. On the x-axis, the range of pyramid levels are given while the y-axisshows the error rates (in %). For the single SVM approach (Fig. 14.10a), both errorrates reach a minimum when using 6 pyramid levels, namely, BPCER = 3.38% andAPCER = 5.81%. On the other hand, for the separate SVM approach (Fig. 14.10b),the minimum of both error rates is reached at different levels, namely, BPCER =2.54% for the fifth level and APCER = 6.45% for the fourth level. This means that,depending on the application at hand (i.e. which error rate should be optimised),different levels may be selected. As it may be observed from Fig.14.10, the errorrates of the separate SVMs somewhat stabilise for using five or more pyramid levels,whereas the single SVMs show much more peaks and no stabilisation.
Regarding the aforementioned decision of prioritising one error rate over the otherone, it should be taken into account that a lowBPCER results in user convenience (i.e.a low number of bona fide presentation will be wrongly rejected). On the other hand,a low APCER will grant a more secure system (i.e. the number of non-detectedattacks will be minimised). One of the aims of the Odin program is achieving alow BPCER. To that end, we analyse the second scenario, for which more trainingsamples for the bona fide class are utilised in order to make the classifier more robust.The corresponding plots with the APCER and BPCER for every pyramid level arepresented in Fig. 14.11.
We can observe that the BPCER is significantly lower for all pyramid levels whencompared to scenario 1, reaching minimum values of 0.68% for the single SVM and2.28% for the separate SVMs. At the same time, the APCER stays similar to thatof scenario 1, thereby showing the soundness of increasing the number of bona fidesamples for training. Additionally, we can see that using only the first four levelsproduces higher peaks and higher error rates, thus making it unsuitable for PADpurposes. In turn, increasing the number of levels results in a decreasing BPCER, ascan be seen for the levels greater than four. Taking into account the pyramid levelsfive to sixteen, the average APCER is slightly lower for the single SVM approach
14 Presentation Attack Detection for Finger Recognition 455
(a) Single SVM
1 2 3 4 5 6 7 8 9 101112131415160
2
4
6
8
10
12
14
Pyramid level Pyramid level
% APCER (%)BPCER (%)
(b) Separate SVMs
1 2 3 4 5 6 7 8 9 101112131415160
2
4
6
8
10
12
14
% APCER (%)BPCER (%)
Fig. 14.10 Percentage of APCER and BPCER of scenario 1 for both SVM classifiers
(a) Single SVM
1 2 3 4 5 6 7 8 9 101112131415160
2
4
6
8
10
12
14
Pyramid level
% APCER (%)BPCER (%)
(b) Separate SVMs
1 2 3 4 5 6 7 8 9 101112131415160
2
4
6
8
10
12
14
Pyramid level
% APCER (%)BPCER (%)
Fig. 14.11 Percentage of APCER and BPCER of scenario 2 for both SVM classifiers
(10.32–11.50%), while the average BPCER improves significantly for the singleSVM (1.12–2.87%). Therefore, we may conclude that the single SVM approachachieves a better PAD performance than the separate SVMs since the training set ofthe latter is not big enough to train one pyramid level independently of the others.The single SVM gets complimentary information when seeing all levels together andis thus able to reach a higher detection performance.
A comparison for both scenarios of the single SVM approach (level 7) to otherhandcrafted state-of-the-art implementations is given in Table14.6. The LuminosityandMC mean algorithms operate on a very convenient threshold but classify only afraction of presentation attacks correctly (APCER = 68.39% and APCER = 43.87%,respectively). The other algorithms use a support vector machine for classification

456 J. Kolberg et al.
Table 14.6 Comparison of the proposed method to state-of-the-art implementations
Algorithm Scenario 1 Scenario 2
APCER BPCER APCER BPCER
Luminosity [30] 68.39 0.00 68.93 0.00
MC mean [30] 43.87 0.21 43.87 0.23
MChistogram [30]
13.55 9.51 12.90 8.22
BSIF [42] 28.39 5.71 26.45 4.57
LBP [56] 10.32 1.90 11.61 1.14
Proposed PLBP(lvl 7)
10.32 4.02 11.61 0.68
and present lower APCERs. However, in some cases, the BPCER raises to nearly10%. In particular, theMChistogram achieves an APCER between 12 and 14%whilethe BPCER is between 8 and 10%. In contrast, the BSIF implementation results ina BPCER of around 5% at the cost of a higher APCER (26–29%). The results ofthe plain LBP implementation and the proposed PLBP implementation are identicalregarding APCER but differ in the BPCER. Whereas for scenario 1 LBP provides abetter BPCER of 1.9% compared to 4.02%, the proposed PLBP approach reducesits BPCER in scenario 2 to 0.68% in contrast to 1.14% for LBP. Therefore, wecan see that our PLBP algorithm achieves the best results for scenario 2 while it isoutperformed by LBP in scenario 1. The score files from all tests in this chapter arefreely available.7
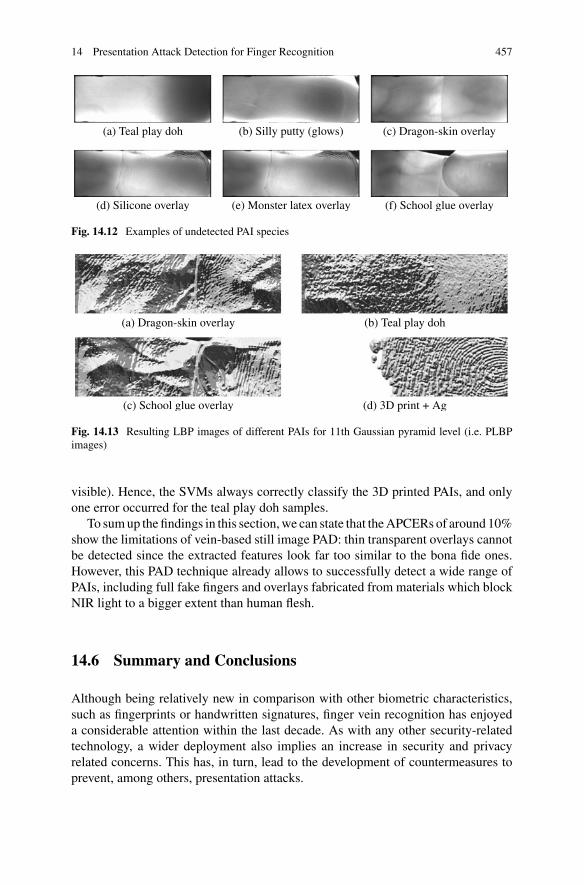
Even if the results are promising, reaching an APCER ≈ 10% for BPCER ≈ 1%,where also unknown attacks (i.e. only used for testing and not seen by the classifier attraining) are considered, there is still room for improvement. In particular, a deeperanalysis of the results shows that a remarkable number of misclassified PAIs aretransparent overlays made of dragon-skin, silicone, monster latex, school glue orwax. In addition, two types of full fake fingers also managed to deceive the PADalgorithm in some cases, namely, glow-in-the-dark silly putty, and one of the samplesacquired from a teal play doh finger. Some samples that were not detected are shownin Fig. 14.12. As we may observe, especially for the dragon-skin (c) and the schoolglue (f) overlays, the samples are very similar to the bona fide sample shown inFig. 14.4. In particular, the vein structure can be clearly seen.
Finally, Fig. 14.13 shows the 11th level of PLBP images for (a) a dragon-skinoverlay, (b) a teal play doh finger, (c) a school glue overlay and (d) a 3D printedfinger with silver coating. Comparing these samples with the bona fide one fromFig. 14.8, we can see the high similarities for the transparent overlays in (a) and (c).However, the teal play doh and the 3D printed finger have different patterns (i.e. the3D printed finger does not block the NIR light at all, only the silver-coated part is
7https://dasec.h-da.de/research/biometrics/presentation-attack-detection-for-finger-recognition/.
14 Presentation Attack Detection for Finger Recognition 457
(a) Teal play doh (b) Silly putty (glows) (c) Dragon-skin overlay
(d) Silicone overlay (e) Monster latex overlay (f) School glue overlay
Fig. 14.12 Examples of undetected PAI species
(a) Dragon-skin overlay (b) Teal play doh
(c) School glue overlay (d) 3D print + Ag
Fig. 14.13 Resulting LBP images of different PAIs for 11th Gaussian pyramid level (i.e. PLBPimages)
visible). Hence, the SVMs always correctly classify the 3D printed PAIs, and onlyone error occurred for the teal play doh samples.
To sumup the findings in this section,we can state that theAPCERs of around 10%show the limitations of vein-based still image PAD: thin transparent overlays cannotbe detected since the extracted features look far too similar to the bona fide ones.However, this PAD technique already allows to successfully detect a wide range ofPAIs, including full fake fingers and overlays fabricated from materials which blockNIR light to a bigger extent than human flesh.
14.6 Summary and Conclusions
Although being relatively new in comparison with other biometric characteristics,such as fingerprints or handwritten signatures, finger vein recognition has enjoyeda considerable attention within the last decade. As with any other security-relatedtechnology, a wider deployment also implies an increase in security and privacyrelated concerns. This has, in turn, lead to the development of countermeasures toprevent, among others, presentation attacks.
458 J. Kolberg et al.
In particular, the biometric community has focused ondetectingfinger vein imagesor videos presented to the capture device, in contrast to bona fide fingers. Highlyaccurate PAD methods have been developed in the literature, able to detect thesePAIs with perfect error rates.
In parallel, multimodal capture devices able to acquire both finger vein and fin-gerprint images have been proposed and implemented. In contrast to the finger vein,which is harder to imitate, multiple recipes are available to an eventual attacker inorder to carry out a PA and fool a fingerprint-based recognition system. These factshave motivated us to present in this chapter a novel approach to protect fingerprintsensors: finger vein PAD methods which are able to detect fingerprint PAIs.
In more details, due to the remarkable performance shown by LBP for differenttasks, including PAD for several biometric characteristics, we chose this texturedescriptor for our work. Even for some challenging PAIs, we can observe with thenaked eye that the texture captured has a different appearance from the bona fidefinger. In addition, different texture detailswere analysed utilisingGaussian pyramidsand extracting the LBP features from each level of the pyramid. Subsequently, SVMswere utilised for classification purposes.
With a sensor developed for the Odin program, a database comprising 32 differentPAIs was acquired and used for the present evaluation. After an extensive experimen-tal evaluation, we found that using a single SVM for a concatenation of the featuresextracted from all the levels of the pyramid is the best performing approach. This sce-nario leads to operation points with BPCERs under 1% and an APCER around 10%.The latter shows the main limitation of vein-based still image PAD: thin transparentoverlays cannot be detected. However, this PAD technique still allows to successfullydetect a wide range of PAIs.
We thus believe that finger vein can be effectively used with fingerprint for botha more accurate recognition performance, as shown in previous works, and also forPAD purposes. In the end, an attacker who needs to deceive both the fingerprint andthe vein sensors will face harder challenges in his path. In the forthcoming months,we will focus on improving the finger vein-based PAD, and on developing combinedapproaches with the finger photos captured with the sensor.
Acknowledgements This research is based upon work supported in part by the Office of the Direc-tor of National Intelligence (ODNI), Intelligence Advanced Research Projects Activity (IARPA)under contract number 2017-17020200005. The views and conclusions contained herein are thoseof the authors and should not be interpreted as necessarily representing the official policies, eitherexpressed or implied, of ODNI, IARPA, or the U.S. Government. The U.S. Government is autho-rised to reproduce and distribute reprints for governmental purposes notwithstanding any copyrightannotation therein.We would also like to thank our colleagues at USC for the data collection efforts.
14 Presentation Attack Detection for Finger Recognition 459
References
1. Adler A (2004) Images can be regenerated from quantized biometric match score data. In:Proceedings of Canadian conference on electrical and computer engineering (CCECE), pp469–472
2. Akhtar Z, Kale S, Alfarid N (2011) Spoof attacks in mutimodal biometric systems. In: Pro-ceedings of international conference on information and network technology (IPCSIT), vol 4,pp 46–51. IACSIT Press
3. Alegre F, Vipperla R, EvansN, FauveB (2012)On the vulnerability of automatic speaker recog-nition to spoofing attacks with artificial signals. In: Proceedings of European signal processingconference (EUSIPCO), pp 36–40
4. Anjos A, Günther M, de Freitas Pereira T, Korshunov P, Mohammadi A, Marcel S (2017)Continuously reproducing toolchains in pattern recognition andmachine learning experiments.In: Proceedings of international conference on machine learning (ICML)
5. Anjos A, Shafey LE et al (2012) Bob: a free signal processing and machine learning toolboxfor researchers. In: Proceedings ACM international conference on multimedia (ACMMM), pp1449–1452
6. BATL: Biometric authentication with a timeless learner (2017)7. Bhogal APS, Söllinger D, Trung P, Hämmerle-Uhl J, Uhl A (2017) Non-reference image
quality assessment for fingervein presentation attack detection. In: Proceedings Scandinavianconference on image analysis (SCIA), pp 184–196
8. Burt PJ, Adelson EH (1987) The Laplacian pyramid as a compact image code. In: Readings incomputer vision, pp 671–679. Elsevier
9. Cappelli R, Maio D, Lumini A, Maltoni D (2007) Fingerprint image reconstruction fromstandard templates. IEEE Trans Pattern Anal Mach Intell 29:1489–1503
10. Chetty G, Wagner M (2005) Audio-visual multimodal fusion for biometric person authentica-tion and liveness verification. In: Proceedings of NICTA-HCSNet multimodal user interactionworkshop (MMUI)
11. Choi H, Kang R, Choi K, Kim J (2007) Aliveness detection of fingerprints using multiple staticfeatures. In: Proceedings of world academy of science, engineering and technology, vol 22
12. Chugh T, Cao K, Jain AK (2018) Fingerprint spoof buster: use of minutiae-centered patches.IEEE Trans Inf Forensics Secur 13(9):2190–2202
13. Chugh T, Jain AK (2018) Fingerprint presentation attack detection: generalization and effi-ciency. arXiv:1812.11574
14. Cooksey C, Tsai B, Allen D (2014) A collection and statistical analysis of skin reflectancesignatures for inherent variability over the 250 nm to 2500 nm spectral range. In: Active andpassive signatures V, vol 9082, p 908206. International Society for Optics and Photonics
15. Drahansky M, Dolezel M, Michal J, Brezinova E, Yim J et al (2013) New optical methods forliveness detection on fingers. BioMed Res Int 2013:197,925
16. Erdogmus N, Marcel S (2014) Spoofing face recognition with 3D masks. IEEE Trans InfForensics Secur 9(7):1084–1097
17. Espinoza M, Champod C (2011) Using the number of pores on fingerprint images to detectspoofing attacks. In: International conference on hand-based biometrics (ICHB), 2011, pp 1–5.IEEE
18. Galbally J, Cappelli R, Lumini A, de Rivera GG, Maltoni D, Fierrez J, Ortega-Garcia J, MaioD (2010) An evaluation of direct and indirect attacks using fake fingers generated from ISOtemplates. Pattern Recogn Lett 31:725–732
19. Galbally J, Gomez-BarreroM (2017) Presentation attack detection in iris recognition. In: BuschC, Rathgeb C (eds) Iris and periocular biometrics. IET
20. Galbally J, Marcel S, Fierrez J (2014) Biometric antispoofing methods: a survey in face recog-nition. IEEE Access 2:1530–1552
21. Galbally J, Marcel S, Fierrez J (2014) Image quality assessment for fake biometric detection:application to iris, fingerprint and face recognition. IEEE Trans Image Process 23(2):710–724

460 J. Kolberg et al.
22. Galbally J, Marcel S, Fierrez J (2014) Image quality assessment for fake biometric detection:application to iris, fingerprint, and face recognition. IEEE Trans Image Process 23(2):710–724
23. Galbally J, Ross A, Gomez-BarreroM, Fierrez J, Ortega-Garcia J (2013) Iris image reconstruc-tion from binary templates: an efficient probabilistic approach based on genetic algorithms.Comput Vis Image Underst 117(10):1512–1525
24. Ghiani L, Yambay D, Mura V, Tocco S, Marcialis GL, Roli F, Schuckers S (2013) LivDet 2013fingerprint liveness detection competition 2013. In: International conference on biometrics(ICB), 2013, pp 1–6. IEEE
25. Ghiani L, Yambay DA, Mura V, Marcialis GL et al (2017) Review of the fingerprint livenessdetection (LivDet) competition series: 2009 to 2015. Image Vis Comput 58:110–128
26. Gomez-Barrero M, Galbally J (2017) Inverse biometrics and privacy. In: Vielhauer C (ed)User-centric privacy and security in biometrics. IET
27. Gomez-Barrero M, Galbally J (2017) Software attacks on iris recognition systems. In: BuschC, Rathgeb C (eds) Iris and periocular biometrics. IET
28. Gomez-Barrero M, Galbally J, Fierrez J (2014) Efficient software attack to multimodal bio-metric systems and its application to face and iris fusion. Pattern Recogn Lett 36:243–253
29. Gomez-BarreroM,Kolberg J, BuschC (2018)Towards fingerprint presentation attack detectionbased on short wave infrared imaging and spectral signatures. In: Proceedings of Norwegianinformation security conference (NISK)
30. Gomez-Barrero M, Kolberg J, Busch C (2018) Towards multi-modal finger presentation attackdetection. In: Proceedings of international workshop on ubiquitous implicit biometrics andhealth signals monitoring for person-centric applications (UBIO)
31. Gomez-Barrero M, Kolberg J, Busch C (2019) Multi-modal fingerprint presentation attackdetection: looking at the surface and the inside. In: Proceedings of international conference onbiometrics (ICB)
32. González-Soler LJ, ChangL,Hernández-Palancar J, Pérez-SuárezA,Gomez-BarreroM (2017)Fingerprint presentation attack detection method based on a bag-of-words approach. In: Pro-ceedings of Iberoamerican congress on pattern recognition (CIARP), pp 263–271. Springer
33. Goodfellow I, Bengio Y, Courville A (2016) Deep learning. MIT Press34. Hengfoss C, Kulcke A, Mull G, Edler C, Püschel K, Jopp E (2011) Dynamic liveness and
forgeries detection of the finger surface on the basis of spectroscopy in the 400–1650 nmregion. Forensic Sci Int 212(1):61–68
35. Howard AG, Zhu M, Chen B, Kalenichenko D, Wang W et al (2017) Mobilenets: efficientconvolutional neural networks for mobile vision applications. arXiv:1704.04861
36. Hsu CW, Chang CC, Lin CJ et al (2003) A practical guide to support vector classification37. Hussein ME, Spinoulas L, Xiong F, Abd-Almageed W (2018) Fingerprint presentation attack
detection using a novel multi-spectral capture device and patch-based convolutional neuralnetworks. In: 2018 IEEE international workshop on information forensics and security (WIFS),pp 1–8. IEEE
38. International Organisation for Standardisation (2016) ISO/IEC JTC1 SC37 Biometrics:ISO/IEC 30107-1. Information technology—biometric presentation attack detection—part 1:framework
39. International Organisation for Standardisation (2017) ISO/IEC JTC1 SC37 Biometrics:ISO/IEC 30107-3. Information technology—biometric presentation attack detection—part 3:testing and reporting
40. Jia X, Yang X, Cao K, Zang Y, Zhang N, Dai R, Zhu X, Tian J (2014) Multi-scale local binarypattern with filters for spoof fingerprint detection. Inf Sci 268:91–102
41. Jiang Y, Liu X (2018) Uniform local binary pattern for fingerprint liveness detection in thegaussian pyramid. Hindawi J Electr Comput Eng
42. Kannala J, Rahtu E (2012) BSIF: binarized statistical image features. In: 2012 21st internationalconference on pattern recognition (ICPR), pp 1363–1366
43. Keilbach P,Kolberg J,Gomez-BarreroM,BuschC, LangwegH (2018) Fingerprint presentationattack detection using laser speckle contrast imaging. In: Proceedings international conferenceof the biometrics special interest group (BIOSIG), pp 1–6
14 Presentation Attack Detection for Finger Recognition 461
44. Kocher D, Schwarz S, Uhl A (2016) Empirical evaluation of LBP-extension features for fingervein spoofing detection. In: Proceedings international conference of the biometrics specialinterest group (BIOSIG), pp 1–5. IEEE
45. Kono M, Umemura S, Miyatake T, Harada K et al (2004) Personal identification system. USPatent 6,813,010
46. Krizhevsky A, Sutskever I, Geoffrey E (2012) ImageNet classification with deep convolutionalneural networks. In: Advances in neural information processing systems, vol 25, pp 1097–1105.Curran Associates, Inc
47. Marasco E, Ross A (2015) A survey on antispoofing schemes for fingerprint recognition sys-tems. ACM Comput Surv (CSUR) 47(2):28
48. Marcel S (2013) BEAT—biometrics evaluation and testing. Biom Technol Today 5–749. Marcel S, Nixon MS, Li SZ (eds) (2014) Handbook of biometric anti-spoofing. Springer50. Memon S, Manivannan N, BalachandranW (2011) Active pore detection for liveness in finger-
print identification system. In: 2011 19th telecommunications forum (TELFOR), pp 619–622.IEEE
51. Nguyen DT, Park YH, Shin KY, Kwon SY et al (2013) Fake finger-vein image detection basedon fourier and wavelet transforms. Digit Signal Process 23(5):1401–1413
52. Nguyen DT, Yoon HS, Pham TD, Park KR (2017) Spoof detection for finger-vein recognitionsystem using NIR camera. Sensors 17(10):2261
53. Nikam SB, Agarwal S (2008) Texture and wavelet-based spoof fingerprint detection for fin-gerprint biometric systems. In: Proceedings of international conference on emerging trends inengineering and technology (ICETET), pp 675–680. IEEE
54. Nogueira RF, de Alencar Lotufo R, Machado RC (2016) Fingerprint liveness detection usingconvolutional neural networks. IEEE Trans Inf Forensics Secur 11(6):1206–1213
55. ODNI, IARPA: IARPA-BAA-16-04 (thor) (2016). https://www.iarpa.gov/index.php/research-programs/odin/odin-baa
56. Ojala T, Pietikäinen M, Harwood D (1996) A comparative study of texture measures withclassification based on featured distributions. Pattern Recogn 29(1):51–59
57. Qian X, Hua X, Chen P, Ke L (2011) PLBP: an effective local binary patterns texture descriptorwith pyramid representation. Pattern Recogn 44(10):2502–2515
58. Qiu X, KangW, Tian S, Jia W, Huang Z (2018) Finger vein presentation attack detection usingtotal variation decomposition. IEEE Trans Inf Forensics Secur 13(2):465–477
59. Qiu X, Tian S, Kang W, Jia W, Wu Q (2017) Finger vein presentation attack detection usingconvolutional neural networks. In: Proceedings of Chinese conference on biometric recognition(CCBR), pp 296–305
60. Raghavendra R, Avinash M, Marcel S, Busch C (2015) Finger vein liveness detection usingmotion magnification. In: Proceedings of international conference on biometrics theory, appli-cations and systems (BTAS), pp 1–7. IEEE
61. Raghavendra R, Busch C (2015) Presentation attack detection algorithms for finger vein bio-metrics: a comprehensive study. In: Proceedings of international conference on signal-imagetechnology & internet-based systems (SITIS), pp 628–632
62. Raghavendra R, Raja K, Surbiryala J, Busch C (2014) A low-cost multimodal biometric sensorto capture finger vein and fingerprint. In: Proceedings of international joint conference onbiometrics (IJCB)
63. Raghavendra R, Raja K, Venkatesh S, Busch C (2018) Fingervein presentation attack detectionusing transferable features from deep convolution neural networks. In: Vatsa M, Singh R,Majumdar A (eds) Deep learning in biometrics. CRC Press, Boca Raton
64. Ratha N, Connell J, Bolle R (2001) Enhancing security and privacy in biometrics-based authen-tication systems. IBM Syst J 40
65. Senarathna J, Rege A, Li N, Thakor NV (2013) Laser speckle contrast imaging: theory, instru-mentation and applications. IEEE Rev Biomed Eng 6:99–110
66. Simonyan K, Zisserman A (2015) Very deep convolutional networks for large-scale imagerecognition. In: Proceedings of international conference on learning representations (ICLR)

462 J. Kolberg et al.
67. Sousedik C, Busch C (2014) Presentation attack detection methods for fingerprint recognitionsystems: a survey. IET Biom 3(1):1–15
68. Steiner H, Kolb A, Jung N (2016) Reliable face anti-spoofing using multispectral SWIR imag-ing. In: Proceedings of international conference on biometrics (ICB), pp 1–8
69. Sutskever I, Vinyals O, Le QV (2014) Sequence to sequence learning with neural networks.In: Proceedings of advances in neural information processing systems (NIPS)
70. TABULA RASA: Trusted biometrics under spoofing attacks (2010). http://www.tabularasa-euproject.org/
71. Tirunagari S, PohN, BoberM,WindridgeD (2015)WindowedDMDas amicrotexture descrip-tor for finger vein counter-spoofing in biometrics. In: Proceedings of IEEE international work-shop on information forensics and security (WIFS), pp 1–6
72. Tolosana R, Gomez-BarreroM, Busch C, Ortega-Garcia J (2019) Biometric presentation attackdetection: beyond the visible spectrum. arXiv:1902.11065
73. Tolosana R, Gomez-Barrero M, Kolberg J, Morales A, Busch C, Ortega J (2018) Towardsfingerprint presentation attack detection based on convolutional neural networks and shortwave infrared imaging. In: Proceedings of international conference of the biometrics specialinterest group (BIOSIG)
74. Tome P, Marcel S (2015) On the vulnerability of palm vein recognition to spoofing attacks. In:Proceedings of international conference on biometrics (ICB), pp 319–325. IEEE
75. Tome P, Raghavendra R, Busch C, Tirunagari S et al (2015) The 1st competition on countermeasures to finger vein spoofing attacks. In: Proceedings of international conference on bio-metrics (ICB), pp 513–518
76. Tome P, Vanoni M,Marcel S (2014) On the vulnerability of finger vein recognition to spoofing.In: Proceedings of international conference of the biometrics special interest group (BIOSIG),pp 1–10. IEEE
77. Vanoni M, Tome P, El Shafey L, Marcel S (2014) Cross-database evaluation with an openfinger vein sensor. In: IEEE workshop on biometric measurements and systems for securityand medical applications (BioMS)
78. Wu HY, Rubinstein M, Shih E, Guttag J, Durand F, Freeman W (2012)Eulerian video magni-fication for revealing subtle changes in the world. In: Proceedings of transaction on graphics(SIGGRAPH)
79. Yambay D, Czajka A, Bowyer K, Vatsa M, Singh R, Schuckers S (2019) Review of iris pre-sentation attack detection competitions. In: Handbook of biometric anti-spoofing, pp 169–183.Springer
80. Yambay D, Ghiani L, Marcialis GL, Roli F, Schuckers S (2019) Review of fingerprint presen-tation attack detection competitions. In: Handbook of biometric anti-spoofing, pp 109–131.Springer
81. Zhou B, Khosla A, Lapedriza A, Oliva A, Torralba A (2016) Learning deep features for dis-criminative localization. In: Proceedings of international conference on computer vision andpattern recognition (CVPR)

14 Presentation Attack Detection for Finger Recognition 463
Open Access This chapter is licensed under the terms of the Creative Commons Attribution 4.0International License (http://creativecommons.org/licenses/by/4.0/), which permits use, sharing,adaptation, distribution and reproduction in any medium or format, as long as you give appropriatecredit to the original author(s) and the source, provide a link to the Creative Commons license andindicate if changes were made.
The images or other third party material in this chapter are included in the chapter’s CreativeCommons license, unless indicated otherwise in a credit line to the material. If material is notincluded in the chapter’s Creative Commons license and your intended use is not permitted bystatutory regulation or exceeds the permitted use, you will need to obtain permission directly fromthe copyright holder.