presentation by philip verleger at the forum
TRANSCRIPT

PRESENTATION BY PHILIP VERLEGER
AT THE FORUM:
"MARKET LEADERS AND SCENARIOS FOR THE 21ST CENTURY"
March 13, 14 and 15, 2009
“Villa d’Este” – Cernobbio (Como)
Reproduced by The European House-Ambrosetti for internal use only.


1
Oil Prices: Permanently Down or Cyclically Depressed?
Philip K. Verleger, Jr.Haskayne School of Business and PKVerleger LLCFlame 2009Amsterdam, March 10, 2009
Policy Blunders Caused $147/bbl Crude;Depression Could Bring Crude to $20/bbl
The surge in crude prices to $147 per barrel was caused by policy blunders, not resource constraints or growth in Asia.
The price rise resulted from environmental regulations and limits on the supply of sweet crude.
Crude prices collapsed when economic growth slowed.
A long recession could send crude below $20 per barrel for a while. Recovery will come.
2

2
Policy Blunders Caused $147 Crude
Strong global diesel fuel growth and refinery constraints set the stage for a crisis.
Untimely imposition of EU diesel sulfur regulations made the situation worse.
The regulations heightened the need for sweet crude.
Nigerian production losses and U.S. energy policy cut sweet crude supply.
The result was a classic commodity squeeze. 3
Industry Constraints and Economic Circumstances Contributed to $147/bbl Crude
Lack of capacity to remove sulfur made it impossible to use sour crude. It takes 30 barrels of sour crude to replace one lost barrel of sweet.
The euro added to upward pressure because Europe, not China, was the incremental buyer.
New U.S. ethanol regulations reduced refinery throughput and lowered global diesel output.
Higher prices solved the problem. Consumption dropped and prices followed.
4

3
Retail Gasoline and Diesel Prices in Germany and France, 2006-2008
0.800.901.001.101.201.301.401.501.601.70
Jan-06 Jul-06 Jan-07 Jul-07 Jan-08 Jul-08Mon
thly
Ave
rage
Pric
e in
Eur
os
Gasoline in France Gasoline in GermanyDiesel in France Diesel in Germany
Source: PKVerleger LLC.
Monthly NigerianCrude Production, 1999-2008
1.6
1.8
2.0
2.2
2.4
2.6
2.8
1999 2000 2001 2002 2003 2004 2005 2006 2007 2008
Mill
ion
Bar
rels
per
Day
Source: Energy Intelligence Group.
Aug-07 to Jul-08

4
Monthly Net Distillate Imports/Exports to/fromthe U.S., January 1990-October 2008
-800
-600
-400
-200
0
200
400
600
800
1990 1993 1996 1999 2002 2005 2008
Impo
rts/
Expo
rts
(Tho
usan
d B
arre
ls p
er D
ay)
Source: U.S. DOE.
Exports
Imports
Euro/Dollar Exchange Rate, 2004-2008
1.151.201.251.301.351.401.451.501.551.60
Jan-
04A
pr-0
4Ju
l-04
Oct
-04
Jan-
05A
pr-0
5Ju
l-05
Oct
-05
Jan-
06A
pr-0
6Ju
l-06
Oct
-06
Jan-
07A
pr-0
7Ju
l-07
Oct
-07
Jan-
08A
pr-0
8Ju
l-08
Oct
-08
Dol
lars
per
Eur
o
Source: Platts.
Aug-07 toJul-08

5
Brent and Gasoil Spot Prices,January 2005-January 2009
200
400
600
800
1,000
1,200
1,400Ja
n-05
Jul-0
5
Jan-
06
Jul-0
6
Jan-
07
Jul-0
7
Jan-
08
Jul-0
8
Gas
oil P
rice
($/m
etric
ton)
20406080100120140160
Bre
nt P
rice
($/b
bl)
Gasoil Brent
Source: Platts.
Speculation Did Not Cause the Price Rise
Speculators have been blamed for the price increase.
There is no evidence to substantiate the claim.
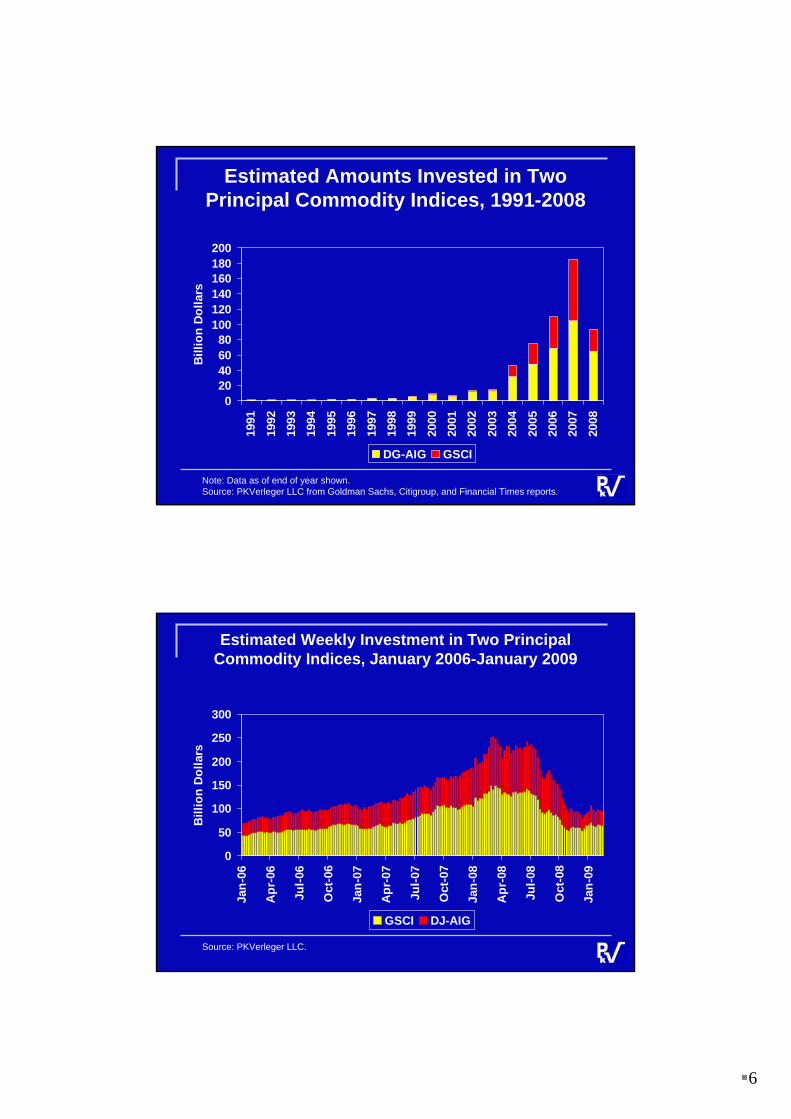
Commodities did become a passive investment vehicle. Billions were invested in them.
The investment did promote inventory accumulation.
However, OPEC and Saudi Arabia muted the impact.
10
6
Estimated Amounts Invested in Two Principal Commodity Indices, 1991-2008
020406080
100120140160180200
1991
1992
1993
1994
1995
1996
1997
1998
1999
2000
2001
2002
2003
2004
2005
2006
2007
2008
Bill
ion
Dol
lars
DG-AIG GSCI
Note: Data as of end of year shown.Source: PKVerleger LLC from Goldman Sachs, Citigroup, and Financial Times reports.
Estimated Weekly Investment in Two Principal Commodity Indices, January 2006-January 2009
0
50
100
150
200
250
300
Jan-
06
Apr
-06
Jul-0
6
Oct
-06
Jan-
07
Apr
-07
Jul-0
7
Oct
-07
Jan-
08
Apr
-08
Jul-0
8
Oct
-08
Jan-
09
Bill
ion
Dol
lars
GSCI DJ-AIG
Source: PKVerleger LLC.

7
Weekly WTI Price Spread (Third Futureless Cash), January 1986-November 2008
-6-4-202468
1986
1987
1988
1989
1990
1991
1992
1993
1994
1995
1996
1997
1998
1999
2000
2001
2002
2003
2004
2005
2006
2007
2008
Dol
lars
per
Bar
rel
Source: PKVerleger LLC.
Investors Begin PuttingMoney into Commodities
Environmental Authorities Beginto Squeeze Sweet Crude Market
Accumulation of GlobalCrude Oil Stocks, 1990-2008
-0.4
-0.2
0.0
0.2
0.4
0.6
0.8
1.0
1.2
1990
1991
1992
1993
1994
1995
1996
1997
1998
1999
2000
2001
2002
2003
2004
2005
2006
2007
2008
Bill
ion
Bar
rels
Source: PKVerleger LLC calculated from EIG data on supply and demand.
Date OPEC Actedto Cut Supply

8
OPEC and Saudi Arabia PreventComplete Market Adjustment
Saudi Arabia administers the price of sour crude by setting the price differential to sweet crude.
Sour crude prices could fall to a 50% discount absent such action, providing an incentive for refinery investment.
Instead sour crude supplies are left in tanks, on ships, or in the ground, even with $147 crude.
OPEC’s actions have laid the foundation for the next move in the price cycle.
15
Saudi Discount to Brent Offered to Buyers of Arab Heavy Destined for Europe, 2002-2009
-16
-14
-12
-10
-8
-6
-4
-2
0
Feb-02 Feb-03 Feb-04 Feb-05 Feb-06 Feb-07 Feb-08 Feb-09
Dol
lars
per
Bar
rel
Source: PKVerleger LLC.

9
Movement of OPEC Surplus Crude Capacity vs. Movement of Dated Brent Prices, 1997-2008
012345678
1997
1998
1999
2000
2001
2002
2003
2004
2005
2006
2007
2008
OPE
C S
urpl
us C
apac
ity
(Mill
ion
Bar
rels
)
0
20
40
60
80
100
120
140
Bre
nt P
rice
($/b
bl)
OPEC Surplus Capacity Dated Brent Price
Source: PKVerleger LLC.
Price Rise Reversed with Policy Adjustments and Beginning of Depression
Congress stopped DOE from filling the SPR.
Russian invasion of Georgia caused euro to fall.
Refiners changed catalysts, boosting distillate yield.
Economic slowdown began in Europe.
High retail prices cut use in United States.
Chinese use dropped due to end of Olympics and decline in manufacturing.
18

10
Spot WTI Price vs. Strategic Petroleum Reserve Inventory Level
19Source: Platts; U.S. DOE.
Onset of a Long Global Recession Will Keep Prices Low for Several Years
This economic cycle is different. It is a financial crisis.
Financial crises last longer, at least three years.
The loss in GDP is greater. Government debt can be expected to increase by more than 80 percent
Global oil use can be expected to drop at least ten percent by 2011. Recovery could be deferred to 2015.
20
11
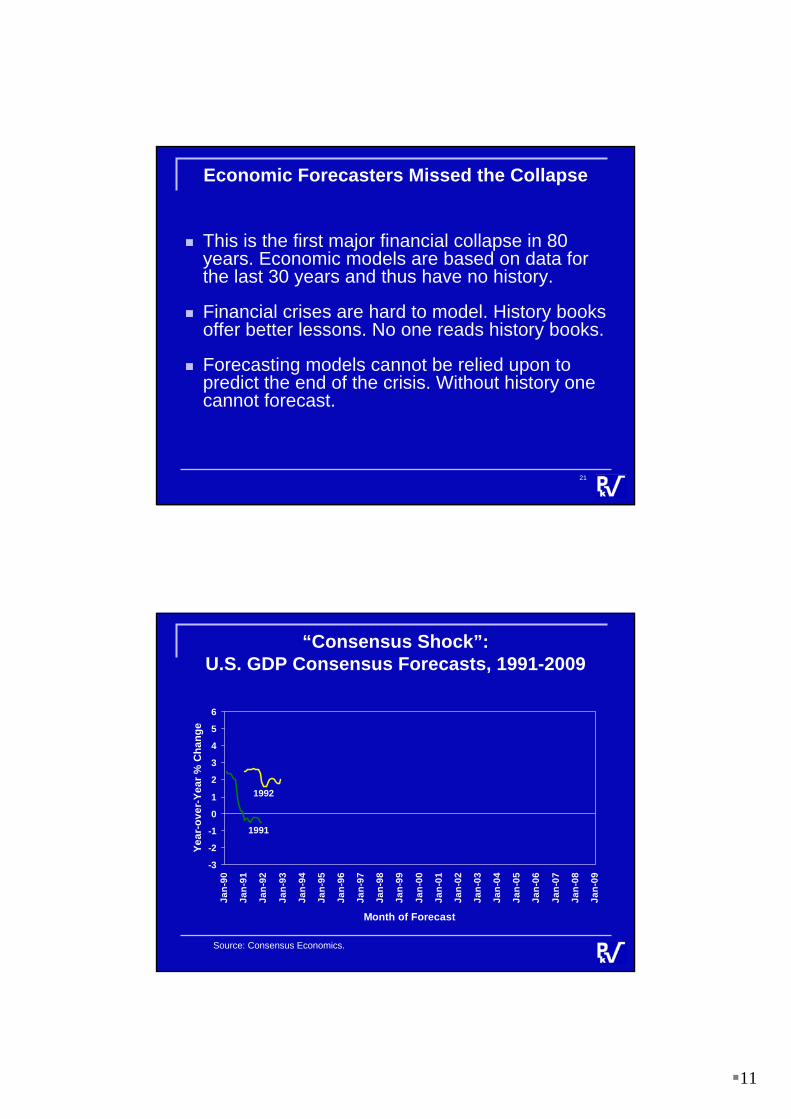
Economic Forecasters Missed the Collapse
This is the first major financial collapse in 80 years. Economic models are based on data for the last 30 years and thus have no history.
Financial crises are hard to model. History books offer better lessons. No one reads history books.
Forecasting models cannot be relied upon to predict the end of the crisis. Without history one cannot forecast.
21
“Consensus Shock”:U.S. GDP Consensus Forecasts, 1991-2009
-3
-2
-1
0
1
2
3
4
5
6
Jan-
90
Jan-
91
Jan-
92
Jan-
93
Jan-
94
Jan-
95
Jan-
96
Jan-
97
Jan-
98
Jan-
99
Jan-
00
Jan-
01
Jan-
02
Jan-
03
Jan-
04
Jan-
05
Jan-
06
Jan-
07
Jan-
08
Jan-
09
Month of Forecast
Year
-ove
r-Ye
ar %
Cha
nge
1991
Source: Consensus Economics.
1992
12
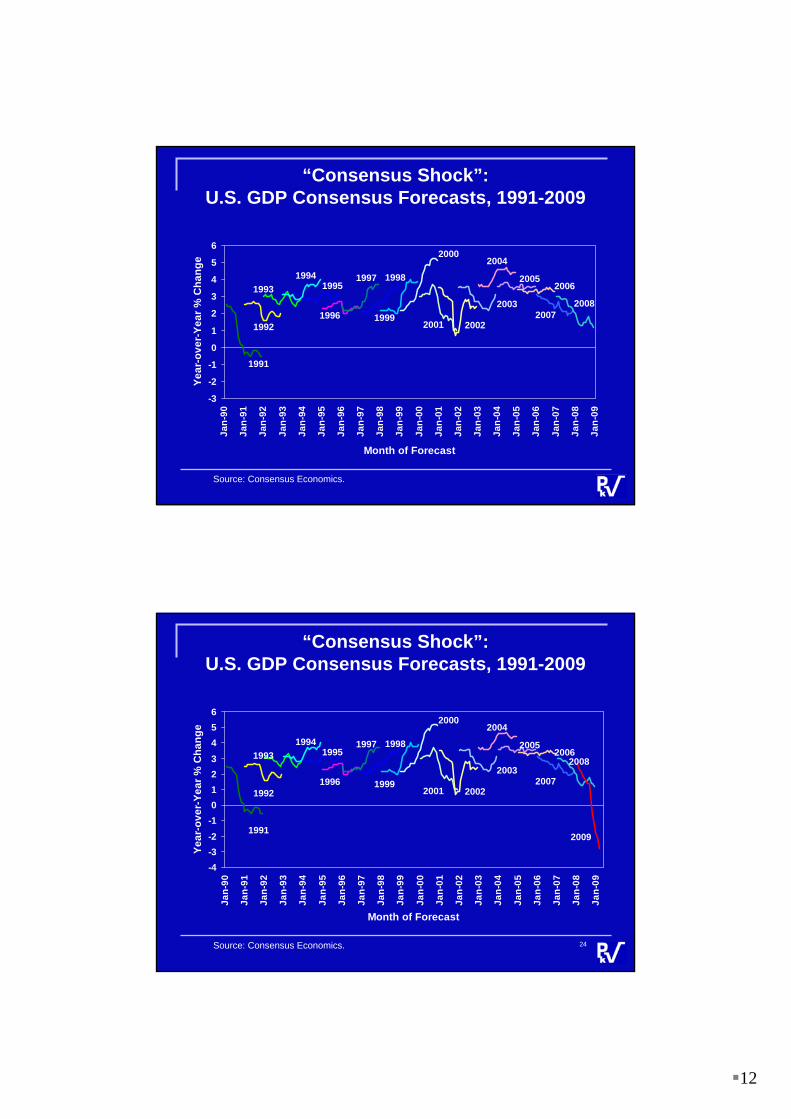
“Consensus Shock”:U.S. GDP Consensus Forecasts, 1991-2009
-3
-2
-1
0
1
2
3
4
5
6
Jan-
90
Jan-
91
Jan-
92
Jan-
93
Jan-
94
Jan-
95
Jan-
96
Jan-
97
Jan-
98
Jan-
99
Jan-
00
Jan-
01
Jan-
02
Jan-
03
Jan-
04
Jan-
05
Jan-
06
Jan-
07
Jan-
08
Jan-
09
Month of Forecast
Year
-ove
r-Ye
ar %
Cha
nge
1991
Source: Consensus Economics.
1992
19931994
1995
1996
1997 1998
1999
2000
2001 2002
2003
2004
20052006
20072008
“Consensus Shock”:U.S. GDP Consensus Forecasts, 1991-2009
-4-3-2-10123456
Jan-
90
Jan-
91
Jan-
92
Jan-
93
Jan-
94
Jan-
95
Jan-
96
Jan-
97
Jan-
98
Jan-
99
Jan-
00
Jan-
01
Jan-
02
Jan-
03
Jan-
04
Jan-
05
Jan-
06
Jan-
07
Jan-
08
Jan-
09
Month of Forecast
Year
-ove
r-Ye
ar %
Cha
nge
1991
Source: Consensus Economics.
1992
19931994
1995
1996
1997 1998
1999
2000
2001 2002
2003
2004
20052006
2007
2008
2009
24

13
Global Economic Growth Rates, 1980 to 2008 andProjected to 2012 Based on Reinhart and Rogoff Results
-2-10123456
1980 1984 1988 1992 1996 2000 2004 2008 2012
% C
hang
e fr
om P
rior Y
ear
History Projection
Source: IMF (history); PKVerleger LLC (forecast).
History and Likely Trend in Global Oil Consumption, 1965-2008 and Forecast to 2012
20
30
40
50
60
70
80
90
1965
1968
1971
1974
1977
1980
1983
1986
1989
1992
1995
1998
2001
2004
2007
2010
Mill
ion
Bar
rels
per
Day
History Forecast
Source: BP Statistical Yearbook; PKVerleger LLC.

14
Year-to-Year Percentage Change in GlobalOil Use, 1966-2008 and Forecast to 2012
-6-4-202468
10
1966
1969
1972
1975
1978
1981
1984
1987
1990
1993
1996
1999
2002
2005
2008
2011
Perc
ent C
hang
e fr
om P
rior Y
ear
History Forecast
Source: PKVerleger LLC.
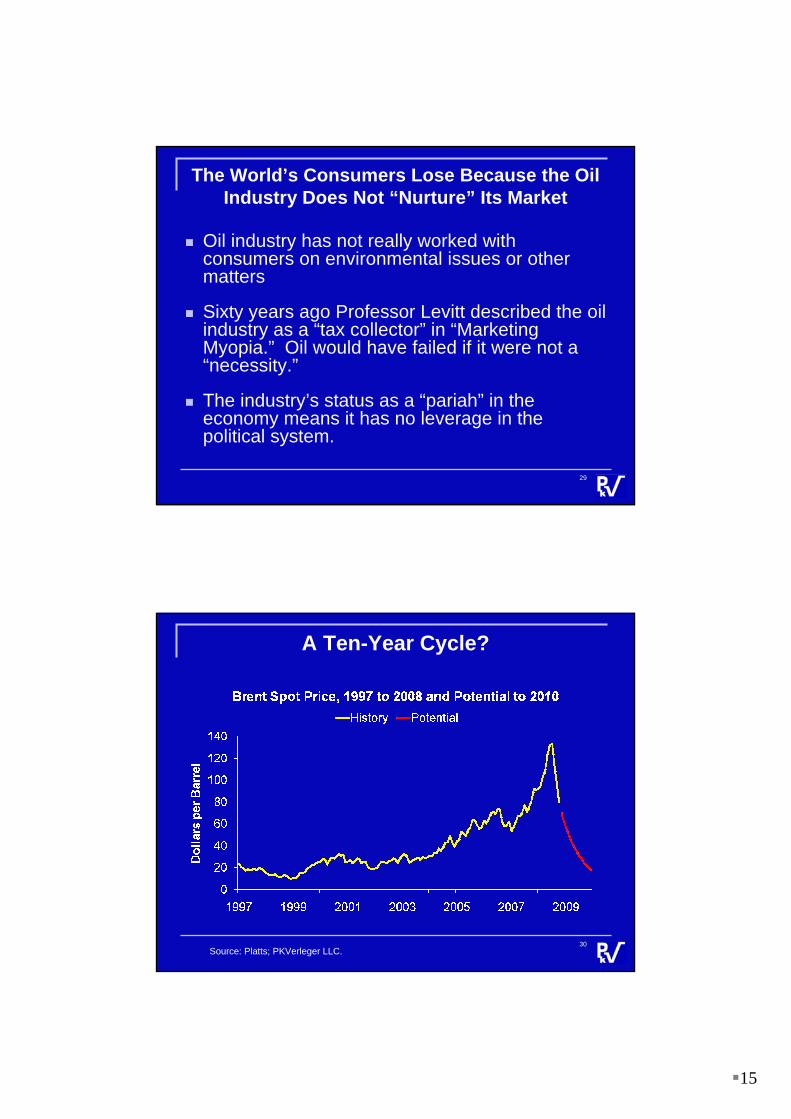
Oil Prices Will Recover and Surpass2008’s Peaks within Ten Years
Environmental regulations, not “Peak Oil Problems,” will likely send prices above $200/bbl by 2020.
New regulations on sulfur emissions from ships will again squeeze the light crude market. Refiners will be unable to satisfy demand. They will seek sweet crude.
Sweet crude prices will be pulled up. Sour crude will follow thanks to Saudi Arabia. The Depression will be prolonged.
28
15
The World’s Consumers Lose Because the Oil Industry Does Not “Nurture” Its Market
Oil industry has not really worked with consumers on environmental issues or other matters
Sixty years ago Professor Levitt described the oil industry as a “tax collector” in “Marketing Myopia.” Oil would have failed if it were not a “necessity.”
The industry’s status as a “pariah” in the economy means it has no leverage in the political system.
29
A Ten-Year Cycle?
30Source: Platts; PKVerleger LLC.
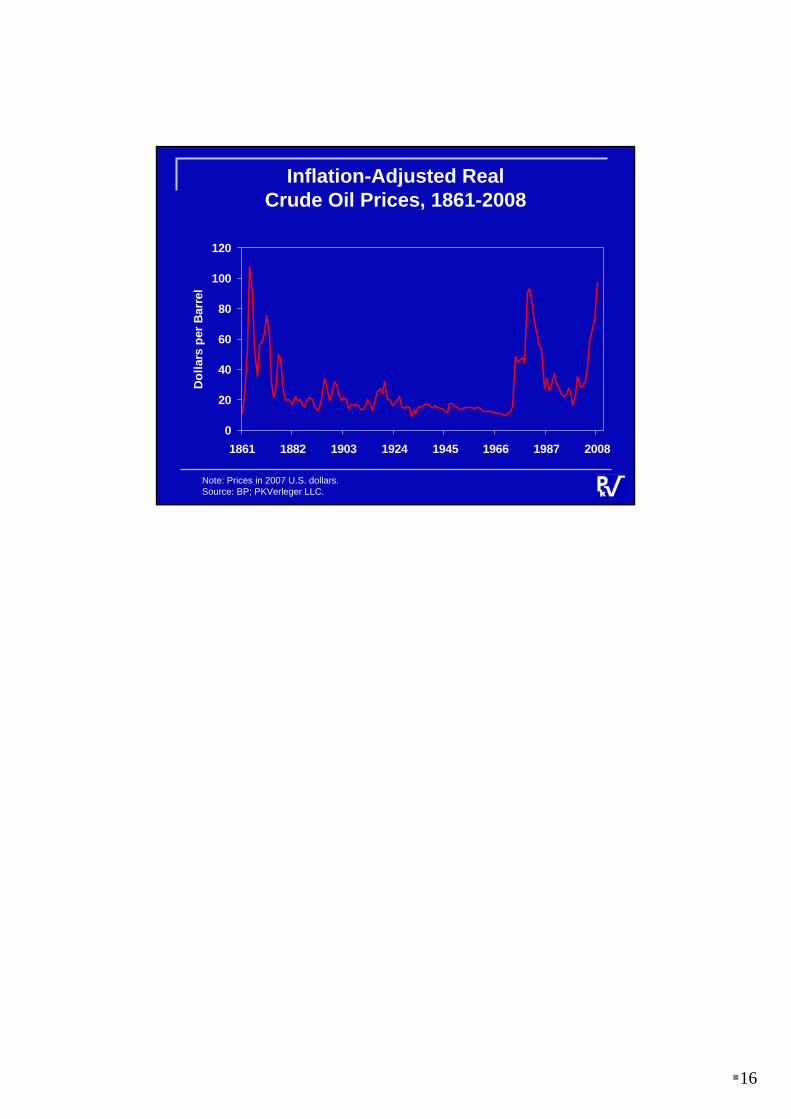
16
Inflation-Adjusted RealCrude Oil Prices, 1861-2008
0
20
40
60
80
100
120
1861 1882 1903 1924 1945 1966 1987 2008
Dol
lars
per
Bar
rel
Note: Prices in 2007 U.S. dollars.Source: BP; PKVerleger LLC.