presentation for hsbc asean day - listed...
TRANSCRIPT

Presentation forHSBC ASEAN Day
16 February 2017

2
Disclaimer
This presentation should be read in conjunction with the financial statements of Soilbuild Business Space REIT for the fourthquarter from 1 October 2016 to 31 December 2016 (hereinafter referred to 4Q FY2016) and full year ended 31 December 2016(hereinafter referred to FY2016).
This presentation is for information only and does not constitute an offer or solicitation of an offer to subscribe for, acquire,purchase, dispose of or sell any units in Soilbuild Business Space REIT (“Soilbuild REIT”, and units in Soilbuild REIT, “Units”) or anyother securities or investment.
Nothing in this presentation should be construed as financial, investment, business, legal or tax advice and you should consult yourown independent professional advisors.
This presentation may contain forward-looking statements that involve risks, uncertainties and assumptions. Future performance,outcomes and results may differ materially from those expressed in forward-looking statements as a result of a number of risks,uncertainties and assumptions. You are cautioned not to place undue reliance on these forward-looking statements, which arebased on the current view of management of future events.
The value of Units and the income derived from them, if any, may fall or rise. Units are not obligations of, deposits in, orguaranteed by, the Manager or any of its affiliates. An investment in Units is subject to investment risks, including the possible lossof the principal amount invested.
Investors should note that they will have no right to request the Manager to redeem or purchase their Units for so long as theUnits are listed on Singapore Exchange Securities Trading Limited (the “SGX-ST”). It is intended that holders of Units may only dealin their Units through trading on the SGX-ST. The listing of the Units on the SGX-ST does not guarantee a liquid market for theUnits.
The past performance of Soilbuild REIT is not indicative of the future performance of Soilbuild REIT. Similarly, the pastperformance of SB REIT Management Pte. Ltd. (“Manager”) is not indicative of the future performance of the Manager.

3
Content
Key Highlights 4
4Q FY2016 & FY2016 Financial Performance 6
Financial Position / Capital Management 13
Portfolio Update 16
Market Update and Outlook 25

Key Highlights

5
Key Highlights of 4Q FY2016 & FY2016
• Year-on-year (“y-o-y”) gross revenue grew to S$21.7 million and net property income (“NPI”) rose by 8.0% to S$18.9 million.
• Distributable income increased 8.4% y-o-y to S$16.4 million from S$15.1 million in 4Q FY2015.
• Distribution per Unit (“DPU”) is at 1.570 cents in 4Q FY2016 compared to 1.614 cents in 4Q FY2015.
4Q FY2016
Results
• Gross revenue grew 2.3% y-o-y to S$81.1 million and NPI grew 4.3% to S$70.7 million.
• Distributable income rose 4.1% y-o-y to S$60.3 million from S$57.9 million in FY2015.
• DPU is at 6.091 cents in FY2016 compared to 6.487 cents in FY2015.
FY2016
Results
• Weighted average all-in cost of debt is 3.37% p.a. as at 31 December 2016.
• Weighted average debt maturity stands at 2.8 years.
• Interest rate exposure is 86.5% fixed for a weighted average term of 1.9 years.
• Unencumbered investment properties in excess of S$883 million (71% of total investmentproperties).
Corporate and Capital
Management
• Portfolio occupancy rate of 89.6% as at 31 December 2016, primarily due to the termination of lease with Technics Offshore Engineering Pte Ltd.
• Weighted average lease expiry (by gross rental income) stands at 3.4 years.
• Approximately 620,000 sq ft of renewals and new leases signed as at 31 December 2016.
• Successfully completed forward renewals of over 110,000 sq ft of leases expiring in 2017.
Portfolio Update
Financial Performance
4Q FY2016 & FY2016

7
4Q FY2016 Financial Results
For the period from
4Q FY2016 4Q FY2015 Variance1 October to 31 December(S$’000)
Gross Revenue 21,687 20,434 6.1%
Less Property Expenses (2,795) (2,944) 5.1%
Net Property Income 18,892 17,490 8.0%
Interest Income 428 196 118.4%
Finance Expenses(1) (3,955) (3,325) (18.9%)
Manager’s Fees(2) (1,636) (2,164) 24.4%
Trustee’s Fees (54) (50) (8.0%)
Other Trust Expenses (270) (164) (64.6%)
Net Income 13,405 11,983 11.9%
Net Change in Fair Value of Investment Properties(3) (50,855) 4,535 (1,221.4%)
Total Return before Distribution (37,450) 16,518 (326.7%)
Add back Non-Tax Deductible Items(4) 53,815 (1,427) 3,871.2%
Distributable Income 16,365 15,091 8.4%Note:(1) Finance Expenses comprise interest expense, amortisation of debt arrangement and prepayment fees.(2) Manager’s Fees comprise base fees.(3) Mainly due to revaluation losses on its investment properties in Loyang Way, West Park, Tuas Connection and Eightrium. The decline in valuation of Loyang Way was largely due to the termination of
the lease with TOE, while West Park and Tuas Connection were attributed to higher vacancies and negative rental reversions.(4) Non-tax deductible Items comprise the Manager’s management fees, property management and lease management fees paid or payable in Units, rent free amortisation, Trustee’s fees, amortisation
of debt arrangement and prepayment fees.

8
FY2016 Financial Results
For the period from
FY2016 FY2015 Variance1 January to 31 December(S$’000)
Gross Revenue 81,130 79,340 2.3%
Less Property Expenses (10,456) (11,563) 9.6%
Net Property Income 70,674 67,777 4.3%
Interest Income 1,505 643 134.1%
Finance Expenses(1) (14,637) (13,490) (8.5%)
Manager’s Fees(2) (6,025) (6,442) 6.5%
Trustee’s Fees (206) (196) (5.1%)
Other Trust Expenses (1,033) (1,168) 11.6%
Net Income 50,278 47,124 6.7%
Net Change in Fair Value of InvestmentProperties(3) (50,855) 4,535 (1,221.4%)
Total Return before distribution (577) 51,659 (101.1%)
Add back Non-Tax Deductible Items(4) 60,829 6,208 879.8%
Distributable Income 60,252 57,867 4.1%
Note:(1) Finance Expenses comprise interest expense, amortisation of debt arrangement and prepayment fees and bank commitment fees.(2) Manager’s Fees comprise base fees.(3) Mainly due to revaluation losses on its investment properties in Loyang Way, West Park, Tuas Connection and Eightrium. The decline in valuation of Loyang Way was largely due to the termination of
the lease with TOE, while West Park and Tuas Connection were attributed to higher vacancies and negative rental reversions.(4) Non-tax deductible Items comprise the Manager’s management fees, property management and lease management fees paid or payable in Units, rent free amortisation, Trustee’s fees, amortisation
of debt arrangement and prepayment fees and bank commitment fees.

9
Distribution per Unit
Note:(1) Based on the closing price of S$0.64 as at 31 December 2016.(2) Based on the closing price of S$0.77 as at 31 December 2015.(3) Based on Units in issue as at 31 December.
4Q FY2016 vs 4Q FY2015
4Q FY2016 4Q FY2015 Variance
Distributable Income (S$’000) 16,365 15,091 8.4%
Distribution per Unit (“DPU”) (cents) 1.570 1.614 (2.7%)
FY2016 vs FY2015
FY2016 FY2015 Variance
Distributable Income (S$’000) 60,252 57,867 4.1%
Distribution per Unit (“DPU”) (cents) 6.091 6.487 (6.1%)
Distribution Yield 9.5%(1) 8.4%(2) 1.1%
Units in Issue(3) 1,042,173,741 934,441,690 11.5%

10
4Q FY2016 Distribution
Distribution Timetable4Q FY2016
Distribution Details4Q FY2016
Distribution Period 1 October 2016 – 31 December 2016
Distribution Amount SGD 1.570 cents per unit
Last Day of Trading on “cum” Basis Thursday, 26 January 2017
Ex-Date Friday, 27 January 2017
Books Closure Date Wednesday, 1 February 2017
Distribution Payment Date Monday, 27 February 2017

11
Steady Growth since IPO
6.1
12.2 12.6 12.1 12.5 12.9 13.314.3
15.2 15.1 14.6 14.714.6
16.4
1.533
0.760
1.510 1.5621.500 1.546 1.585 1.633 1.615 1.625 1.614
1.557 1.565
1.399
1.570
0.0
0.2
0.4
0.6
0.8
1.0
1.2
1.4
1.6
4.0
6.0
8.0
10.0
12.0
14.0
16.0
18.0
20.0
3Q2013
4Q2013
1Q2014
2Q2014
3Q2014
4Q2014
1Q2015
2Q2015
3Q2015
4Q2015
1Q2016
2Q2016
3Q2016
4Q2016
Distributable Income Adjusted DPU Actual DPU
Net Property Income (NPI) Distributable Income and DPU
6.9
13.7 14.2 14.0 14.214.9
15.816.7
17.8 17.5 17.2 17.3 17.3
18.9
4.0
6.0
8.0
10.0
12.0
14.0
16.0
18.0
20.0
3Q2013
4Q2013
1Q2014
2Q2014
3Q2014
4Q2014
1Q2015
2Q2015
3Q2015
4Q2015
1Q2016
2Q2016
3Q2016
4Q2016
3Q 2013 4Q 2013 1Q 2014 2Q 2014 3Q 2014 4Q 2014 1Q 2015 2Q 2015 3Q 2015 4Q 2015 1Q 2016 2Q 2016 3Q 2016 4Q 2016
Price(1) (S$) 0.745 0.770 0.780 0.800 0.795 0.790 0.810 0.850 0.805 0.770 0.730 0.685 0.700 0.640
Cumulative DPU (cents) 0.760 2.270 3.832 5.332 6.878 8.463 10.096 11.711 13.336 14.950 16.507 18.072 19.471 21.041
Cumulative Distribution Returns(2) (%)
0.97 2.91 4.91 6.84 8.82 10.85 12.94 15.01 17.10 19.17 21.16 23.17 24.96 26.98
Note:(1) Based on closing price on last day of each quarter; (2) Based on cumulative distribution per unit against IPO price of S$0.78.(3) The adjustment excludes the issuance of 94,353,672 new Units pursuant to the Preferential Offering and 1,528,571 new Units for the payment of acquisition fee at an issuance price of S$0.63 per unit, as well as the
revenue and associated borrowing costs relating to the acquisition of Bukit Batok Connection which was completed on 27 September 2016.Source: Bloomberg
Distributable Income(S$ million)
Actual DPU(cents)
4Q FY2016 4Q FY2016
S$ 18.9 million S$ 16.4 million
NPI(S$ million)
(3)
8.0% y-o-y 8.4% y-o-y

12
9.52%
7.60%
6.00%
3.88%
2.47%
0.35%
0.14%
SBREIT distribution yield
Industrial S-REIT avg. yield
FTSE ST REIT Index
Straits Times Index
10-year government bond yield
Bank fixed deposit rate
Bank savings deposit rate 705 bps
0.60
0.65
0.70
0.75
0.80
0.85
0.90
75
80
85
90
95
100
105
110
115
Au
g-1
3Se
p-1
3O
ct-1
3N
ov-
13
Dec
-13
Jan
-14
Feb
-14
Mar
-14
Ap
r-1
4M
ay-1
4Ju
n-1
4Ju
l-1
4A
ug-
14
Sep
-14
Oct
-14
No
v-1
4D
ec-1
4Ja
n-1
5Fe
b-1
5M
ar-1
5A
pr-
15
May
-15
Jun
-15
Jul-
15
Au
g-1
5Se
p-1
5O
ct-1
5N
ov-
15
Dec
-15
Jan
-16
Feb
-16
Mar
-16
Ap
r-1
6M
ay-1
6Ju
n-1
6Ju
l-1
6A
ug-
16
Sep
-16
Oct
-16
No
v-1
6D
ec-1
6
Closing Unit Price (S$)Index
FSTREI FSSTI SBREIT
Attractive Return on Investment since IPO
Notes:(1) Sum of total return based on closing price of $0.640 as at 31 December 2016; (2) Based on FY2016 DPU of 6.091 cents and Unit price of $0.640 as at 31 December 2016; (3) Information as at 31 December 2016 except for Industrial S-REIT average yield as at 18 November2016 according to Jefferies Report.Source: Monetary Authority of Singapore, Bloomberg, FTSE Russell, Jefferies
Total Annualised Return of 2.60%(1) since listing
Distribution Yield = 9.52% (2)
Unit trading at 705 bps risk premium(3)
above 10-year government bond yield
Closing price on 31 December 2016:
S$0.640

Financial Position / Capital Management

14
4Q FY2016 Financial Results – Statement of Financial Position
All figures S$’000 unless otherwise stated 31 December 2016 31 December 2015
Investment Properties 1,243,700(1) 1,190,700
Other Assets 31,791 23,830
Total Assets 1,275,491 1,214,530
Borrowings 472,349 398,502
Other Liabilities 51,439 70,055
Net Assets 751,703 745,973
Units in Issue (‘000) 1,042,174 934,442
Net Asset Value per Unit (S$) 0.72 0.80
Note:(1) Includes the acquisition of Bukit Batok Connection, offset by a revaluation loss on investment properties in Loyang Way, West Park, Tuas Connection and Eightrium as at 31
December 2016. The decline in valuation of Loyang Way was largely due to the termination of the lease with TOE, while West Park and Tuas Connection were attributed by lower rental and occupancy.

15
1) Soilbuild REIT is rated Baa3/negative by Moody’s.
Prudent Capital Management
3) Aggregate leverage of 37.6%(1) allows headroom of S$50 million(2)
31 December 2016
Total Bank Financing Facilities S$230 million
Total Bank Debt Drawn Down S$225 million
Multicurrency Debt Issuance Programme drawn down
S$200 million
Interest-free Loan S$55 million
Unencumbered Investment Properties S$883 million
Secured leverage (3) 14.5%
Average All-in Interest Cost(4) 3.37% p.a.
Interest Coverage Ratio(5) 4.8x
Weighted Average Debt Maturity (2) 2.8 years
Notes:.(1) Includes interest free loan in relation to the Solaris upfront land premium.(2) Based on target aggregate leverage of 40%.(3) Secured Debt/Total Assets.(4) Excludes interest-free loan. (5) Computed based on 4Q FY2016 EBITDA/Net interest expense (Finance expense –
Interest income).
2) Lengthened weighted average debt maturity and fixed the interest rate for 86.5% of borrowings for a weighted average term of 1.9 years.
No refinancing requirements till 2018
55
95
100
90
40
100
2016 2017 2018 2019 2020 2021
S$'m
illio
ns
Bank Facility drawn down MTN Interest Free Loan
% of Debt Maturing 32.3% 8.4% 38.5% 20.8%

Portfolio Update

17
Portfolio Overview
Keppel TerminalSentosa
Jurong Island
Jurong Port
Second Link(Tuas Checkpoint)
PSATerminal
Tuas Port(2022)
ONE-NORTH
CHANGISIMEI
EXPOJOO KOON
BOON LAYPIONEER
BUONA VISTA
SolarisNLA: 441,533 sq ftValuation: S$360.0 million
EightriumNLA: 177,286 sq ftValuation: S$101.0 million
NLA: 1,240,583 sq ftValuation: S$306.0 million
COS PrintersNLA: 58,752 sq ftValuation: S$11.2 million
Tuas Connection
BK MarineNLA: 73,737 sq ftValuation: S$16.5 million
West Park BizCentral
NLA: 312,375 sq ftValuation: S$62.0 million
Valuation(1) S$1,243.7 million
Total NLA 3.93 million sq ft
WALE (by GRI) 3.4 years
Occupancy 89.6%
Portfolio Summary
CBD
Industrial Properties Business Park Properties
Tellus MarineNLA: 95,250 sq ftValuation: S$20.0 million
SEMBAWANG
NLA: 208,057 sq ftValuation: S$56.0 million
KTL Offshore
NK Ingredients
NLA: 93,767 sq ftValuation: S$25.0 million
Speedy-Tech
Notes:(1) Based on Knight Frank’s & Colliers’ valuations dated 31 December 2016.
NLA: 203,468 sq ftValuation: S$65.0 million
Loyang Way
NLA: 651,072 sq ftValuation: S$122.0 million
NLA: 377,776 sq ftValuation: S$99.0 million
Bukit Batok Connection

18
Occupancy From Multi-tenanted Properties
97.4
100.0
93.5
86.386.3
100.0
94.2
90.8
90.7
99.796.8
94.8
89.6
92.7
90.6 89.1 89.5
80.0
85.0
90.0
95.0
100.0
3Q FY2013 4Q FY2013 1Q FY2014 2Q FY2014 3Q FY2014 4Q FY2014 1Q FY2015 2Q FY2015 3Q FY2015 4Q FY2015 1Q FY2016 2Q FY2016 3Q FY2016 4Q FY2016
Occ
up
ancy
(%
)
Eightrium
TuasConnection
West ParkBizCentral
Portfolio
IndustrialAverage
Portfolio OccupancyAs at end of each quarter
3Q FY2013
4Q FY2013
1Q FY2014
2Q FY2014
3Q FY2014
4Q FY2014
1Q FY2015
2Q FY2015
3Q FY2015
4Q FY2015
1Q FY2016
2Q FY2016
3Q FY2016
4Q FY2016
Eightrium 97.4% 98.5% 100.0% 100.0% 100.0% 100.0% 100.0% 100.0% 100.0% 100.0% 100.0% 100.0% 100.0% 100.0%
Tuas Connection 100.0% 100.0% 100.0% 93.2% 100.0% 100.0% 100.0% 100.0% 93.5% 93.5% 86.3% 89.5% 86.3% 86.3%
West ParkBizCentral
100.0% 100.0% 100.0% 99.8% 99.8% 100.0% 100.0% 99.3% 99.6% 94.2% 92.3% 82.7% 90.8% 90.7%
Portfolio 99.8% 99.9% 100.0% 98.5% 99.9% 100.0% 100.0% 99.8% 98.7% 96.8% 94.8% 92.0% 94.8% 89.6%(1)
Industrial Average(2) 92.7% 91.9% 91.6% 90.7% 90.9% 90.9% 90.7% 91.0% 90.8% 90.6% 90.1% 89.4% 89.1% 89.5%
Notes:(1) Portfolio occupancy remains at 94.8% assuming full occupancy at 72 Loyang Way.(2) Source: JTC statistics as at 4Q 2016

19
Leasing Update
4Q FY2016
Note:(1) The average gross rent includes solely business park properties.(2) The average gross rent includes solely industrial properties.
No. of Leases Area (sqft)
Avg. Gross Rent before Renewal
Avg. Gross Rent after Renewal Rental Reversion
($ psf) ($ psf)
Renewal leases 1 9,924 $4.00(1) $3.58(1) (10.5%)
New leases 4 48,564 - $1.23(2) -
Forward renewal leases 1 21,689 $1.29(2) $1.26(2) (2.3%)
Total 6 80,177
Trade sector of leases signed in 4Q FY2016
By Gross Rental Income
2.1%
13.6%
17.8%
29.0%
37.5%
Oil & Gas
Others
Fabricated Metal Products
Information Technology
Precision Engineering

20
Leasing Update
FY2016 as at 31 December 2016
Note:(1) The average gross rent includes both industrial and business park properties;(2) The average gross rent includes solely industrial properties.
No. of Leases Area (sqft)
Avg. Gross Rent before Renewal
Avg. Gross Rent after Renewal Rental Reversion
($ psf) ($ psf)
Renewal leases 12 205,527 $1.89(1) $1.94(1) 2.6%
New leases 16 301,376 - $1.14(2) -
Forward renewal leases 4 112,481 $1.57(1) $1.50(1) (4.5%)
Total 32 619,384
Trade sector of leases signed as at FY2016
By Gross Rental Income
0.2%
4.5%
5.1%
7.8%
10.4%
11.2%
12.6%
48.2%
Food Products & Beverages
Oil & Gas
Information Technology
Construction
Fabricated Metal Products
Others
Financial
Precision Engineering

21
13.8% 15.3%
2.9%
11.2%
22.7%
16.6%
26.5%
8.3%6.0%
34.5%
14.1%
38.2%
7.7%5.6%
33.2%
0%
5%
10%
15%
20%
25%
30%
35%
40%
45%
2017 2018 2019 2020 >2020
Lease Expiry Profile By NLA Lease Expiry Profile By Gross Rental Income
Well Staggered Lease Expiry Profile
WALE (by NLA)
3.6 years
WALE(by Gross Rental Income)
3.4 years
Portfolio Lease Expiry ProfileBy % of NLA & % of Rental Income
Solaris Master Lease Expiry
Solaris Master Lease Expiry
9.9%
3.1%1.5%
5.6%
2.6%
Solaris Lease Expiry (by GRI)
< Aug 2018
> Aug 2018
2019
2020
>2020
Inclusive of temporary leases (% of NLA)West Park BizCentral: 52,927 sqft (1.3%)

22
11%
2%
13%
9%
10%
5%5%4%
11%
3%
10%
4%
5%3%2%
2% 1%Marine Offshore
Oil & Gas
Precision Engineering, Electrical andMachinery ProductsChemicals
Electronics
Others
Fabricated Metal Products
Publishing, Printing & Reproduction ofRecorded MediaInformation Technology
Supply Chain Management, 3rd PartyLogistics, Freight ForwardingReal Estate and Construction
Food Products & Beverages
Government Agency
Telecommunication & Datacentre
Education & Social Services
11%
11%
23%
21%
6%1%
1%2%
4%
2%
9%
9%
Eightrium @ Changi Business Park
Tuas Connection
West Park BizCentral
Solaris
NK Ingredients
COS Printers
Beng Kuang Marine
Tellus Marine
KTL Offshore
Speedy-Tech
Technics Offshore
Bukit Batok Connection
45%
55%
Multi-Tenanted
Master Lease
59%28%
8%5%
MNC
SME
SGX Listed Corporation
Government Agency
Well-Diversified Portfolio
1. Portfolio Income SpreadBy Property
2. Well-spread Trade SectorsBy Gross Rental Income
4. Balanced Portfolio with Growth UpsideBy Gross Rental Income
Note:(1) Revenue from Technics Offshore drawn down from existing security deposit; (2) Inclusive of underlying tenants at Solaris.
4Q FY2016 Gross
Revenue(1)
4Q FY2016
108 tenants in portfolio
3. Diversified Tenant BaseBy Gross Rental Income
% of Monthly Gross Rental
Income

23
Quality & Diverse Tenant Base
Top 10 Tenants
By Gross Rental Income (1)
Notes:(1) Based on monthly gross rental and includes underlying tenants at Solaris as at 31 December 2016.
Top 10 tenants contribute 42.6% of monthly gross rental income.
9.2%
5.6%
5.0%
4.3%
3.9%
3.9%
3.3%
2.8%
2.4%
2.2%
SB (Westview) Investment Pte. Ltd.
NK Ingredients Pte Ltd
SPRING Singapore
KTL Offshore Pte Ltd
Mediatek Singapore Pte Ltd
Autodesk Asia Pte Ltd
Nestle Singapore (Pte) Ltd
John Wiley & Sons (Singapore) Pte Ltd
Dyson Operations Pte Ltd
NXP Semiconductors Singapore Pte Ltd

24
2017 2018 2019
NK Ingredients COS Printers BK Marine
Tellus Marine KTL Offshore Speedy-Tech
Bukit Batok Connection
Growing Cashflows from Master Leases
1.0% 3.0%
Long-term Master LeasesLease Term from start of Master Lease Agreement
Fixed Annual Rental Escalation of Master Leases(1)
Rental Revenue (S$ million)
22.4 22.7 23.3
Master Leases feature long term leases ranging from 5 to 15 years provides stability
Master Leases provide organic growth through annual or bi-annual rental escalations
Risk mitigation through 6-18 month rental deposits from Master Lessees and blue chip sub-tenant base
Expected Stable and Growing Cash Flows from the Master Leases
Master Leases structured on a double and triple net lease basis, minimising expenses to Soilbuild REIT
1
2
3
4
Master Lease Property Date of Acquisition Lease Term Lease Expiry
1 Solaris 16-Aug-13 5 Years 15-Aug-18
2 Beng Kuang Marine 10-May-13 7 Years 9-May-20
3 KTL Offshore 31-Oct-14 7 Years 25-Aug-21
4 COS Printers 19-Mar-13 10 Years 18-Mar-23
5 Bukit Batok Connection 27-Sep-16 7 Years 26-Sep-23
6 Tellus Marine 26-May-14 10 Years 25-May-24
7 Speedy-Tech 23-Dec-14 10 Years 22-Dec-24
8 NK Ingredients 15-Feb-13 15 Years 14-Feb-28
Notes:(1) Excluding Master Lease rental from Solaris.
Market Update and Outlook

26
Industrial Properties Profile
95.7 93.492.2
91.7
105.9
104.0
101.8
100.9
96.495.4
91.2 91.0
100.0
103.9
104.4 104.2105.4
0
5
10
15
20
25
30
35
80.0
85.0
90.0
95.0
100.0
105.0
110.0
4Q 2012 1Q 2013 2Q 2013 3Q 2013 4Q 2013 1Q 2014 2Q 2014 3Q 2014 4Q 2014 1Q 2015 2Q 2015 3Q 2015 4Q 2015 1Q 2016 2Q 2016 3Q 2016 4Q 2016
Vac
ancy
rat
e (%
)
Ren
tal i
nd
ex
Multiple-User Factory Single-User Factory Warehouse Business Park
(4Q 2012 vs 4Q 2016) Multi-user Single-user Warehouse Business Park
Vacancy Rate (%) 3.0% 4.2% 3.2% 2.1%
Rental Index 8.3% 0.9% 9.0% 5.4%
Source: JTC (4Q 2016)
Rental index4Q2012 = 100

27
Industrial Space Supply
9.0 9.0 9.1 9.1 9.4 9.4 9.6 9.8 9.9 10.0 10.1 10.2 10.3 10.3 10.4 10.5 10.6
21.5 21.6 21.9 22.1 22.2 22.4 22.5 22.7 22.8 22.9 23.0 23.2 23.3 23.5 23.5 23.8 24.1
1.5 1.5 1.5 1.5 1.6 1.6 1.6 1.6 1.7 1.8 1.8 1.8 1.9 2.0 2.1 2.1 2.17.4 7.4 7.5 7.5 7.7 7.9 8.2 8.3 8.4 8.5 8.6 8.7 8.9 9.1 9.3 9.4 9.5
4Q2012
1Q2013
2Q2013
3Q2013
4Q2013
1Q2014
2Q2014
3Q2014
4Q2014
1Q2015
2Q2015
3Q2015
4Q2015
1Q2016
2Q2016
3Q2016
4Q2016
Multi-user Factory Single-user Factory Business Park Warehouse
Total Industrial Stock (‘million sq m)
since 4Q2012
39.4 39.5 40.0 40.2 40.9 41.3 41.9 42.4 42.8 43.2 43.5 43.9 44.4 44.9 45.3 45.8 46.3
17.5%
17.2% 12.2% 38.2% 28.4%
0.55 0.44 0.45
0.07
0.97
0.28 0.20
0.21 0.06
0.92
0.10 0.07
0.05
0.03
2017 2018 2019 2020 2021
Multiple-user factory Single-user factory
Warehouse Business Park
Total Industrial Supply in the Pipeline
2.44 0.84 0.72 0.33 0.06
Source: JTC (4Q 2016)

28
Market Update and Outlook
• Ministry of Trade and Industry (“MTI”) reported its advance estimates of 1.8% growthin Singapore’s economy year-on-year (“y-o-y”) in 4Q 2016, an improvement from 1.2%in the previous quarter.
• Overall, the economy grew by 1.8% for the whole of 2016, which is above MTI’s GDPgrowth forecast of “1.0% to 1.5%”.
• MTI cautioned the downside risks in the global economy, specifically lower externaldemand and weak demand conditions in the marine & offshore engineering segment.
• Purchasing Managers’ Index for December 2016 rose to 50.6, the strongest expansionsince November 2014.
Singapore’s Economy
• Rentals of all industrial properties softened by 0.5% in 4Q 2016 over the precedingquarter. Rental indices for single-user factories, multi-user factories and warehousecontracted 0.9%, 0.5% and 0.2% respectively over the previous quarter, while BusinessParks remain resilient at 1.2% rental upside in 4Q 2016.
• All industrial occupancy rate improved marginally by 0.4% to 89.5% in 4Q 2016, withthe largest rise in business park occupancy of 1.9%, followed by warehouse (0.6%),single-user factories (0.3%) and multi-user factories (0.2%) over the previous quarter.
Industrial
Property
Sector
• Portfolio occupancy in 4Q FY2016 is at 89.6% primarily due to the termination of leasewith Technics Offshore.
• The Manager has proactively negotiated and secured renewals and new leases forapproximately 620,000 sq ft of space as at 31 December 2016.
• For 2017, 13.7% of the portfolio’s net lettable area is due for renewal. The challengeremains to improve occupancy rate in this subdued market while maintaining existingleases.
SoilbuildBusiness
Space REIT

Thank You
Roy TeoChief Executive OfficerTel: (65) 6415 5983
Email: [email protected]
Lim Hui HuaChief Financial OfficerTel: (65) 6415 5985
Email: [email protected]
Key Contacts:
30
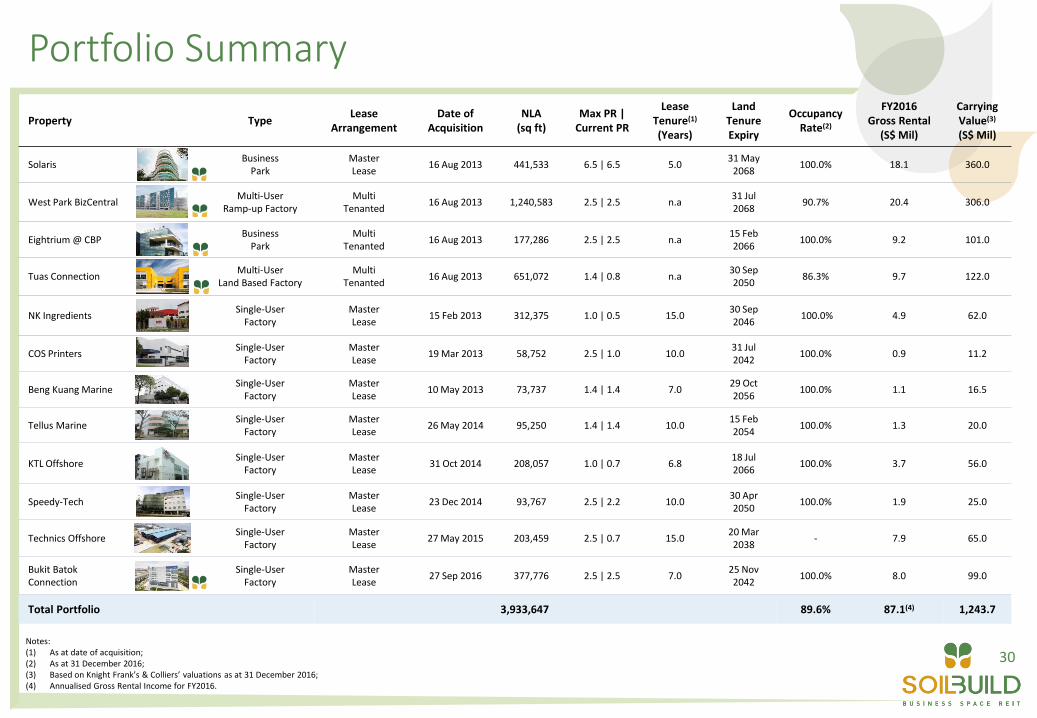
Portfolio Summary
Property TypeLease
ArrangementDate of
AcquisitionNLA
(sq ft)Max PR |
Current PR
Lease Tenure(1)
(Years)
Land Tenure Expiry
Occupancy Rate(2)
FY2016 Gross Rental
(S$ Mil)
Carrying Value(3)
(S$ Mil)
SolarisBusiness
ParkMaster Lease
16 Aug 2013 441,533 6.5 | 6.5 5.031 May
2068100.0% 18.1 360.0
West Park BizCentralMulti-User
Ramp-up FactoryMulti
Tenanted16 Aug 2013 1,240,583 2.5 | 2.5 n.a
31 Jul 2068
90.7% 20.4 306.0
Eightrium @ CBPBusiness
ParkMulti
Tenanted16 Aug 2013 177,286 2.5 | 2.5 n.a
15 Feb 2066
100.0% 9.2 101.0
Tuas ConnectionMulti-User
Land Based FactoryMulti
Tenanted16 Aug 2013 651,072 1.4 | 0.8 n.a
30 Sep 2050
86.3% 9.7 122.0
NK IngredientsSingle-User
FactoryMaster Lease
15 Feb 2013 312,375 1.0 | 0.5 15.030 Sep 2046
100.0% 4.9 62.0
COS PrintersSingle-User
FactoryMaster Lease
19 Mar 2013 58,752 2.5 | 1.0 10.031 Jul 2042
100.0% 0.9 11.2
Beng Kuang MarineSingle-User
FactoryMaster Lease
10 May 2013 73,737 1.4 | 1.4 7.029 Oct 2056
100.0% 1.1 16.5
Tellus MarineSingle-User
FactoryMaster Lease
26 May 2014 95,250 1.4 | 1.4 10.015 Feb 2054
100.0% 1.3 20.0
KTL OffshoreSingle-User
FactoryMaster Lease
31 Oct 2014 208,057 1.0 | 0.7 6.818 Jul 2066
100.0% 3.7 56.0
Speedy-TechSingle-User
FactoryMaster Lease
23 Dec 2014 93,767 2.5 | 2.2 10.030 Apr 2050
100.0% 1.9 25.0
Technics OffshoreSingle-User
FactoryMaster Lease
27 May 2015 203,459 2.5 | 0.7 15.020 Mar 2038
- 7.9 65.0
Bukit BatokConnection
Single-User Factory
Master Lease
27 Sep 2016 377,776 2.5 | 2.5 7.025 Nov 2042
100.0% 8.0 99.0
Total Portfolio 3,933,647 89.6% 87.1(4) 1,243.7
Notes:(1) As at date of acquisition; (2) As at 31 December 2016;(3) Based on Knight Frank’s & Colliers’ valuations as at 31 December 2016; (4) Annualised Gross Rental Income for FY2016.