presentation institutional 3q17 - bb · 2017-11-20 · institutional presentation 3q17. this...
TRANSCRIPT

Institutional
Presentation 3Q17

This presentation may include references and statements,
planned synergies, estimates, projections of results, and future
strategy for Banco do Brasil, its Associated and Affiliated
Companies, and Subsidiaries. Although these references and
statements reflect the management’s belief, they also involve
estimates and unforeseen risks. Consequently, results may
differ from those anticipated and discussed here. These
expectations are highly dependent on market conditions, on
Brazil’s economic and banking system performances, as well
as on international market conditions. Banco do Brasil is not
responsible for updating any estimate in this presentation.
Disclaimer

Index
Agenda 6
COMPANY PROFILE 7
Profile 8
Business diversification 9
Highlights 10
Ownership Structure 11
Presence in Brazil 12
Global Presence 13
Assets 14
Loan Portfolio 15
Total Loan Portfolio - Risk Level 16
Loan Portfolio (by closing date of the loan) 17
Disbursements 18
Loans to Individuals 19
Individuals Portfolio 20
Loans to Companies 21
Companies Portfolio by Macro-sector 22
Guarantees provided and Provisions 23
Agribusiness 24
Commercial Funding 25
Sources 26
Sources 27
Current Debt Issues Abroad 28
Uses 29
Ratings 30
Leaderships 31
Corporate Governance 32
Governance Timeline 33
Customer Segmentation 34
Digital Bank 35
Digital Strategy 36
Digital Strategy Evolution 37

Retail Relationship 38
B-Commerce 39
Service Digitalization 40
Credit Card / Digital Solutions 41
EARNINGS HIGHLIGHTS 42
Strategic Guidelines 43
Net Income 44
Earnings Breakdown 45
Market Indicators 46
Net Interest Income 47
Spread by Portfolio 48
Net Interest Margin 49
Earning Assets Breakdown 50
Assets and Liabilities Breakdown 51
BB’s Consolidated Net Position 52
Fee Income 53
Administrative Expenses 54
Delinquency Ratios 55
Delinquency Ratio by Segment 56
NPL Formation 57
NPL Formation by Segment 58
Vintages 59
ALL Balance and Coverage Ratio 60
Coverage Ratio by Segment 61
ALL Balance 62
Provision Expenses Flow / Loan Portfolio (%) 63
Average Risk and Loan Portfolio by Risk Level 64
Average Risk by Segment 65
Cost of Risk 66
Write-off 67
Renegotiated Overdue Loan Portfolio 68
Renegotiated Loan Portfolio 69
Index

BIS Ratio 70
Full Application of Basel III Rules 71
BIS III – Implementation Schedule 72
Guidance 2017 73
Banco Votorantim 74
MACROECONOMIC INFORMATION 75
Inflation and Selic Rate 76
Demographics: Population Pyramid 77
Population: Dependency Ratio 78
Social Security Deficit 79
Main Pillars of Brazilian Growth 80
Sustainable Growth 81
Brazilian Agribusiness 82
PPPs in Brazil 83
Brazilian Foreign Trade Balance 84
Summary Table 85
Summary Table 86
SUSTAINABILITY 87
Socio-environmental (SER) Policy 88
SER Governance 89
SER Strategy – Agenda 30 BB 90
SER Strategy – Agenda 30 BB 91
Socio-environmental Risk Management 92
Promotion of gender equity 93
Pacts and Voluntary Commitments 94
Market Indexes and Awards 95
Index

Agenda01 COMPANY
PROFILE
EARNINGS HIGHLIGHTS
SUSTAINABILITY
MACROECONOMIC INFORMATION
02
03
04

01COMPANY PROFILE

Founded in 1808
54.4%¹ controlled by the Federal Government
1st company listed on the stock exchange in Brazil
Access to a broad spectrum of clients
8
Profile
(1) Does not consider the treasury shares in the total capital.

Large, diversified and stable funding base
Business diversification including:
Banking
ServicesInsurance
Capital
Markets
Methods of
Payment
International
Franchise
Asset
Management
9
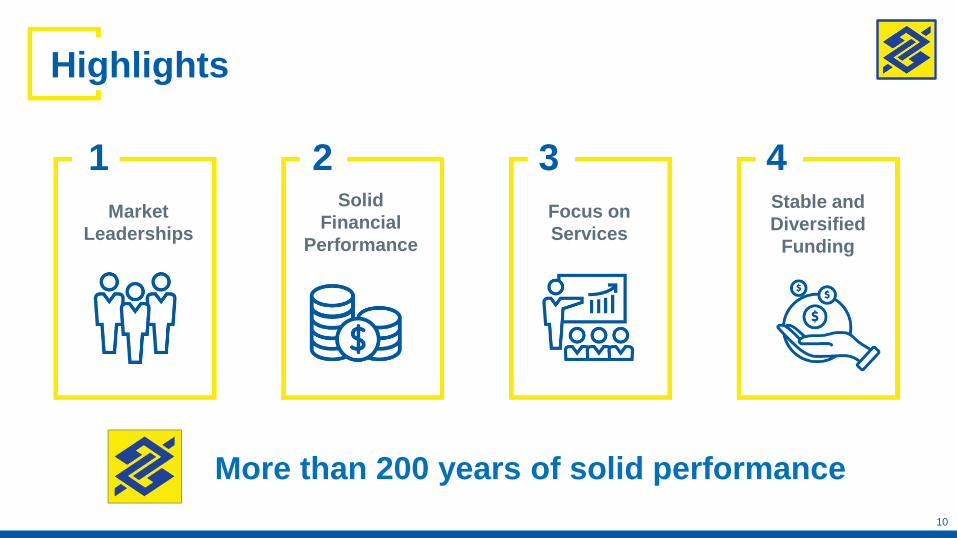
More than 200 years of solid performance
Market
Leaderships
Solid
Financial
Performance
Focus on
Services
Stable and
Diversified
Funding
1 2 3 4
Highlights
10
11
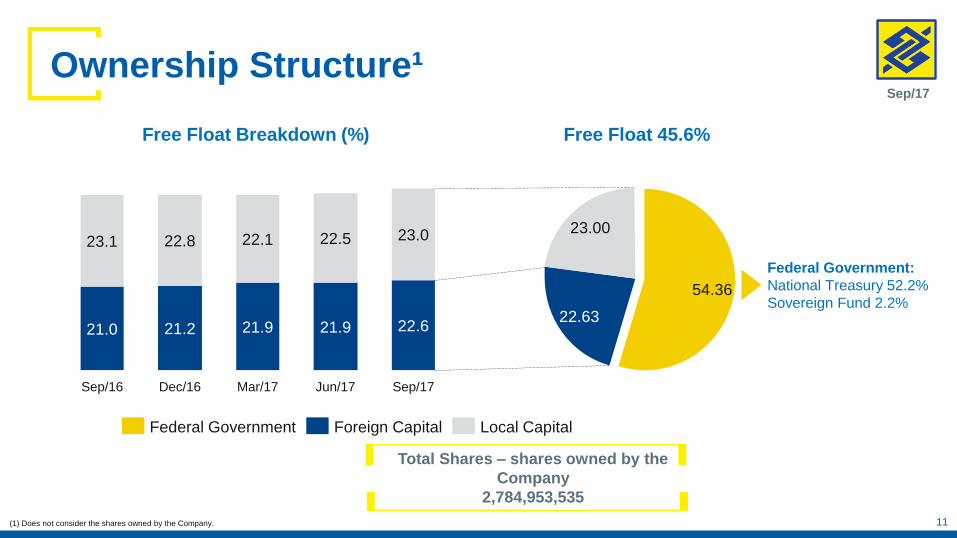
Free Float 45.6%
23.00
22.63
54.36
Local CapitalForeign CapitalFederal Government
Ownership Structure¹
11
Total Shares – shares owned by the
Company
2,784,953,535
Sep/17
Federal Government:
National Treasury 52.2%
Sovereign Fund 2.2%
Free Float Breakdown (%)
21.9
Dec/16
22.8
21.2
Sep/16
23.1
21.0
Sep/17
23.0
22.6
Jun/17
22.5
21.9
Mar/17
22.1
(1) Does not consider the shares owned by the Company.

Presence in BrazilBB at a Glance
Distribution Network
64,149
Branches
4,871
Customers
65,777 thousand
Employees
99,305
Market Share – 22.1%(Number of branches)
North 27.1%
Midwest 25.6%
Northeast 29.8%
Southeast 18.2%
South 23.2%
(1) Banking Agents and Postal Bank branches. (2) Shared Service Network: lotteries (CEF), Banco 24h e ATM (BRB+CEF).
$
Own Service Network
15,085
MaisBB Network¹
13,683Shared Service Network²
35,381
12
Sep/17
Points of Service
2,062$
Present in 99.8% of brazilian county

Banco do Brasil in the World
Branches
Sub-branches
Representative Offices
Subsidiaries, Affiliates and
Capital Markets Units
Shared Services Units
Global Presence
11
3
7
11
2
BB operates in 24
countries through a
network of 34 units. BB
also maintains
relationship with 889
correspondent banks in
107 countries.
13

Mar/17 Sep/17
1,445.61,399.9
Jun/17Dec/16
1,402.4
Sep/16
1,401.41,448.2
20.220.7 20.7
20.1
Market Share (%)¹Assets
Assets
14
2.2%
9.8%
13.3%
36.0%
38.7% • Loans
• Available Funds, Short-Term
Interbank Investments,
Interbank and Intrabank
Accounts
• Securities and Financial
Derivatives
• Other
• Permanent Assets
R$ billion
(1) Source: Brazilian Central Bank

Loan Portfolio – Expanded View¹R$ billion
(1) It includes private securities and guarantees provided. 15
-7.9-7.6-11.4-11.3
-6.9
Growth in 12 months (%)
Sep/17
677.0
267.7
187.5
180.7
41.2
Jun/17
696.1
277.2
185.9
188.2
44.9
Mar/17
688.7
280.8
185.1
180.1
42.7
Dec/16
708.1
294.7
187.8
179.8
45.7
Sep/16
735.4
316.8
187.6
179.6
51.5
CompaniesForeign Branches and Subsidiaries Agribusiness Individuals
7.0
43.1
25.5
24.4
39.5
6.1
26.7
27.7
%%
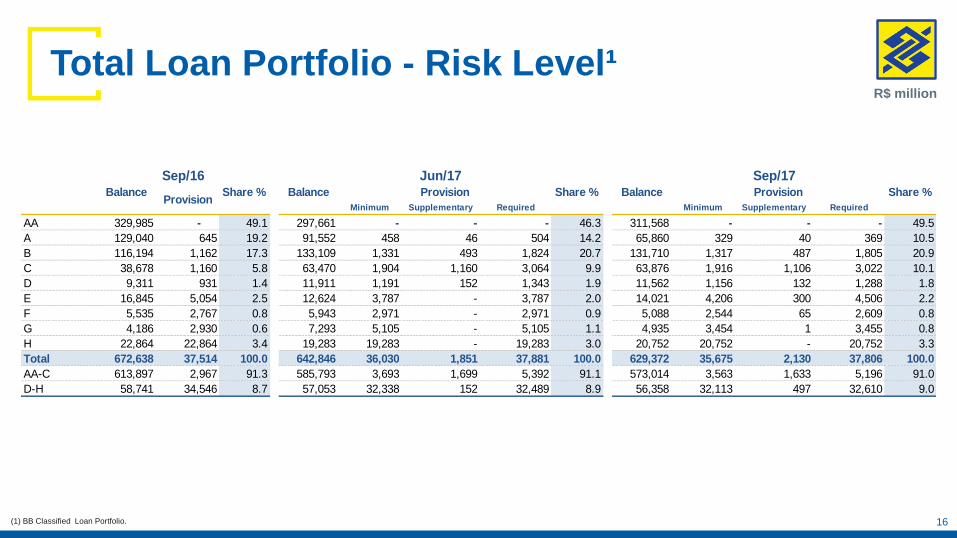
R$ million
Total Loan Portfolio - Risk Level¹
16(1) BB Classified Loan Portfolio.
Minimum Supplementary Required Minimum Supplementary Required
AA 329,985 - 49.1 297,661 - - - 46.3 311,568 - - - 49.5
A 129,040 645 19.2 91,552 458 46 504 14.2 65,860 329 40 369 10.5
B 116,194 1,162 17.3 133,109 1,331 493 1,824 20.7 131,710 1,317 487 1,805 20.9
C 38,678 1,160 5.8 63,470 1,904 1,160 3,064 9.9 63,876 1,916 1,106 3,022 10.1
D 9,311 931 1.4 11,911 1,191 152 1,343 1.9 11,562 1,156 132 1,288 1.8
E 16,845 5,054 2.5 12,624 3,787 - 3,787 2.0 14,021 4,206 300 4,506 2.2
F 5,535 2,767 0.8 5,943 2,971 - 2,971 0.9 5,088 2,544 65 2,609 0.8
G 4,186 2,930 0.6 7,293 5,105 - 5,105 1.1 4,935 3,454 1 3,455 0.8
H 22,864 22,864 3.4 19,283 19,283 - 19,283 3.0 20,752 20,752 - 20,752 3.3
Total 672,638 37,514 100.0 642,846 36,030 1,851 37,881 100.0 629,372 35,675 2,130 37,806 100.0
AA-C 613,897 2,967 91.3 585,793 3,693 1,699 5,392 91.1 573,014 3,563 1,633 5,196 91.0
D-H 58,741 34,546 8.7 57,053 32,338 152 32,489 8.9 56,358 32,113 497 32,610 9.0
Sep/16 Jun/17 Sep/17Balance
ProvisionShare % Balance Share % Balance Provision Share %Provision
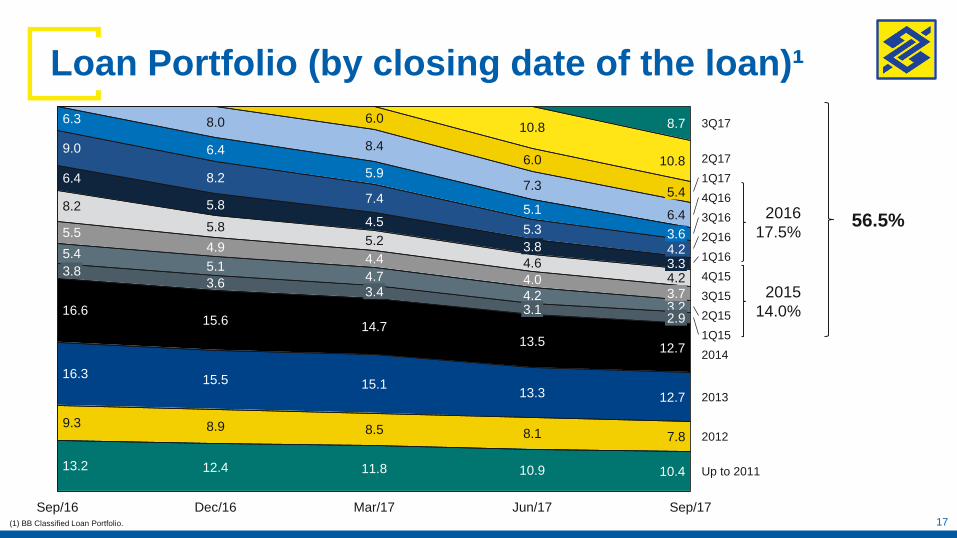
Loan Portfolio (by closing date of the loan)¹
17(1) BB Classified Loan Portfolio.
2016
17.5%
2015
14.0%
56.5%
4.7
4.4
5.2
7.4
4.5
4.9
5.1
5.85.5
9.3
16.3
16.6
5.4
3.8
5.8
8.2
6.4
Sep/16
8.0
8.5
4.23.1
2Q16
12.7
3Q16
1Q16
2Q15
3Q15
4Q15
2013
2014
1Q15
4.2
12.7
3Q17
Sep/17
7.8
4Q16
1Q17
2Q17
3.22.9
3.7
13.5
10.8
8.7
Jun/17
13.3
8.1
3.34.23.6
5.4
6.4
2012
4.0
Mar/17
7.3
6.0
10.8
3.8
9.0
5.1
4.6
6.3
3.6
15.6
6.4
8.2
14.7
15.1
3.4
15.5
5.3
5.9
8.4
6.0
8.9
Dec/16
Up to 201110.9 10.411.813.2 12.4

136168
12312091
117100
3Q172Q171Q174Q163Q162Q161Q16
195217
184
139
97106100
3Q162Q161Q16 3Q172Q171Q174Q16
126
171
86
140
91
157
100
4Q163Q162Q161Q16 3Q172Q171Q17
123157
12111199107100
3Q172Q171Q174Q163Q162Q161Q16
Brazil
Disbursements – quarterly average¹ (1Q16 base 100)
Agribusiness
Individuals
Companies
(1) Does not include revolving lines of credit and overdraft. 18

R$ million
Loans to Individuals¹
19(1) It considers the organic Loan Portfolio.
Sep/16 Jun/17 Sep/17
Payroll Loan 62,838 64,219 65,600
Mortgage 41,157 76.0% 43,049 76.2% 43,656 76.9%
Salary Loan 20,348 19,850 19,941
Auto Loan 6,799 5,432 5,091
Credit Card 22,844 23,627 23,612
Renegotiated Loan 7,236 8,139 8,288
Consumer Finance 7,010 6,110 5,144
Overdraft Account 2,830 2,425 2,333
Microcredit 757 538 480
Other 798 584 523
Total 172,617 173,972 174,669

+0.8%
Sep/17Jun/17
53.6
43.0
10.5
Sep/16
53.1
41.2
11.9
43.7
9.9
53.5
Mortgage - IndividualsMortgage -Companies
2.151.42 2.27
Individuals Mortgage NPL 90 (%)²
+4.4%
Sep/17Jun/17
64.2
87.8%
9.6% 2.6%
Sep/16
62.8
88.5%
8.5% 3.0%
87.7%
65.6
9.7% 2.6%
Civil ServantsINSS´s Retirees and PensionersPrivate Sector Employees
1.821.30 1.89
NPL +90 days (%)²
-2.0%
Sep/17Jun/17
19.8
Sep/16
20.3 19.9-25.1%
Sep/17Jun/17
5.4
Sep/16
6.8
5.1
4.942.78
4.86
NPL +90 days (%)²
1.290.97 1.06
NPL +90 days (%)²
R$ billion
Individuals Portfolio¹: Lower risk lines of credit
Individuals
Market
Share
7.8%
Market
Share
21.6%
(1) BB Organic Portfolio. (2) BB Classified Loan Portfolio.
PayrollMortgages
Auto LoansSalary Loans
20
6.1%
Chg. (%)
on
Sep/16
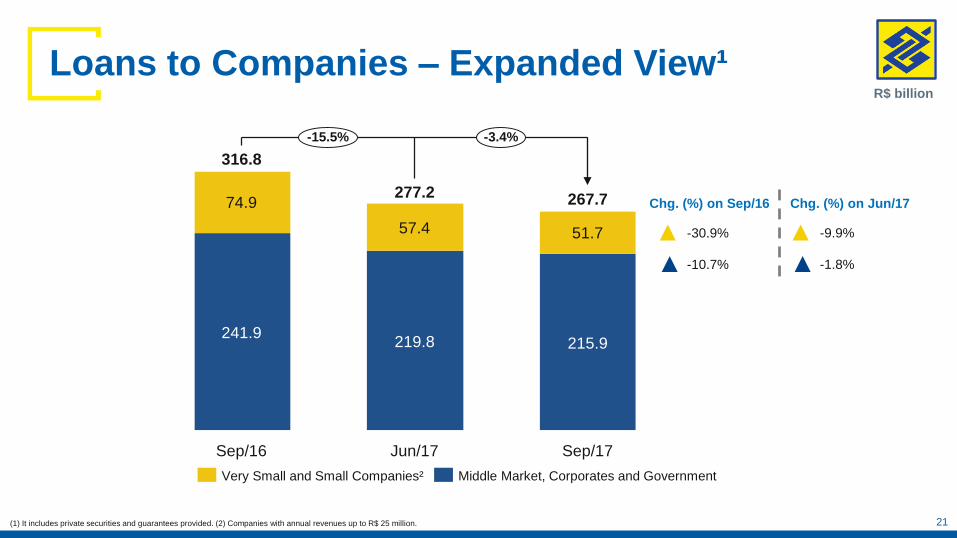
-3.4%-15.5%
Sep/17
267.7
215.9
51.7
Jun/17
277.2
219.8
57.4
Sep/16
316.8
241.9
74.9
Middle Market, Corporates and GovernmentVery Small and Small Companies²
-30.9%
-10.7%
21
-9.9%
-1.8%
(1) It includes private securities and guarantees provided. (2) Companies with annual revenues up to R$ 25 million.
Chg. (%) on Sep/16 Chg. (%) on Jun/17
R$ billion
Loans to Companies – Expanded View¹

Companies Portfolio by Macro-sector¹
22
R$ million
(1) It includes Companies and Agro Companies Portfolio.
Macro-Sector¹ Sep/16 Share % Jun/17 Share % Sep/17 Share % Sep/16 Jun/17
Oil and Gas 43,618 10.7 38,660 10.8 38,752 11.4 (11.2) 0.2
Public Administration 38,647 9.5 39,225 10.9 37,832 11.1 (2.1) (3.6)
Metalworking and Steel 37,618 9.2 32,264 9.0 30,683 9.0 (18.4) (4.9)
Food products of Vegetable Origin 30,974 7.6 30,129 8.4 30,257 8.9 (2.3) 0.4
Eletric Utilities 37,250 9.1 29,416 8.2 28,121 8.2 (24.5) (4.4)
Transportation 27,520 6.8 25,099 7.0 24,080 7.1 (12.5) (4.1)
Services 19,978 4.9 20,729 5.8 18,973 5.6 (5.0) (8.5)
Housing 20,399 5.0 17,640 4.9 16,545 4.8 (18.9) (6.2)
Automobiles and Components 20,403 5.0 15,944 4.4 15,100 4.4 (26.0) (5.3)
Food products of Animal Origin 15,829 3.9 15,538 4.3 14,844 4.4 (6.2) (4.5)
Retail 16,173 4.0 11,828 3.3 11,138 3.3 (31.1) (5.8)
Construction Materials 13,191 3.2 11,190 3.1 10,444 3.1 (20.8) (6.7)
Financials 16,066 3.9 12,187 3.4 10,394 3.0 (35.3) (14.7)
Agricultural inputs 9,033 2.2 8,038 2.2 7,563 2.2 (16.3) (5.9)
Electrical and Electronic Goods 7,529 1.8 6,792 1.9 6,712 2.0 (10.9) (1.2)
Textiles 9,247 2.3 7,242 2.0 6,594 1.9 (28.7) (8.9)
Chemicals 6,306 1.5 5,586 1.6 5,875 1.7 (6.8) 5.2
Telecommunication Services 5,964 1.5 7,548 2.1 5,767 1.7 (3.3) (23.6)
Pulp and Paper 8,403 2.1 6,045 1.7 5,321 1.6 (36.7) (12.0)
Wholesale and Other Industries 6,188 1.5 4,720 1.3 4,763 1.4 (23.0) 0.9
Furniture and Forest products 5,904 1.4 4,639 1.3 4,336 1.3 (26.6) (6.5)
Heavy Construction 7,207 1.8 4,859 1.4 4,183 1.2 (42.0) (13.9)
Leather and Shoes 2,415 0.6 2,066 0.6 1,761 0.5 (27.1) (14.8)
Beverages 1,395 0.3 1,279 0.4 1,150 0.3 (17.6) (10.1)
Other Activities 19 0.0 15 0.0 26 0.0 42.4 79.0
Total 407,275 100 358,679 100 341,215 100 (16.2) (4.9)
Balance Chg. (%) on

Guarantees provided and Provisions
Sep/17
324
13,928
Jun/17
356
15,254
Mar/17
379
17,178
Dec/16
431
17,957
Sep/16
491
18,241
ProvisionsGuarantees Provided
2.32.32.2
2.4
2.7
Provisions/Guarantees
R$ million
23
%
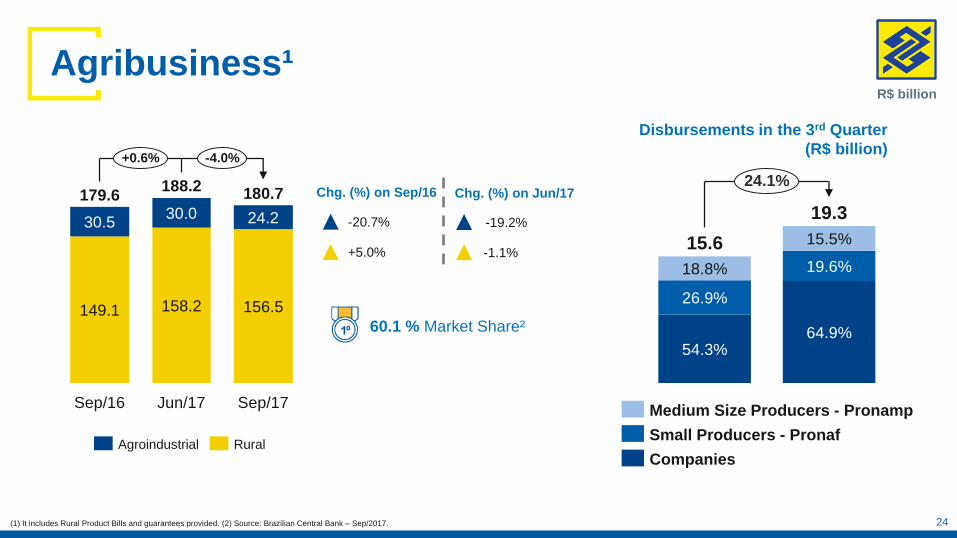
60.1 % Market Share²
+0.6%
Sep/17
180.7
156.5
24.2
Jun/17
188.2
158.2
30.0
Sep/16
179.6
149.1
30.5
-4.0%
RuralAgroindustrial
Agribusiness¹R$ billion
(1) It includes Rural Product Bills and guarantees provided. (2) Source: Brazilian Central Bank – Sep/2017. 24
+5.0%
-20.7%
Chg. (%) on Sep/16
-19.2%
-1.1%
Chg. (%) on Jun/17
54.3%64.9%
24.1%
19.3
15.5%
19.6%
15.6
18.8%
26.9%
Companies
Medium Size Producers - Pronamp
Small Producers - Pronaf
Disbursements in the 3rd Quarter
(R$ billion)
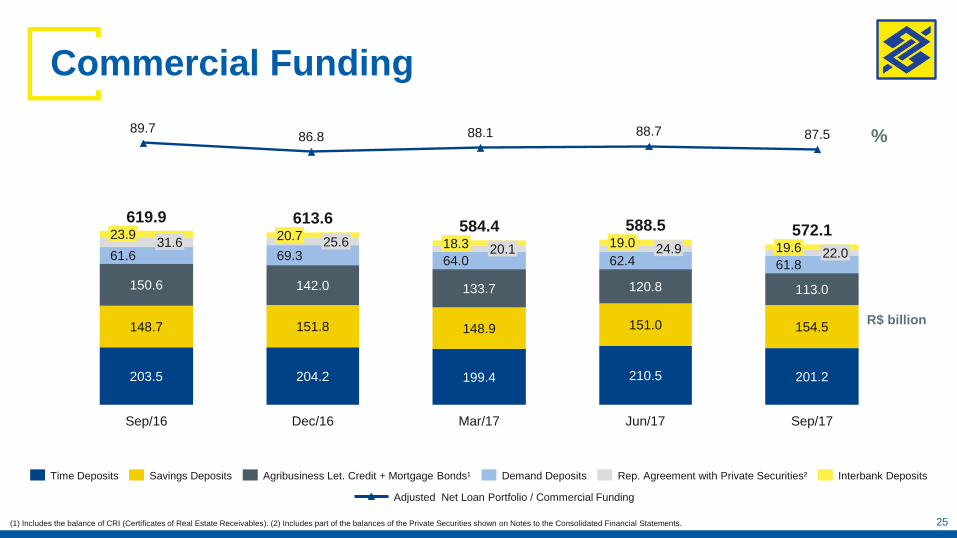
(1) Includes the balance of CRI (Certificates of Real Estate Receivables). (2) Includes part of the balances of the Private Securities shown on Notes to the Consolidated Financial Statements.
Sep/17
572.119.6 22.061.8
113.0
154.5
201.2
Jun/17
588.519.0 24.962.4
120.8
151.0
210.5
Mar/17
584.418.3 20.164.0
133.7
148.9
199.4
Dec/16
613.620.7
25.669.3
142.0
151.8
204.2
Sep/16
619.923.9
31.661.6
150.6
148.7
203.5
Interbank DepositsRep. Agreement with Private Securities²Demand DepositsAgribusiness Let. Credit + Mortgage Bonds¹Savings DepositsTime Deposits
R$ billion
25
87.588.788.186.889.7
Adjusted Net Loan Portfolio / Commercial Funding
%
Commercial Funding

Sources
26
R$ million
(1) Includes part of the balances of Private Securities on Notes to the Consolidated Financial Statements number 17.
(2) Includes Foreign Borrowing, Foreign Securities, Foreign Onlending and Subordinated Debt Abroad.
(3) Includes Financial Bonds and Debentures.
Mar/16 Jun/16 Sep/16 Dec/16 Mar/17 Jun/17 Sep/17
Commercial Funding¹ 638,611 624,778 619,944 613,611 584,445 588,506 572,091
Domestic Onlending 88,082 86,603 85,078 83,083 81,431 79,453 82,674
Subordinated Debt 58,049 58,648 60,027 61,976 61,123 62,306 62,943
Foreign Borrowing² 58,463 50,911 52,578 50,471 47,581 51,499 47,924
Hybrid Capital Instruments 34,806 31,068 31,825 31,466 31,206 31,753 31,253
Financial and Development Funds 14,781 13,741 14,620 14,791 14,817 14,837 14,842
Commercial Paper³ 2,309 2,384 2,673 2,734 2,812 3,088 3,899
Compulsory Deposits (62,613) (65,404) (63,637) (63,451) (61,619) (64,659) (69,442)
Total 832,489 802,728 803,107 794,680 761,795 766,782 746,184

Sources
27
Commercial Funding
Foreign
R$ million
(1) Includes part of the balances of the Private Securities shown on Notes to the Consolidated Financial Statements number 17. (2) Includes the balance of CRI (Certificates of Real Estate Receivables)
Mar/16 Jun/16 Sep/16 Dec/16 Mar/17 Jun/17 Sep/17
Foreign Securities 22,885 18,631 20,274 20,393 20,540 21,937 20,280
Foreign Borrowing 25,178 22,763 22,812 20,409 17,769 19,741 18,368
Subordinated Debt Abroad 10,400 9,517 9,491 9,668 9,271 9,821 9,275
Total 58,463 50,911 52,578 50,471 47,581 51,499 47,924
Cost Mar/16 Jun/16 Sep/16 Dec/16 Mar/17 Jun/17 Sep/17
Savings DepositsTR + (0.5% if Selic> 8.5%, or
70% of Selic)151,919 148,368 148,681 151,763 148,910 150,982 154,517
Judicial Deposits As Savings Deposits 114,140 116,655 119,281 121,969 121,931 130,514 124,782
Agribusiness Letters of Credits % of CDI 135,420 135,418 133,098 124,965 112,720 100,665 94,473
Time Deposits % of CDI 88,463 85,834 84,199 82,234 77,511 79,969 76,382
Demand Deposits - 62,631 62,550 61,623 69,349 63,960 62,385 61,793
Rep. Agreement with Private Securities¹ % of CDI 30,471 30,415 31,621 25,591 20,135 24,898 22,016
Interbank Deposits % of CDI 36,885 27,473 23,919 20,665 18,265 18,962 19,649
Mortgage Bonds² % of CDI 18,681 18,066 17,521 17,074 21,012 20,132 18,480
Total 638,611 624,778 619,944 613,611 584,445 588,506 572,091

Current Debt Issues Abroad
28(1) - A: annual; S: semiannual; Q: quarterly.
Issue Date Call Date Coupon (%)¹Term in
YearsMaturity
Amount issued
(US$ thousand)Currency
Rating
S&P/Moody's/FitchStructure
Outstanding
amount (US$
thousands)
04/29/2008 5,250 Q 10 06/15/2018 150.000 USD BBB / Ba1 / SR MT 100 18.000
10/20/2009 10/20/2020 8,500 S Perpetual Perpetual 1.500.000 USD SR / B2 / SR Stand Alone 1.498.500
01/22/2010 6,000 S 10 01/22/2020 500.000 USD BB / Ba2 / BB GMTN 500.000
10/05/2010 5,375 S 10 01/15/2021 660.000 USD SR / Ba3 / SR Stand Alone 660.000
05/26/2011 5,875 S 10 01/26/2022 1.500.000 USD SR / Ba3 / SR Stand Alone 1.500.000
01/20/2012 04/15/2023 9,250 S Perpetual Perpetual 1.000.000 USD B- / SR / SR Stand Alone 648.727
03/05/2012 04/15/2023 9,250 S Perpetual Perpetual 750.000 USD B- / SR / SR Stand Alone 750.000
06/19/2012 5,875 S 10 01/19/2023 750.000 USD B / Ba3 / SR Stand Alone 750.000
10/10/2012 3,875 S 10 10/10/2022 1.925.000 USD BB / Ba2 / BB Stand Alone 1.809.700
01/31/2013 04/15/2024 6,250 S Perpetual Perpetual 2.000.000 USD B- / SR / SR Stand Alone 1.988.000
07/25/2013 3,750 A 5 07/25/2018 929.775 EUR BB / Ba2 / BB GMTN 848.698
12/20/2013 2,500 A 5 06/20/2019 306.988 CHF BB / Ba2 / BB GMTN 283.886
03/26/2014 3,750 A 5 07/25/2018 417.210 EUR BB / Ba2 / BB GMTN 332.402
06/18/2014 06/18/2024 9,000 S Perpetual Perpetual 2.500.000 USD B- / B2 / SR Stand Alone 2.169.70010/23/2017 4,625 S 7 01/15/2025 1.000.000 USD BB / Ba2 / BB GMTN 1.000.000

Uses
29
Mar/16 Jun/16 Sep/16 Dec/16 Mar/17 Jun/17 Sep/17
Available Funds 116,384 106,045 122,741 139,059 124,617 123,694 120,660
Net Loan Portfolio (a) 716,105 696,683 680,366 655,621 637,178 643,088 625,524
Classified Loan Portfolio 703,878 691,832 672,638 653,591 638,336 642,846 629,372
Private Securities 47,625 41,819 45,242 38,100 35,256 38,124 33,958
Allowance for Loan Losses (35,398) (36,968) (37,514) (36,070) (36,414) (37,881) (37,806)
Adjusted Net Loan Portfolio (a) - (b) 589,982 572,451 556,270 532,435 514,963 522,162 500,789
Domestic Onlending Loans (b) 126,122 124,232 124,096 123,186 122,215 120,926 124,735
Total 832,489 802,728 803,107 794,680 761,795 766,782 746,184
R$ million

Banco do Brasil: Ratings
30
Sep/13 Sep/14 Sep/15 Sep/16 Sep/17
Standard & Poor's
Long-Term - Local Currency BBB BBB- BB+ BB BB
Long-Term - Foreign Currency BBB BBB- BB+ BB BB
Moody's
Long-Term Debt - Foreign Currency Baa1 Baa2 Baa3 Ba2 Ba2
Long-Term Deposits - Foreign Currency Baa2 Baa2 Baa3 Ba3 Ba3
Long-Term Deposits - Local Currency A3 Baa2 Baa3 Ba2 Ba2
Fitch Ratings
Long-Term - Local Currency BBB BBB BBB- BB BB
Long-Term - Foreign Currency BBB BBB BBB- BB BB

DepositsLoan PortfolioAssets under
Management²
(1) Comparison with the two largest Brazilian private banks. (2) It does not include Banco Votorantim. (3) Source: Anbima - Sep/17. (4) Source: Banco Central do Brasil - Sep/17. (5) Source: Banco Central do Brasil - Jun/17.
(6) Source: SUSEP – Year Accumulated up to Aug/17.
575.2
486.9
Bank A Bank BBB
677.0
259.6
Bank ABB
437.1
359.9
Bank B
852.3
Bank A
556.5
625.5
BB Bank B
19.5%
Market Share⁴
20.8%
Market Share⁵
22.9%
Market Share³
31
BB Seguridade6
Rural
Pension Plan
Life
Premium Bonds
Vehicle
Industry Leadership¹R$ billion

Corporate Governance
Decisions at any level of the Company are made in
Committees, involving several executives in the
definition of strategies and in the approval of
transactions and operations for the different
businesses lines of Banco do Brasil.
Customer Service and
Experience Executive
Committee
Credit Transactions
Committee
Human Resources
Appealing Committee
Information
Technology Committee
Risk, Asset and Liabilities, Liquidity and Capital Management Superior Committee
1 Superior Committee¹
14 Executive Committees¹
32(1) Base date: Septermber 30, 2017.
Profitability and
Performance Executive
Committee
Investor Relations
Executive Committee
Strategic Portfolio
Management Executive
Committee
Risk Management and
Internal Controls
Executive Committee
Asset and Liabilities,
Liquidity and Capital
Management Executive
Committee
Ethics and Discipline
Executive Committee
Prevention of Finan. and
Foreign Exch. Ilicit
transactions and Information
Security Exec. Committee
Products and Services
Executive Committee
Credit Transactions
Executive Committee
Human Resources
Executive Committee
Credit Limit Executive
Committee
Subsidiries and Affiliated Companies
Governance Executive Committee
Administrative and Operational
Executive Committee
Audit Commitee, Risk and Capital Committee, Compensation and Eligibility
Committee
3 Advisory Committees for the Board of Directors
The Only Brazilian Bank listed since 2006 in the
Novo Mercado segment which is comprised of
companies that voluntarily adopt the best
practices in corporate governance.
Other Committees
The Program for State-owned companies with
distinguished corporate governance was created by
B3 with the objective of encouraging state-owned
companies to improve their governance practices
and structures.

Governance Timeline
1st Brazilian
company listed on
the stock
exchange
BB Shares enter the
IBRX-50 portfolio
Bonus A
subscription
BB Shares enter
the B3 ITAG
portfolio
BB Shares enter the
ISE portfolio
Banco do Brasil
joined “Novo
Mercado” (B3)
BB Shares enter
Dow Jones
Sustainability
Index (DJSI) of NY
stock exchange
BB Seguridade
IPO
ADR Level I
Follow on
(secondary shares)
The Board of Directors of
BB approved the upgrade
of its program of
American Depositary
Receipt-ADR from level I
to level II
Inclusion of 100%
Tag Along clause
in the Bylaws.
Conversion of the
preferred shares to
common shares
Capitalization
and Restructuring
Plan
BB Shares enter the
IBrX portfolio
Private
placement of
common shares
linked to a public
offering for the
acquisition of
subscription
bonus
Follow on
(primary shares)
1995
1996
2002
1906
1998
20012003
2005
2006
2004
2009
2012
2013
2007
2010
2014
33
B3 Certification in the
Programa Destaque em
Governança de Estatais.
Maximum score in the IG-
SEST Governance
Indicator of the Ministry of
Planning, Development
and Management
2017

Customer Segmentation
34
Companies¹ Individuals
IndustrialCommerce and
Services
> R$ 1.5bn > R$ 2bn
> R$ 400mm
≤ R$ 1.5bn
> R$ 600mm
≤ R$ 2bn
> R$ 120mm
≤ R$ 400mm
> R$ 25mm
≤ R$ 120mm
> R$ 200mm
≤ R$ 600mm
> R$ 25mm
≤ R$ 200mm
Corporate
Empresarial Upper Middle
Empresarial Middle
> R$ 5mm ≤ R$ 25mm
> R$ 1mm ≤ R$ 5mm
≤ R$ 1mm
Empresa
Pequena Empresa
Microempresa
Large CorporatePrivate
Estilo²
Personalizado /
Exclusivo²
Varejo
Annual Income ≥ R$ 10mm
Investments ≥ R$ 2mm
Monthly Income ≥ R$ 10k
Investments > R$ 150k ≤ R$ 2mm
Monthly Income ≥ R$ 4k < R$ 10k
Investments > R$ 80k ≤ R$ 150k
Monthly Income ≥ R$ 2k < R$ 4k
Investments > R$ 5k ≤ R$ 80k
Mercado EmergenteMonthly Income < R$ 2k
Investments ≤ R$ 5k
(1) Based on Companies annual revenues. (2) Digital Service only.

Digital
Bank

Digital Strategy – Improving customer experience
Branch
Relationship Manager
DIGITAL RELATIONSHIP
Manager
Specialized
Advisory
Human Solutions Digital Solutions
Telephone
Chat / messages
Videoconference
Documents Electronic Exchange
Double Confirmation
From 10am to 4pm From 8am to 6pm
From 10am to 4pmFrom 8am to 10pm
Ind
ivid
ua
lsC
om
pa
nie
s
36

(1) Refers to the customers in the Estilo, Exclusivo e Personalizado segments. (2) Refers to the customers in the Estilo e Exclusivo segments. (3) Refers to the customers in the Personalizado and traditional Estilo segments.(4) Since Jul/17, clients with monthly income ≥ R $ 10 thousand or investments > R$ 150 thousand ≤ R$ 2 million. (5) Since Jul/17, clients with monthly income ≥ R$ 4 thousand < R$ 10 thousand or investments > R$ 80 thousand ≤ R$ 150 thousand..
Digital Strategy Evolution
Until December 20173.3 million high income customers in the digital models
Sep/17Sep/16
4.6 MM4.1 MMHigh income customers ¹
2.3 MM1 MMH.I. customers in the digital model²
2.3 MM3.1 MMH.I. customers (traditional)³
ESTILO4
9
Digital service 249Branches
1.2 MMCustomers
Customers
EXCLUSIVO5
63Digital service
1 MM0.11 MM
11
Offices
216
0.9 MM
-
Offices
Customers
37
Dec/16
1,736
1,260
Jun/17
1,796
2,292
Mar/17 Sep/17 Dec/17
estimated
3,300
175
421
Sep/15 Dec/15 Mar/16
536 604
1,023
Jun/16 Sep/16
High income customers in
the digital model (million)

More than 1 millionof Conta Fácil¹,
representing 1/3 of the
accounts opened in BB
(1) From November 01, 2016 to September 30, 2017.
Retail Relationship: Conta Fácil
38

CRM /
ANALYTICS
CUSTOMER
EXPERIENCEDIGITAL SOLUTIONS+
Implementation of segmented market actions with volume of business over
R$ 3 billion¹, involving more than 2,000 clusters.
Conversion rate is seven times higher
(1) Since the beginning of the initiative in February/17 up to October/17.
B-Commerce
39
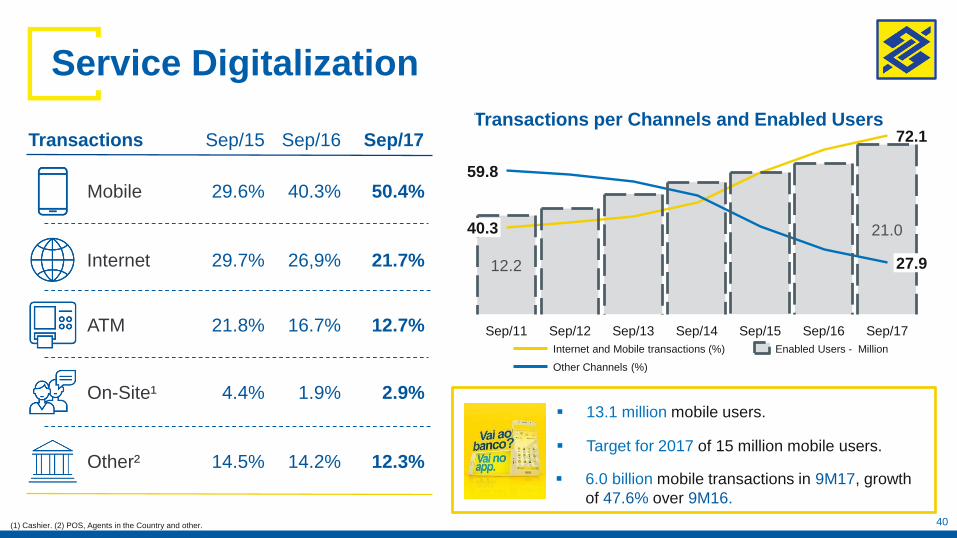
Service Digitalization
(1) Cashier. (2) POS, Agents in the Country and other.
Internet
Mobile
ATM
On-Site¹
Other²
26,9%
40.3%
16.7%
1.9%
14.2%
Transactions Sep/16
21.7%
50.4%
12.7%
2.9%
12.3%
Sep/17
29.7%
29.6%
21.8%
4.4%
14.5%
Sep/15
13.1 million mobile users.
6.0 billion mobile transactions in 9M17, growth
of 47.6% over 9M16.
Target for 2017 of 15 million mobile users.
Transactions per Channels and Enabled Users
21.0
Sep/16 Sep/17Sep/15
72.1
27.9
Sep/14Sep/13
12.2
40.3
59.8
Sep/12Sep/11
Internet and Mobile transactions (%) Enabled Users - Million
Other Channels (%)
40
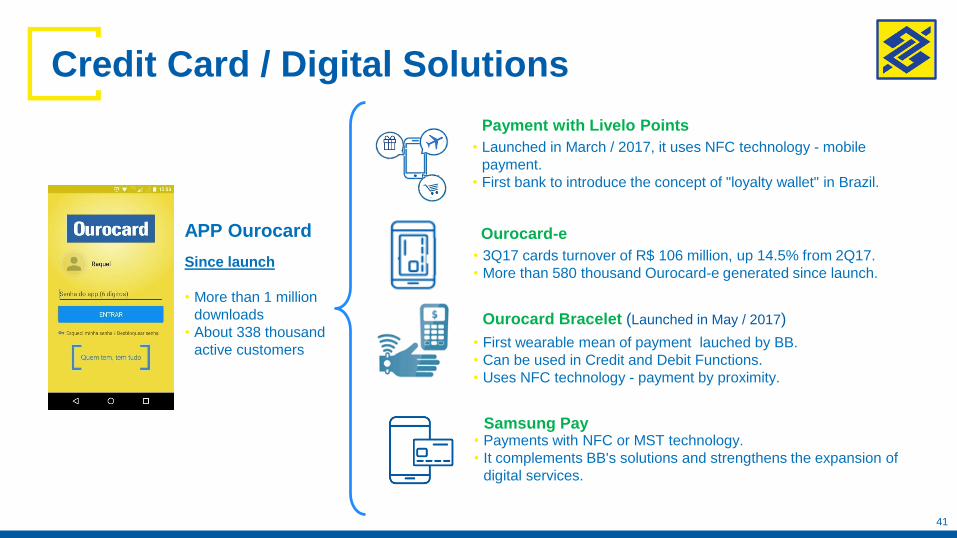
Credit Card / Digital Solutions
Payment with Livelo Points
APP Ourocard
Samsung Pay
Ourocard Bracelet (Launched in May / 2017)
Ourocard-e
Since launch
• More than 1 million
downloads
• About 338 thousand
active customers
• Launched in March / 2017, it uses NFC technology - mobile
payment.
• First bank to introduce the concept of "loyalty wallet" in Brazil.
• Payments with NFC or MST technology.
• It complements BB's solutions and strengthens the expansion of
digital services.
• First wearable mean of payment lauched by BB.
• Can be used in Credit and Debit Functions.
• Uses NFC technology - payment by proximity.
• 3Q17 cards turnover of R$ 106 million, up 14.5% from 2Q17.
• More than 580 thousand Ourocard-e generated since launch.
41

02EARNINGSHIGHLIGHTS

Profitability,
efficiency, control of
delinquency and
capital
Customer
Experience
Digital
Transformation
Str
ate
gic
Gu
ide
lin
esHighlights 9M17 / 9M16
Fee Income
9.9% growth.
Administrative Expenses
Under control, 2.7% decline.
Cost to income ratio¹
Reached 38.5%.
(1) Cost to Income Ratio: Administrative Expenses / Operating Revenues accumulated in 12 months in 3Q17. Data from the Income
Statement with Reallocations.43

Net Income
+45.1%
9M179M16
5.424
2.337
2.708
3.087
7.872
5.164
Adjusted Net Income 1HAdjusted Net Income 3Q
+11.8%
9M179M16
7.070
2.246
5.062
7.903
2.841
4.824
Net Income 1HNet Income 3Q
44
3Q16 2Q17 3Q17 9M16 9M17
Shareholders ROE % 13.4 14.1 14.1 10.1 13.5
Market ROE % 12.0 12.8 12.8 9.1 12.3
Profitability Ratios
R$ billion

Earnings Breakdown
45
(3.24)
(4.68)
6.56
(6.26)
14.25
2.840.132.71
(3.93)
(7.92)
Personnel
Expenses
(9.38)
(14.17)
Fee Income
19.21
ALL
(19.63)
NII
43.33
Net Income
7.90
One-Off Items
0.03
Adjusted
Net Income
7.87
Other
(11.48)
Administrative
Expenses
(23.55)
3Q17
9M17
R$ billion
Personnel
Expenses

Market IndicatorsDividend Yield² (%)Earnings per Share
Price/Book ValuePrice/Earnings 12 months
(1) Bloomberg estimative in November 14, 2017 based on analysts’ projections average. Banco do Brasil is not responsible for this information. (2) Dividends and Interest on Capital 12 months / Market Capitalization. Source: Economatica.
Source: Economatica.
2017E¹
7.96
3Q17
10.96
2Q17
9.02
1Q17
11.59
4Q16
9.74
3Q16
6.63
2018E¹
6.85
2Q17
0.82
1Q17
1.05
4Q16
0.90
3Q16
0.74
3Q17
1.04
2018E¹
0.86
2017E¹
0.95
2017E¹
3.46
3Q17
2.68
2Q17
3.26
1Q17
2.57
4Q16
3.01
3Q16
4.86
2018E¹
3.93
3Q17
0.971.01
2Q17
0.950.94
1Q17
0.900.86
4Q16
0.63
0.34
3Q16
0.840.80
Adjusted Earnings per Share - R$Earnings per Share - R$
2018E¹
4.474.59
2017E¹
3.853.97
2016
2.572.84
2015
4.12
5.05
Source: Economatica.
46

Net Interest Income
(1) It includes senior bonds, subordinated debt, and Hybrid Instruments in Brazil and abroad.
(2) It includes the result from interest, tax hedging, derivatives, and other financial instruments that offset the effects of the exchange rate variation on result.
(3) Series revised (Funding Expense for Institutional Funding to Treasury).
R$ million
47
Chg. (%) on
3Q16 2Q17 9M16
Net Interest Income 15,099 14,606 14,247 (5.6) (2.5) 44,008 43,330 (1.5)
Net Interest Income W/O Recovery 14,131 13,212 13,153 (6.9) (0.4) 40,796 39,886 (2.2)
Loan Operations 26,117 21,786 21,412 (18.0) (1.7) 76,506 66,809 (12.7)
Funding Expenses (11,366) (8,404) (7,814) (31.3) (7.0) (33,330) (25,972) (22.1)
Financial Expense for Institutional Funding¹ ³ (3,524) (3,040) (3,197) (9.3) 5.2 (10,358) (9,603) (7.3)
Treasury² ³ 2,904 2,870 2,753 (5.2) (4.1) 7,978 8,652 8.5
Recovery of Write-offs 968 1,394 1,094 13.0 (21.6) 3,212 3,444 7.2
9M16 9M173Q16 2Q17 3Q17Chg. (%) on
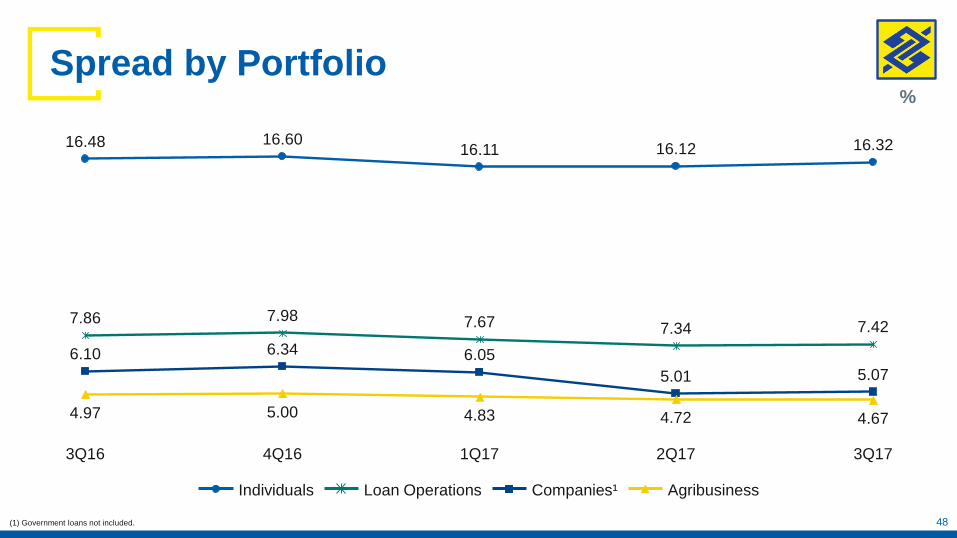
Spread by Portfolio
(1) Government loans not included.
2Q17
4.72
5.01
7.34
16.12
1Q17
4.83
6.05
7.67
16.11
4Q16
5.00
6.34
7.98
16.60
3Q16
4.97
6.10
7.86
16.48
3Q17
16.32
7.42
5.07
4.67
AgribusinessCompanies¹Loan OperationsIndividuals
48
%

49
3Q17
2.54
4.56
2Q17
2.54
4.70
1Q17
2.54
4.77
4Q16
2.54
5.00
3Q16
2.69
4.83
%
Risk Adjusted NIMNet Interest Margin (NIM)
(1) Net interest income / average balance of earnings assets, annualized.
Net Interest Margin¹
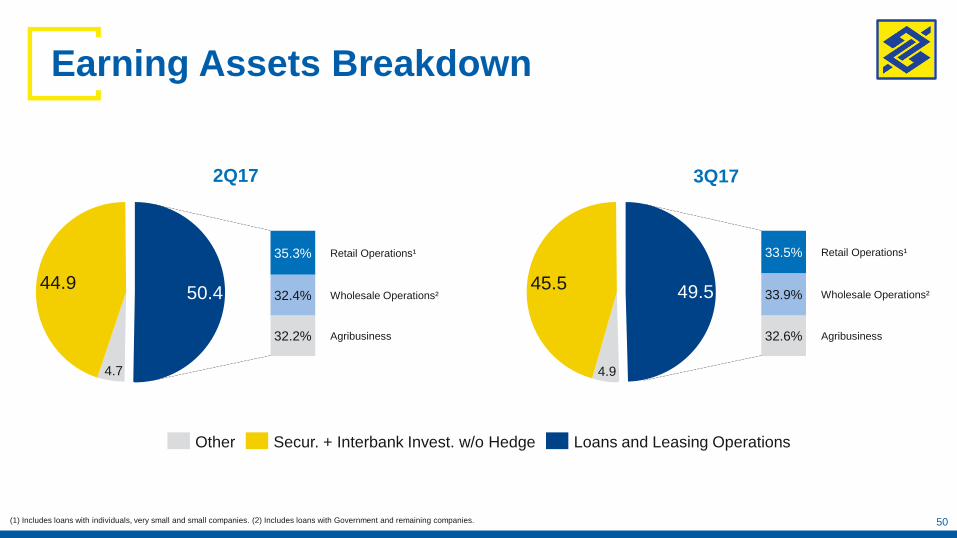
Earning Assets Breakdown
50
50.444.9
4.7
Other Loans and Leasing OperationsSecur. + Interbank Invest. w/o Hedge
49.545.5
4.9
35.3%
32.4%
Agribusiness
Wholesale Operations²
Retail Operations¹
32.2%
33.5%
33.9%
32.6% Agribusiness
Retail Operations¹
Wholesale Operations²
3Q172Q17
(1) Includes loans with individuals, very small and small companies. (2) Includes loans with Government and remaining companies.

Assets and Liabilities Breakdown
51
R$ billion
Liabilities
11.2%
0.3% 2.4%
19.6%
15.9%
25.9%
24.6%
Assets
4.7%1.3% 1.7%
10.7%
15.4%
16.5%
49.8%
W/O Index ⁵
Price Index ²
TJLP ⁴
IRP/TBF/TR ⁷
US$ / Gold ³
CDI / TMS / FACP ⁶
Fixed ¹
Sep/17
1,558
(1) Fixed rate (2) Inflation linked rate (3) Foreign Exchange rate and gold (4) Long term reference rate (5) W/O index: non-interest bearing liabilities (6) Short term rate (7) Savings reference rate

BB’s Consolidated Net Position
52
R$ billion
-8.1
15.0
391.2
-139.1-146.2
-101.3
-11.5
IRP/TBF/TR ⁷CDI / TMS / FACP ⁶W/O Index ⁵TJLP ⁴US$ / Gold ³Price Index ²Fixed ¹
Sep/17
(1) Fixed rate (2) Inflation linked rate (3) Foreign Exchange rate and gold (4) Long term reference rate (5) W/O index: non-interest bearing liabilities (6) Short term rate (7) Savings reference rate

R$ million
Fee Income
53
Chg. (%) on
3Q16 2Q17 9M16
Fee Income 5,972 6,432 6,562 9.9 2.0 17,476 19,207 9.9
Checking Account Fees 1,600 1,712 1,777 11.1 3.8 4,569 5,087 11.3
Asset Management Fees 1,119 1,336 1,419 26.9 6.2 3,198 4,051 26.6
Insurance, Pension and Premium Bonds 751 665 809 7.7 21.5 2,283 2,237 (2.0)
Credit / Debit Cards 460 486 487 5.9 0.1 1,342 1,460 8.8
Loan Fees 374 550 403 7.5 (26.8) 1,179 1,365 15.8
Collections 424 372 354 (16.3) (4.8) 1,264 1,109 (12.2)
Billings 254 270 270 6.4 0.0 771 813 5.4
Capital Market 165 180 198 20.1 10.4 485 548 13.0
Consortium 156 175 191 22.3 9.3 394 527 33.6
National Treasury and Manag. of Official Funds 151 171 177 17.7 3.8 432 515 19.2
Interbank 45 39 36 (18.6) (7.5) 134 117 (12.6)
Other 475 475 440 (7.3) (7.3) 1,424 1,377 (3.3)
3Q16 2Q17 3Q17 9M16 9M17Chg. (%) on

38.539.7
Cost to Income Ratio (12 months)
-2.7%
9M17
23,553
9,380
14,173
9M16
24,201
9,173
15,028
Other Administrative ExpensesPersonnel Expenses
R$ million
54
-6.0%
3Q17
7,915
3,236
4,679
2Q17
7,864
3,047
4,817
3Q16
8,419
3,137
5,283
38.538.939.7
(1) Cost to Income Ratio: Administrative Expenses / Operating Revenues. Data from the Income Statement with Reallocations. (2) Very Small and Small Companies.
Sep/16 Sep/17
Points of Service
Employees
Branches
109,159 99,305
5,430 4,871
1,736 2,062
Own Service Network 17,092 15,085
Exclusivo Office
216 249
Estilo Office - 9
Customer Service
Points326 762
Estilo Branch
11 63
MPE² Office 11 39
-0.3
-0.3
-2.6
-6.3
-0.4
200.0
-5.9
61.5
21.9
5,192 4,511Traditional Branches -1.1
238 360Digital Service 11.1
∆ Sep/17 (%)
on Sep/16 on Jun/17Jun/17
99,603
4,885
2,117
16,098
250
3
810
39
32
4,561
324
-9.0
-10.3
18.8
-11.7
15.3
133.7
472.7
254.5
-13.1
51.3
-
Administrative Expenses and Cost to Income Ratio¹
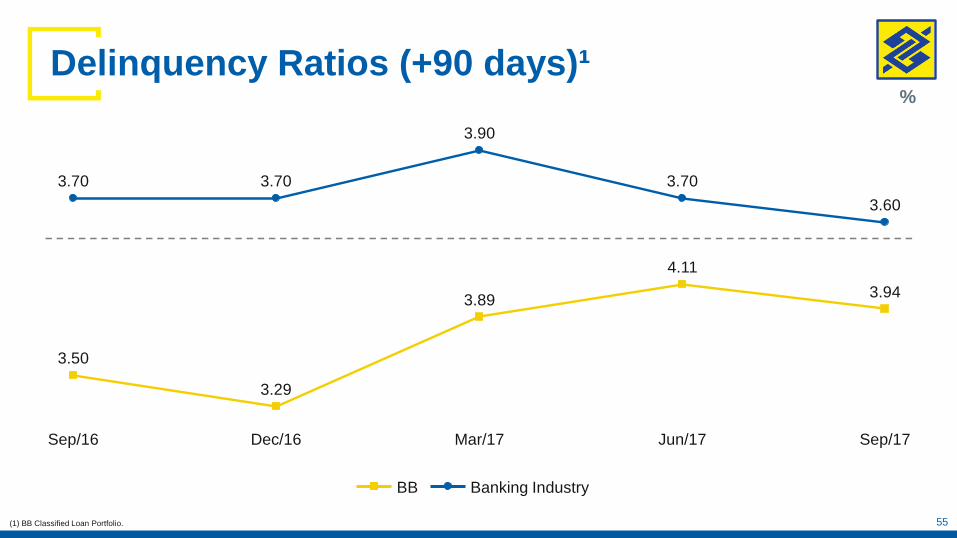
Sep/17
3.94
Jun/17
4.11
Mar/17Dec/16
3.29
Sep/16
3.50
3.89
BB
55
3.70
3.90
3.703.70
3.60
Banking Industry
Delinquency Ratios (+90 days)¹
(1) BB Classified Loan Portfolio.
%

Sep/17
2.59
8.93
6.58
Jun/17
2.24
9.41
6.46
Mar/17
2.30
11.09
6.94
Dec/16
1.81
9.29
5.26
Sep/16
1.79
8.47
5.97
6.83
Sep/17
1.61
6.70
3.49
Jun/17
1.39
7.35
3.34
Mar/17
1.28
3.09
Dec/16
0.99
5.83
2.67
Sep/16
0.96
5.26
2.56
NPL Ratio +90 days (%) NPL Ratio +15 days (%)
AgribusinessCompaniesIndividuals
Delinquency Ratio¹ by Segment
56(1) BB Classified Loan Portfolio.

NPL Formation
6.97
3Q16
7.12
2Q16
9.73
1Q16
7.39
4Q15
6.22
3Q15
5.59
2Q17
6.84
1Q17
9.75
4Q16
4.68
3Q17
0.731.07
1.49
1.041.031.38
1.030.870.81
133.6697.40
68.82107.4393.3285.05
123.80112.32104.30
2Q17
8.44
1Q17
10.10
4Q16
7.63
3Q16
7.55
2Q16
10.48
1Q16
7.93
4Q15
7.13
3Q15
6.16
3Q17
5.13
New NPL (R$ billion)¹
24.16% of the total
contracts in 3Q17were 90
days past due transactions.
Including the past
due renegotiated
loan portfolio³
57
78.94
121.90
78.8766.4798.1488.03
115.3498.1094.70
Quarterly ALL/New NPL (%)
0.801.32
1.551.13
1.09
1.491.101.000.89
New NPL / Loan Portfolio (%)²
(1) Quarterly change in the balance of over 90 days past due transactions + current quarter write-off. (2) It considers the Classified Loan Portfolio of the previous quarter.
(3) Flow of the Renegotiated loan portfolio contracts of over 90 days past due transactions.
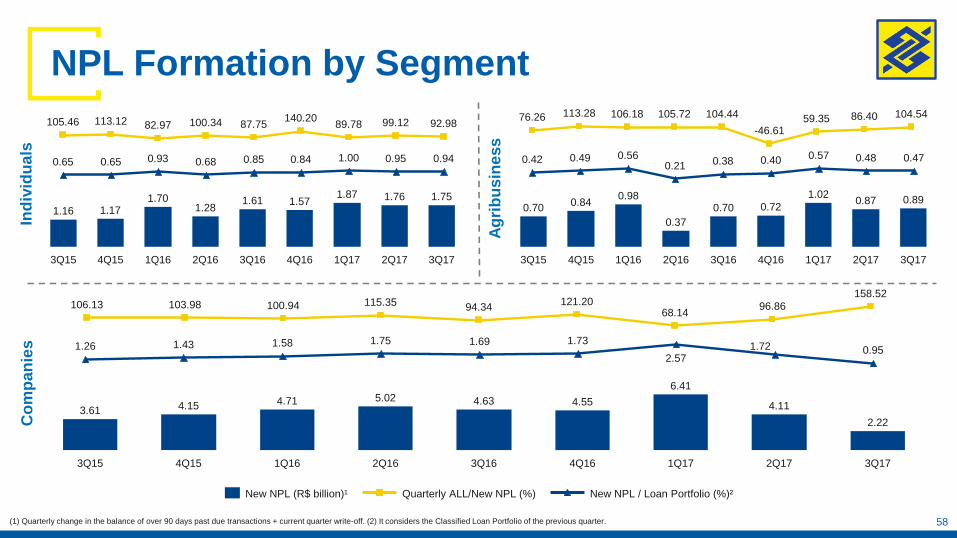
NPL Formation by Segment
2Q17
1.76
1Q17
1.87
4Q16
1.57
3Q16
1.61
2Q16
1.28
1Q16
1.70
4Q15
1.17
3Q15
1.16
3Q17
1.75
0.951.000.840.850.680.930.650.65 0.94
99.1289.78140.20
87.75100.3482.97113.12105.46 92.98
Ind
ivid
ua
ls
Ag
rib
us
ine
ss
2Q17
4.11
1Q17
6.41
4Q16
4.55
3Q16
4.63
2Q16
5.02
1Q16
4.71
4Q15
4.15
3Q15
3.61
3Q17
2.22
New NPL (R$ billion)¹
158.52
96.86121.2094.34115.35100.94103.98106.13
68.14
Quarterly ALL/New NPL (%)
0.951.721.731.691.751.581.431.26
2.57
58
Co
mp
an
ies
2Q17
0.87
1Q17
1.02
4Q16
0.72
3Q16
0.70
2Q16
0.37
1Q16
0.98
4Q15
0.84
3Q15
0.700.89
3Q17
86.4059.35-46.61
104.44105.72106.18113.2876.26 104.54
0.480.570.400.380.210.560.490.42 0.47
New NPL / Loan Portfolio (%)²
(1) Quarterly change in the balance of over 90 days past due transactions + current quarter write-off. (2) It considers the Classified Loan Portfolio of the previous quarter.

Vintages
59
Annual Vintage – Individuals Loan Portfolio
0 10 20 30
5.00%
4.00%
3.00%
2.00%
1.00%
0.00%
Delin
quency
90 d
ays
Months
40 50 0
0%
Months
5%
10%
15%
20%
10 20 30 40 50
Annual Vintage – Very Small and Small Companies
Loan Portfolio
Delin
quency
90 d
ays
Vintage: 2010A 2011A 2012A 2013A 2014A 2015A 2016A 2017A Vintage: 2010A 2011A 2012A 2013A 2014A 2015A 2016A 2017A

186.5
174.4178.4175.7
186.1
152.3
143.3146.5
167.7
159.4
ALL Balance and Coverage Ratio
R$ million
(1) Banking Industry: Ratio created through Average Risk Index available at SGS (Time Series Management System) of the Brazilian Central Bank. 60
Jun/17
37,8811,851
36,030
Mar/17
36,4141,686
34,728
Dec/16
36,0701,535
34,535
Sep/16
37,514
Sep/17
37,8062,130
35,675
Supplementary ProvisionMinimum ProvisionRequired Provision
(%)
BB +90 days BI +90 days¹

Coverage Ratio by Segment
3Q17
161.7
137.8
171.2
2Q17
167.0
126.0
177.1
1Q17
181.7
128.3
183.9
4Q16
228.9
145.8
199.6
3Q16
295.6
141.0
190.9
AgribusinessCompaniesIndividuals
61
%
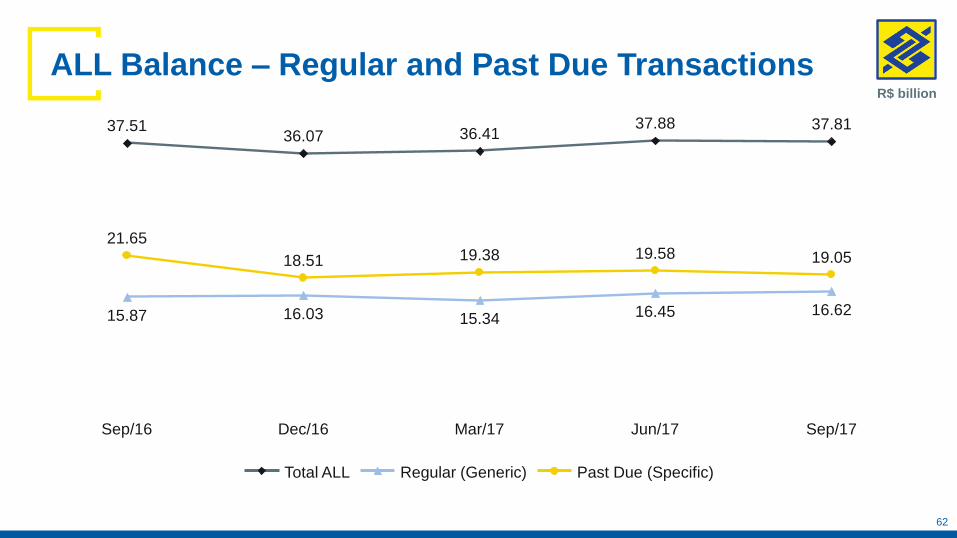
ALL Balance – Regular and Past Due Transactions
62
15.34
36.41
Dec/16
18.51
16.03
36.07
Sep/16
21.65
15.87
37.51
Sep/17
37.81
16.62
19.05
Jun/17
19.58
16.45
37.88
Mar/17
19.38
R$ billion
Past Due (Specific)Regular (Generic)Total ALL

Provision Expenses Flow / Loan Portfolio (%)
0.66
0.87
1.55
0.99
0.55
0.94
1.70
1.04
0.46
0.91
1.83
1.05
-0.24
1.18
2.21
1.15
0.55
0.75
1.66
0.99
2Q17
6,658
1,743
3,979
188 748
1Q17
6,713
1,677
4,370
60 606
4Q16
7,486
2,207
5,517
98
-336
3Q16
6,644
1,411
4,370
132 730
3Q17
6,257
1,627
3,526
175 929
Individuals
Companies
Foreign
Agribusiness
ALL by Segment (R$ million)¹
Agribusiness
Individuals
Companies
Total
63(1) Quartely ALL expenses, including write-off recovery.
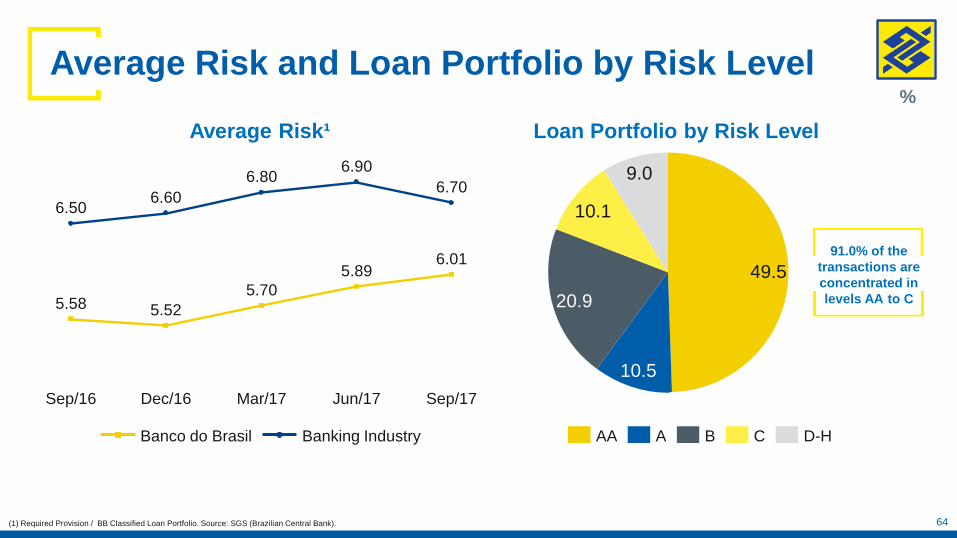
Average Risk and Loan Portfolio by Risk Level
Loan Portfolio by Risk Level
91.0% of the
transactions are
concentrated in
levels AA to C
(1) Required Provision / BB Classified Loan Portfolio. Source: SGS (Brazilian Central Bank). 64
9.0
10.1
20.9
10.5
49.5
D-HCBAAA
6.50
Sep/17
6.90
6.70
6.015.89
Jun/17Sep/16
5.58 5.52
Dec/16
6.60
5.70
6.80
Mar/17
Banco do Brasil Banking Industry
Average Risk¹
%

2Q17
5.98
3Q17
2.60
9.24
5.69
4Q16
7.42
9.278.76
3Q16
5.33
8.50
2.27
4.89
2.822.33
5.92
1Q17
2.32
AgribusinessIndividuals Companies
Average Risk by Segment¹
65
5.525.58 5.895.70 6.01
Classified Loan Portfolio
(1) Required Provision / BB Classified Loan Portfolio.

12 months Quarterly
4.204.184.334.584.43
ALL / Loan Portfolio¹
3Q17
6.3
634.2
2Q17
6.7
638.2
1Q17
6.7
644.4
4Q16
7.5
662.8
3Q16
6.6
682.0
Allowance for Loan LossesLoan Portfolio
3Q17
27.1
644.9
2Q17
27.5
657.3
1Q17
29.1
671.8
4Q16
31.6
688.8
3Q16
31.1
700.8
Allowance for Loan LossesLoan Portfolio
0.991.041.041.130.97
ALL / Loan Portfolio²
(1) ALL expenses accumulated in 12 months / 12 months Average Loan Portfolio. (2) Quarterly ALL Expenses / 3 months Average Loan Portfolio.
Cost of Risk
66
R$ billion
%

Jun/17
5.8
4.1
Mar/17
5.5
4.1
Dec/16
5.2
3.8
Sep/16
4.8
3.1
Sep/17
4.2
5.7
Peers Average²Banco do Brasil
Write-off – % of the Classified Loan Portfolio¹
67(1) Write-offs accumulated in 12 months / Classified loan Portfolio (12 months). (2) It corresponds to the three largest Brazilian private banks.

Renegotiated Past Due Loan Portfolio
68
3Q16 2Q17 3Q17
Credits Renegotiated When Past Due - Changes
Initial Balance 25,050 26,618 27,042
Contracts 2,758 3,622 1,870
Amortization Net of Interest¹ (744) (1,211) (773)
Write-Off (1,370) (1,986) (2,273)
Past due Renegotiated Loan Portfolio (A) 25,694 27,042 25,867
ALL Balance (B) 10,784 12,924 12,415
NPL + 90 days (C) 6,370 7,094 6,360
Indicators - %
ALL / Loan Portfolio (B/A) 42.0 47.8 48.0
NPL + 90 days / Loan Portfolio (C/A) 24.8 26.2 24.6
ALL Balance/NPL + 90 days (B/C) 169.3 182.2 195.2
Credits Renegotiated/Classified Loan Portfolio 3.8 4.2 4.1
2Q17
1.67
1Q17
1.97
4Q16
2.37
3Q16
2.10
3Q17
1.54
New NPL (R$ billion)²
6.277.289.248.37 5.69
New NPL / Loan Portfolio (%)³
NPL Formation
R$ million
(1) Principal and interest payments net of interest accrued in the period.
(2) Quarterly change in the balance of over 90 days past due transactions + current quarter write-off. (3) It considers the Classified Loan Portfolio of the previous quarter.
Credits Renegotiated Contracts %
0 to 14 days Past due 621 33.19
15 to 90 days Past due 588 31.43
Over 90 days Past due 452 24.16
Writen-Off Recovery 210 11.22
Total 1,870 100

Renegotiated Loan Portfolio
69
12,182 12,415
Sep/17Jun/17
12,92412,292
Mar/17
12,31411,692
Dec/16
11,92510,952
Sep/16
10,78410,734
BB - ALL BalancePeers Average - ALL Balance
24.6
21.6
26.2
22.4
27.8
24.7
27.2
24.524.8
26.8
BB - Renegotiated Portfolio NPL +90 days (%)Peers Average - Renegotiated Portfolio NPL +90 days (%)
BB x Peers¹R$ million
(1) It corresponds to the two large Brazilian private banks.
Renegotiated Loan
4.1
5.3
Renegotiated Loan Portfolio/Classified Loan Portfolio (%)
3Q17
25,86722,245
BB
Peers Average¹

%
BIS Ratio
70
17.5918.48 18.15 18.01
19.15
12.18 12.79 12.41 12.4213.29
9.07 9.59 9.20 9.18 10.04
Sep/16 Dec/16 Mar/17 Jun/17 Sep/17
Tier II Tier I Common Equity Tier I
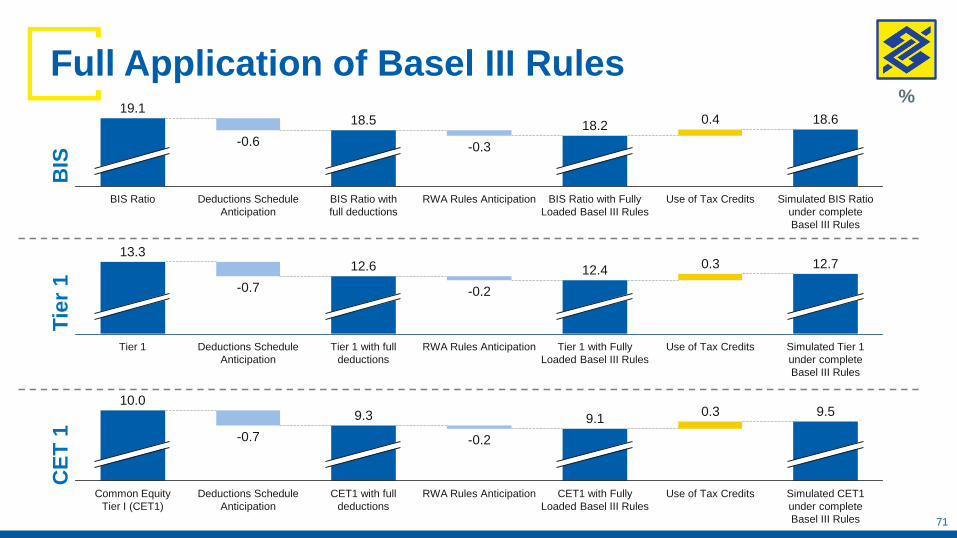
Simulated BIS Ratio
under complete
Basel III Rules
18.6
Use of Tax Credits
0.4
BIS Ratio with Fully
Loaded Basel III Rules
18.2
RWA Rules Anticipation
-0.3
BIS Ratio with
full deductions
18.5
Deductions Schedule
Anticipation
-0.6
BIS Ratio
19.1
0.3
Use of Tax Credits
12.7
Simulated Tier 1
under complete
Basel III Rules
Tier 1 with Fully
Loaded Basel III Rules
12.4
RWA Rules Anticipation
-0.2
Tier 1 with full
deductions
12.6
Deductions Schedule
Anticipation
-0.7
Tier 1
13.3
BIS
Full Application of Basel III Rules
9.5
Use of Tax Credits
0.3
CET1 with Fully
Loaded Basel III Rules
9.1
RWA Rules Anticipation
-0.2
CET1 with full
deductions
9.3
Deductions Schedule
Anticipation
-0.7
Common Equity
Tier I (CET1)
10.0
Simulated CET1
under complete
Basel III Rules
Tie
r1
CE
T 1
%
71
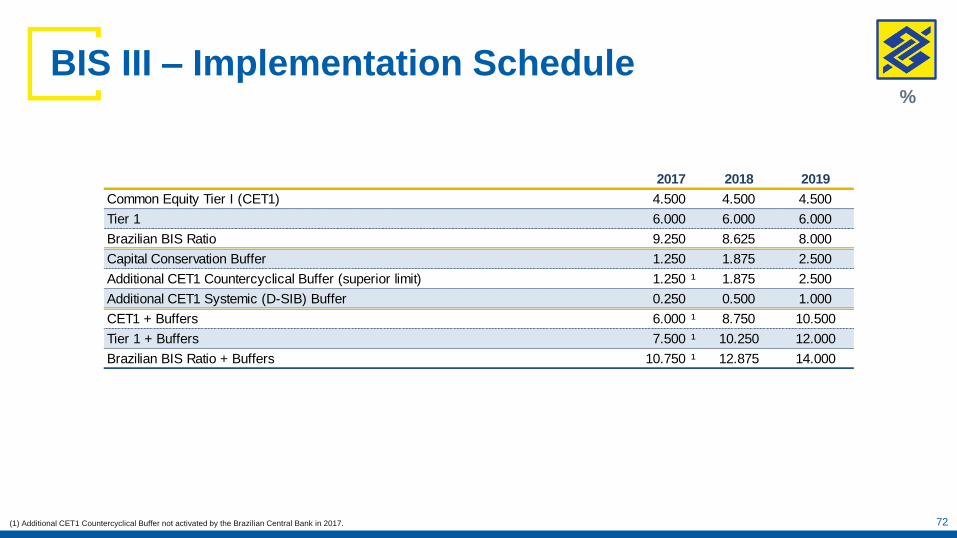
BIS III – Implementation Schedule
(1) Additional CET1 Countercyclical Buffer not activated by the Brazilian Central Bank in 2017.
%
72
2017 2018 2019
Common Equity Tier I (CET1) 4.500 4.500 4.500
Tier 1 6.000 6.000 6.000
Brazilian BIS Ratio 9.250 8.625 8.000
Capital Conservation Buffer 1.250 1.875 2.500
Additional CET1 Countercyclical Buffer (superior limit) 1.250 ¹ 1.875 2.500
Additional CET1 Systemic (D-SIB) Buffer 0.250 0.500 1.000
CET1 + Buffers 6.000 ¹ 8.750 10.500
Tier 1 + Buffers 7.500 ¹ 10.250 12.000
Brazilian BIS Ratio + Buffers 10.750 ¹ 12.875 14.000

Guidance 2017
73
Guidance
2017
9M17
Performance
Adjusted Net Income - R$ billion 9.5 to 12.5 7.9
NII (Net of Recovery of Write-offs) - % -4 to 0 -2.2
Organic Domestic Loan Portfolio - Expanded View - % -4 to -1 -6.9
Individuals - % 2 to 5 1.1
Companies - % -11 to -8 -16.0
Rural Loans - % 6 to 9 5.0
ALL Expenses net of Recovery of Write-offs - R$ billion -23.5 to -20.5 -16.2
Fee Income - % 6 to 9 9.9
Administrative Expenses - % -2.5 to 0.5 -2.7

Net Income (R$ million)
Delinquency and Risk (%)
Banco Votorantim
2Q17
145.1
1Q17
127.4
4Q16
119.3
3Q16
112.1
3Q17
153.3
Jun/17
88.9
11.1
Mar/17
89.2
10.8
Dec/16
88.3
11.7
Sep/16
90.2
9.8
Sep/17
89.5
10.5
AA-CD-H
4.5 4.4
5.55.5
4.1
NPL +90 days / Loan Portfolio
74

03MACROECONOMIC INFORMATION

Inflation and Selic Rate
76
2012 2013 2014 2015 2016
7.28
8.49
2.172.50
5.84 5.91
8.21
10.67
6.41
10.91
13.28
4.23
14.03
2.36
6.29
Accumulated Selic (% YTD in 12 months) IPCA (acum. 12 months % a.a.) Real Interest Rate²
9.84
3.08
6.56
2017¹
6.88
4.02
2.75
2018¹
14.16
2.54
8.48
5.24
Sep/16
11.56
8.80
Sep/17
(1) Source: Banco Central do Brasil and IBGE. Projection for 2017 and 2018, according to Boletim Focus as of August 11, 2017. (2) Real Interest Rate = Selic / IPCA
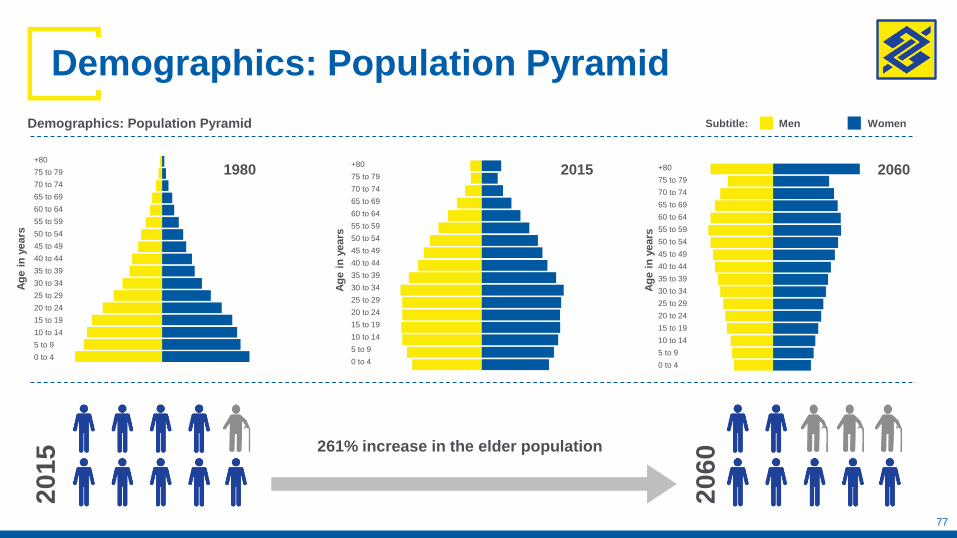
Demographics: Population Pyramid
0 to 4
5 to 9
10 to 14
15 to 19
20 to 24
25 to 29
30 to 34
35 to 39
40 to 44
45 to 49
50 to 54
55 to 59
60 to 64
65 to 69
70 to 74
75 to 79
+80
0 to 4
5 to 9
10 to 14
15 to 19
20 to 24
25 to 29
30 to 34
35 to 39
40 to 44
45 to 49
50 to 54
55 to 59
60 to 64
65 to 69
70 to 74
75 to 79
+80
0 to 4
5 to 9
10 to 14
15 to 19
20 to 24
25 to 29
30 to 34
35 to 39
40 to 44
45 to 49
50 to 54
55 to 59
60 to 64
65 to 69
70 to 74
75 to 79
+80
Demographics: Population Pyramid
206020151980
Subtitle: Men Women
20
15
20
60261% increase in the elder population
77
Ag
e i
n y
ears
Ag
e i
n y
ears
Ag
e i
n y
ears
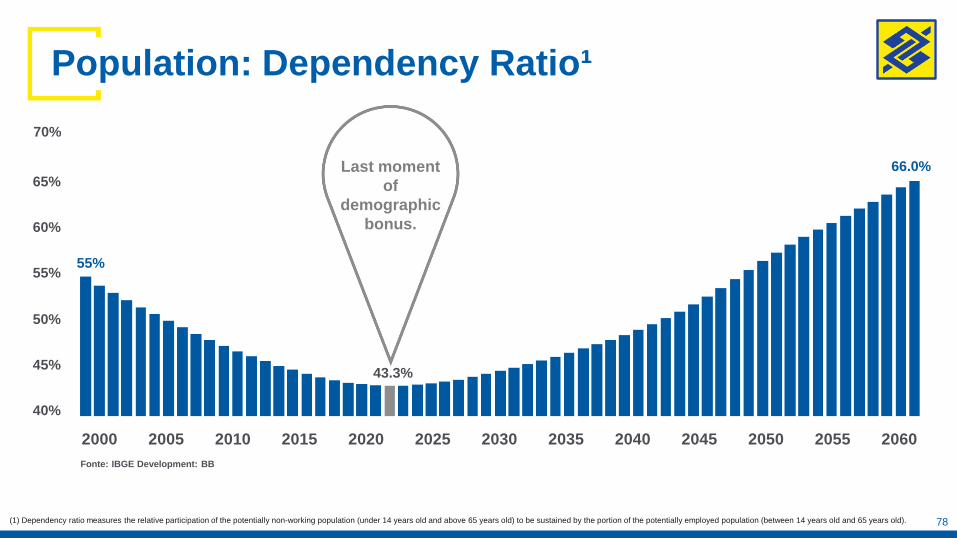
Population: Dependency Ratio¹
2000 2005 2010 2015 2020 2025 2030 2035 2040 2045 2050 2055 2060
55%
66.0%
40%
45%
50%
55%
60%
65%
70%
(1) Dependency ratio measures the relative participation of the potentially non-working population (under 14 years old and above 65 years old) to be sustained by the portion of the potentially employed population (between 14 years old and 65 years old).
Fonte: IBGE Development: BB
Last moment
of
demographic
bonus.
78
43.3%
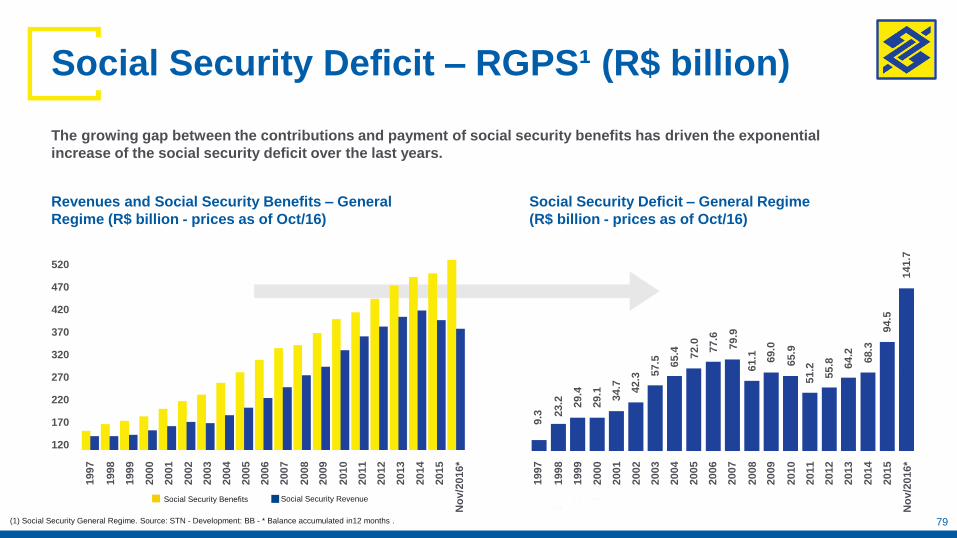
Social Security Deficit – RGPS¹ (R$ billion)
The growing gap between the contributions and payment of social security benefits has driven the exponential
increase of the social security deficit over the last years.
Social Security Deficit – General Regime
(R$ billion - prices as of Oct/16)
(1) Social Security General Regime. Source: STN - Development: BB - * Balance accumulated in12 months .
1997
1998
1999
2000
2001
2002
2003
2004
2005
2006
2007
2008
2009
2010
2011
2012
2013
2014
2015
No
v/2
016*
1997
1998
1999
2000
2001
2002
2003
2004
2005
2006
2007
2008
2009
2010
2011
2012
2013
2014
2015
No
v/2
016*
120
170
220
270
320
370
420
470
520
9.3 2
3.2 29.4
34.7
29.1 4
2.3
57.5 65.4 72.0
77.6
79.9
61.1 69.0
65.9
51.2
55.8 64.2
68.3
94.5
141.7
Revenues and Social Security Benefits – General
Regime (R$ billion - prices as of Oct/16)
79
Social Security Benefits Social Security Revenue

Main Pillars of Brazilian Growth
Agriculture InfrastructureForeign
Trade
80

81
Sustainable Growth
Brazil
USAChina
India Russia
Argentina
Kasakhstan
Australia Canada
Germany
UKFrance
Korea
Italy
Spain
Japan
Mexico
Indonesia
Planting Area
> 140 million há¹GDP > US$ 1 trillion¹
Brazil has the ideal conditions for sustainable growth.
Only a few countries have the same potential.
Urban Population
> 80 million people¹
Source: World Bank and FAO.(1) 2011.

Brazilian Agribusiness: Overview
Area
8.5 milllion Km²
Overview
Population (2016)
206 million
GDP (2Q17)
+0.2%¹
Agricultural GDP (1H17)
+15.0%¹
Source: Ministério da Agricultura and IBGE.(1) Change in Quarterly flow. 82
Production
Brazil: World Commodities Ranking
Exports
Coffee
Orange Juice
Sugar
Soybean
Poultry
Beef
Corn
Source: USDA – PSD online.
Sep/17

PPPs in Brazil can reach R$ 1.3 trillion (USD 395 billion CAPEX) over
the next years
R$ 324.8 billion in Logistics and Urban Mobility
Toll Roads
R$ 14.7billion
Toll Roads
R$ 11.81billion
Logistics: R$ 61.6 billion
Railroads
R$ 39.0billion
São Paulo Segue em Frente: R$ 13.4 billion
Bus Service
R$ 2.6billion
Ports
R$ 1.5billion
Metro Line
R$ 0.2billion
Airports
R$ 6.4billion
Regional
Airports
R$ 0.1 billion
BNDES – Expectation of investments in Urban Mobility: R$ 234 billion
R$ 688.1 billion in Water and Waste, Urbanization & Street Lighting
Water
R$ 158.7 billion
Plansab – National Plan for Sanitation: R$ 660.4 billion expected up to 2033
Street Lighting: R$ 27.8 billion
Sewage
R$ 236.2billion
Waste
R$ 30.3 billion
Drainage
R$ 89.2billion
Managment*
R$ 145.9billion
* Actions related to increase efficiency in the management and provision of services, to technical qualification of employees and to
implementation of educational campaigns, among others actions.
R$ 41.1 billion in Power Sector
Generation R$ 7.6 billion
Transmission Lines R$
33.2 billion (lot Out/16 +
2017 auctions)
R$ 263 billion* in Oil & Gas
Oil US$ 80 billion*
According to the Energy Ministry
Source: MPDG, MME, MCidades, MMA and SP Government.
Produced by: BB. ** USD = R$ 3.29 as of November 03, 2017.
83
36% 100%
50%
100%
98%
91%

84
Brazilian Foreign Trade Balance Evolution
47.7
19.7
-4.0
Trade Balance (US$ billion – year accumulated)
2016
137.6
185.3171.5
2015
191.1
2014
229.1225.1
Exports (US$ billion – year accumulated) Imports (US$ billion – year accumulated)
3Q16
139.4
103.2111.3
3Q17
164.6
36.2
53.3
Source: Ministério do Desenvolvimento, Indústria e Comércio Exterior.
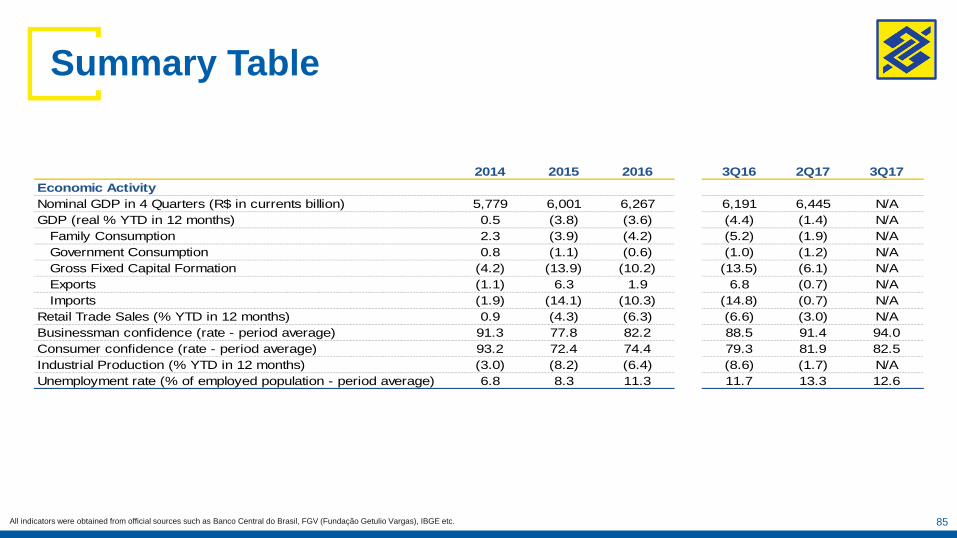
Summary Table
85All indicators were obtained from official sources such as Banco Central do Brasil, FGV (Fundação Getulio Vargas), IBGE etc.
2014 2015 2016 3Q16 2Q17 3Q17
Economic Activity
Nominal GDP in 4 Quarters (R$ in currents billion) 5,779 6,001 6,267 6,191 6,445 N/A
GDP (real % YTD in 12 months) 0.5 (3.8) (3.6) (4.4) (1.4) N/A
Family Consumption 2.3 (3.9) (4.2) (5.2) (1.9) N/A
Government Consumption 0.8 (1.1) (0.6) (1.0) (1.2) N/A
Gross Fixed Capital Formation (4.2) (13.9) (10.2) (13.5) (6.1) N/A
Exports (1.1) 6.3 1.9 6.8 (0.7) N/A
Imports (1.9) (14.1) (10.3) (14.8) (0.7) N/A
Retail Trade Sales (% YTD in 12 months) 0.9 (4.3) (6.3) (6.6) (3.0) N/A
Businessman confidence (rate - period average) 91.3 77.8 82.2 88.5 91.4 94.0
Consumer confidence (rate - period average) 93.2 72.4 74.4 79.3 81.9 82.5
Industrial Production (% YTD in 12 months) (3.0) (8.2) (6.4) (8.6) (1.7) N/A
Unemployment rate (% of employed population - period average) 6.8 8.3 11.3 11.7 13.3 12.6

Summary Table
86All indicators were obtained from official sources such as Banco Central do Brasil, FGV (Fundação Getulio Vargas), IBGE etc.
2014 2015 2016 3Q16 2Q17 3Q17
External Sector
Current Transactions (% GDP in 12 months) (4.2) (3.3) (1.3) (1.3) (0.8) (0.6)
Direct Foreign Investment (US$ billion - year accumulated) 97.2 74.7 78.2 46.5 36.2 51.8
Trade Balance (US$ billion – year accumulated) (4.0) 19.7 47.7 36.2 36.3 53.3
Exports (US$ billion – year accumulated) 225.1 191.1 185.3 139.4 107.7 164.6
Basic 109.6 87.2 79.2 62.1 52.5 78.3
Manufactured 80.2 72.8 73.9 53.5 37.7 59.2
Semi-manufactured 29.1 26.5 28.0 20.6 15.1 23.3
Special Operations 6.3 4.7 4.2 3.2 2.5 3.7
Imports (US$ billion – year accumulated) 229.1 171.5 137.6 103.2 71.5 111.3
Capital Goods 29.5 23.3 18.4 14.4 7.3 11.7
Intermediary Goods 126.9 99.5 84.9 63.3 45.0 70.1
Consumer Products 33.1 26.8 21.7 16.1 11.0 16.9
Fuels 39.5 21.7 12.4 9.3 8.2 12.6
Other 0.2 0.2 0.1 0.1 0.1 0.1
International Reserves (US$ billion – end of period) 375.8 361.2 367.5 369.3 374.9 381.0
Sovereign Risk (basis points – end of period) 259 523 328 319 289 247
CDS 10Y (In base points - end of period) 259 558 360 347 346 306
Exchange Rate (R$/US$ - end of period) 2.66 3.90 3.26 3.25 3.31 3.17
Public Finance
PSGD (% GDP) 56.3 65.5 69.9 69.9 72.5 73.9
Nominal Result (R$ billion - in 12 months) (343.9) (613.0) (562.8) (576.8) (607.5) (567.5)
Nominal Result (% GDP - in 12 months) (6.0) (10.2) (9.0) (9.3) (9.4) (8.8)
Monetary Ratios
Selic (end of period %) 11.75 14.25 13.75 14.25 10.25 8.25
Accumulated Selic (% YTD in 12 months) 10.91 13.28 14.03 14.16 12.89 11.56

04 SUSTAINABILITY
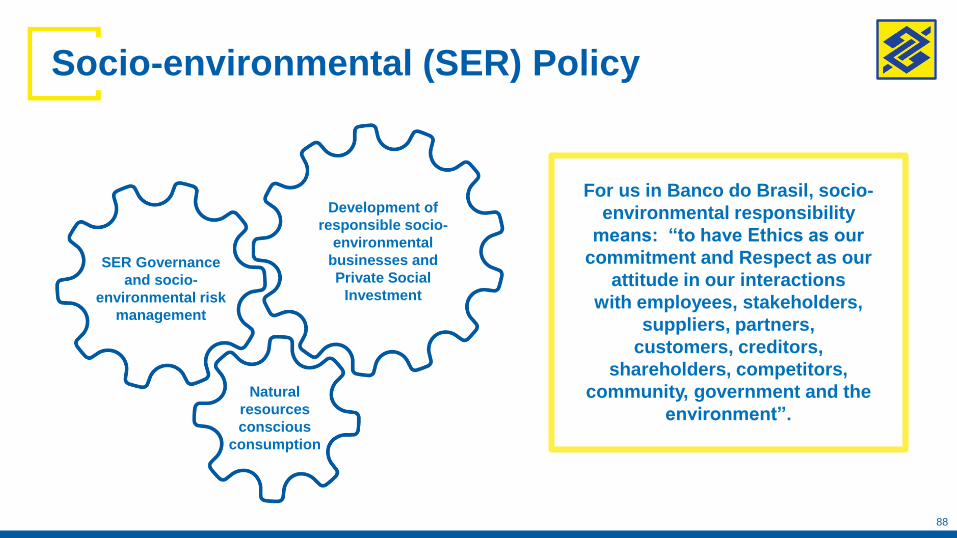
Socio-environmental (SER) Policy
Development of
responsible socio-
environmental
businesses and
Private Social
Investment
SER Governance
and socio-
environmental risk
management
Natural
resources
conscious
consumption
For us in Banco do Brasil, socio-
environmental responsibility
means: “to have Ethics as our
commitment and Respect as our
attitude in our interactions
with employees, stakeholders,
suppliers, partners,
customers, creditors,
shareholders, competitors,
community, government and the
environment”.
88
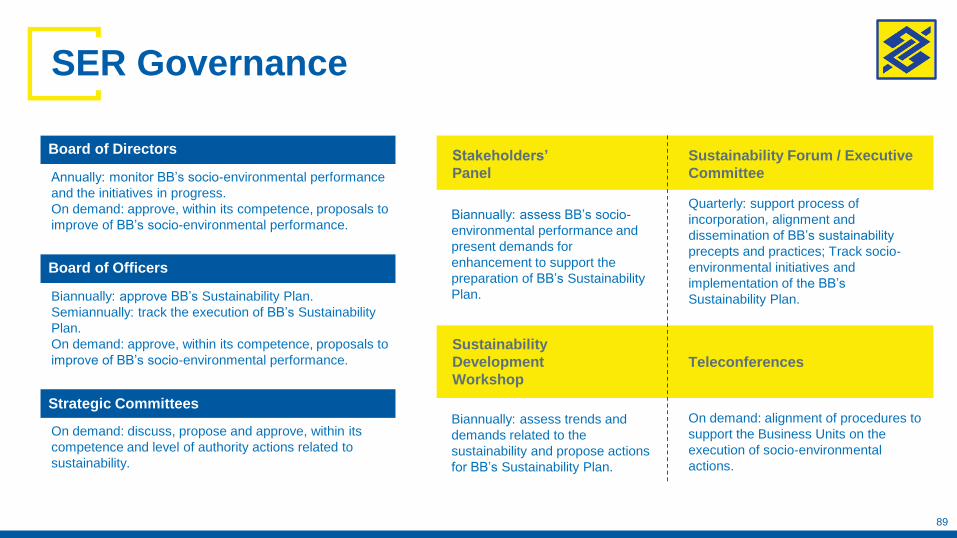
Board of Directors
Annually: monitor BB’s socio-environmental performance
and the initiatives in progress.
On demand: approve, within its competence, proposals to
improve of BB’s socio-environmental performance.
Board of Officers
Biannually: approve BB’s Sustainability Plan.
Semiannually: track the execution of BB’s Sustainability
Plan.
On demand: approve, within its competence, proposals to
improve of BB’s socio-environmental performance.
Strategic Committees
On demand: discuss, propose and approve, within its
competence and level of authority actions related to
sustainability.
Biannually: assess BB’s socio-
environmental performance and
present demands for
enhancement to support the
preparation of BB’s Sustainability
Plan.
Quarterly: support process of
incorporation, alignment and
dissemination of BB’s sustainability
precepts and practices; Track socio-
environmental initiatives and
implementation of the BB’s
Sustainability Plan.
Stakeholders’
Panel
Sustainability Forum / Executive
Committee
Sustainability
Development
Workshop
Teleconferences
Biannually: assess trends and
demands related to the
sustainability and propose actions
for BB’s Sustainability Plan.
On demand: alignment of procedures to
support the Business Units on the
execution of socio-environmental
actions.
SER Governance
89

SER Strategy – Agenda 30 BB
PROSPECTION
AND CONSULT REPORTS AND
TRANSPARENCY
FEEDBACK
SOCIO-ENVIRONMENTAL PERFORMANCE
Inductor Instruments
Legislation
Specific and General Policies
Internal rules
Board of Directors
Corporate Strategy and BB’s Sustainability Plan
Performance Evaluation
Instruments: Master Plan, Balance Scorecard,
Manager Radar
Metrics: Socio-environmental indexes,
Capital Markets indexes, such as DJSI and
ISE
Annual Report
Management
Report
Intranet/Internet
Campaigns
Market Trends and
Demands / Society
Stakeholders
Panel
Capital Markets
Indexes
Sustainability
Rankings
90

Updated every 2 years based on market and society demands
394 actions between 2005 and 2017 (5 editions)
Sixth version (2017-2019) – 82 actions
Inspired on UN Sustainable Development Goals
Followed by Sustainability Forum, Board of Officers and Board of Directors
Results presented in Annual Report
Capital Market awards: DJSI, ISE, ICO2
SER Strategy – Agenda 30 BB
Planet
Structured in 5 pillars:
Prosperity
Partnership
People
Peace
91

Socio-environmental Risk Management
Socio-environmental Risk
Potential Losses coming from social and / or environmental impacts generated by the
institution's activities, directly or indirectly.
The procedures to manage socio-environmental risk encompass exposures on credit,
investments, insurance, operational risks, strategy risk, reputation risk and administrative
activities.
Business
Management
92

1969
First public
contest
available for
women
1979
First woman
signed for a
lead position
in a branch
Promotion of gender equity
2006
BB signs the
“Programa
Pró-Equidade
de Gênero”
from the
Federal
Government
1987
First women
signed for a
lead position
abroad
1996
First three
woman in the
executive
manager
position
2003
First female
Senior
Director
(statutory
position)
2010
Signing up of
the UN
Women's
Empowerment
Principles
2017 Increase of gender
affirmative actions in the
programs of professional
ascent.
Extension to transgenders
of the exclusive Internal
Ombudsman channel for
women.
All executives sign up to
for the HeForShe
movement (from UN
Women).
93

Business Letter for
the Human Rights
and for Promotion of
Decent LaborPrinciples of
Equator
1995 1997 2003
BB Letter of Socio-environmental
Responsibility Principles
2004
AGENDA
21
2005 2006 2007 2008 2009 2010 2011 2012
Business Pact
for Integrity and
Against
Corruption
2013
Sustainable Animal
Husbandry
Working Group
2014
OECD Guidelines
for Multinational
Companies
20151991 2017
Green Protocol
Pacts and Voluntary Commitments

CORPORATE SUSTAINABILITY INDEX (ISE) – BM&F BOVESPA - 2017
12 CONSECUTIVE LISTING YEARS SINCE THE FIRST PORTFOLIO IN 2005
DOW JONES SUSTAINABILITY INDEX (DJSI) NEW YORK STOCK EXCHANGE – 2016, LISTED FOR
5 CONSECUTIVE YEARS.
BB IS A GLOBAL BENCHMARKING IN THE THEMES "CUSTOMER RELATIONSHIP MANAGEMENT",
"FINANCIAL STABILITY / SYSTEMIC RISK", "ANTICRIME POLICY & MEASURES“ "CORPORATE CITIZENSHIP
AND PHILANTHROPY", "FINANCIAL INCLUSION“ AND "CONTROVERSIAL ISSUES, DILEMMAS IN LENDING &
FINANCING."
CARBON EFFICIENT INDEX (ICO2) – BM&FBOVESPA - 2016
Market Indexes and Awards
95

Av. Paulista, 1230
18th. floor – Bela Vista
São Paulo/SP - Brasil - CEP 01310-100
www.bb.com.br/ir [email protected] +55 (11) 4298-8000