presentation of financial results for ... - shinmaywa.co.jp · shinmaywa industries, ltd. may 16,...
TRANSCRIPT
ShinMaywa Industries, Ltd.
May 16, 2019
Presentation of Financial Results for Fiscal Year Ended March 31, 2019
1. Summary of Consolidated Financial Results
2. Progress of “CFG2020”* Medium-term Management Plan
Supplementary Materials
Contents 2
Note1: Numerical values appearing in this document have been rounded down to the nearest unit, while ratios are shown in round figures.Note2: In this document, “1Q” signifies the cumulative 3-month period, “2Q” signifies the cumulative 6-month period, “3Q” signifies the
cumulative 9-month period, and “full year” signifies the cumulative 12-month period.
* Abbreviation of “Change for Growing, 2020”
Summary of Consolidated Financial Results1
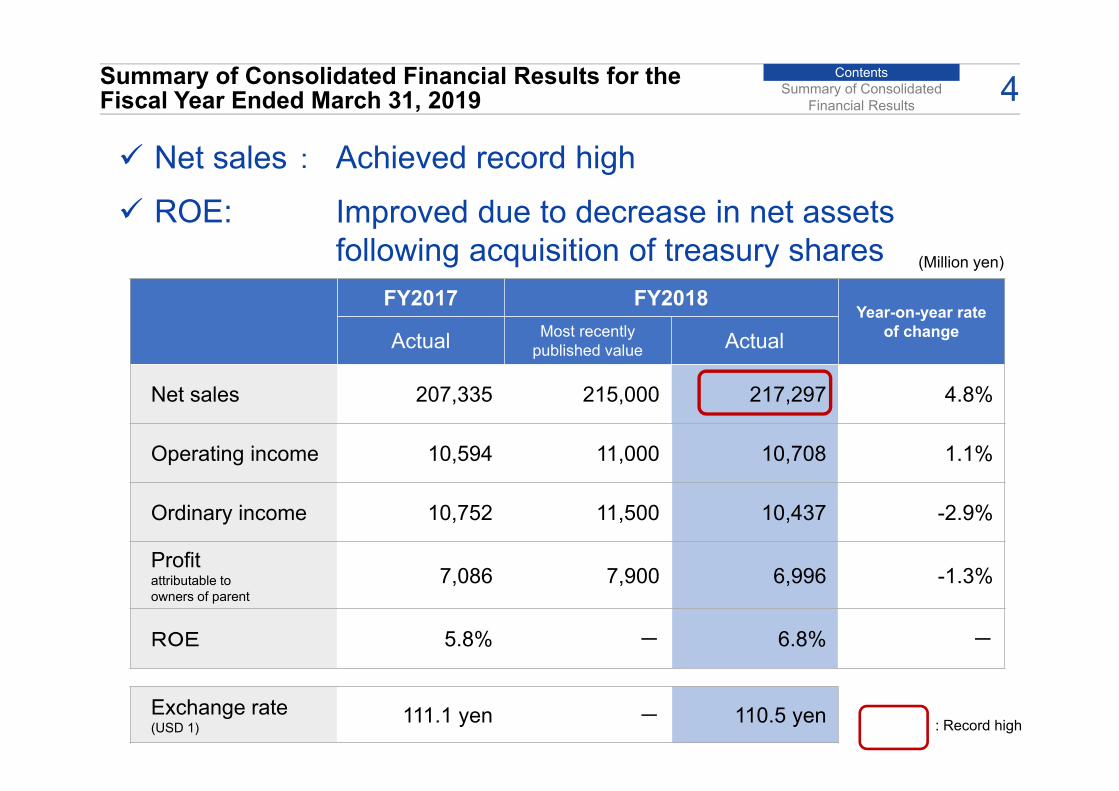
ContentsSummary of Consolidated Financial Results for the Fiscal Year Ended March 31, 2019 4
(Million yen)
Summary of Consolidated Financial Results
FY2017 FY2018Year-on-year rate
of changeActual Most recently published value Actual
Net sales 207,335 215,000 217,297 4.8%
Operating income 10,594 11,000 10,708 1.1%
Ordinary income 10,752 11,500 10,437 -2.9%
Profit attributable to owners of parent
7,086 7,900 6,996 -1.3%
ROE 5.8% - 6.8% -
Exchange rate(USD 1)
111.1 yen - 110.5 yen : Record high
Net sales : ROE:
Achieved record highImproved due to decrease in net assets following acquisition of treasury shares
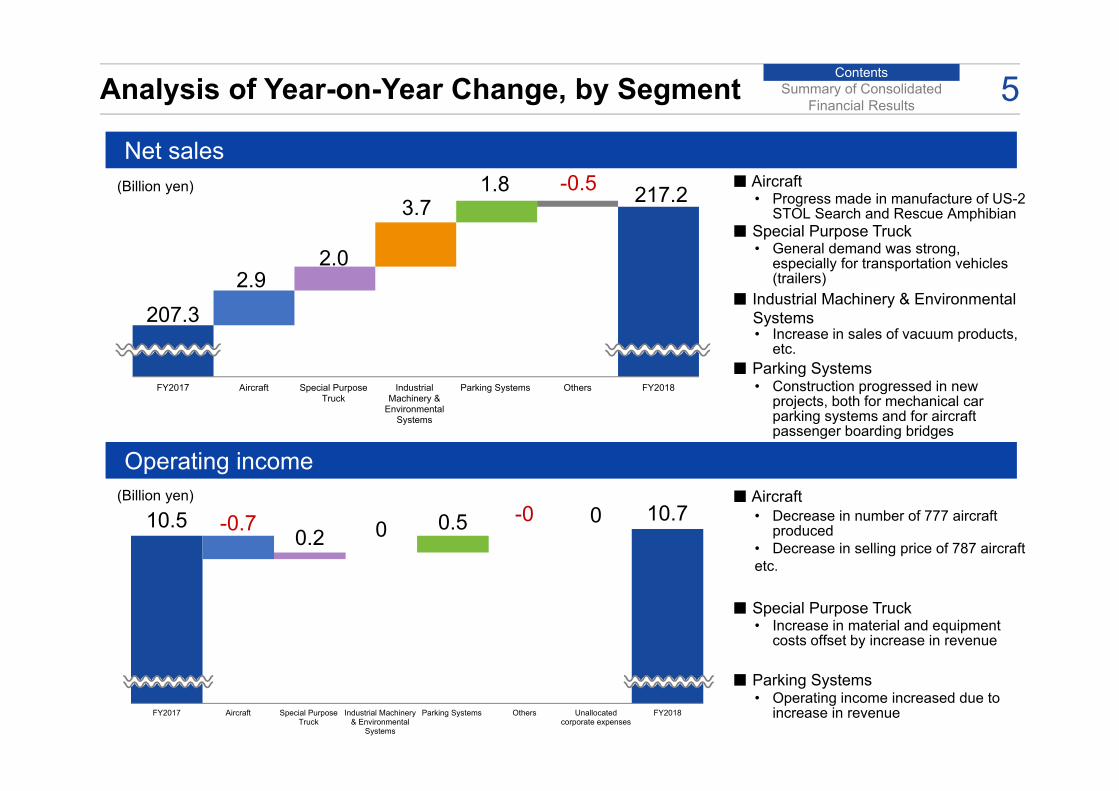
ContentsAnalysis of Year-on-Year Change, by Segment 5
207.32.9
2.0
3.71.8 -0.5 217.2
FY2017 Aircraft Special PurposeTruck
IndustrialMachinery &
EnvironmentalSystems
Parking Systems Others FY2018
10.5 -0.70.2 0 0.5 -0 0 10.7
FY2017 Aircraft Special PurposeTruck
Industrial Machinery& Environmental
Systems
Parking Systems Others Unallocatedcorporate expenses
FY2018
Summary of Consolidated Financial Results
■ Aircraft • Decrease in number of 777 aircraft
produced• Decrease in selling price of 787 aircraftetc.
• Operating income increased due to increase in revenue
■ Special Purpose Truck • Increase in material and equipment
costs offset by increase in revenue
■ Parking Systems
Net sales
Operating income
(Billion yen)
(Billion yen)
■ Aircraft• Progress made in manufacture of US-2
STOL Search and Rescue Amphibian
• Construction progressed in new projects, both for mechanical car parking systems and for aircraft passenger boarding bridges
■ Industrial Machinery & Environmental Systems• Increase in sales of vacuum products,
etc.■ Parking Systems
■ Special Purpose Truck • General demand was strong,
especially for transportation vehicles (trailers)
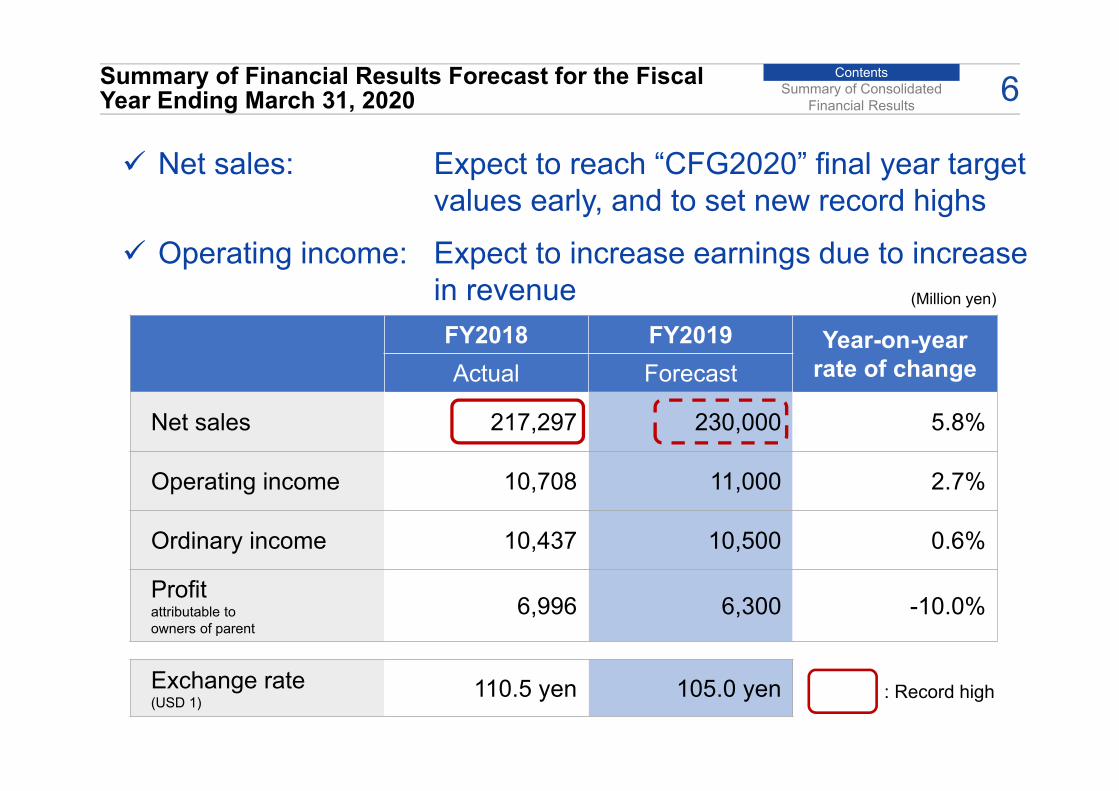
ContentsSummary of Financial Results Forecast for the Fiscal Year Ending March 31, 2020 6Summary of Consolidated
Financial Results
(Million yen)
FY2018 FY2019 Year-on-year rate of changeActual Forecast
Net sales 217,297 230,000 5.8%
Operating income 10,708 11,000 2.7%
Ordinary income 10,437 10,500 0.6%
Profit attributable to owners of parent
6,996 6,300 -10.0%
Exchange rate(USD 1)
110.5 yen 105.0 yen : Record high
Net sales:
Operating income:
Expect to reach “CFG2020” final year target values early, and to set new record highs
Expect to increase earnings due to increase in revenue
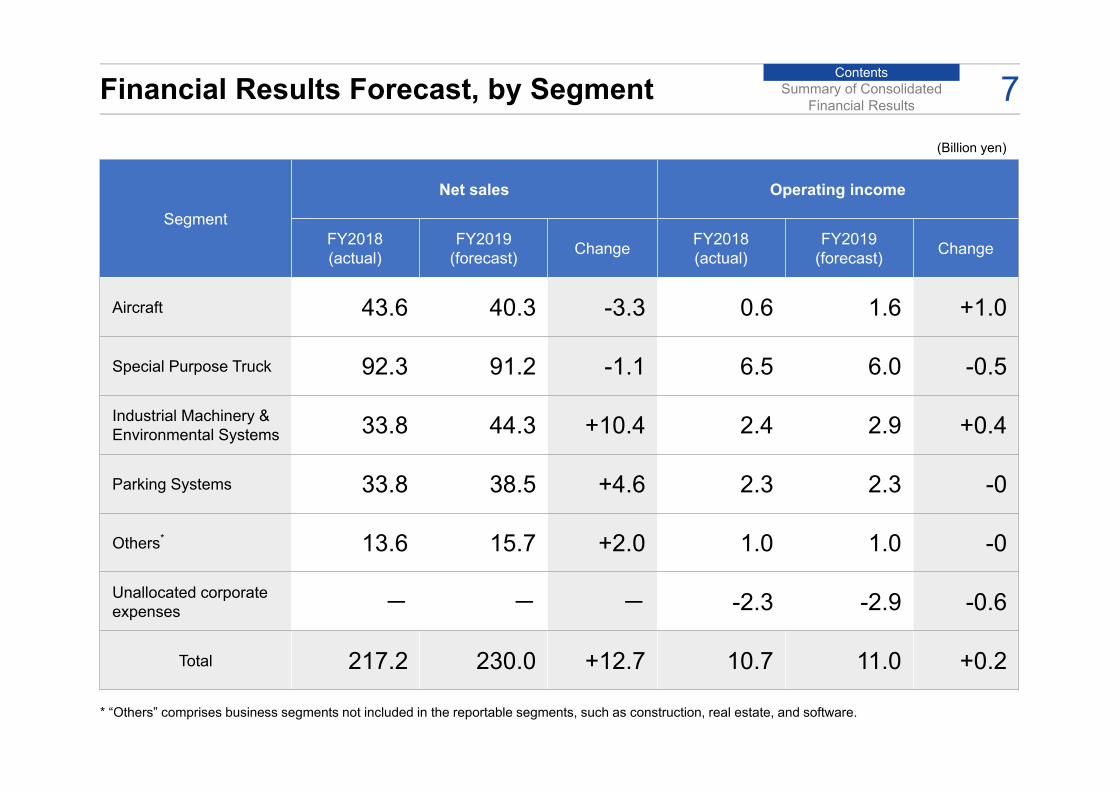
ContentsFinancial Results Forecast, by Segment 7
Segment
Net sales Operating income
FY2018 (actual)
FY2019 (forecast) Change FY2018
(actual) FY2019
(forecast) Change
Aircraft 43.6 40.3 -3.3 0.6 1.6 +1.0
Special Purpose Truck 92.3 91.2 -1.1 6.5 6.0 -0.5
Industrial Machinery & Environmental Systems 33.8 44.3 +10.4 2.4 2.9 +0.4
Parking Systems 33.8 38.5 +4.6 2.3 2.3 -0
Others* 13.6 15.7 +2.0 1.0 1.0 -0
Unallocated corporate expenses - - - -2.3 -2.9 -0.6
Total 217.2 230.0 +12.7 10.7 11.0 +0.2
* “Others” comprises business segments not included in the reportable segments, such as construction, real estate, and software.
Summary of Consolidated Financial Results
(Billion yen)
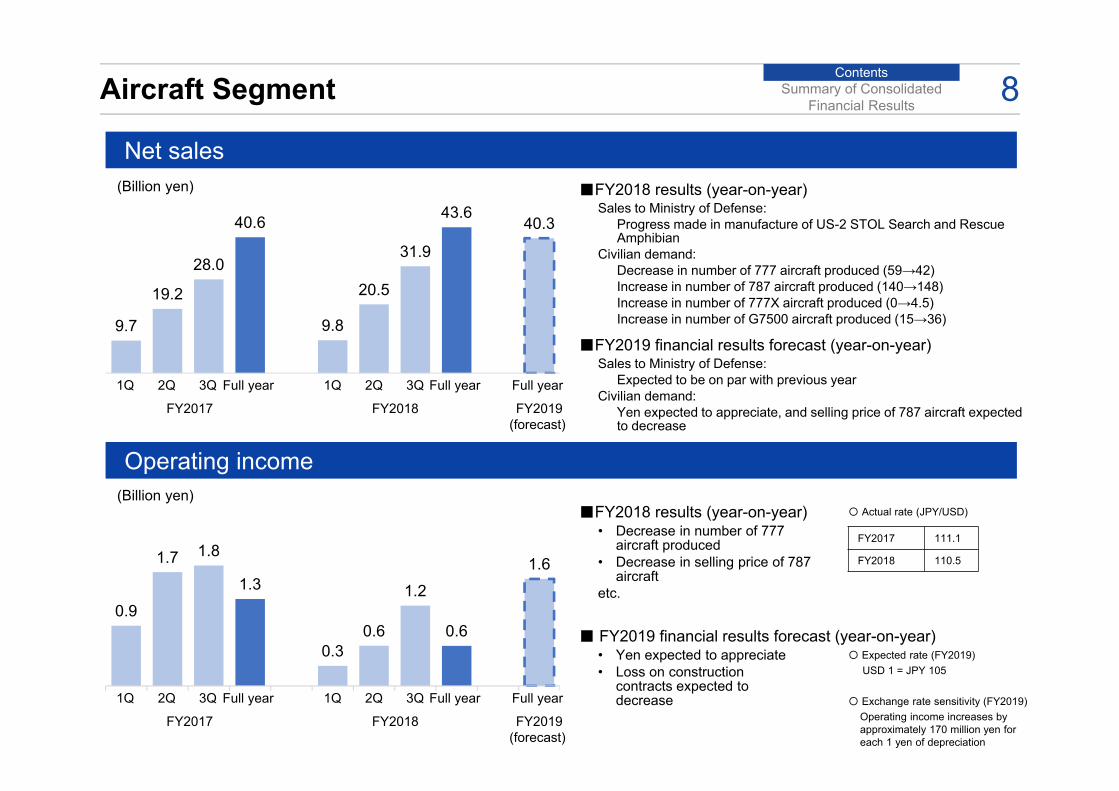
ContentsAircraft Segment 8
Net sales
Operating income
Summary of Consolidated Financial Results
■FY2018 results (year-on-year) Sales to Ministry of Defense:
Progress made in manufacture of US-2 STOL Search and Rescue Amphibian
Civilian demand:Decrease in number of 777 aircraft produced (59→42)Increase in number of 787 aircraft produced (140→148)Increase in number of 777X aircraft produced (0→4.5)Increase in number of G7500 aircraft produced (15→36)
■FY2019 financial results forecast (year-on-year) Sales to Ministry of Defense:
Expected to be on par with previous yearCivilian demand:
Yen expected to appreciate, and selling price of 787 aircraft expected to decrease
■FY2018 results (year-on-year) • Decrease in number of 777
aircraft produced • Decrease in selling price of 787
aircraft etc.
■ FY2019 financial results forecast (year-on-year) • Yen expected to appreciate• Loss on construction
contracts expected to decrease
FY2017 111.1
FY2018 110.5
〇 Actual rate (JPY/USD)
〇 Expected rate (FY2019)USD 1 = JPY 105
〇 Exchange rate sensitivity (FY2019)Operating income increases by approximately 170 million yen for each 1 yen of depreciation
(Billion yen)
9.7
19.2
28.0
40.6
9.8
20.5
31.9
43.640.3
1Q 2Q 3Q Full year Full year 1Q 2Q 3Q Full year
FY2017 FY2018
0.9
1.7 1.8
1.3
0.30.6
1.2
0.6
1.6
1Q 2Q 3Q Full year Full year 1Q 2Q 3Q Full year
FY2017 FY2018 FY2019(forecast)
(Billion yen)
FY2019(forecast)
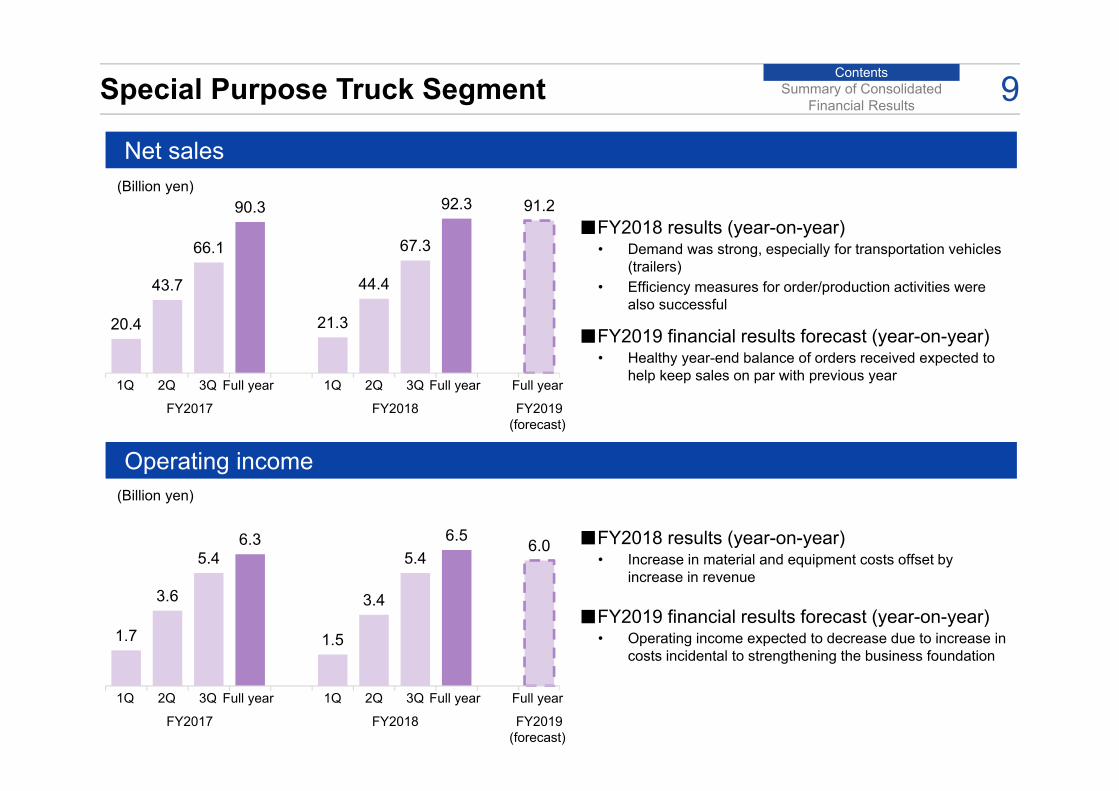
ContentsSpecial Purpose Truck Segment 9
Net sales
Operating income
Summary of Consolidated Financial Results
■FY2018 results (year-on-year) • Demand was strong, especially for transportation vehicles
(trailers)• Efficiency measures for order/production activities were
also successful
■FY2019 financial results forecast (year-on-year) • Healthy year-end balance of orders received expected to
help keep sales on par with previous year
■FY2018 results (year-on-year) • Increase in material and equipment costs offset by
increase in revenue
• Operating income expected to decrease due to increase in costs incidental to strengthening the business foundation
(Billion yen)
(Billion yen)
■FY2019 financial results forecast (year-on-year)
20.4
43.7
66.1
90.3
21.3
44.4
67.3
92.3 91.2
1Q 2Q 3Q Full year Full year 1Q 2Q 3Q Full year
FY2017 FY2018 FY2019(forecast)
1.7
3.6
5.46.3
1.5
3.4
5.46.5 6.0
1Q 2Q 3Q Full year Full year 1Q 2Q 3Q Full year
FY2017 FY2018 FY2019(forecast)
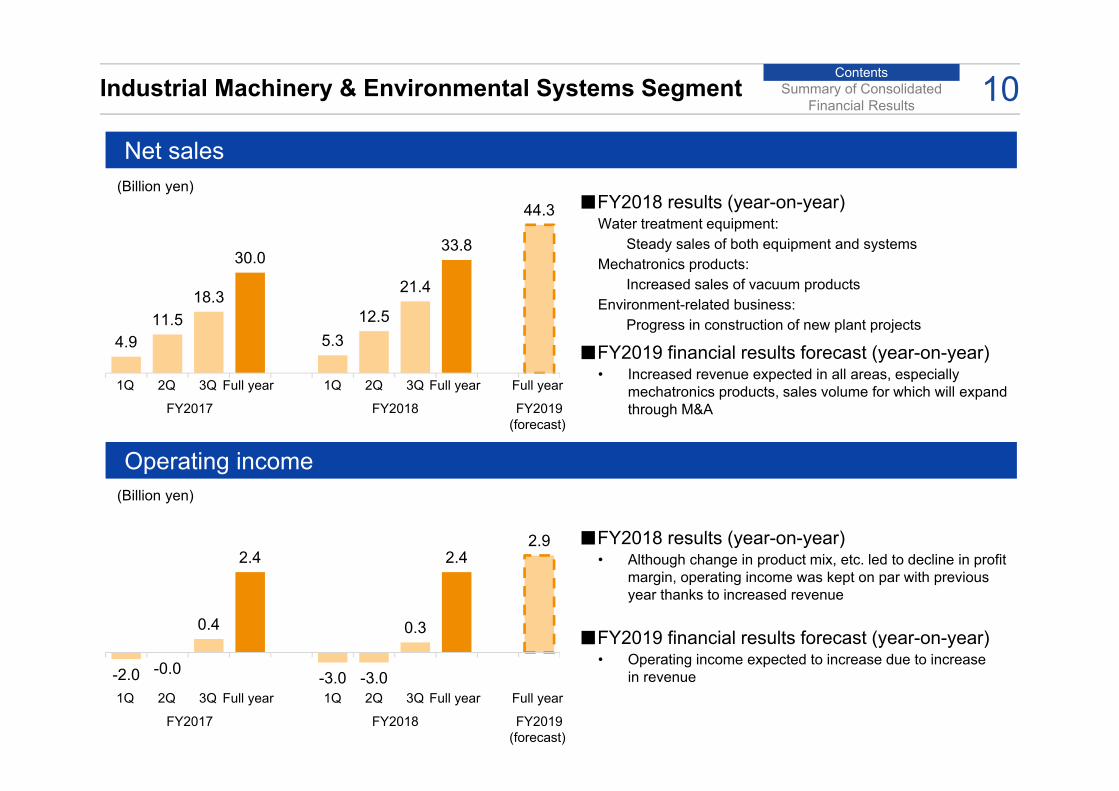
ContentsIndustrial Machinery & Environmental Systems Segment 10
Net sales
Operating income
Summary of Consolidated Financial Results
■FY2018 results (year-on-year) Water treatment equipment:
Steady sales of both equipment and systems Mechatronics products:
Increased sales of vacuum products Environment-related business:
Progress in construction of new plant projects
■FY2019 financial results forecast (year-on-year) • Increased revenue expected in all areas, especially
mechatronics products, sales volume for which will expand through M&A
■FY2018 results (year-on-year) • Although change in product mix, etc. led to decline in profit
margin, operating income was kept on par with previous year thanks to increased revenue
■FY2019 financial results forecast (year-on-year) • Operating income expected to increase due to increase
in revenue
(Billion yen)
(Billion yen)
4.911.5
18.3
30.0
5.312.5
21.4
33.8
44.3
1Q 2Q 3Q Full year Full year 1Q 2Q 3Q Full year
FY2017 FY2018 FY2019(forecast)
-2.0 -0.0
0.4
2.4
-3.0 -3.0
0.3
2.42.9
1Q 2Q 3Q Full year Full year 1Q 2Q 3Q Full year
FY2017 FY2018 FY2019(forecast)
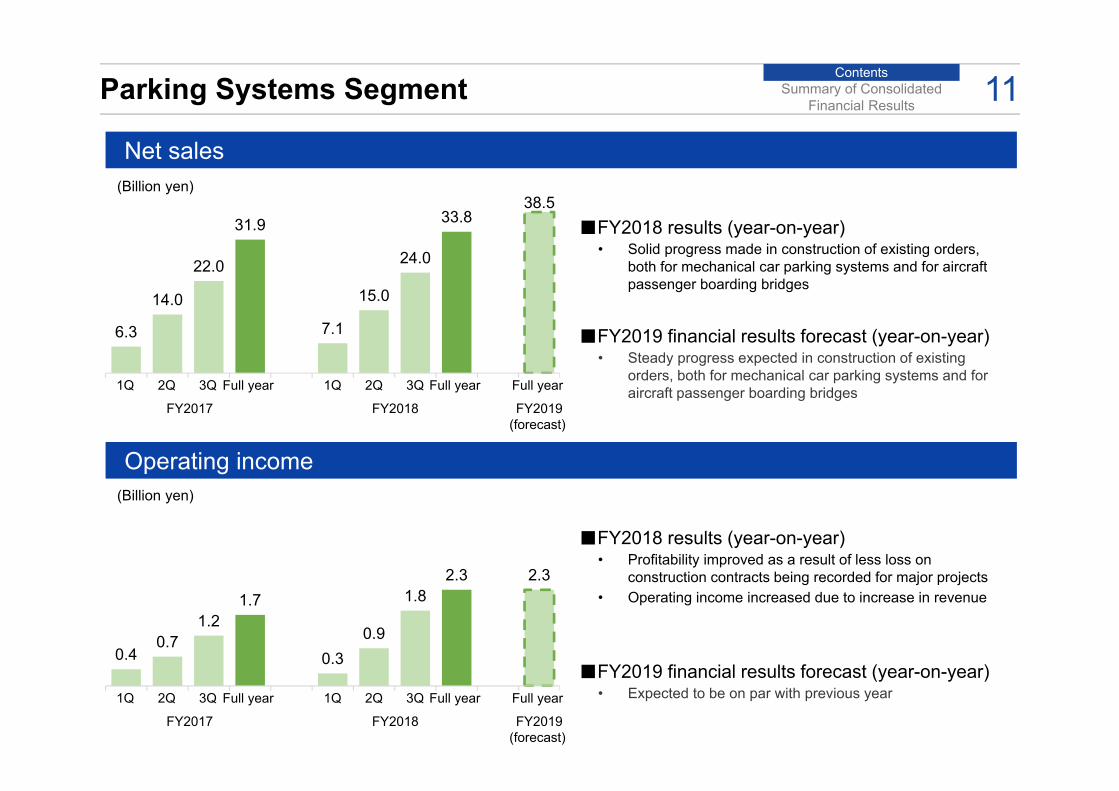
ContentsParking Systems Segment 11
Net sales
Operating income
Summary of Consolidated Financial Results
■FY2018 results (year-on-year) • Solid progress made in construction of existing orders,
both for mechanical car parking systems and for aircraft passenger boarding bridges
■FY2019 financial results forecast (year-on-year) • Steady progress expected in construction of existing
orders, both for mechanical car parking systems and for aircraft passenger boarding bridges
■FY2018 results (year-on-year) • Profitability improved as a result of less loss on
construction contracts being recorded for major projects• Operating income increased due to increase in revenue
■FY2019 financial results forecast (year-on-year) • Expected to be on par with previous year
(Billion yen)
(Billion yen)
6.3
14.0
22.0
31.9
7.1
15.0
24.0
33.838.5
1Q 2Q 3Q Full year Full year 1Q 2Q 3Q Full year
FY2017 FY2018 FY2019(forecast)
0.40.7
1.21.7
0.30.9
1.82.3 2.3
1Q 2Q 3Q Full year Full year 1Q 2Q 3Q Full year
FY2017 FY2018 FY2019(forecast)
Progress of “CFG2020” Medium-term Management Plan2
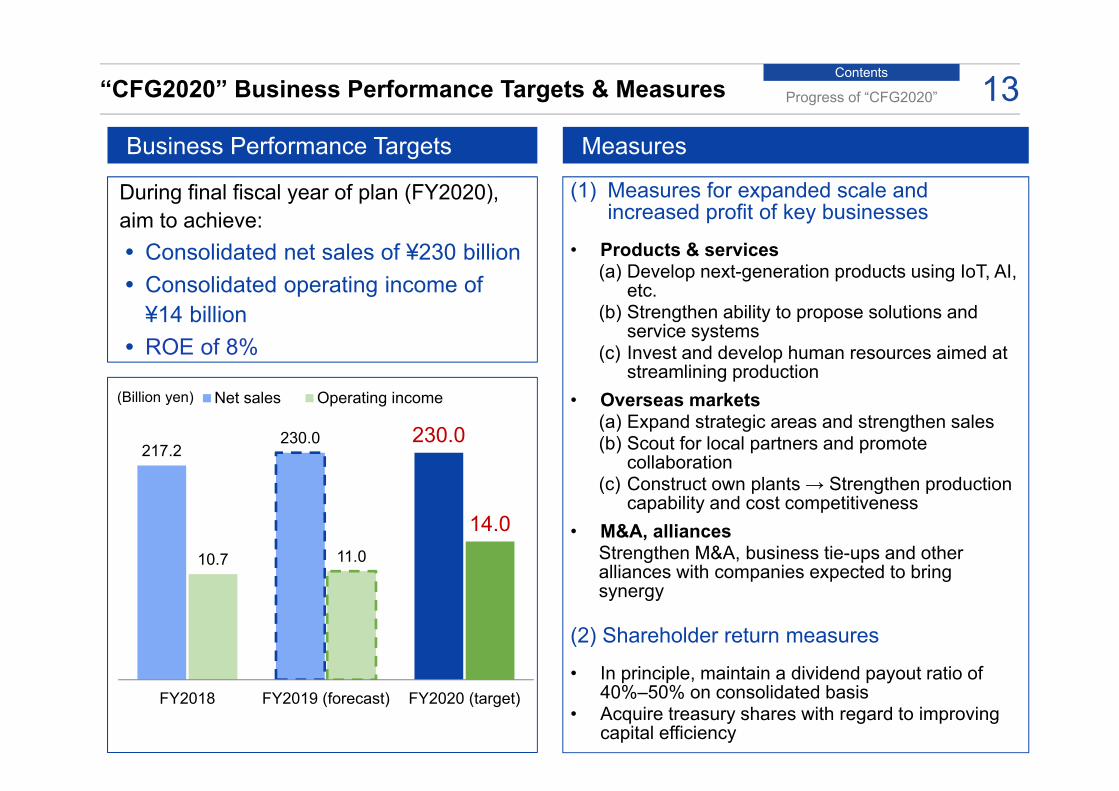
Contents“CFG2020” Business Performance Targets & Measures 13Progress of “CFG2020”
During final fiscal year of plan (FY2020), aim to achieve: Consolidated net sales of ¥230 billion Consolidated operating income of
¥14 billion ROE of 8%
217.2230.0 230.0
10.7 11.0
14.0
FY2018 FY2019 (forecast) FY2020 (target)
Net sales Operating income(Billion yen)
Business Performance Targets Measures
(1) Measures for expanded scale and increased profit of key businesses
• Products & services(a) Develop next-generation products using IoT, AI,
etc.(b) Strengthen ability to propose solutions and
service systems(c) Invest and develop human resources aimed at
streamlining production• Overseas markets
(a) Expand strategic areas and strengthen sales(b) Scout for local partners and promote
collaboration(c) Construct own plants → Strengthen production
capability and cost competitiveness • M&A, alliances
Strengthen M&A, business tie-ups and other alliances with companies expected to bring synergy
(2) Shareholder return measures
• In principle, maintain a dividend payout ratio of40%–50% on consolidated basis
• Acquire treasury shares with regard to improving capital efficiency
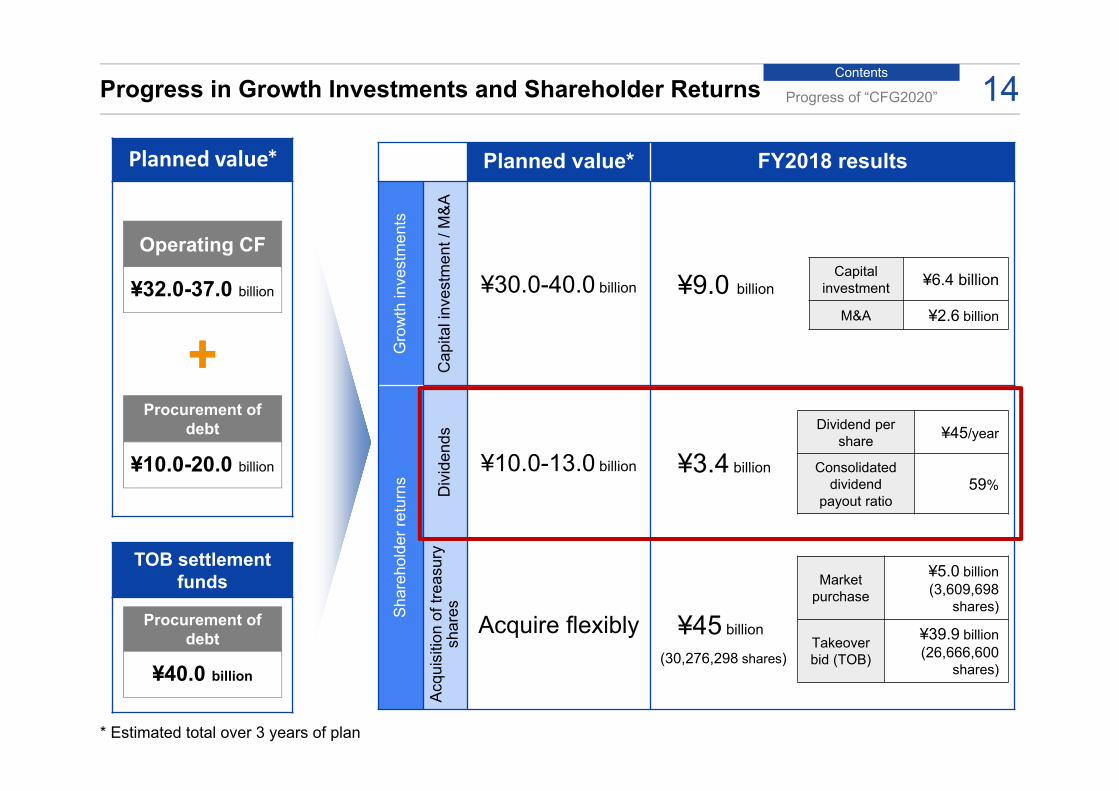
ContentsProgress in Growth Investments and Shareholder Returns 14Progress of “CFG2020”
* Estimated total over 3 years of plan
Planned value* FY2018 results
Gro
wth
inve
stm
ents
Cap
ital i
nves
tmen
t / M
&A
¥30.0-40.0 billion ¥9.0 billion
Shar
ehol
der r
etur
ns Div
iden
ds¥10.0-13.0 billion ¥3.4 billion
Acqu
isiti
on o
f tre
asur
y sh
ares Acquire flexibly ¥45 billion
Market purchase
¥5.0 billion (3,609,698
shares)
Takeover bid (TOB)
¥39.9 billion (26,666,600
shares)
Dividend per share ¥45/year
Consolidated dividend
payout ratio 59%
Capital investment ¥6.4 billion
M&A ¥2.6 billion
(30,276,298 shares)
Planned value*
TOB settlement funds
Operating CF
¥32.0-37.0 billion
Procurement of debt
¥10.0-20.0 billion
Procurement of debt
¥40.0 billion
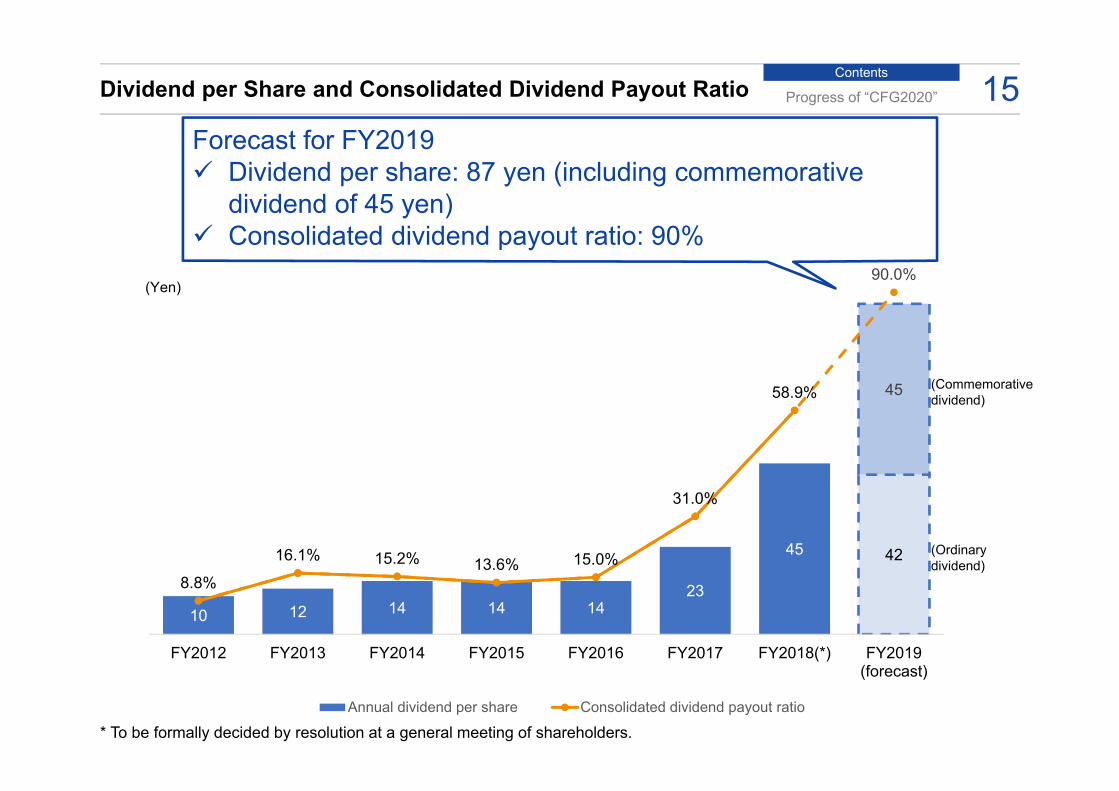
ContentsDividend per Share and Consolidated Dividend Payout Ratio Progress of “CFG2020” 15
10 12 14 14 1423
45 42
45
8.8%
16.1% 15.2% 13.6% 15.0%
31.0%
58.9%
90.0%
0.0%
10.0%
20.0%
30.0%
40.0%
50.0%
60.0%
70.0%
80.0%
90.0%
100.0%
0
10
20
30
40
50
60
70
80
90
100
FY2012 FY2013 FY2014 FY2015 FY2016 FY2017 FY2018(*) FY2019(forecast)
Annual dividend per share Consolidated dividend payout ratio
(Yen)
(Ordinary dividend)
(Commemorative dividend)
Forecast for FY2019 Dividend per share: 87 yen (including commemorative
dividend of 45 yen) Consolidated dividend payout ratio: 90%
* To be formally decided by resolution at a general meeting of shareholders.

Contents
16Progress in Growth Investments and Shareholder Returns 16Progress of “CFG2020”
* Estimated total over 3 years of plan
Planned value* FY2018 results
Gro
wth
inve
stm
ents
Cap
ital i
nves
tmen
t / M
&A
¥30.0-40.0 billion ¥9.0 billion
Shar
ehol
der r
etur
ns Div
iden
ds¥10.0-13.0 billion ¥3.4 billion
Acqu
isiti
on o
f tre
asur
y sh
ares Acquire flexibly ¥45 billion
Market purchase
¥5.0 billion (3,609,698
shares)
Takeover bid (TOB)
¥39.9 billion (26,666,600
shares)
Dividend per share ¥45/year
Consolidated dividend
payout ratio 59%
(30,276,298 shares)
Planned value*
TOB settlement funds
Operating CF
¥32.0-37.0 billion
Procurement of debt
¥10.0-20.0 billion
Procurement of debt
¥40.0 billion
Capital investment ¥6.4 billion
M&A ¥2.6 billion
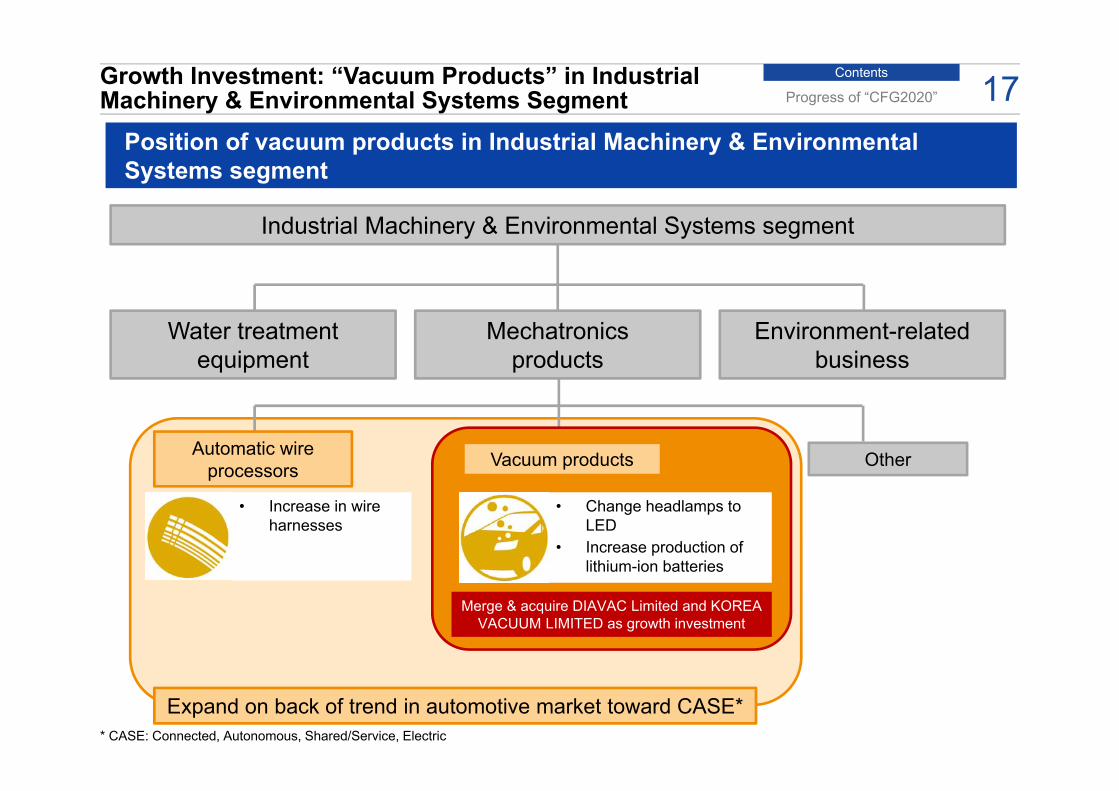
ContentsGrowth Investment: “Vacuum Products” in Industrial Machinery & Environmental Systems Segment 17Progress of “CFG2020”
Position of vacuum products in Industrial Machinery & Environmental Systems segment
Industrial Machinery & Environmental Systems segment
Other
• Increase in wire harnesses
Expand on back of trend in automotive market toward CASE*
Merge & acquire DIAVAC Limited and KOREA VACUUM LIMITED as growth investment
Vacuum products
• Change headlamps to LED
• Increase production of lithium-ion batteries
* CASE: Connected, Autonomous, Shared/Service, Electric
Water treatment equipment
Mechatronics products
Environment-related business
Automatic wire processors
Contents
18Progress of “CFG2020”Growth Investment: “Vacuum Products” in Industrial Machinery & Environmental Systems Segment
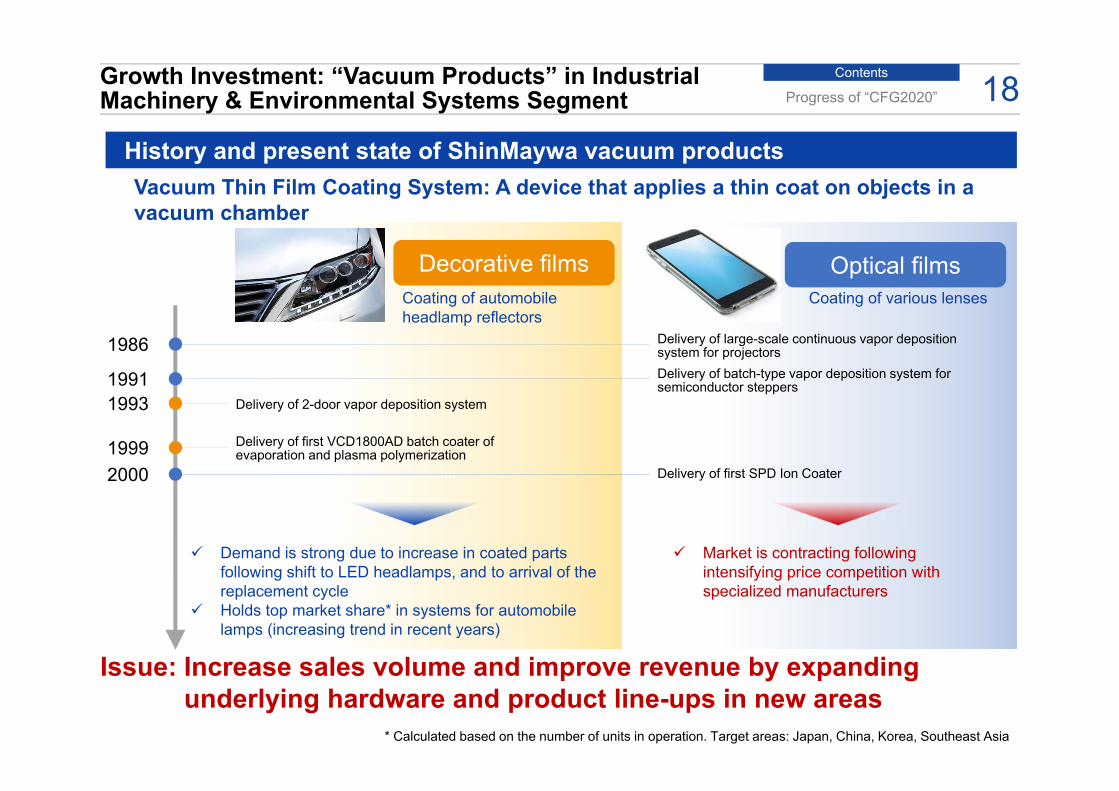
History and present state of ShinMaywa vacuum products
1986 Delivery of large-scale continuous vapor deposition system for projectors
1999 Delivery of first VCD1800AD batch coater of evaporation and plasma polymerization
2000 Delivery of first SPD Ion Coater
Market is contracting following intensifying price competition with specialized manufacturers
Vacuum Thin Film Coating System: A device that applies a thin coat on objects in a vacuum chamber
1993 Delivery of 2-door vapor deposition system
1991 Delivery of batch-type vapor deposition system for semiconductor steppers
* Calculated based on the number of units in operation. Target areas: Japan, China, Korea, Southeast Asia
Optical filmsDecorative filmsCoating of automobile headlamp reflectors
Coating of various lenses
Issue: Increase sales volume and improve revenue by expanding underlying hardware and product line-ups in new areas
Demand is strong due to increase in coated parts following shift to LED headlamps, and to arrival of the replacement cycle
Holds top market share* in systems for automobile lamps (increasing trend in recent years)
Contents
19Progress of “CFG2020”Growth Investment: “Vacuum Products” in Industrial Machinery & Environmental Systems Segment
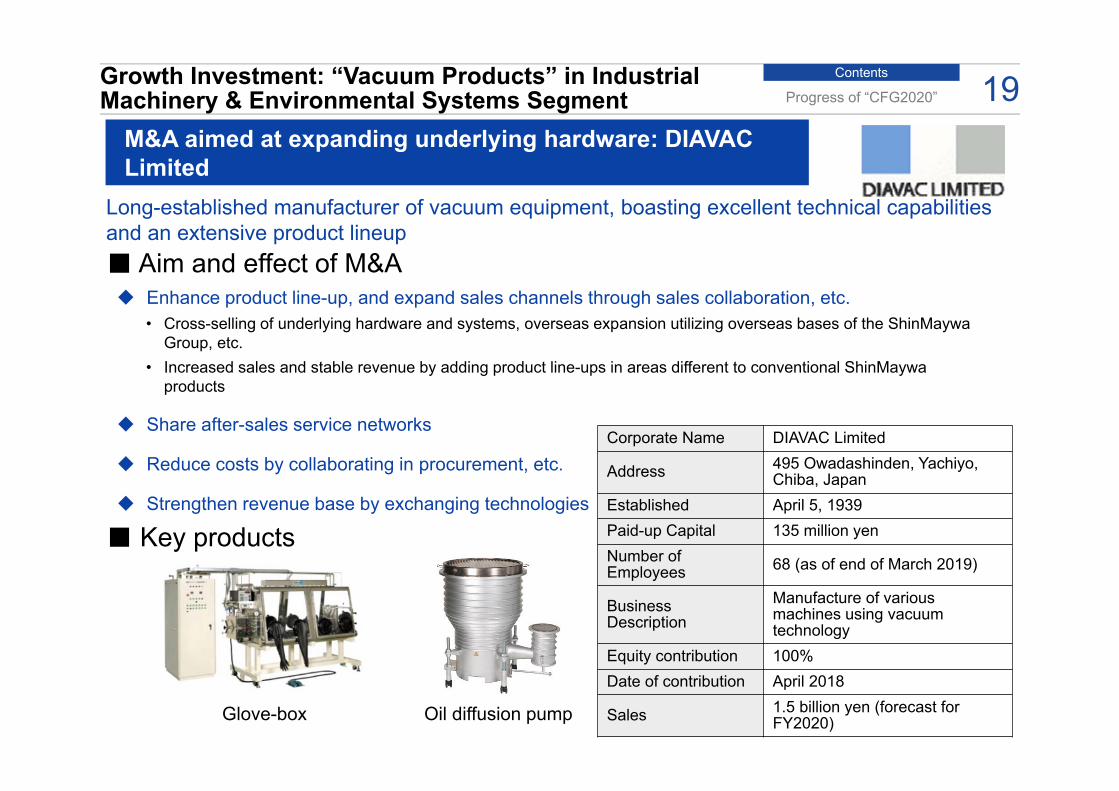
M&A aimed at expanding underlying hardware: DIAVAC Limited
■ Aim and effect of M&A
Long-established manufacturer of vacuum equipment, boasting excellent technical capabilities and an extensive product lineup
Corporate Name DIAVAC Limited
Address 495 Owadashinden, Yachiyo, Chiba, Japan
Established April 5, 1939Paid-up Capital 135 million yenNumber of Employees 68 (as of end of March 2019)
Business Description
Manufacture of various machines using vacuum technology
Equity contribution 100%Date of contribution April 2018
Sales 1.5 billion yen (forecast for FY2020)
■ Key products
Glove-box Oil diffusion pump
Enhance product line-up, and expand sales channels through sales collaboration, etc.• Cross-selling of underlying hardware and systems, overseas expansion utilizing overseas bases of the ShinMaywa
Group, etc. • Increased sales and stable revenue by adding product line-ups in areas different to conventional ShinMaywa
products
Share after-sales service networks
Reduce costs by collaborating in procurement, etc.
Strengthen revenue base by exchanging technologies
Contents
20Progress of “CFG2020”Growth Investment: “Vacuum Products” in Industrial Machinery & Environmental Systems Segment
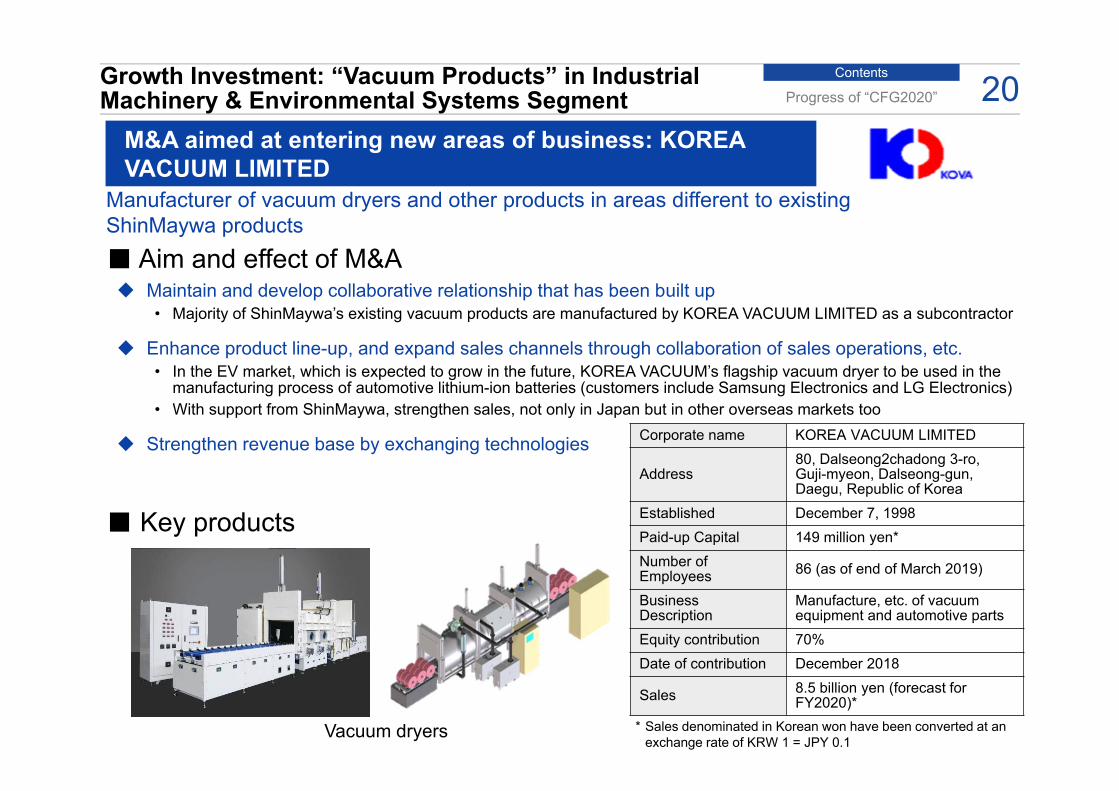
M&A aimed at entering new areas of business: KOREA VACUUM LIMITED
Corporate name KOREA VACUUM LIMITED
Address80, Dalseong2chadong 3-ro, Guji-myeon, Dalseong-gun, Daegu, Republic of Korea
Established December 7, 1998Paid-up Capital 149 million yen*Number of Employees 86 (as of end of March 2019)
Business Description
Manufacture, etc. of vacuum equipment and automotive parts
Equity contribution 70%Date of contribution December 2018
Sales 8.5 billion yen (forecast for FY2020)*
* Sales denominated in Korean won have been converted at an exchange rate of KRW 1 = JPY 0.1
Manufacturer of vacuum dryers and other products in areas different to existing ShinMaywa products
Maintain and develop collaborative relationship that has been built up• Majority of ShinMaywa’s existing vacuum products are manufactured by KOREA VACUUM LIMITED as a subcontractor
Enhance product line-up, and expand sales channels through collaboration of sales operations, etc.• In the EV market, which is expected to grow in the future, KOREA VACUUM’s flagship vacuum dryer to be used in the
manufacturing process of automotive lithium-ion batteries (customers include Samsung Electronics and LG Electronics)• With support from ShinMaywa, strengthen sales, not only in Japan but in other overseas markets too
Strengthen revenue base by exchanging technologies
■ Aim and effect of M&A
■ Key products
Vacuum dryers
Contents
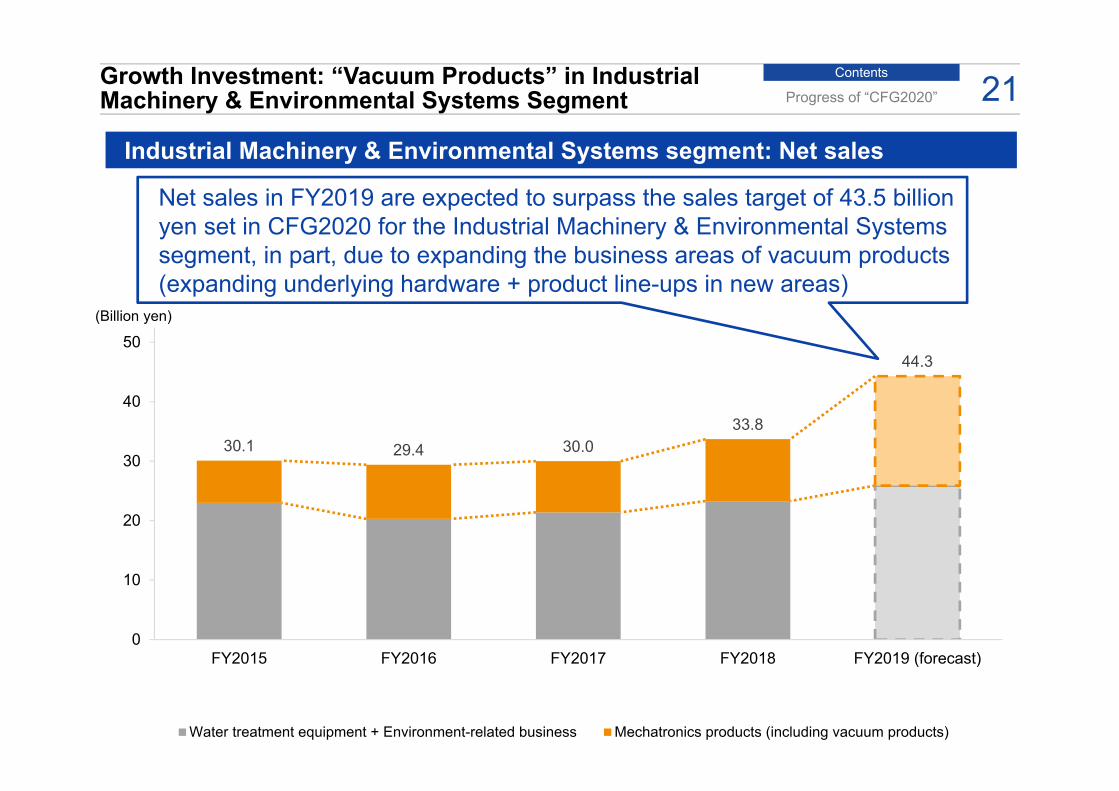
30.1 29.4 30.033.8
44.3
0
10
20
30
40
50
FY2015 FY2016 FY2017 FY2018 FY2019 (forecast)
Water treatment equipment + Environment-related business Mechatronics products (including vacuum products)
(Billion yen)
21Progress of “CFG2020”Growth Investment: “Vacuum Products” in Industrial Machinery & Environmental Systems Segment
Industrial Machinery & Environmental Systems segment: Net sales
Net sales in FY2019 are expected to surpass the sales target of 43.5 billion yen set in CFG2020 for the Industrial Machinery & Environmental Systems segment, in part, due to expanding the business areas of vacuum products (expanding underlying hardware + product line-ups in new areas)
Supplementary Materials
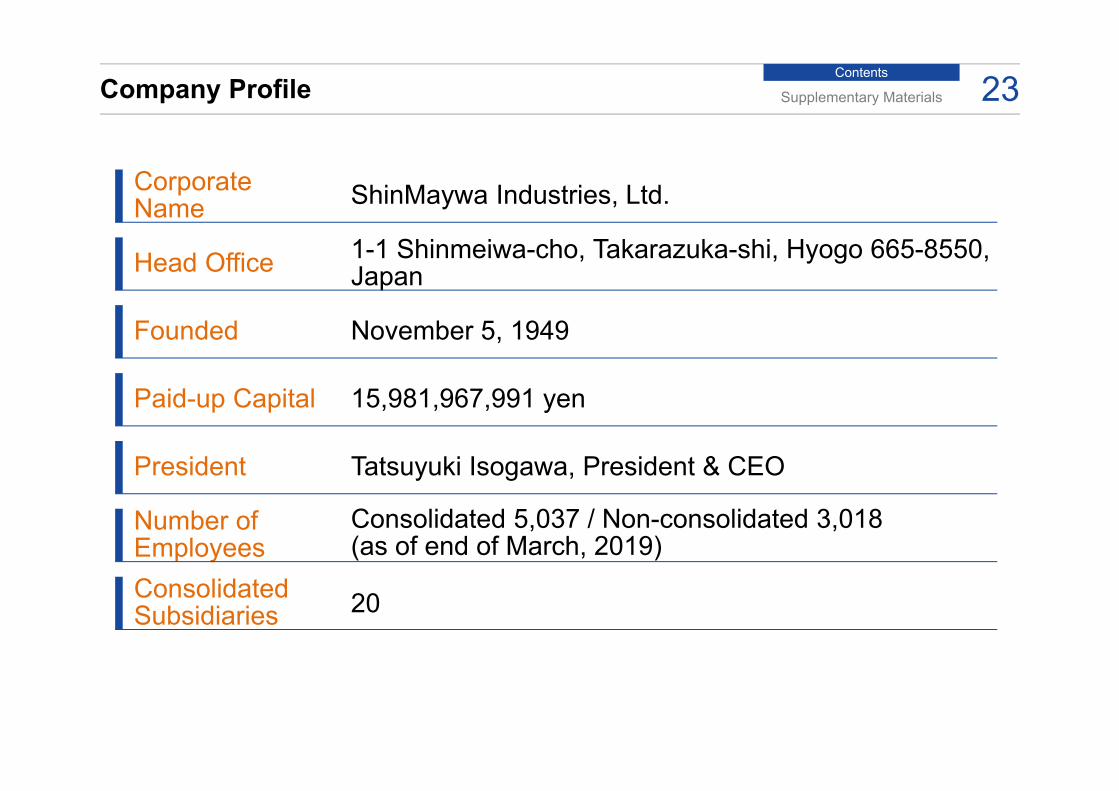
ContentsCompany Profile Supplementary Materials 23
Corporate Name ShinMaywa Industries, Ltd.
Head Office 1-1 Shinmeiwa-cho, Takarazuka-shi, Hyogo 665-8550, Japan
Founded November 5, 1949
Paid-up Capital 15,981,967,991 yen
President Tatsuyuki Isogawa, President & CEO
Number of Employees
Consolidated 5,037 / Non-consolidated 3,018(as of end of March, 2019)
Consolidated Subsidiaries 20
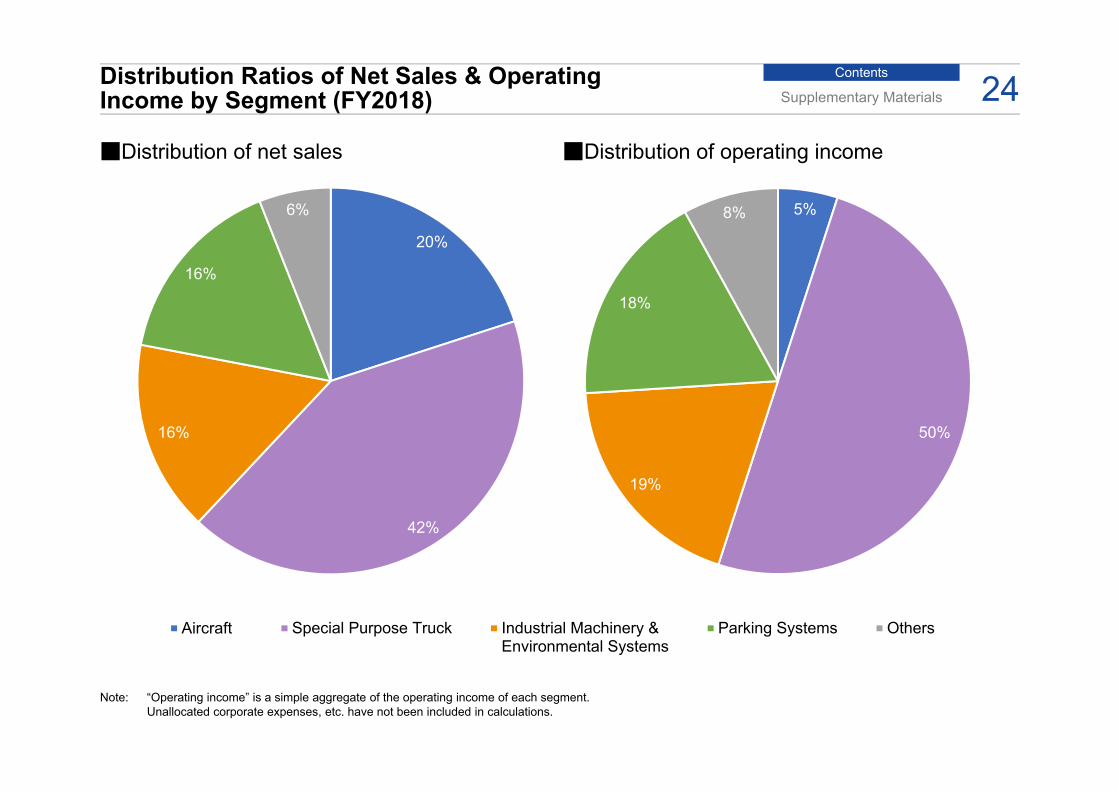
ContentsDistribution Ratios of Net Sales & Operating Income by Segment (FY2018) Supplementary Materials 24
20%
42%
16%
16%
6%
Aircraft Special Purpose Truck Industrial Machinery &Environmental Systems
Parking Systems Others
■Distribution of net sales ■Distribution of operating income
5%
50%
19%
18%
8%
Note: “Operating income” is a simple aggregate of the operating income of each segment. Unallocated corporate expenses, etc. have not been included in calculations.
Contents
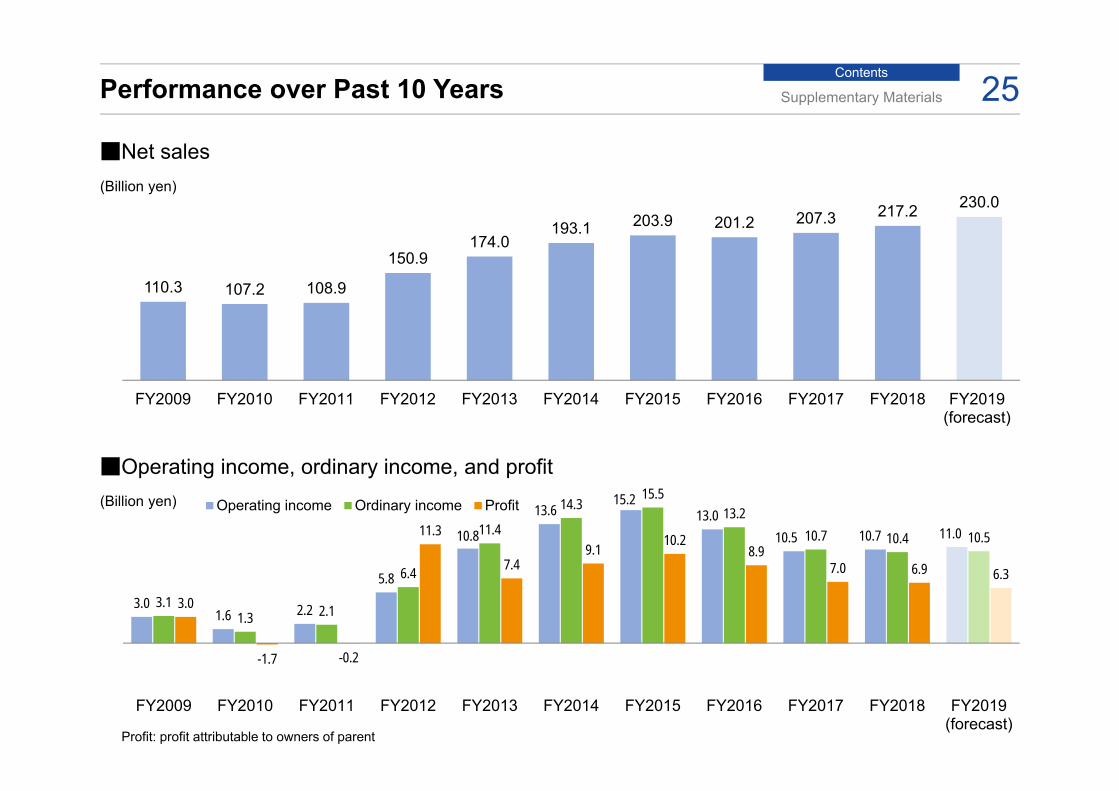
110.3 107.2 108.9
150.9174.0
193.1 203.9 201.2 207.3 217.2 230.0
FY2009 FY2010 FY2011 FY2012 FY2013 FY2014 FY2015 FY2016 FY2017 FY2018 FY2019(forecast)
3.01.6 2.2
5.8
10.8
13.615.2
13.010.5 10.7 11.0
3.11.3 2.1
6.4
11.4
14.315.5
13.210.7 10.4 10.5
3.0
-1.7 -0.2
11.3
7.49.1 10.2
8.97.0 6.9 6.3
FY2009 FY2010 FY2011 FY2012 FY2013 FY2014 FY2015 FY2016 FY2017 FY2018 FY2019(forecast)
Operating income Ordinary income Profit
Performance over Past 10 Years Supplementary Materials 25■Net sales
■Operating income, ordinary income, and profit
(Billion yen)
(Billion yen)
Profit: profit attributable to owners of parent
Contents
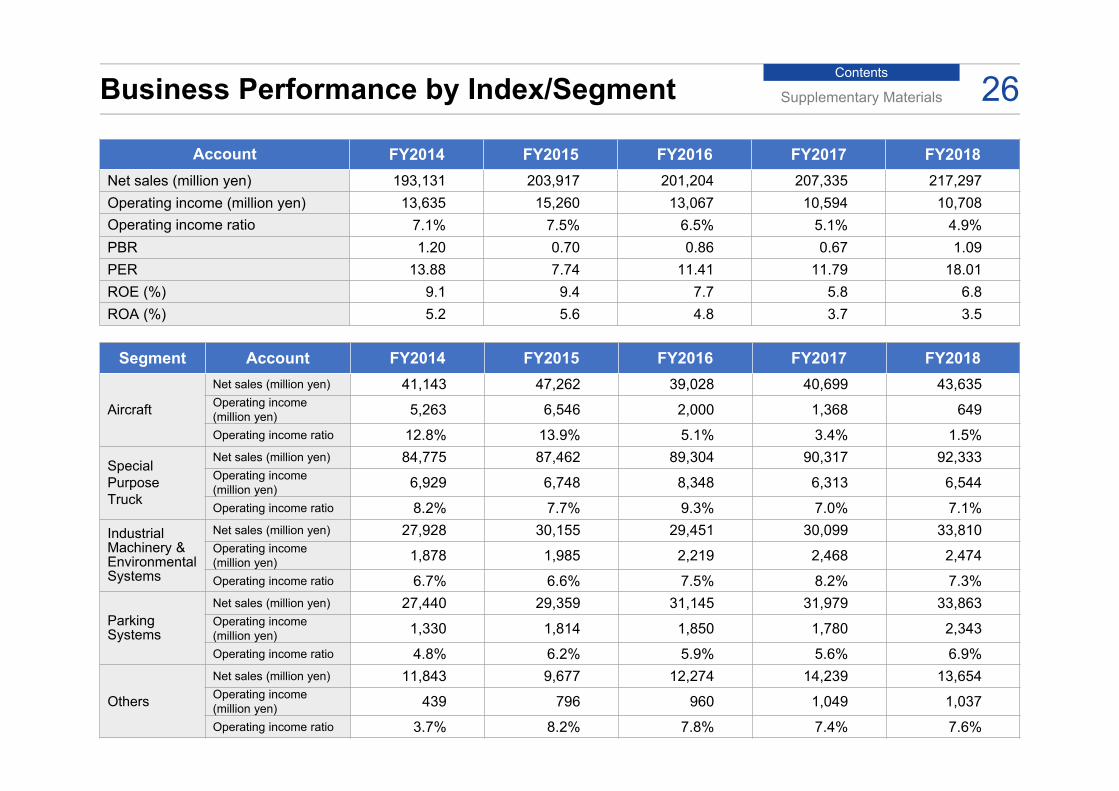
Account FY2014 FY2015 FY2016 FY2017 FY2018 Net sales (million yen) 193,131 203,917 201,204 207,335 217,297Operating income (million yen) 13,635 15,260 13,067 10,594 10,708Operating income ratio 7.1% 7.5% 6.5% 5.1% 4.9%PBR 1.20 0.70 0.86 0.67 1.09PER 13.88 7.74 11.41 11.79 18.01ROE (%) 9.1 9.4 7.7 5.8 6.8ROA (%) 5.2 5.6 4.8 3.7 3.5
Segment Account FY2014 FY2015 FY2016 FY2017 FY2018
Aircraft
Net sales (million yen) 41,143 47,262 39,028 40,699 43,635Operating income (million yen) 5,263 6,546 2,000 1,368 649Operating income ratio 12.8% 13.9% 5.1% 3.4% 1.5%
Special Purpose Truck
Net sales (million yen) 84,775 87,462 89,304 90,317 92,333Operating income (million yen) 6,929 6,748 8,348 6,313 6,544Operating income ratio 8.2% 7.7% 9.3% 7.0% 7.1%
Industrial Machinery & Environmental Systems
Net sales (million yen) 27,928 30,155 29,451 30,099 33,810Operating income (million yen) 1,878 1,985 2,219 2,468 2,474Operating income ratio 6.7% 6.6% 7.5% 8.2% 7.3%
Parking Systems
Net sales (million yen) 27,440 29,359 31,145 31,979 33,863Operating income (million yen) 1,330 1,814 1,850 1,780 2,343Operating income ratio 4.8% 6.2% 5.9% 5.6% 6.9%
Others
Net sales (million yen) 11,843 9,677 12,274 14,239 13,654Operating income (million yen) 439 796 960 1,049 1,037Operating income ratio 3.7% 8.2% 7.8% 7.4% 7.6%
Business Performance by Index/Segment Supplementary Materials 26
Contents
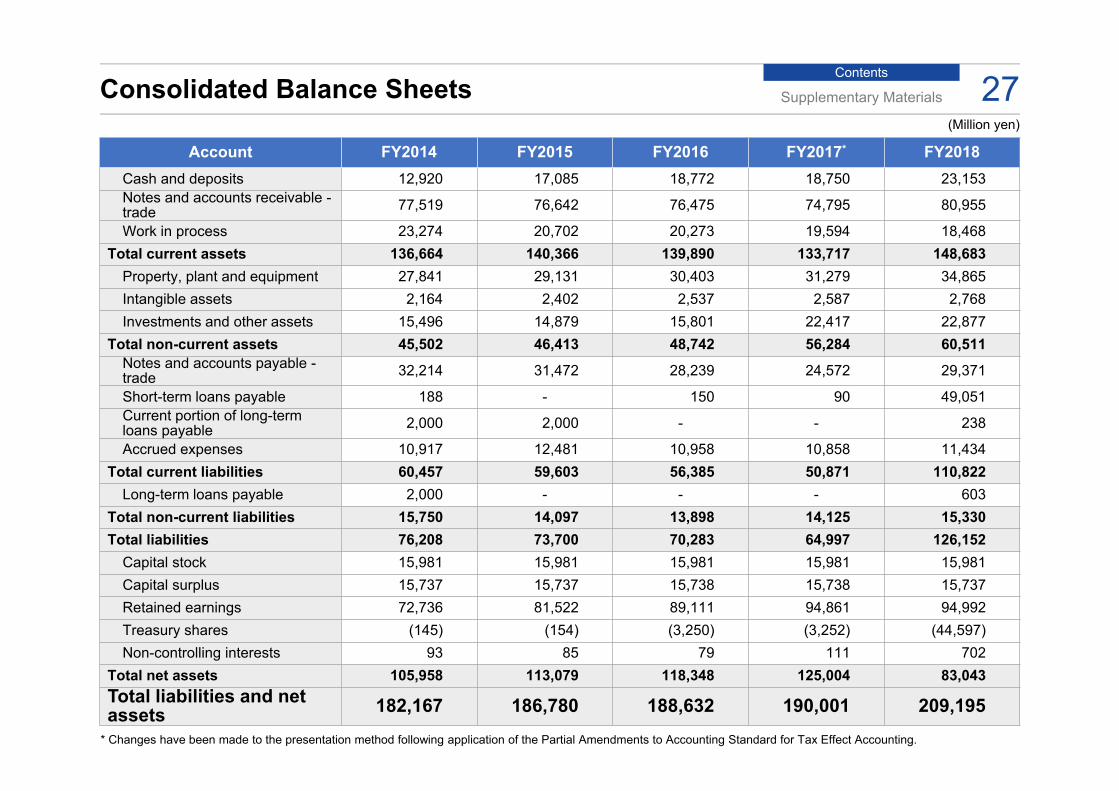
Account FY2014 FY2015 FY2016 FY2017* FY2018 Cash and deposits 12,920 17,085 18,772 18,750 23,153Notes and accounts receivable -trade 77,519 76,642 76,475 74,795 80,955
Work in process 23,274 20,702 20,273 19,594 18,468Total current assets 136,664 140,366 139,890 133,717 148,683
Property, plant and equipment 27,841 29,131 30,403 31,279 34,865Intangible assets 2,164 2,402 2,537 2,587 2,768Investments and other assets 15,496 14,879 15,801 22,417 22,877
Total non-current assets 45,502 46,413 48,742 56,284 60,511Notes and accounts payable -trade 32,214 31,472 28,239 24,572 29,371
Short-term loans payable 188 - 150 90 49,051Current portion of long-term loans payable 2,000 2,000 - - 238
Accrued expenses 10,917 12,481 10,958 10,858 11,434Total current liabilities 60,457 59,603 56,385 50,871 110,822
Long-term loans payable 2,000 - - - 603Total non-current liabilities 15,750 14,097 13,898 14,125 15,330Total liabilities 76,208 73,700 70,283 64,997 126,152
Capital stock 15,981 15,981 15,981 15,981 15,981Capital surplus 15,737 15,737 15,738 15,738 15,737Retained earnings 72,736 81,522 89,111 94,861 94,992Treasury shares (145) (154) (3,250) (3,252) (44,597)Non-controlling interests 93 85 79 111 702
Total net assets 105,958 113,079 118,348 125,004 83,043Total liabilities and net assets 182,167 186,780 188,632 190,001 209,195
(Million yen)
Consolidated Balance Sheets Supplementary Materials 27
* Changes have been made to the presentation method following application of the Partial Amendments to Accounting Standard for Tax Effect Accounting.
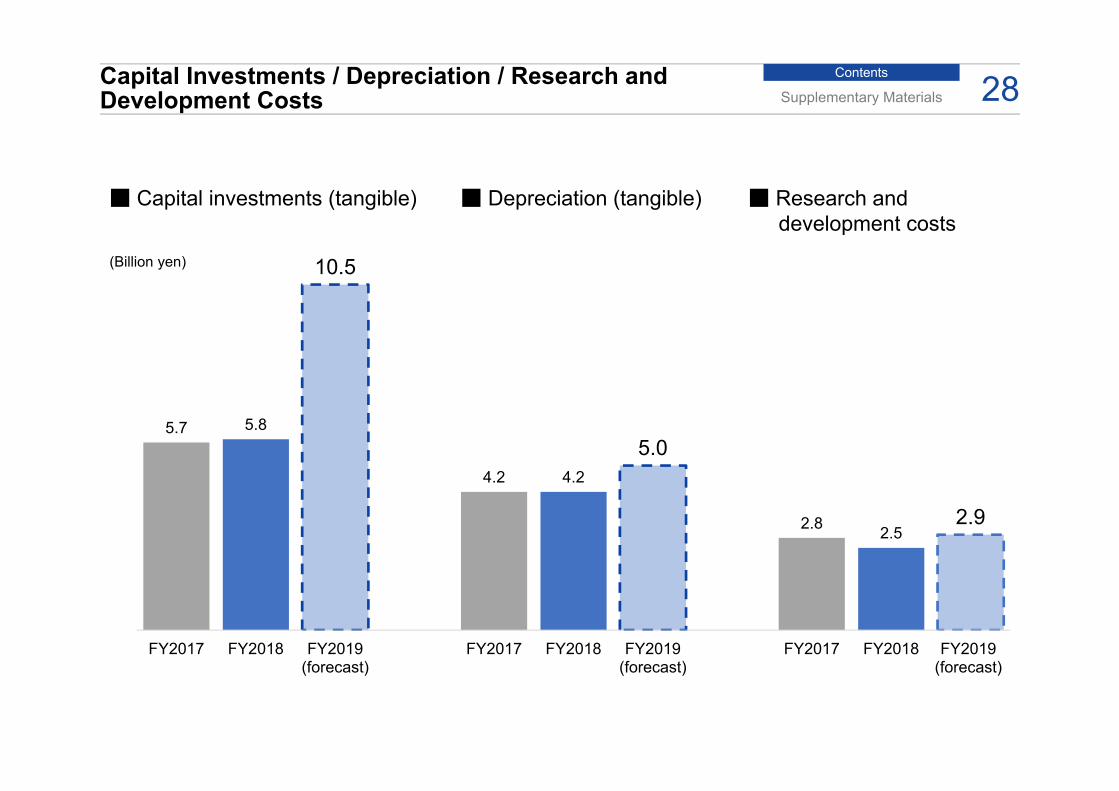
ContentsCapital Investments / Depreciation / Research and Development Costs Supplementary Materials 28
5.7 5.8
10.5
4.2 4.2
5.0
2.8 2.52.9
FY2017 FY2018 FY2019(forecast)
FY2017 FY2018 FY2019(forecast)
FY2017 FY2018 FY2019(forecast)
(Billion yen)
■ Capital investments (tangible) ■ Depreciation (tangible) ■ Research and development costs

Contents“CFG2020” Business Performance Targets, by Segment 29
SegmentNet sales Operating income
FY2019(forecast)
FY2020(target) Change FY2019
(forecast) FY2020(target) Change
Aircraft 40.3 41.0 +0.7 1.6 3.2 +1.5
Special Purpose Truck 91.2 86.5 -4.7 6.0 5.0 -1.0Industrial Machinery & Environmental Systems
44.3 43.5 -0.8 2.9 3.7 +0.7
Parking Systems 38.5 44.0 +5.5 2.3 3.2 +0.8
Others* 15.7 15.0 -0.7 1.0 1.3 +0.3
Unallocated corporate expenses - - - -2.9 -2.4 +0.5
Total 230.0 230.0 - 11.0 14.0 +3.0
* “Others” comprises business segments not included in the reportable segments, such as construction, real estate, and software.
(Billion yen)
Supplementary Materials
Disclaimer
This document may contain statements about the future or other information aside from historical facts regarding ShinMaywaIndustries, Ltd. (hereinafter referred to as the “Company”) or its group companies (hereinafter referred to as the “Group”), such asoutlooks, policies, management strategies, targets, plans and recognition or evaluation of facts (hereinafter referred to as “forward-looking information”). Furthermore, management of the Company may also remark on forward-looking information. Statements onforward-looking information are made entirely on the basis of projections of the Company as of the date of this document (or thedate otherwise specified herein), based on information obtained by the Company. In addition, apart from historical facts, certainassumptions have been made when formulating outlooks, targets and so on. By their nature, there is no guarantee that thesestatements, or facts or assumptions, are objectively accurate, nor is there any guarantee that they will come to pass in the futureas presented.
Accordingly, it should be noted that forward-looking information needs to be considered in conjunction with uncertainties and riskfactors. Reference should also be made to the numerous important risk factors that could have a significant negative impact on theCompany’s actual business operations and results, additional information on which is described in detail in the Company’squarterly financial results, annual securities report, annual report and various other documents disclosed by the Company.
Furthermore, as described above, statements on forward-looking information contained in this document are as of the date of thisdocument (or the date otherwise specified herein). It should be noted that, even if there have been changes to the forward-lookinginformation due to circumstances arising after the date on which this document is prepared, the Company is under no obligation tocontinually update this information to the latest information.
In addition, information and opinions contained in this document, which relate to enterprises other than the Company or the Group,are quoted from disclosed information, etc. The Company has not verified, nor does it guarantee, the accuracy or propriety of suchinformation. It should also be noted that the Company cannot be held liable for any damages, etc. arising from errors or omissionsin data and expressions, etc. used in this document or from the use of this information.
This document has not been prepared for the purpose of soliciting investment in securities issued by the Company. Any decisionsregarding investment should be made at the discretion of each investor.
ShinMaywa Industries, Ltd.
30