presentation on digital elevation model · slope data: james r.f. barringer & linda lilburne,...
TRANSCRIPT
Dr. Pratibha Shingare/ Mr. Sumit Kale
College of Engineering Pune
Maharashtra, India
nrsc/I
SRO

This Research work is Sponsored
by
Indian Space Research Organization
&
Supported by
Technical Education Quality
Improvement Program (TEQIP)
nrsc/I
SRO
INTRODUCTIONDigital elevation model is a numerical data file that contains
the elevation of the topography over a specified area, usually at
a fixed grid interval over the surface of the earth.
DEM is used as a tool to represent the earth’s surface in many
applications such as hydrological modeling, precision
agriculture, civil engineering, large-scale mapping &
telecommunication.nrsc/I
SRO

DEM CREATION
I. Conversion of contour lines.
II. Photogrammetry.
III. Radar Stereo.
IV. Radar Inferometry.
V. Laser Altimetry.
nrsc/I
SRO
Photogrammetry Manually: an operator looks at a pair of stereophotos
through a stereoplotter and must move two dots togetheruntil they appear to be one lying just at the surface of theground
Automatically: an instrument calculates the parallaxdisplacement of a large number of points (e.g. for USGS7.5 minute quadrangles, the Gestalt Photo Mapper IIcorrelates 500,000 points)
Correction of elevation from photographs: water bodiesare assumed to be flat
nrsc/I
SRO

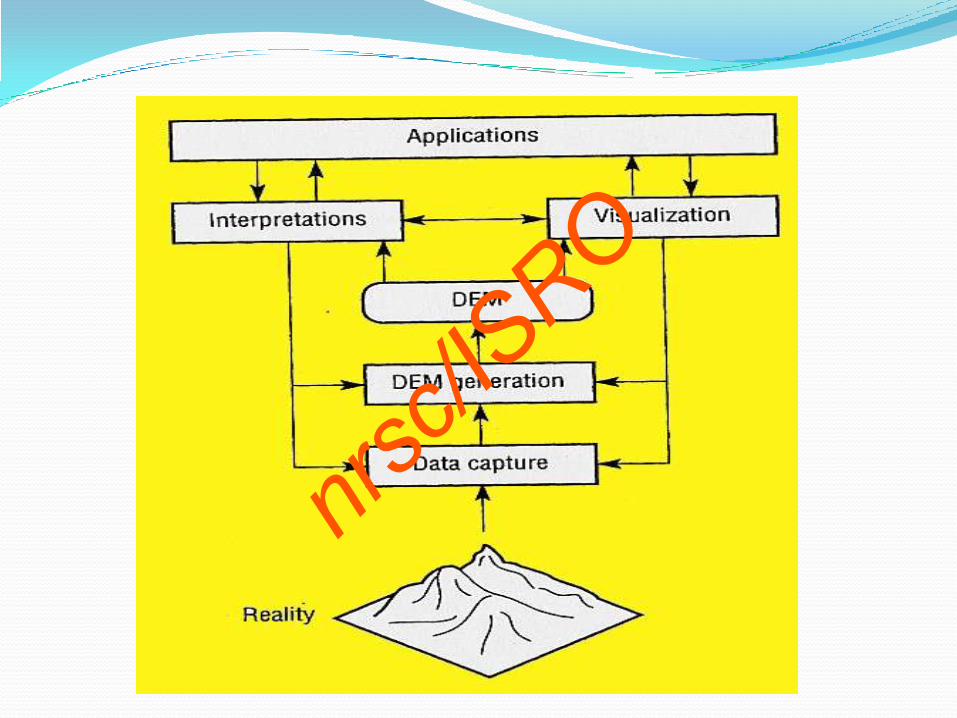
WORKFLOW FOR DEM GENERATION
1. Selection of Stereo Pair of Image.
2. Selection of RPCs.
3. Selection of Ground Control points (GCP).
4. Selection of Tie Points.
5. Generation of Epipolar Images.
6. DEM Generation.nrsc/I
SRO
nrsc/I
SRO
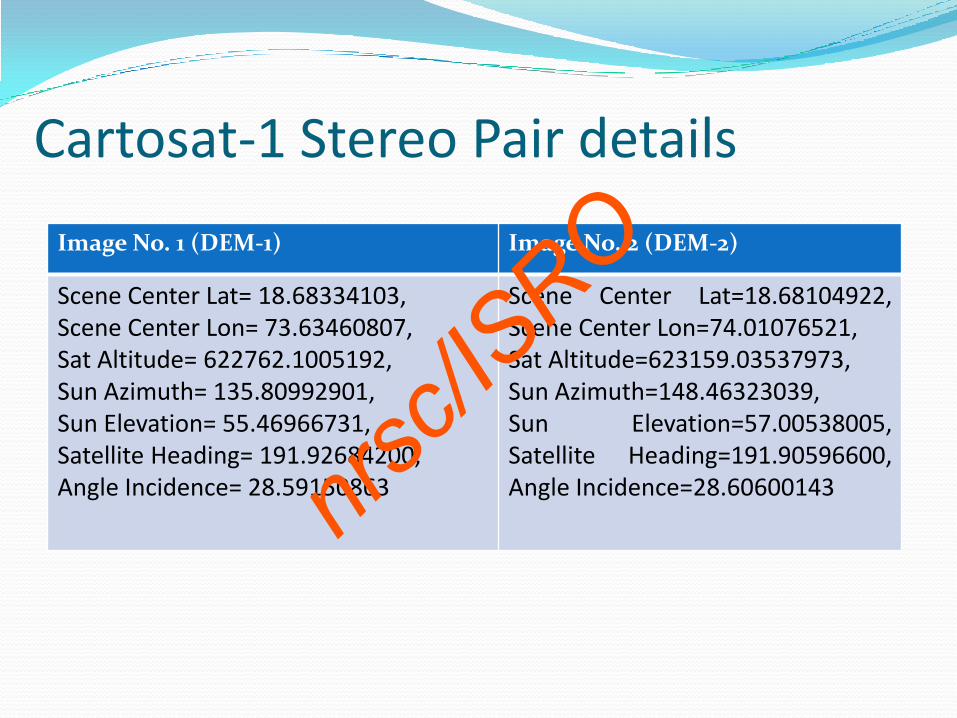
Cartosat-1 Stereo Pair details
Image No. 1 (DEM-1) Image No. 2 (DEM-2)
Scene Center Lat= 18.68334103,Scene Center Lon= 73.63460807,Sat Altitude= 622762.1005192,Sun Azimuth= 135.80992901,Sun Elevation= 55.46966731,Satellite Heading= 191.92684200,Angle Incidence= 28.59150863
Scene Center Lat=18.68104922,Scene Center Lon=74.01076521,Sat Altitude=623159.03537973,Sun Azimuth=148.46323039,Sun Elevation=57.00538005,Satellite Heading=191.90596600,Angle Incidence=28.60600143nrs
c/ISRO
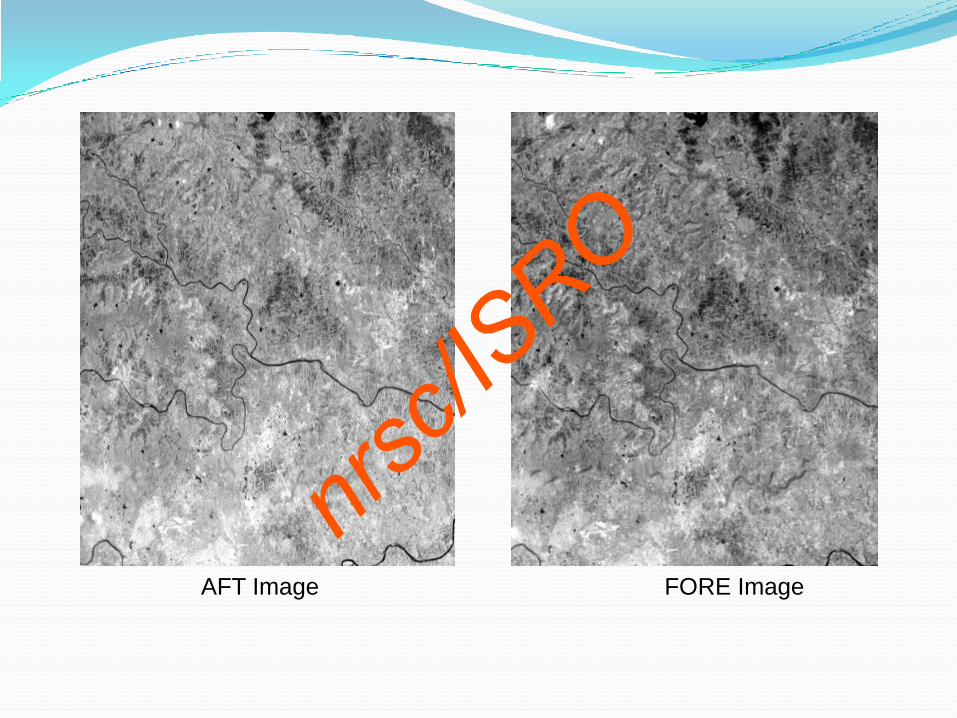
AFT Image FORE Image
nrsc/I
SRO

Tie Point & RPC Selection Tie points are pairs of pixels corresponding to the
same locations where images overlap.
They are an integral part of the bundle adjustment and contribute to most of the relative accuracy in the Ortho rectified product.
nrsc/I
SRO
Epipolar Image Generation Epipolar images are stereo pairs in which the left and
right images are oriented in such a way that groundfeature points have the same y-coordinates on bothimages.
Using epipolar images removes one dimension ofvariability, thus greatly increasing the speed of image-matching processing as well as the reliability of thematching results.nrs
c/ISRO

RESULT
DEM-1 DEM-2
nrsc/I
SRO
Quality of DEM data
• Quality of DEM data depends upon:-
– Terrain roughness
– Data Capturing Source (Ex.- Satellite)
– Sampling density (elevation data collection method)
– Grid resolution or pixel size
– Interpolation algorithm
– Vertical resolution nrsc/I
SRO
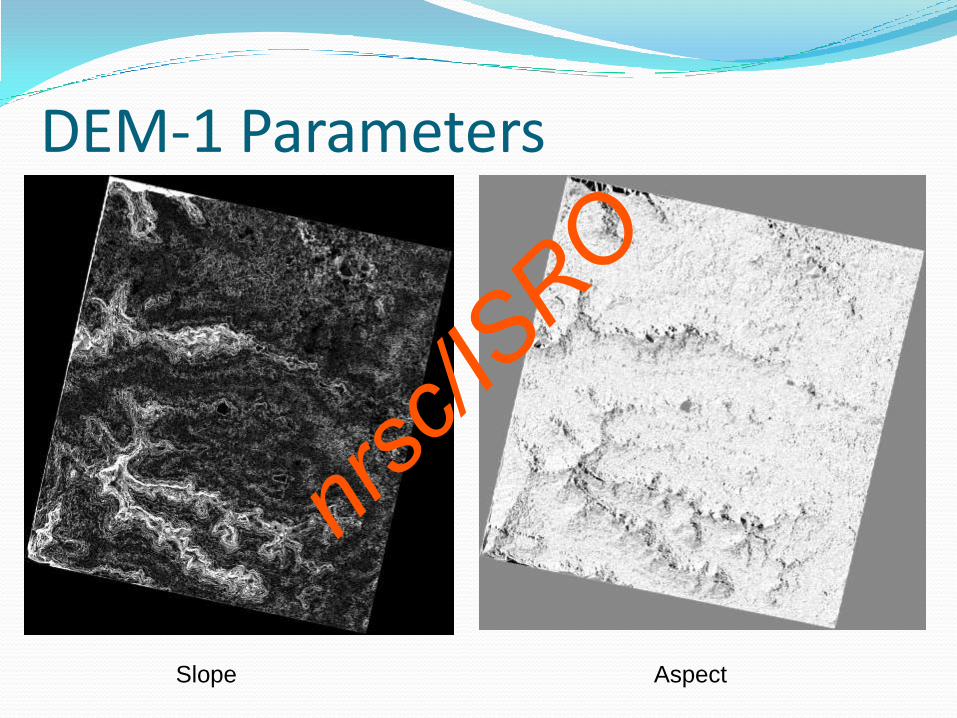
DEM-1 Parameters
Slope Aspect
nrsc/I
SRO

DEM-2 Parameters
Slope Aspect
nrsc/I
SRO
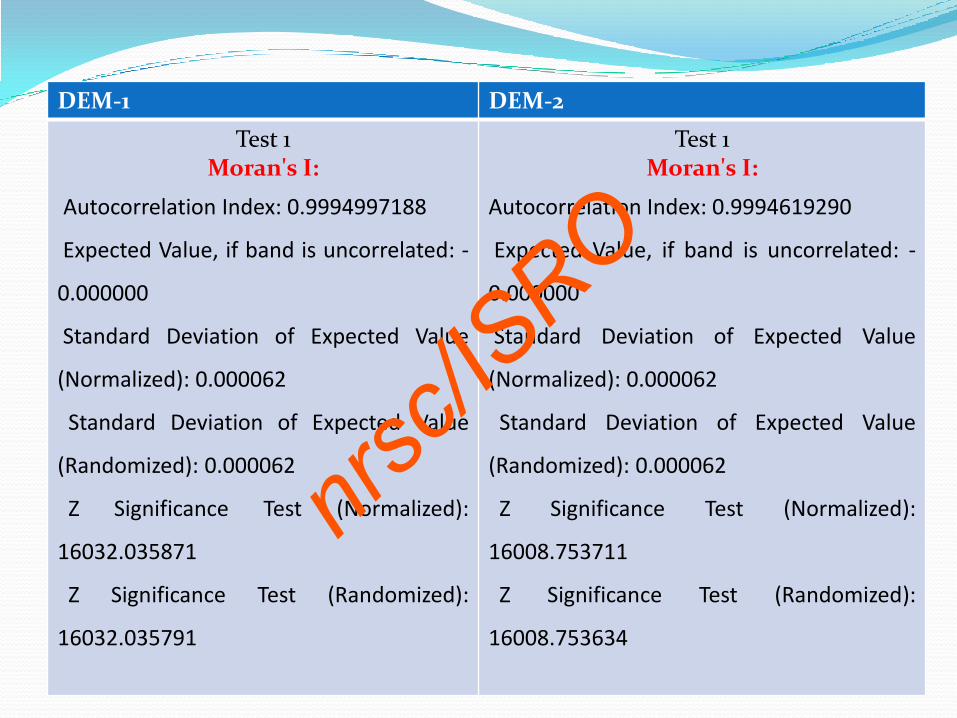
DEM-1 DEM-2
Test 1Moran's I:
Autocorrelation Index: 0.9994997188
Expected Value, if band is uncorrelated: -
0.000000
Standard Deviation of Expected Value
(Normalized): 0.000062
Standard Deviation of Expected Value
(Randomized): 0.000062
Z Significance Test (Normalized):
16032.035871
Z Significance Test (Randomized):
16032.035791
Test 1Moran's I:
Autocorrelation Index: 0.9994619290
Expected Value, if band is uncorrelated: -
0.000000
Standard Deviation of Expected Value
(Normalized): 0.000062
Standard Deviation of Expected Value
(Randomized): 0.000062
Z Significance Test (Normalized):
16008.753711
Z Significance Test (Randomized):
16008.753634
nrsc/I
SRO
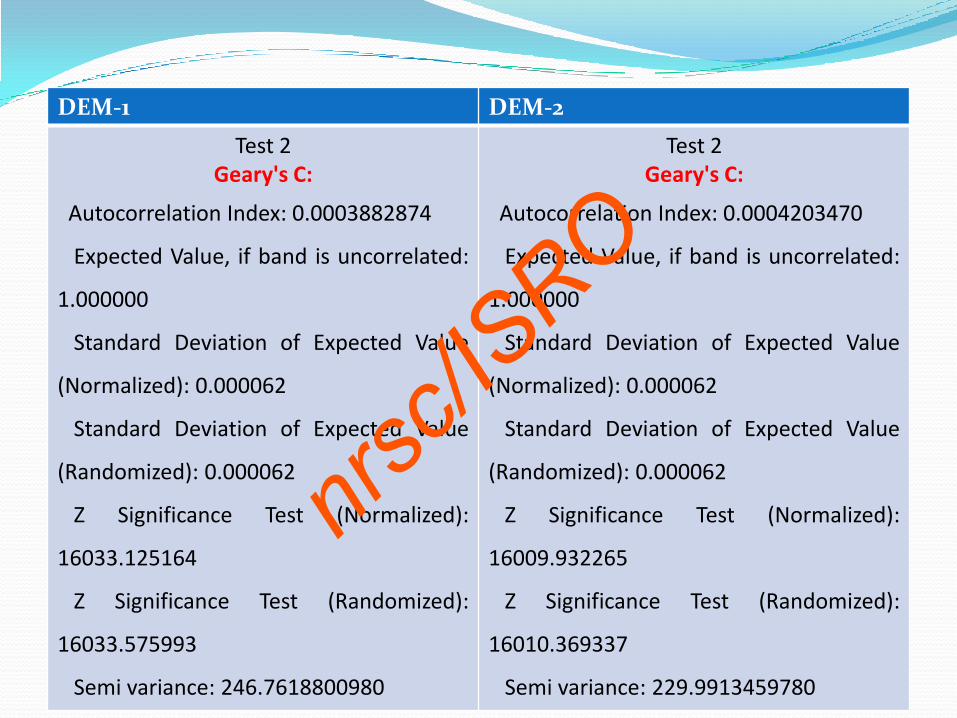
DEM-1 DEM-2
Test 2Geary's C:
Autocorrelation Index: 0.0003882874
Expected Value, if band is uncorrelated:
1.000000
Standard Deviation of Expected Value
(Normalized): 0.000062
Standard Deviation of Expected Value
(Randomized): 0.000062
Z Significance Test (Normalized):
16033.125164
Z Significance Test (Randomized):
16033.575993
Semi variance: 246.7618800980
Test 2Geary's C:
Autocorrelation Index: 0.0004203470
Expected Value, if band is uncorrelated:
1.000000
Standard Deviation of Expected Value
(Normalized): 0.000062
Standard Deviation of Expected Value
(Randomized): 0.000062
Z Significance Test (Normalized):
16009.932265
Z Significance Test (Randomized):
16010.369337
Semi variance: 229.9913459780
nrsc/I
SRO

From visual Inspection we can sense that DEM-1 have
more hilly areas as compared to DEM-2. Thought we
plotted DEM for same region it shows variations in the
result due to slight change in coordinates & date of pass of
satellite.
Bright spots in both DEMs shows hilly areas.
By analyzing DEM along with Aspect & Slope maps we
can analyze various terrain features like Hills, Rivers,
Valleys, Urbanize areas, Water canopies etc.
ANALYSIS OF EXTRACTED DEM
nrsc/I
SRO
For DEM-1 , Maximum Y parallax error value was 2.3145
while for DEM-2 it was 4.2341. So for DEM-1 it shows
perfect match if tie points as compared to DEM-2.
The maximum permissible Y parallax error in DEM
creation is 10 Pixels. As this error reduces the accuracy of
tie point matching & DEM also increases.
In proposed research work, the DEM produced from
Cartosat-1 comes under category of Relative DEM i. e
DEM without GCPs.nrsc/I
SRO

Test 1 Details:-
Moran’s I value used for determination of spatial
autocorrelation (feature similarity) based on both feature
locations and feature values simultaneously.
In both DEM-1 & DEM-2 it illustrates Clustering of
Patterns. Values near +1 indicates Clustering while near -1
indicates Dispersion of Patterns.
nrsc/I
SRO
Test 2 Details:-
Geary’s C values indicate spatial autocorrelation.
Positive spatial autocorrelation is found with values
ranging from 0 to 1 and negative spatial autocorrelation is
found between 1 and 2.
In both DEM-1 & DEM-2 it shows Positive
Autocorrelation. nrsc/I
SRO
Quality of input data from which the DEM is generated
(stereo pair satellite image in our case) has more
significant effect on DEM accuracy than algorithms used
under Interpolation.
Nearest neighbor method should be used when the data
values cannot be changed, for example, with categorical
data or qualitative data such as soils types.nrsc/I
SRO
Conclusion The proposed research deals with analysis of Relative
DEM generated from Cartosat-1. For more accurate &
smooth DEM, accurate lay out of ground control points
are necessary.
Perfect match of tie points while generating automatic
DEM produce more smooth & accurate DEM.
Maximum Y Parallax Error value should be lie very close
to 0. It shows perfect match of two stereo pair images
while generating DEM.
nrsc/I
SRO
While evaluating accuracy of generated DEM we got
slight difference between generated DEM & reference
source (Toposheet of Pune Area). The difference between
two elevation value comes approximately 5 meters. For
better result & higher Horizontal as well as vertical
accuracy we need DEM with GCPs.
nrsc/I
SRO
Future Aspect Our future aspect is to fuse DEMs of same area generated
from various sources especially Cartosat-1 & RISAT.
We are going to follow methodology of “Sparse
representation fusion” proposed by Papasaika to do
simple fusion of two cartosat-1 DEMs.
For Multiple DEM Fusion generated from multiple
sources we are going to follow “K means clustering
method” proposed by Colleen E. Fuss.nrsc/I
SRO

DEM Application• Commercial applications.
• Industrial applications.
• Operational applications.
• Military applications.
• Climate impact studies.
Many More………………………nrsc/I
SRO

Research Work Published till date
IEEE Conference EMS 2013 Manchester U.K “An Interpretation of Digital Elevation Model Using Cartosat-1 Image”
IJMER – July 2013 edition
“Review on Digital Elevation Model”
nrsc/I
SRO
Reference Digital Terrain Modeling – Principles and Methodology by Zhilin Li, Qing Zhu, Christopher Gold.
Digital Terrain Modeling- Acquisition, Manipulation and Applications by Naser El-Sheimy, CaterinaValeo and Ayman Habib.
T.Ch. Malleshwara Rao, K.V Rao, A.Ravi Kumar, D.P Rao, B.L Deekshatula- DTM from IRS satellitedata from the overlap area of two adjacent paths using Digital Photogrammetric technique NRSC, PE& RS June 1996.
Tomaz Podobnikar Methods for visual quality assessment of a digital terrain model S.A.P.I.E.N.S2.2 | 2009 : Vol.2.
Federal Geographic Data Committee, 1998: Geospatial Position Accuracy Standards Part 3: NationalStandard for Spatial Data Accuracy, FGDC-STD-007.3-1998. Washington, D. C.: Federal GeographicData Committee.
Joint Research Center, ISPRA, 2008. Guidelines for Best Practice and Quality Checking of OrthoImagery, Issue 3.0, v.20/10/2008.
An Evaluation of Digital Elevation Models for Upgrading New Zealand Land Resource InventorySlope Data: James R.F. Barringer & Linda Lilburne, Presented at the second annual conference ofGeoComputation ‘97 & SIRC ‘97, University of Otago, New Zealand, 26-29 August 1997.
Modelling the Continuity of Surface Form Using Digital Elevation Models by Joseph Wood.
ENVI Exelis Documentation Center- http://www.exelisvis.com/docs
An evaluation of methods to determine slope using digital elevation data by S.D. Warren, M.G.Hohmann , K. Auerswald , H. Mitasova, 7 May 2004.
Methods for visual quality assessment of a digital terrain model by Tomaz Podobnikar, 2.2 Vol. 2/ n02Special issue S.A.P.I.E.N.S 2009
nrsc/I
SRO

nrsc/I
SRO